Zip Codes with the Highest Percentage of Population Employed in Architecture & Engineering in San Antonio, TX
RELATED REPORTS & OPTIONS
Architecture & Engineering
San Antonio
Compare Zip Codes
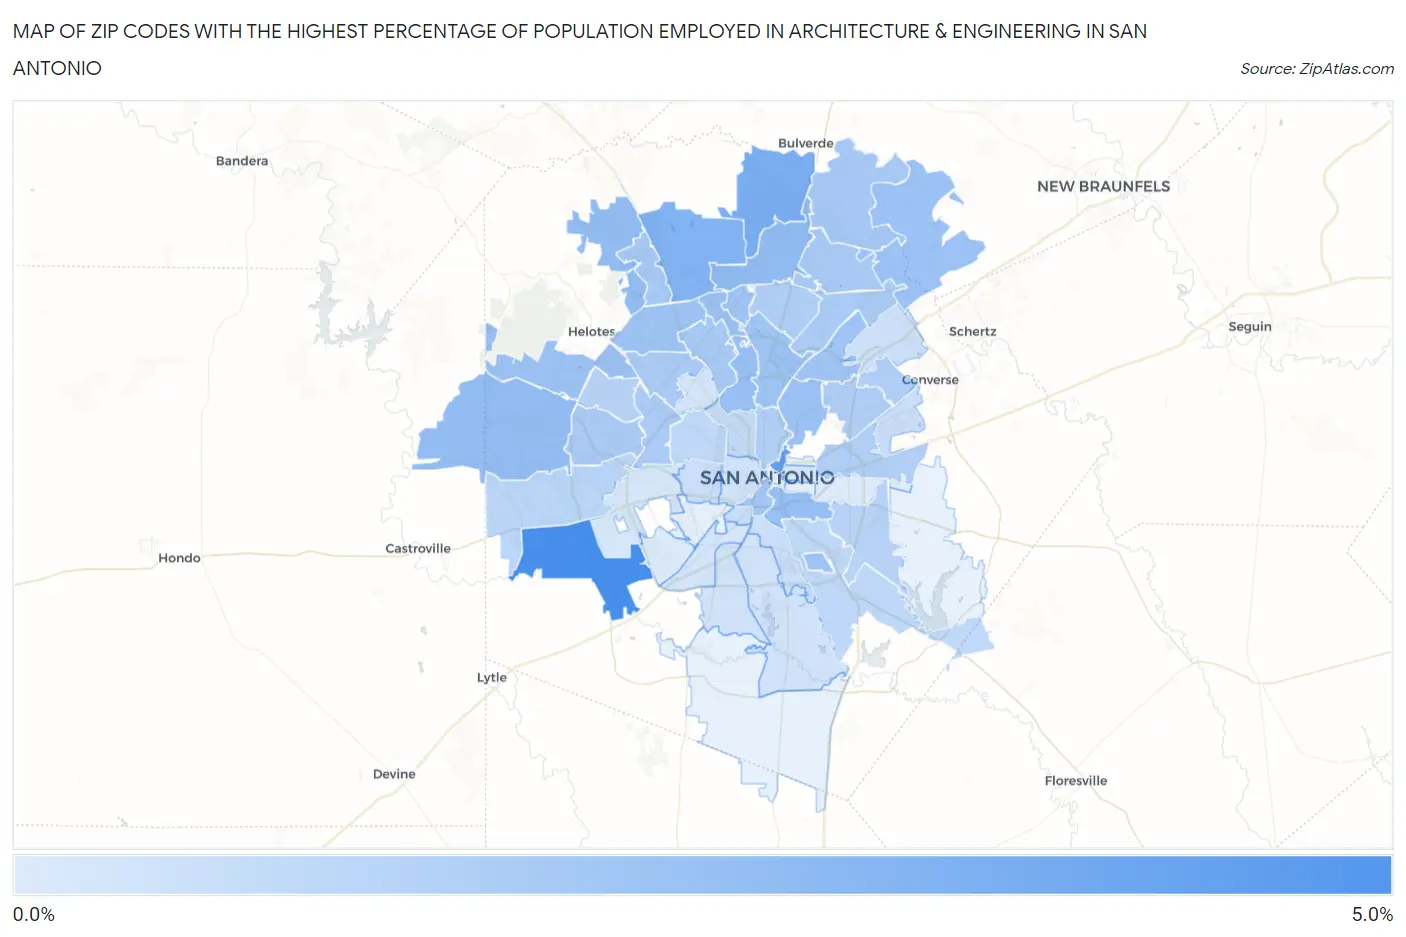
Map of Zip Codes with the Highest Percentage of Population Employed in Architecture & Engineering in San Antonio
0.067%
4.9%
Zip Codes with the Highest Percentage of Population Employed in Architecture & Engineering in San Antonio, TX
| Zip Code | % Employed | vs State | vs National | |
| 1. | 78252 | 4.9% | 2.2%(+2.66)#100 | 2.1%(+2.74)#1,755 |
| 2. | 78215 | 4.0% | 2.2%(+1.74)#151 | 2.1%(+1.82)#2,821 |
| 3. | 78260 | 3.2% | 2.2%(+1.01)#252 | 2.1%(+1.08)#4,372 |
| 4. | 78257 | 3.0% | 2.2%(+0.792)#295 | 2.1%(+0.864)#5,013 |
| 5. | 78258 | 2.5% | 2.2%(+0.275)#381 | 2.1%(+0.348)#7,007 |
| 6. | 78255 | 2.4% | 2.2%(+0.220)#394 | 2.1%(+0.293)#7,265 |
| 7. | 78253 | 2.4% | 2.2%(+0.184)#408 | 2.1%(+0.257)#7,455 |
| 8. | 78210 | 2.3% | 2.2%(+0.072)#429 | 2.1%(+0.145)#7,980 |
| 9. | 78213 | 2.3% | 2.2%(+0.066)#433 | 2.1%(+0.139)#8,010 |
| 10. | 78254 | 2.1% | 2.2%(-0.093)#484 | 2.1%(-0.020)#8,874 |
| 11. | 78266 | 2.1% | 2.2%(-0.113)#491 | 2.1%(-0.040)#8,988 |
| 12. | 78209 | 2.1% | 2.2%(-0.136)#498 | 2.1%(-0.063)#9,124 |
| 13. | 78231 | 2.1% | 2.2%(-0.140)#500 | 2.1%(-0.067)#9,149 |
| 14. | 78249 | 2.1% | 2.2%(-0.169)#510 | 2.1%(-0.096)#9,303 |
| 15. | 78248 | 2.0% | 2.2%(-0.175)#512 | 2.1%(-0.102)#9,329 |
| 16. | 78216 | 2.0% | 2.2%(-0.193)#514 | 2.1%(-0.120)#9,424 |
| 17. | 78235 | 2.0% | 2.2%(-0.206)#519 | 2.1%(-0.133)#9,507 |
| 18. | 78217 | 1.9% | 2.2%(-0.273)#542 | 2.1%(-0.200)#9,921 |
| 19. | 78204 | 1.9% | 2.2%(-0.317)#557 | 2.1%(-0.244)#10,205 |
| 20. | 78261 | 1.8% | 2.2%(-0.431)#589 | 2.1%(-0.358)#10,872 |
| 21. | 78259 | 1.8% | 2.2%(-0.448)#593 | 2.1%(-0.375)#10,980 |
| 22. | 78256 | 1.7% | 2.2%(-0.500)#615 | 2.1%(-0.427)#11,348 |
| 23. | 78230 | 1.7% | 2.2%(-0.507)#620 | 2.1%(-0.434)#11,390 |
| 24. | 78238 | 1.7% | 2.2%(-0.552)#639 | 2.1%(-0.479)#11,693 |
| 25. | 78247 | 1.7% | 2.2%(-0.557)#642 | 2.1%(-0.484)#11,731 |
| 26. | 78251 | 1.6% | 2.2%(-0.582)#653 | 2.1%(-0.510)#11,912 |
| 27. | 78240 | 1.6% | 2.2%(-0.586)#656 | 2.1%(-0.513)#11,934 |
| 28. | 78218 | 1.5% | 2.2%(-0.700)#695 | 2.1%(-0.627)#12,717 |
| 29. | 78232 | 1.5% | 2.2%(-0.706)#701 | 2.1%(-0.633)#12,761 |
| 30. | 78212 | 1.5% | 2.2%(-0.739)#713 | 2.1%(-0.667)#13,010 |
| 31. | 78239 | 1.4% | 2.2%(-0.794)#732 | 2.1%(-0.722)#13,370 |
| 32. | 78219 | 1.4% | 2.2%(-0.800)#737 | 2.1%(-0.727)#13,418 |
| 33. | 78250 | 1.3% | 2.2%(-0.961)#787 | 2.1%(-0.888)#14,595 |
| 34. | 78222 | 1.2% | 2.2%(-1.01)#805 | 2.1%(-0.939)#15,004 |
| 35. | 78245 | 1.2% | 2.2%(-1.05)#820 | 2.1%(-0.974)#15,280 |
| 36. | 78228 | 1.0% | 2.2%(-1.18)#878 | 2.1%(-1.11)#16,312 |
| 37. | 78223 | 1.00% | 2.2%(-1.23)#900 | 2.1%(-1.15)#16,638 |
| 38. | 78201 | 0.82% | 2.2%(-1.40)#975 | 2.1%(-1.33)#17,989 |
| 39. | 78225 | 0.76% | 2.2%(-1.46)#1,000 | 2.1%(-1.38)#18,403 |
| 40. | 78214 | 0.65% | 2.2%(-1.57)#1,064 | 2.1%(-1.50)#19,241 |
| 41. | 78244 | 0.65% | 2.2%(-1.57)#1,065 | 2.1%(-1.50)#19,243 |
| 42. | 78237 | 0.62% | 2.2%(-1.60)#1,080 | 2.1%(-1.52)#19,444 |
| 43. | 78233 | 0.59% | 2.2%(-1.64)#1,093 | 2.1%(-1.56)#19,729 |
| 44. | 78221 | 0.44% | 2.2%(-1.78)#1,151 | 2.1%(-1.70)#20,623 |
| 45. | 78224 | 0.43% | 2.2%(-1.80)#1,163 | 2.1%(-1.72)#20,780 |
| 46. | 78207 | 0.42% | 2.2%(-1.80)#1,165 | 2.1%(-1.73)#20,788 |
| 47. | 78229 | 0.39% | 2.2%(-1.84)#1,190 | 2.1%(-1.76)#21,059 |
| 48. | 78211 | 0.34% | 2.2%(-1.89)#1,212 | 2.1%(-1.81)#21,356 |
| 49. | 78202 | 0.30% | 2.2%(-1.92)#1,221 | 2.1%(-1.85)#21,547 |
| 50. | 78227 | 0.26% | 2.2%(-1.96)#1,239 | 2.1%(-1.89)#21,764 |
| 51. | 78220 | 0.10% | 2.2%(-2.12)#1,285 | 2.1%(-2.05)#22,374 |
| 52. | 78242 | 0.067% | 2.2%(-2.15)#1,289 | 2.1%(-2.08)#22,436 |
1
Common Questions
What are the Top 10 Zip Codes with the Highest Percentage of Population Employed in Architecture & Engineering in San Antonio, TX?
Top 10 Zip Codes with the Highest Percentage of Population Employed in Architecture & Engineering in San Antonio, TX are:
What zip code has the Highest Percentage of Population Employed in Architecture & Engineering in San Antonio, TX?
78252 has the Highest Percentage of Population Employed in Architecture & Engineering in San Antonio, TX with 4.9%.
What is the Percentage of Population Employed in Architecture & Engineering in San Antonio, TX?
Percentage of Population Employed in Architecture & Engineering in San Antonio is 1.4%.
What is the Percentage of Population Employed in Architecture & Engineering in Texas?
Percentage of Population Employed in Architecture & Engineering in Texas is 2.2%.
What is the Percentage of Population Employed in Architecture & Engineering in the United States?
Percentage of Population Employed in Architecture & Engineering in the United States is 2.1%.