Zip Codes with the Highest Percentage of Population Employed in Architecture & Engineering in New Braunfels, TX
RELATED REPORTS & OPTIONS
Architecture & Engineering
New Braunfels
Compare Zip Codes
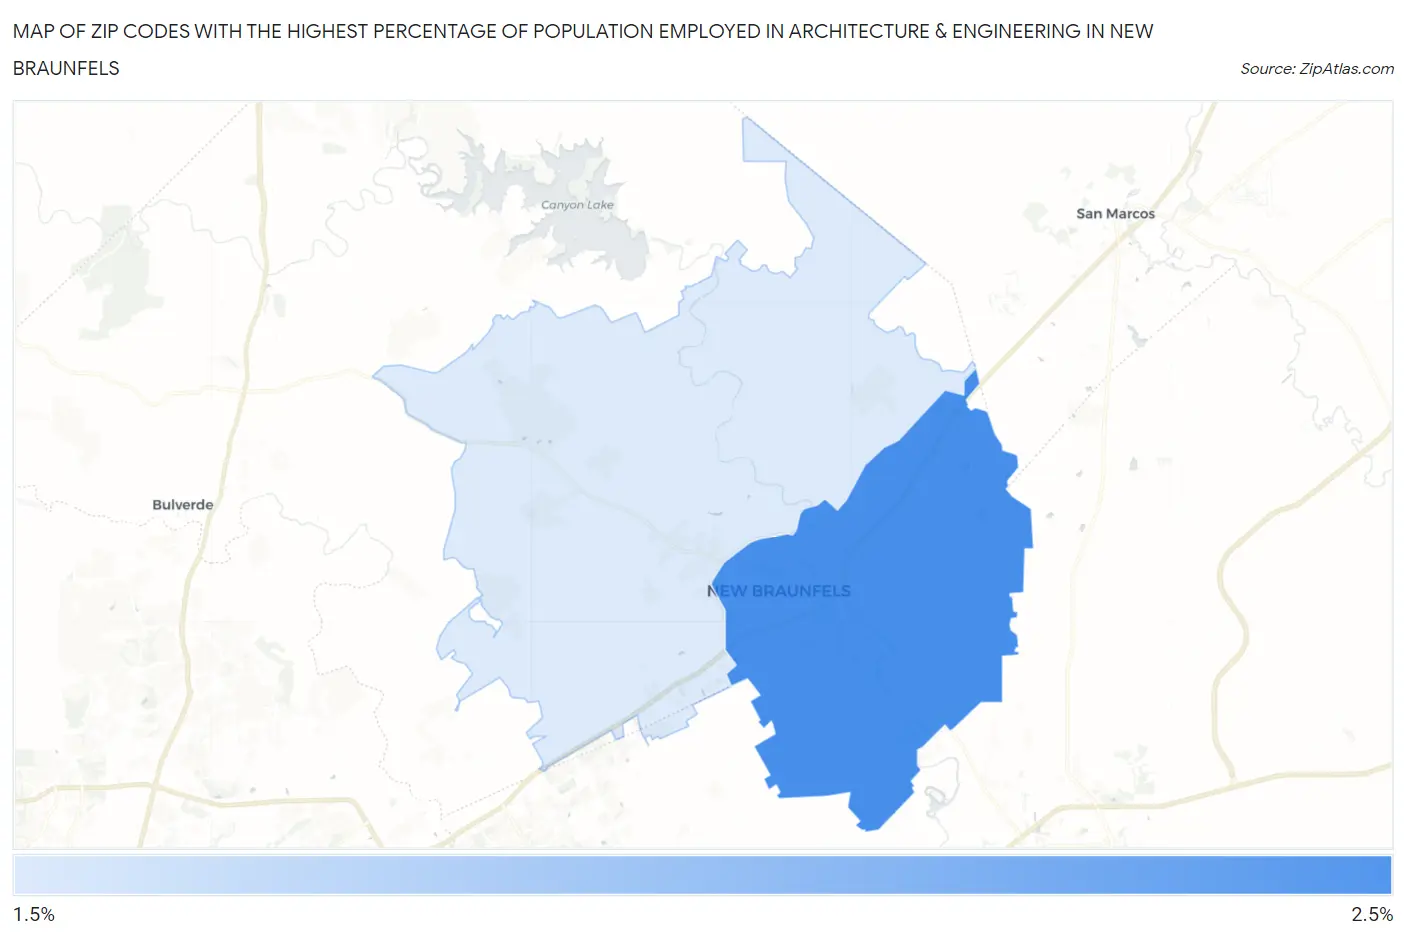
Map of Zip Codes with the Highest Percentage of Population Employed in Architecture & Engineering in New Braunfels
1.8%
2.3%
Zip Codes with the Highest Percentage of Population Employed in Architecture & Engineering in New Braunfels, TX
| Zip Code | % Employed | vs State | vs National | |
| 1. | 78130 | 2.3% | 2.2%(+0.097)#424 | 2.1%(+0.170)#7,854 |
| 2. | 78132 | 1.8% | 2.2%(-0.461)#597 | 2.1%(-0.388)#11,060 |
1
Common Questions
What are the Top Zip Codes with the Highest Percentage of Population Employed in Architecture & Engineering in New Braunfels, TX?
Top Zip Codes with the Highest Percentage of Population Employed in Architecture & Engineering in New Braunfels, TX are:
What zip code has the Highest Percentage of Population Employed in Architecture & Engineering in New Braunfels, TX?
78130 has the Highest Percentage of Population Employed in Architecture & Engineering in New Braunfels, TX with 2.3%.
What is the Percentage of Population Employed in Architecture & Engineering in New Braunfels, TX?
Percentage of Population Employed in Architecture & Engineering in New Braunfels is 2.1%.
What is the Percentage of Population Employed in Architecture & Engineering in Texas?
Percentage of Population Employed in Architecture & Engineering in Texas is 2.2%.
What is the Percentage of Population Employed in Architecture & Engineering in the United States?
Percentage of Population Employed in Architecture & Engineering in the United States is 2.1%.