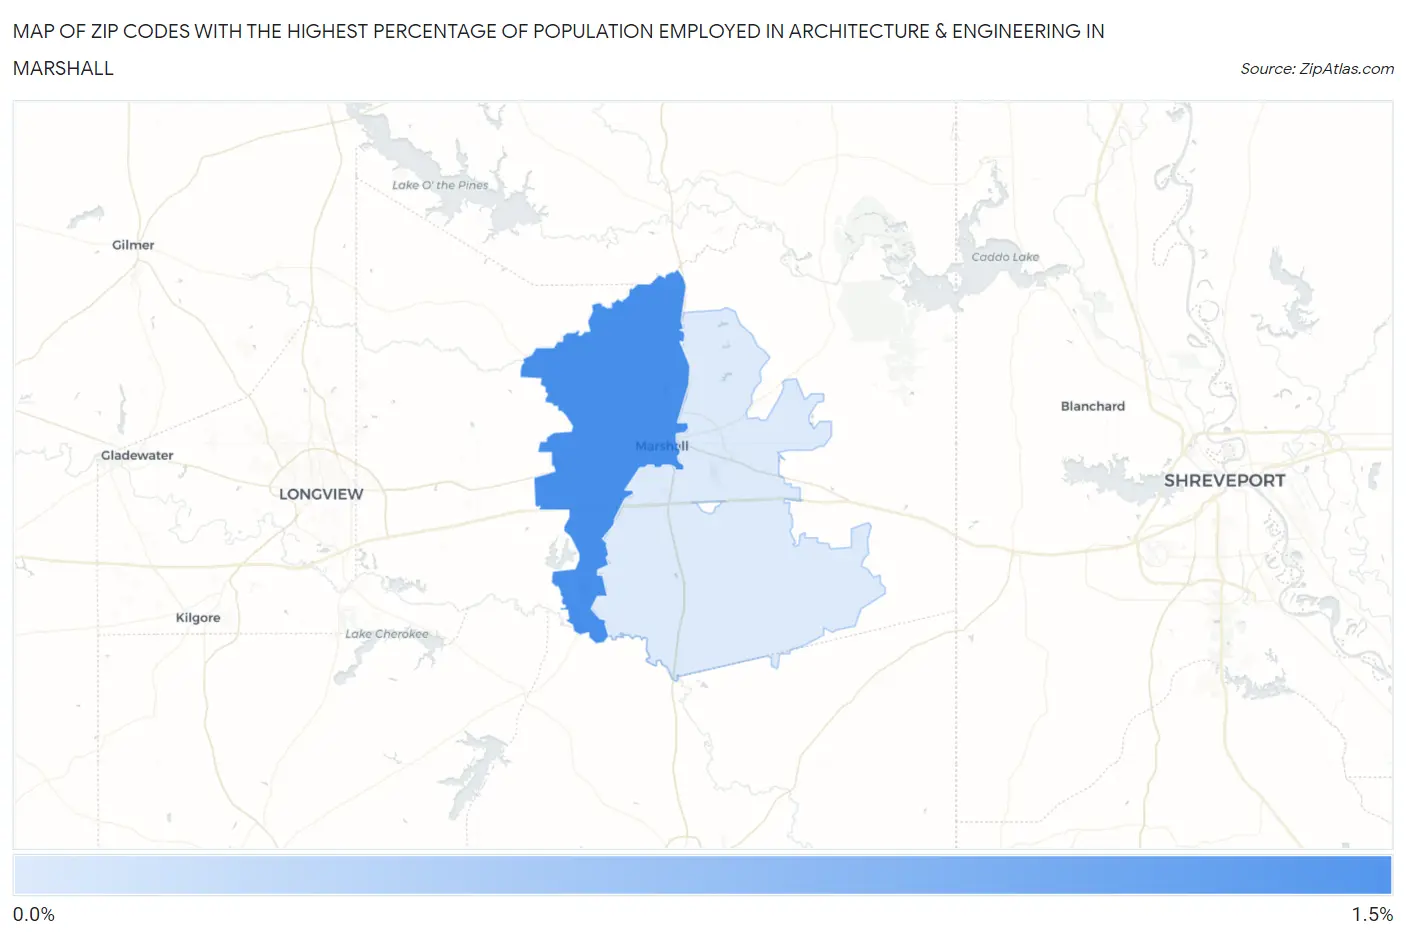
Zip Codes with the Highest Percentage of Population Employed in Architecture & Engineering in Marshall, TX
RELATED REPORTS & OPTIONS
Architecture & Engineering
Marshall
Compare Zip Codes
Map of Zip Codes with the Highest Percentage of Population Employed in Architecture & Engineering in Marshall
0.26%
1.0%
Zip Codes with the Highest Percentage of Population Employed in Architecture & Engineering in Marshall, TX
| Zip Code | % Employed | vs State | vs National | |
| 1. | 75670 | 1.0% | 2.2%(-1.19)#881 | 2.1%(-1.11)#16,350 |
| 2. | 75672 | 0.26% | 2.2%(-1.96)#1,242 | 2.1%(-1.89)#21,791 |
1
Common Questions
What are the Top Zip Codes with the Highest Percentage of Population Employed in Architecture & Engineering in Marshall, TX?
Top Zip Codes with the Highest Percentage of Population Employed in Architecture & Engineering in Marshall, TX are:
What zip code has the Highest Percentage of Population Employed in Architecture & Engineering in Marshall, TX?
75670 has the Highest Percentage of Population Employed in Architecture & Engineering in Marshall, TX with 1.0%.
What is the Percentage of Population Employed in Architecture & Engineering in Marshall, TX?
Percentage of Population Employed in Architecture & Engineering in Marshall is 0.86%.
What is the Percentage of Population Employed in Architecture & Engineering in Texas?
Percentage of Population Employed in Architecture & Engineering in Texas is 2.2%.
What is the Percentage of Population Employed in Architecture & Engineering in the United States?
Percentage of Population Employed in Architecture & Engineering in the United States is 2.1%.