Zip Codes with the Highest Percentage of Population Employed in Architecture & Engineering in Pearland, TX
RELATED REPORTS & OPTIONS
Architecture & Engineering
Pearland
Compare Zip Codes
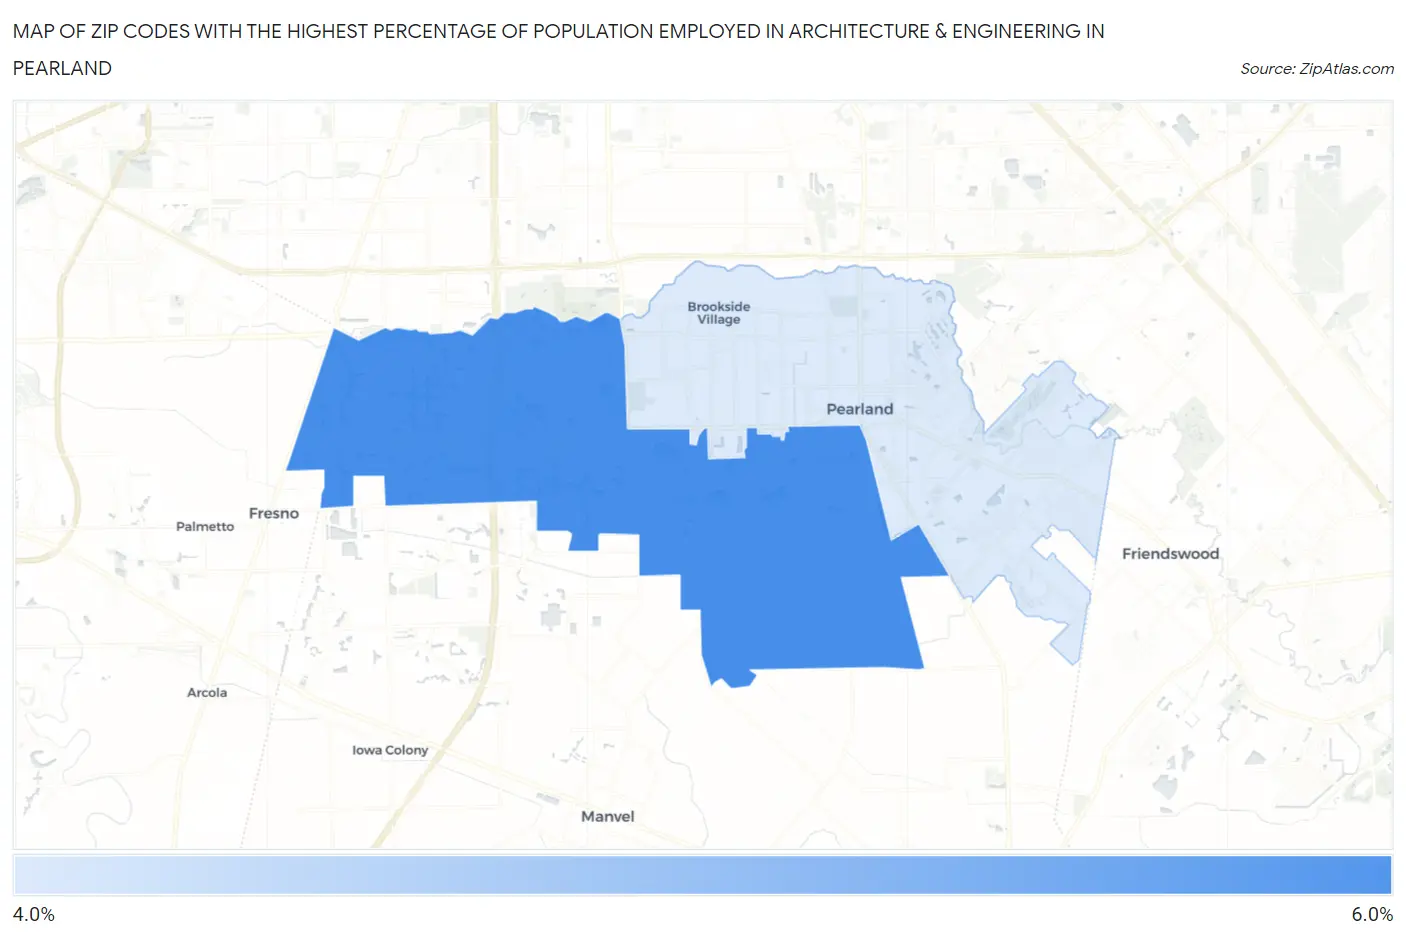
Map of Zip Codes with the Highest Percentage of Population Employed in Architecture & Engineering in Pearland
4.1%
5.4%
Zip Codes with the Highest Percentage of Population Employed in Architecture & Engineering in Pearland, TX
| Zip Code | % Employed | vs State | vs National | |
| 1. | 77584 | 5.4% | 2.2%(+3.21)#73 | 2.1%(+3.28)#1,369 |
| 2. | 77581 | 4.1% | 2.2%(+1.85)#139 | 2.1%(+1.93)#2,654 |
1
Common Questions
What are the Top Zip Codes with the Highest Percentage of Population Employed in Architecture & Engineering in Pearland, TX?
Top Zip Codes with the Highest Percentage of Population Employed in Architecture & Engineering in Pearland, TX are:
What zip code has the Highest Percentage of Population Employed in Architecture & Engineering in Pearland, TX?
77584 has the Highest Percentage of Population Employed in Architecture & Engineering in Pearland, TX with 5.4%.
What is the Percentage of Population Employed in Architecture & Engineering in Pearland, TX?
Percentage of Population Employed in Architecture & Engineering in Pearland is 5.3%.
What is the Percentage of Population Employed in Architecture & Engineering in Texas?
Percentage of Population Employed in Architecture & Engineering in Texas is 2.2%.
What is the Percentage of Population Employed in Architecture & Engineering in the United States?
Percentage of Population Employed in Architecture & Engineering in the United States is 2.1%.