Clear Lake Shores, TX Map & Demographics
Clear Lake Shores Map
Clear Lake Shores Overview
$66,034
PER CAPITA INCOME
$162,917
AVG FAMILY INCOME
$118,438
AVG HOUSEHOLD INCOME
28.6%
WAGE / INCOME GAP [ % ]
71.4¢/ $1
WAGE / INCOME GAP [ $ ]
0.43
INEQUALITY / GINI INDEX
1,232
TOTAL POPULATION
649
MALE POPULATION
583
FEMALE POPULATION
111.32
MALES / 100 FEMALES
89.83
FEMALES / 100 MALES
51.6
MEDIAN AGE
2.9
AVG FAMILY SIZE
2.2
AVG HOUSEHOLD SIZE
629
LABOR FORCE [ PEOPLE ]
58.7%
PERCENT IN LABOR FORCE
5.0%
UNEMPLOYMENT RATE
Income in Clear Lake Shores
Income Overview in Clear Lake Shores
Per Capita Income in Clear Lake Shores is $66,034, while median incomes of families and households are $162,917 and $118,438 respectively.
| Characteristic | Number | Measure |
| Per Capita Income | 1,232 | $66,034 |
| Median Family Income | 313 | $162,917 |
| Mean Family Income | 313 | $186,018 |
| Median Household Income | 549 | $118,438 |
| Mean Household Income | 549 | $147,977 |
| Income Deficit | 313 | $0 |
| Wage / Income Gap (%) | 1,232 | 28.63% |
| Wage / Income Gap ($) | 1,232 | 71.37¢ per $1 |
| Gini / Inequality Index | 1,232 | 0.43 |
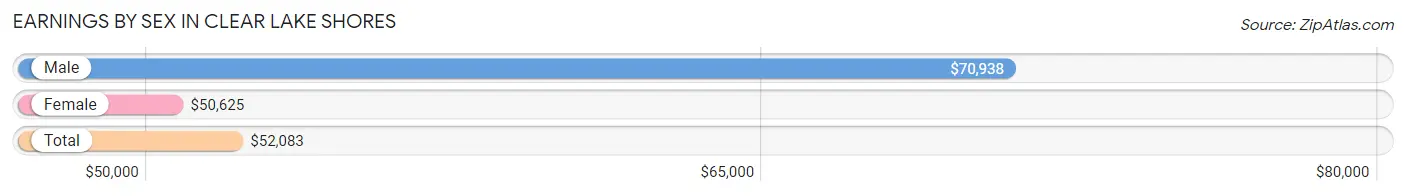
Earnings by Sex in Clear Lake Shores
Average Earnings in Clear Lake Shores are $52,083, $70,938 for men and $50,625 for women, a difference of 28.6%.
| Sex | Number | Average Earnings |
| Male | 391 (58.9%) | $70,938 |
| Female | 273 (41.1%) | $50,625 |
| Total | 664 (100.0%) | $52,083 |
Earnings by Sex by Income Bracket in Clear Lake Shores
The most common earnings brackets in Clear Lake Shores are $100,000+ for men (166 | 42.5%) and $100,000+ for women (65 | 23.8%).
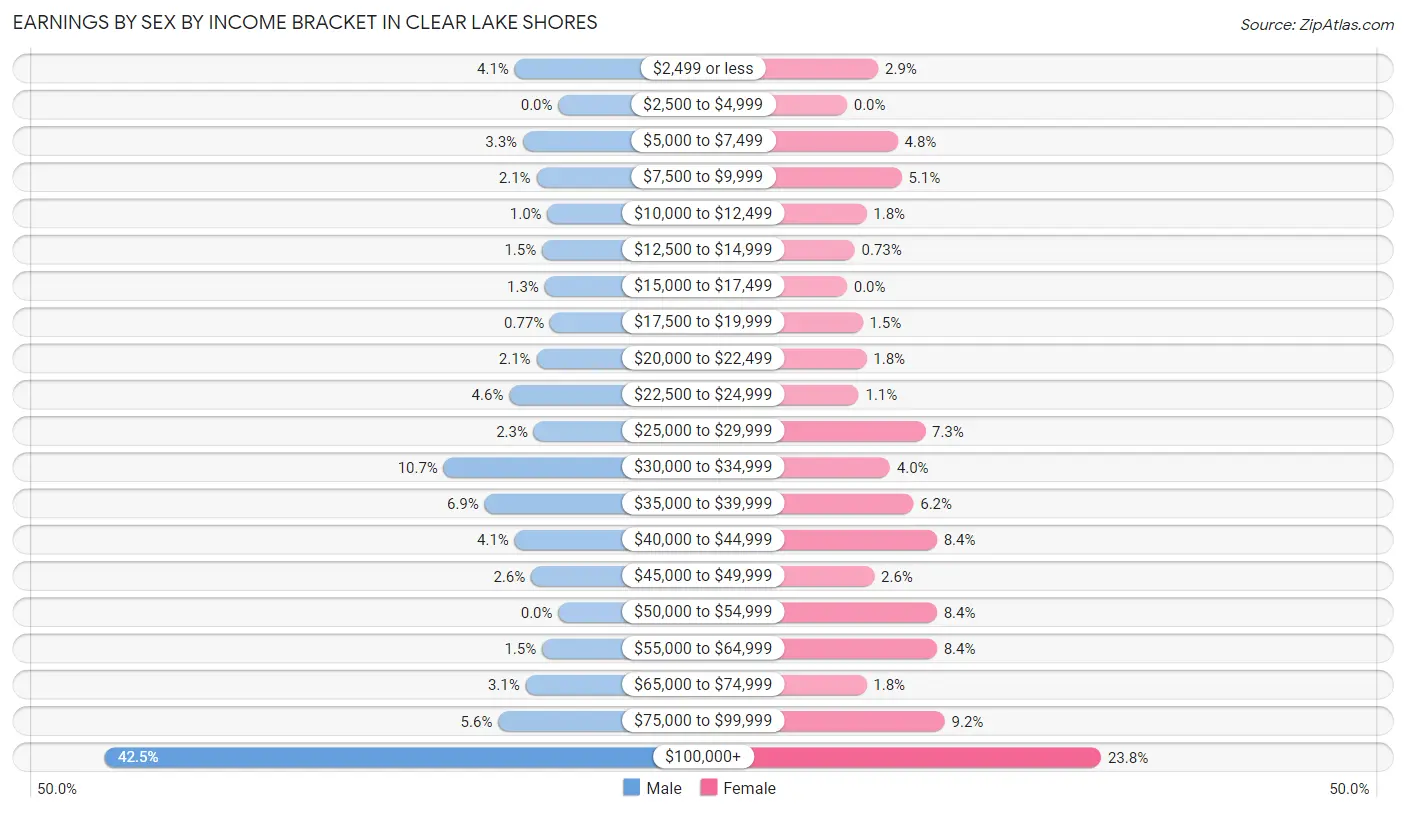
| Income | Male | Female |
| $2,499 or less | 16 (4.1%) | 8 (2.9%) |
| $2,500 to $4,999 | 0 (0.0%) | 0 (0.0%) |
| $5,000 to $7,499 | 13 (3.3%) | 13 (4.8%) |
| $7,500 to $9,999 | 8 (2.1%) | 14 (5.1%) |
| $10,000 to $12,499 | 4 (1.0%) | 5 (1.8%) |
| $12,500 to $14,999 | 6 (1.5%) | 2 (0.7%) |
| $15,000 to $17,499 | 5 (1.3%) | 0 (0.0%) |
| $17,500 to $19,999 | 3 (0.8%) | 4 (1.5%) |
| $20,000 to $22,499 | 8 (2.1%) | 5 (1.8%) |
| $22,500 to $24,999 | 18 (4.6%) | 3 (1.1%) |
| $25,000 to $29,999 | 9 (2.3%) | 20 (7.3%) |
| $30,000 to $34,999 | 42 (10.7%) | 11 (4.0%) |
| $35,000 to $39,999 | 27 (6.9%) | 17 (6.2%) |
| $40,000 to $44,999 | 16 (4.1%) | 23 (8.4%) |
| $45,000 to $49,999 | 10 (2.6%) | 7 (2.6%) |
| $50,000 to $54,999 | 0 (0.0%) | 23 (8.4%) |
| $55,000 to $64,999 | 6 (1.5%) | 23 (8.4%) |
| $65,000 to $74,999 | 12 (3.1%) | 5 (1.8%) |
| $75,000 to $99,999 | 22 (5.6%) | 25 (9.2%) |
| $100,000+ | 166 (42.5%) | 65 (23.8%) |
| Total | 391 (100.0%) | 273 (100.0%) |
Earnings by Sex by Educational Attainment in Clear Lake Shores
Average earnings in Clear Lake Shores are $90,000 for men and $51,250 for women, a difference of 43.1%. Men with an educational attainment of graduate degree enjoy the highest average annual earnings of $160,625, while those with bachelor's degree education earn the least with $103,618. Women with an educational attainment of college or associate's degree earn the most with the average annual earnings of $50,069, while those with high school diploma education have the smallest earnings of $42,250.
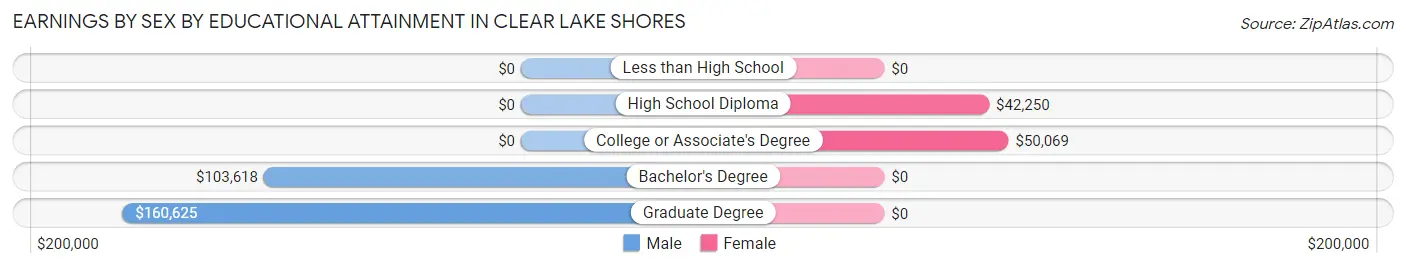
| Educational Attainment | Male Income | Female Income |
| Less than High School | - | - |
| High School Diploma | - | - |
| College or Associate's Degree | - | - |
| Bachelor's Degree | $103,618 | $0 |
| Graduate Degree | $160,625 | $0 |
| Total | $90,000 | $51,250 |
Family Income in Clear Lake Shores
Family Income Brackets in Clear Lake Shores
According to the Clear Lake Shores family income data, there are 93 families falling into the $200,000+ income range, which is the most common income bracket and makes up 29.7% of all families.
| Income Bracket | # Families | % Families |
| Less than $10,000 | 0 | 0.0% |
| $10,000 to $14,999 | 14 | 4.5% |
| $15,000 to $24,999 | 9 | 2.9% |
| $25,000 to $34,999 | 25 | 8.0% |
| $35,000 to $49,999 | 11 | 3.5% |
| $50,000 to $74,999 | 2 | 0.6% |
| $75,000 to $99,999 | 10 | 3.2% |
| $100,000 to $149,999 | 73 | 23.3% |
| $150,000 to $199,999 | 76 | 24.3% |
| $200,000+ | 93 | 29.7% |
Family Income by Famaliy Size in Clear Lake Shores
4-person families (52 | 16.6%) account for the highest median family income in Clear Lake Shores with $197,500 per family, while 2-person families (168 | 53.7%) have the highest median income of $72,857 per family member.
| Income Bracket | # Families | Median Income |
| 2-Person Families | 168 (53.7%) | $145,714 |
| 3-Person Families | 79 (25.2%) | $168,417 |
| 4-Person Families | 52 (16.6%) | $197,500 |
| 5-Person Families | 14 (4.5%) | $0 |
| 6-Person Families | 0 (0.0%) | $0 |
| 7+ Person Families | 0 (0.0%) | $0 |
| Total | 313 (100.0%) | $162,917 |
Family Income by Number of Earners in Clear Lake Shores
| Number of Earners | # Families | Median Income |
| No Earners | 42 (13.4%) | $107,500 |
| 1 Earner | 133 (42.5%) | $173,438 |
| 2 Earners | 131 (41.8%) | $168,417 |
| 3+ Earners | 7 (2.2%) | $0 |
| Total | 313 (100.0%) | $162,917 |
Household Income in Clear Lake Shores
Household Income Brackets in Clear Lake Shores
With 119 households falling in the category, the $100,000 to $149,999 income range is the most frequent in Clear Lake Shores, accounting for 21.7% of all households.
| Income Bracket | # Households | % Households |
| Less than $10,000 | 8 | 1.5% |
| $10,000 to $14,999 | 0 | 0.0% |
| $15,000 to $24,999 | 19 | 3.5% |
| $25,000 to $34,999 | 33 | 6.0% |
| $35,000 to $49,999 | 80 | 14.6% |
| $50,000 to $74,999 | 41 | 7.5% |
| $75,000 to $99,999 | 32 | 5.8% |
| $100,000 to $149,999 | 119 | 21.7% |
| $150,000 to $199,999 | 112 | 20.4% |
| $200,000+ | 105 | 19.1% |
Household Income by Householder Age in Clear Lake Shores
The median household income in Clear Lake Shores is $118,438, with the highest median household income of $173,375 found in the 25 to 44 years age bracket for the primary householder. A total of 59 households (10.7%) fall into this category.
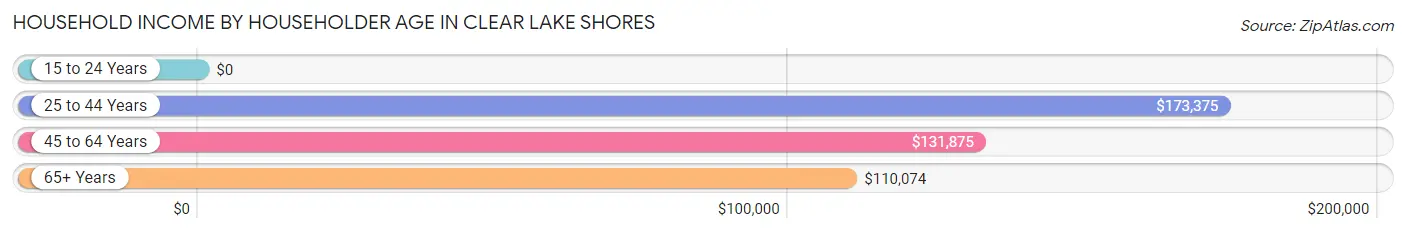
| Income Bracket | # Households | Median Income |
| 15 to 24 Years | 0 (0.0%) | $0 |
| 25 to 44 Years | 59 (10.7%) | $173,375 |
| 45 to 64 Years | 289 (52.6%) | $131,875 |
| 65+ Years | 201 (36.6%) | $110,074 |
| Total | 549 (100.0%) | $118,438 |
Poverty in Clear Lake Shores
Income Below Poverty by Sex and Age in Clear Lake Shores
With 4.8% poverty level for males and 11.5% for females among the residents of Clear Lake Shores, 12 to 14 year old males and 12 to 14 year old females are the most vulnerable to poverty, with 16 males (48.5%) and 29 females (90.6%) in their respective age groups living below the poverty level.
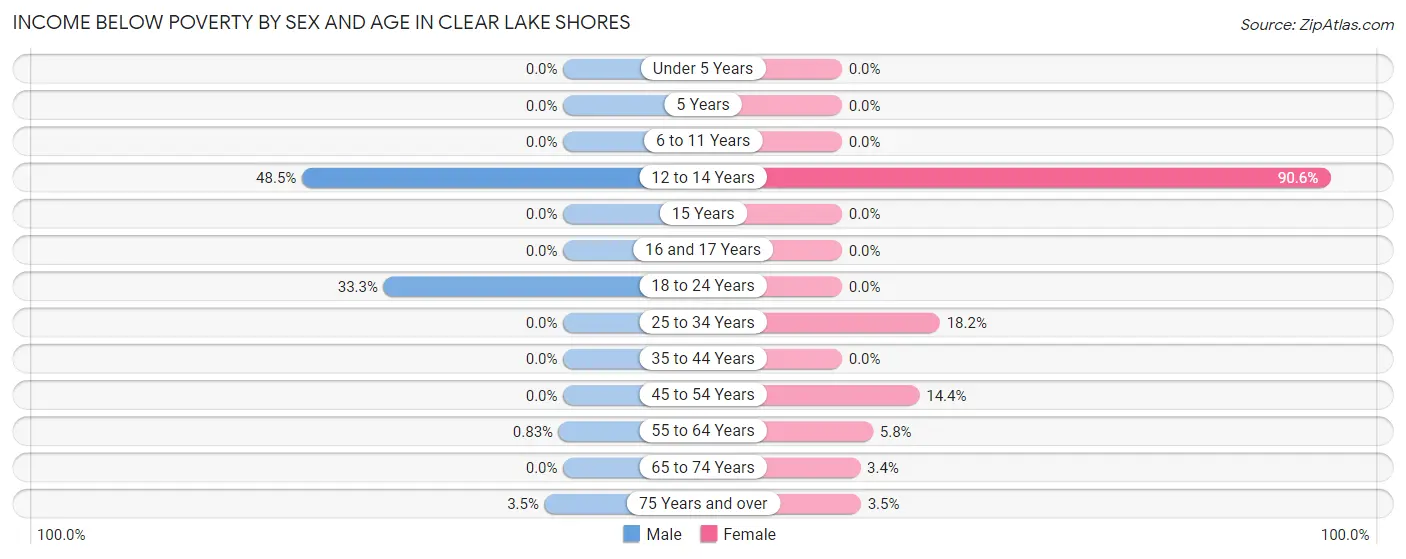
| Age Bracket | Male | Female |
| Under 5 Years | 0 (0.0%) | 0 (0.0%) |
| 5 Years | 0 (0.0%) | 0 (0.0%) |
| 6 to 11 Years | 0 (0.0%) | 0 (0.0%) |
| 12 to 14 Years | 16 (48.5%) | 29 (90.6%) |
| 15 Years | 0 (0.0%) | 0 (0.0%) |
| 16 and 17 Years | 0 (0.0%) | 0 (0.0%) |
| 18 to 24 Years | 12 (33.3%) | 0 (0.0%) |
| 25 to 34 Years | 0 (0.0%) | 4 (18.2%) |
| 35 to 44 Years | 0 (0.0%) | 0 (0.0%) |
| 45 to 54 Years | 0 (0.0%) | 22 (14.4%) |
| 55 to 64 Years | 1 (0.8%) | 8 (5.8%) |
| 65 to 74 Years | 0 (0.0%) | 2 (3.4%) |
| 75 Years and over | 2 (3.5%) | 2 (3.5%) |
| Total | 31 (4.8%) | 67 (11.5%) |
Income Above Poverty by Sex and Age in Clear Lake Shores
According to the poverty statistics in Clear Lake Shores, males aged under 5 years and females aged under 5 years are the age groups that are most secure financially, with 100.0% of males and 100.0% of females in these age groups living above the poverty line.
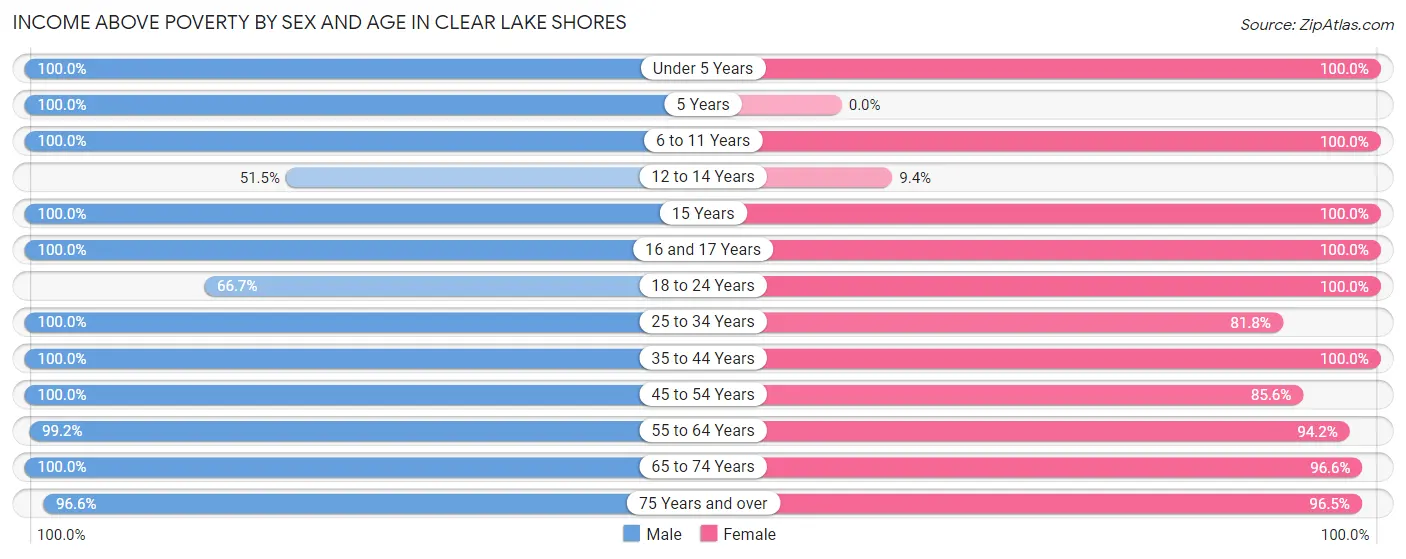
| Age Bracket | Male | Female |
| Under 5 Years | 14 (100.0%) | 11 (100.0%) |
| 5 Years | 9 (100.0%) | 0 (0.0%) |
| 6 to 11 Years | 20 (100.0%) | 27 (100.0%) |
| 12 to 14 Years | 17 (51.5%) | 3 (9.4%) |
| 15 Years | 6 (100.0%) | 8 (100.0%) |
| 16 and 17 Years | 13 (100.0%) | 10 (100.0%) |
| 18 to 24 Years | 24 (66.7%) | 21 (100.0%) |
| 25 to 34 Years | 54 (100.0%) | 18 (81.8%) |
| 35 to 44 Years | 45 (100.0%) | 44 (100.0%) |
| 45 to 54 Years | 131 (100.0%) | 131 (85.6%) |
| 55 to 64 Years | 119 (99.2%) | 131 (94.2%) |
| 65 to 74 Years | 110 (100.0%) | 57 (96.6%) |
| 75 Years and over | 56 (96.6%) | 55 (96.5%) |
| Total | 618 (95.2%) | 516 (88.5%) |
Income Below Poverty Among Married-Couple Families in Clear Lake Shores
The poverty statistics for married-couple families in Clear Lake Shores show that 0.8% or 2 of the total 256 families live below the poverty line. Families with no children have the highest poverty rate of 1.0%, comprising of 2 families. On the other hand, families with 1 or 2 children have the lowest poverty rate of 0.0%, which includes 0 families.
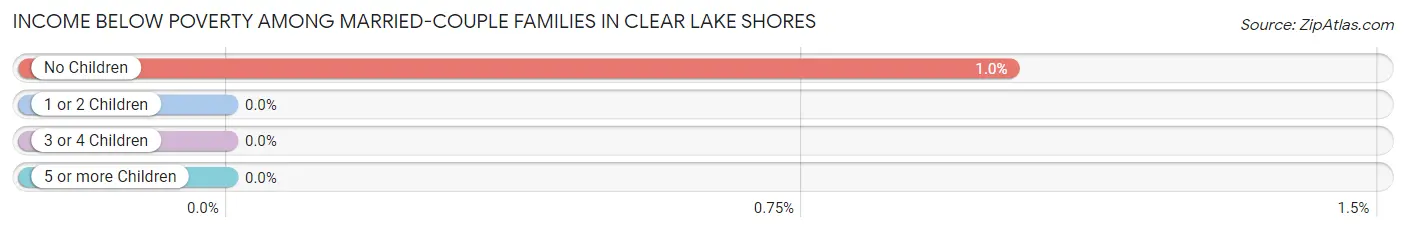
| Children | Above Poverty | Below Poverty |
| No Children | 195 (99.0%) | 2 (1.0%) |
| 1 or 2 Children | 59 (100.0%) | 0 (0.0%) |
| 3 or 4 Children | 0 (0.0%) | 0 (0.0%) |
| 5 or more Children | 0 (0.0%) | 0 (0.0%) |
| Total | 254 (99.2%) | 2 (0.8%) |
Income Below Poverty Among Single-Parent Households in Clear Lake Shores
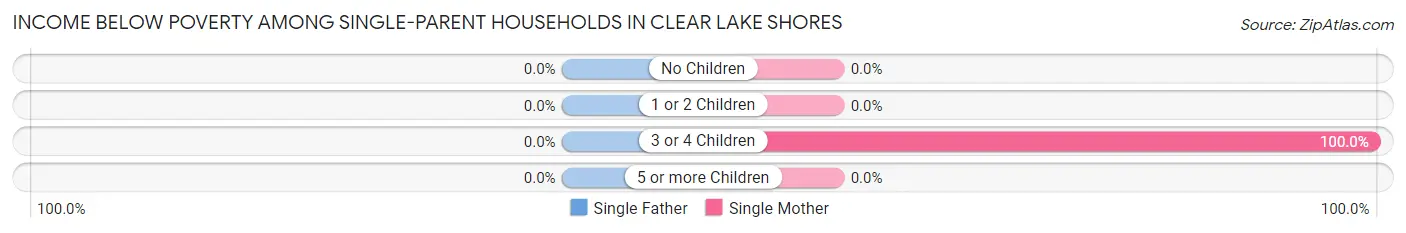
| Children | Single Father | Single Mother |
| No Children | 0 (0.0%) | 0 (0.0%) |
| 1 or 2 Children | 0 (0.0%) | 0 (0.0%) |
| 3 or 4 Children | 0 (0.0%) | 14 (100.0%) |
| 5 or more Children | 0 (0.0%) | 0 (0.0%) |
| Total | 0 (0.0%) | 14 (25.5%) |
Income Below Poverty Among Married-Couple vs Single-Parent Households in Clear Lake Shores
The poverty data for Clear Lake Shores shows that 2 of the married-couple family households (0.8%) and 14 of the single-parent households (24.6%) are living below the poverty level. Within the married-couple family households, those with no children have the highest poverty rate, with 2 households (1.0%) falling below the poverty line. Among the single-parent households, those with 3 or 4 children have the highest poverty rate, with 14 household (100.0%) living below poverty.
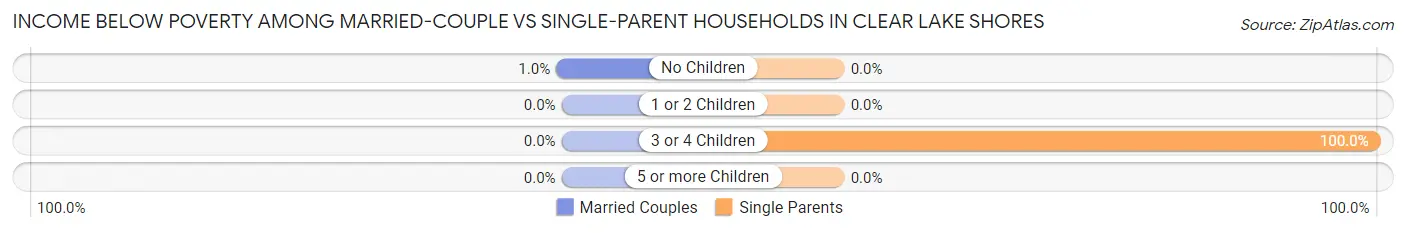
| Children | Married-Couple Families | Single-Parent Households |
| No Children | 2 (1.0%) | 0 (0.0%) |
| 1 or 2 Children | 0 (0.0%) | 0 (0.0%) |
| 3 or 4 Children | 0 (0.0%) | 14 (100.0%) |
| 5 or more Children | 0 (0.0%) | 0 (0.0%) |
| Total | 2 (0.8%) | 14 (24.6%) |
Race in Clear Lake Shores
The most populous races in Clear Lake Shores are White / Caucasian (1,094 | 88.8%), Hispanic or Latino (134 | 10.9%), and Two or more Races (95 | 7.7%).
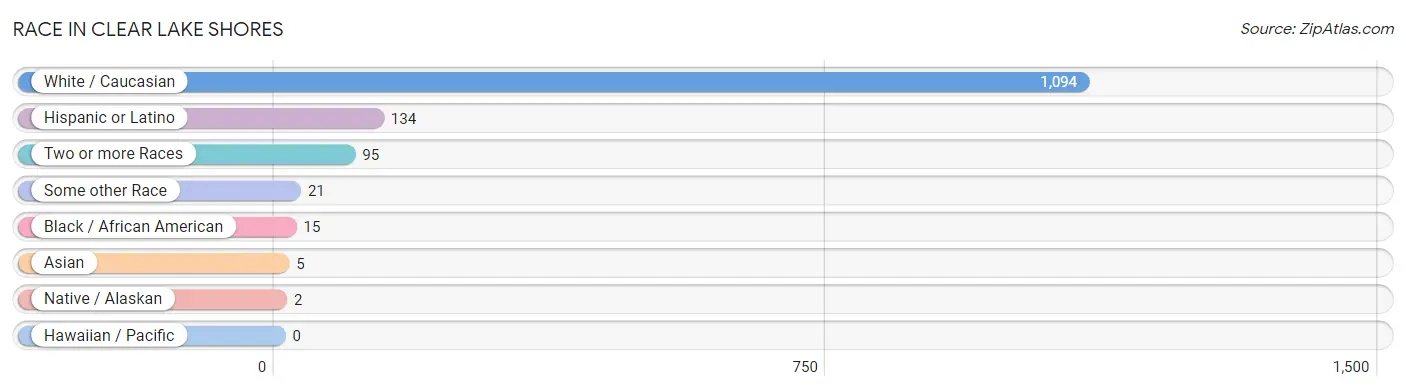
| Race | # Population | % Population |
| Asian | 5 | 0.4% |
| Black / African American | 15 | 1.2% |
| Hawaiian / Pacific | 0 | 0.0% |
| Hispanic or Latino | 134 | 10.9% |
| Native / Alaskan | 2 | 0.2% |
| White / Caucasian | 1,094 | 88.8% |
| Two or more Races | 95 | 7.7% |
| Some other Race | 21 | 1.7% |
| Total | 1,232 | 100.0% |
Ancestry in Clear Lake Shores
The most populous ancestries reported in Clear Lake Shores are German (281 | 22.8%), English (237 | 19.2%), Mexican (125 | 10.2%), Irish (91 | 7.4%), and European (77 | 6.2%), together accounting for 65.8% of all Clear Lake Shores residents.
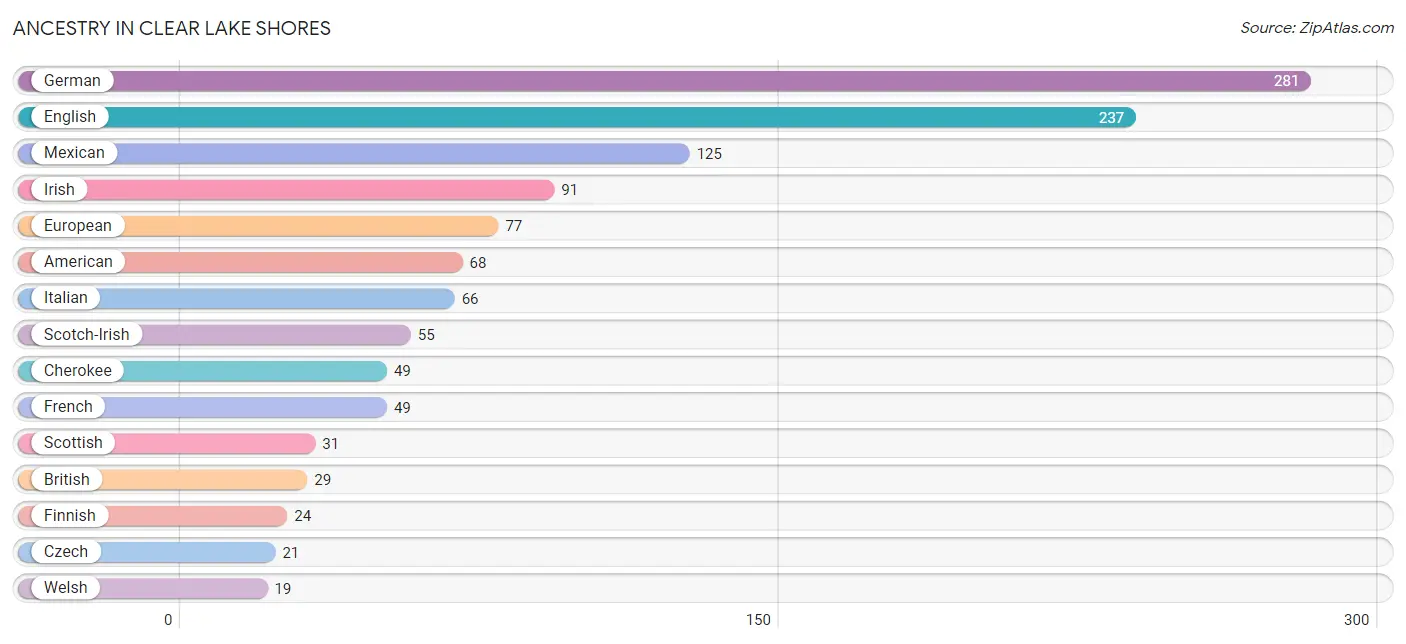
| Ancestry | # Population | % Population |
| American | 68 | 5.5% |
| Armenian | 2 | 0.2% |
| Brazilian | 4 | 0.3% |
| British | 29 | 2.4% |
| Cajun | 3 | 0.2% |
| Cherokee | 49 | 4.0% |
| Croatian | 2 | 0.2% |
| Czech | 21 | 1.7% |
| English | 237 | 19.2% |
| Estonian | 2 | 0.2% |
| European | 77 | 6.2% |
| Finnish | 24 | 1.9% |
| French | 49 | 4.0% |
| French Canadian | 5 | 0.4% |
| German | 281 | 22.8% |
| Greek | 8 | 0.6% |
| Hungarian | 10 | 0.8% |
| Irish | 91 | 7.4% |
| Italian | 66 | 5.4% |
| Lithuanian | 11 | 0.9% |
| Luxembourger | 10 | 0.8% |
| Mexican | 125 | 10.2% |
| Norwegian | 2 | 0.2% |
| Polish | 14 | 1.1% |
| Puerto Rican | 9 | 0.7% |
| Russian | 8 | 0.6% |
| Scandinavian | 5 | 0.4% |
| Scotch-Irish | 55 | 4.5% |
| Scottish | 31 | 2.5% |
| Slovak | 3 | 0.2% |
| Swedish | 5 | 0.4% |
| Thai | 5 | 0.4% |
| Ukrainian | 3 | 0.2% |
| Welsh | 19 | 1.5% | View All 34 Rows |
Immigrants in Clear Lake Shores
The most numerous immigrant groups reported in Clear Lake Shores came from Europe (24 | 1.9%), Northern Europe (19 | 1.5%), Latin America (12 | 1.0%), Brazil (8 | 0.6%), and South America (8 | 0.6%), together accounting for 5.8% of all Clear Lake Shores residents.
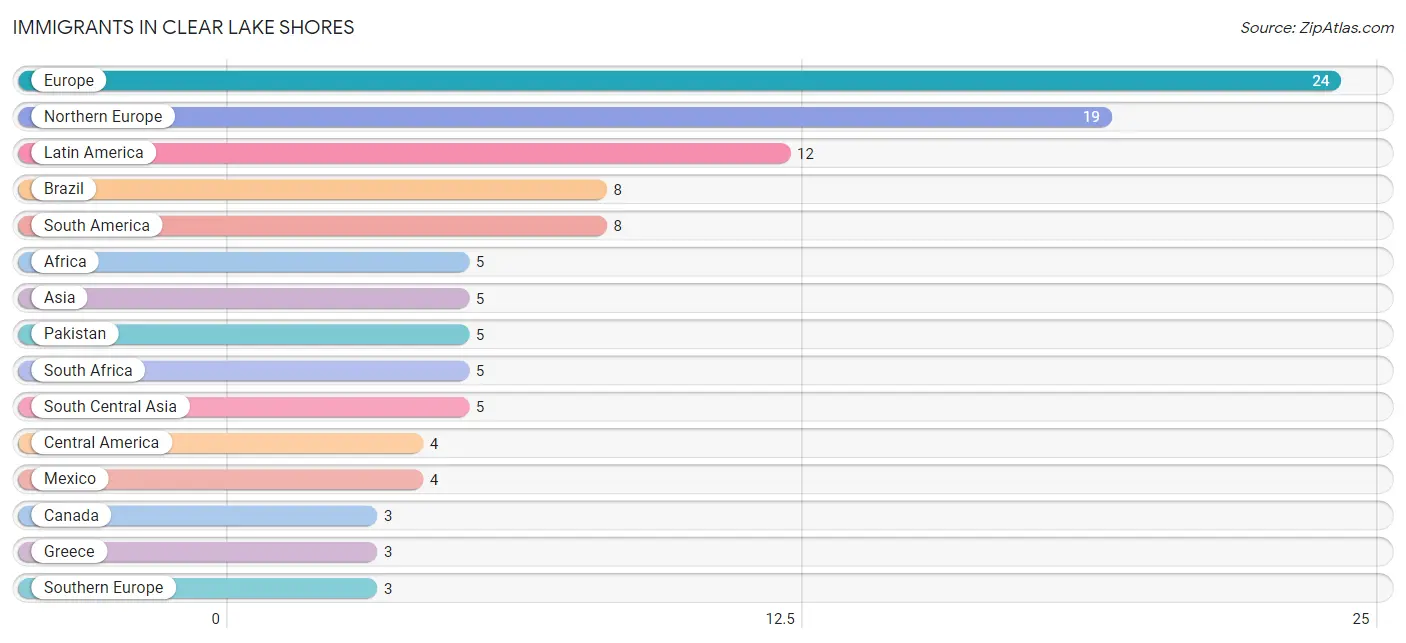
| Immigration Origin | # Population | % Population |
| Africa | 5 | 0.4% |
| Asia | 5 | 0.4% |
| Brazil | 8 | 0.6% |
| Canada | 3 | 0.2% |
| Central America | 4 | 0.3% |
| Eastern Europe | 2 | 0.2% |
| Europe | 24 | 1.9% |
| Greece | 3 | 0.2% |
| Latin America | 12 | 1.0% |
| Mexico | 4 | 0.3% |
| Northern Europe | 19 | 1.5% |
| Pakistan | 5 | 0.4% |
| South Africa | 5 | 0.4% |
| South America | 8 | 0.6% |
| South Central Asia | 5 | 0.4% |
| Southern Europe | 3 | 0.2% | View All 16 Rows |
Sex and Age in Clear Lake Shores
Sex and Age in Clear Lake Shores
The most populous age groups in Clear Lake Shores are 45 to 49 Years (99 | 15.2%) for men and 45 to 49 Years (89 | 15.3%) for women.
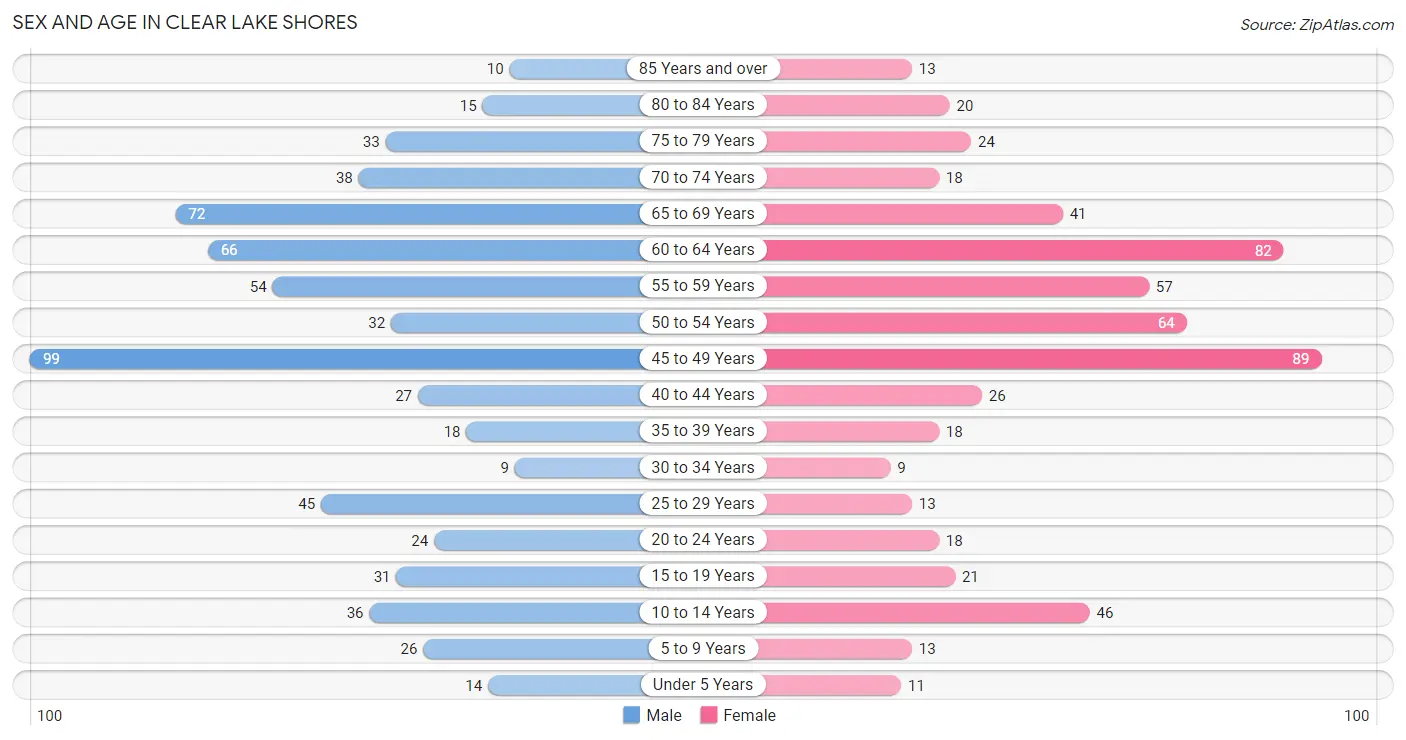
| Age Bracket | Male | Female |
| Under 5 Years | 14 (2.2%) | 11 (1.9%) |
| 5 to 9 Years | 26 (4.0%) | 13 (2.2%) |
| 10 to 14 Years | 36 (5.6%) | 46 (7.9%) |
| 15 to 19 Years | 31 (4.8%) | 21 (3.6%) |
| 20 to 24 Years | 24 (3.7%) | 18 (3.1%) |
| 25 to 29 Years | 45 (6.9%) | 13 (2.2%) |
| 30 to 34 Years | 9 (1.4%) | 9 (1.5%) |
| 35 to 39 Years | 18 (2.8%) | 18 (3.1%) |
| 40 to 44 Years | 27 (4.2%) | 26 (4.5%) |
| 45 to 49 Years | 99 (15.2%) | 89 (15.3%) |
| 50 to 54 Years | 32 (4.9%) | 64 (11.0%) |
| 55 to 59 Years | 54 (8.3%) | 57 (9.8%) |
| 60 to 64 Years | 66 (10.2%) | 82 (14.1%) |
| 65 to 69 Years | 72 (11.1%) | 41 (7.0%) |
| 70 to 74 Years | 38 (5.9%) | 18 (3.1%) |
| 75 to 79 Years | 33 (5.1%) | 24 (4.1%) |
| 80 to 84 Years | 15 (2.3%) | 20 (3.4%) |
| 85 Years and over | 10 (1.5%) | 13 (2.2%) |
| Total | 649 (100.0%) | 583 (100.0%) |
Families and Households in Clear Lake Shores
Median Family Size in Clear Lake Shores
The median family size in Clear Lake Shores is 2.85 persons per family, with single male/father families (2 | 0.6%) accounting for the largest median family size of 4 persons per family. On the other hand, married-couple families (256 | 81.8%) represent the smallest median family size with 2.79 persons per family.
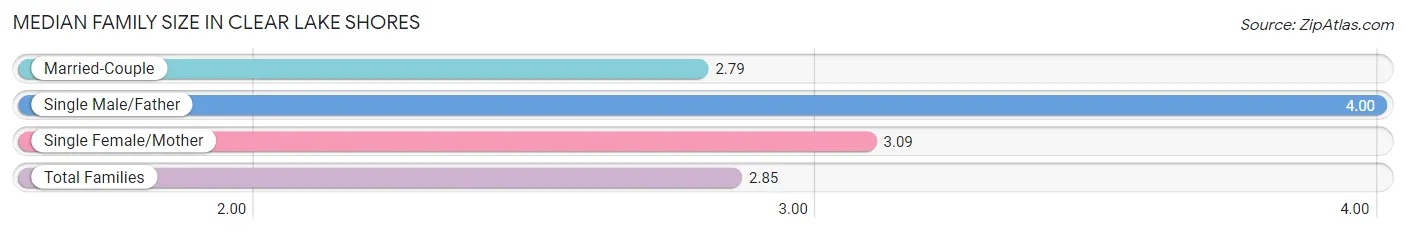
| Family Type | # Families | Family Size |
| Married-Couple | 256 (81.8%) | 2.79 |
| Single Male/Father | 2 (0.6%) | 4.00 |
| Single Female/Mother | 55 (17.6%) | 3.09 |
| Total Families | 313 (100.0%) | 2.85 |
Median Household Size in Clear Lake Shores
The median household size in Clear Lake Shores is 2.24 persons per household, with single male/father households (2 | 0.4%) accounting for the largest median household size of 4 persons per household. non-family households (236 | 43.0%) represent the smallest median household size with 1.30 persons per household.
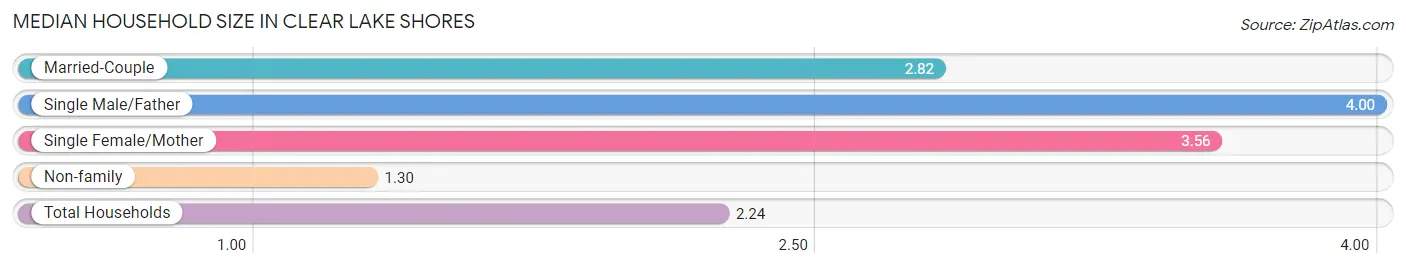
| Household Type | # Households | Household Size |
| Married-Couple | 256 (46.6%) | 2.82 |
| Single Male/Father | 2 (0.4%) | 4.00 |
| Single Female/Mother | 55 (10.0%) | 3.56 |
| Non-family | 236 (43.0%) | 1.30 |
| Total Households | 549 (100.0%) | 2.24 |
Household Size by Marriage Status in Clear Lake Shores
Out of a total of 549 households in Clear Lake Shores, 313 (57.0%) are family households, while 236 (43.0%) are nonfamily households. The most numerous type of family households are 2-person households, comprising 161, and the most common type of nonfamily households are 1-person households, comprising 165.
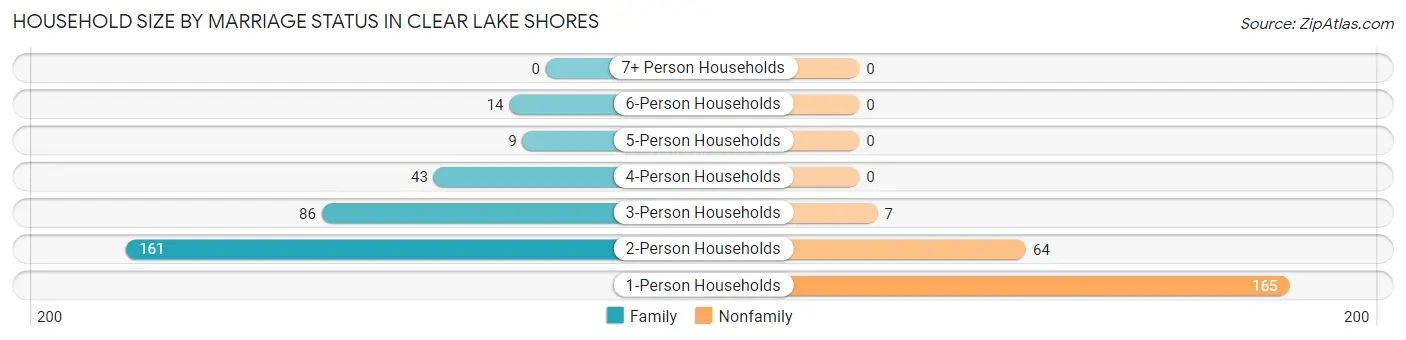
| Household Size | Family Households | Nonfamily Households |
| 1-Person Households | - | 165 (30.0%) |
| 2-Person Households | 161 (29.3%) | 64 (11.7%) |
| 3-Person Households | 86 (15.7%) | 7 (1.3%) |
| 4-Person Households | 43 (7.8%) | 0 (0.0%) |
| 5-Person Households | 9 (1.6%) | 0 (0.0%) |
| 6-Person Households | 14 (2.5%) | 0 (0.0%) |
| 7+ Person Households | 0 (0.0%) | 0 (0.0%) |
| Total | 313 (57.0%) | 236 (43.0%) |
Female Fertility in Clear Lake Shores
Fertility by Age in Clear Lake Shores
Average fertility rate in Clear Lake Shores is 51.0 births per 1,000 women. Women in the age bracket of 20 to 34 years have the highest fertility rate with 125.0 births per 1,000 women. Women in the age bracket of 20 to 34 years acount for 50.0% of all women with births.
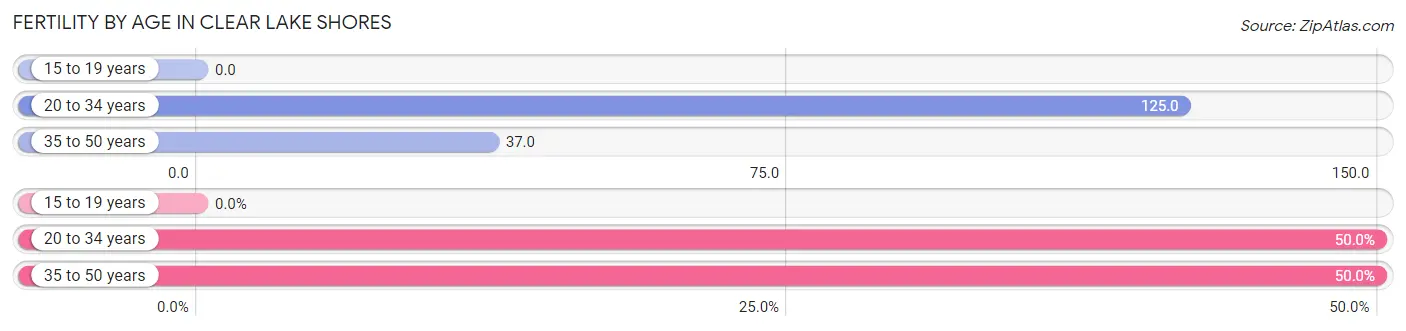
| Age Bracket | Women with Births | Births / 1,000 Women |
| 15 to 19 years | 0 (0.0%) | 0.0 |
| 20 to 34 years | 5 (50.0%) | 125.0 |
| 35 to 50 years | 5 (50.0%) | 37.0 |
| Total | 10 (100.0%) | 51.0 |
Fertility by Age by Marriage Status in Clear Lake Shores
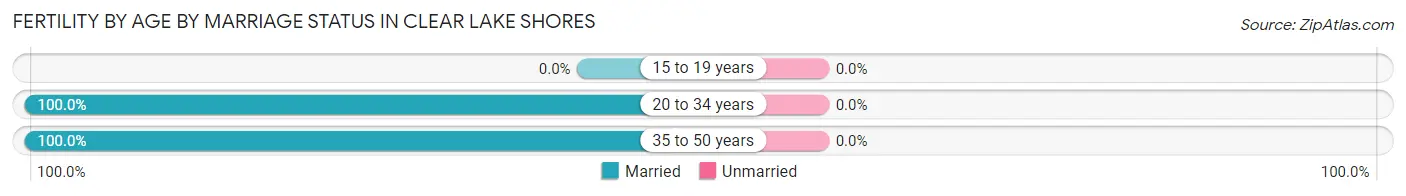
| Age Bracket | Married | Unmarried |
| 15 to 19 years | 0 (0.0%) | 0 (0.0%) |
| 20 to 34 years | 5 (100.0%) | 0 (0.0%) |
| 35 to 50 years | 5 (100.0%) | 0 (0.0%) |
| Total | 10 (100.0%) | 0 (0.0%) |
Fertility by Education in Clear Lake Shores
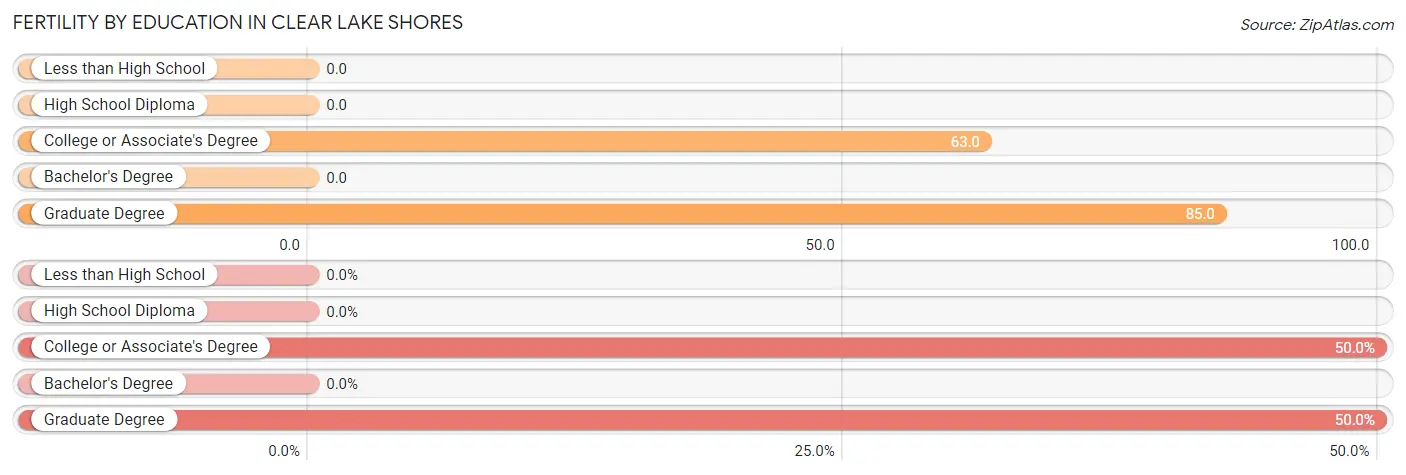
| Educational Attainment | Women with Births | Births / 1,000 Women |
| Less than High School | 0 (0.0%) | 0.0 |
| High School Diploma | 0 (0.0%) | 0.0 |
| College or Associate's Degree | 5 (50.0%) | 63.0 |
| Bachelor's Degree | 0 (0.0%) | 0.0 |
| Graduate Degree | 5 (50.0%) | 85.0 |
| Total | 10 (100.0%) | 51.0 |
Fertility by Education by Marriage Status in Clear Lake Shores
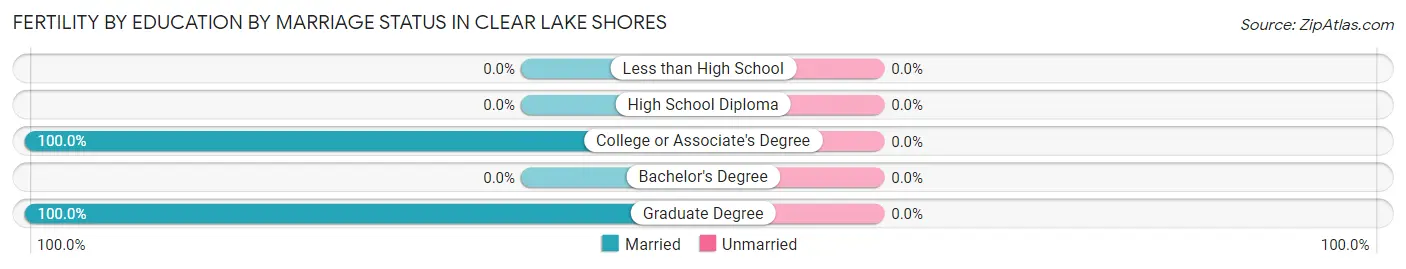
| Educational Attainment | Married | Unmarried |
| Less than High School | 0 (0.0%) | 0 (0.0%) |
| High School Diploma | 0 (0.0%) | 0 (0.0%) |
| College or Associate's Degree | 5 (100.0%) | 0 (0.0%) |
| Bachelor's Degree | 0 (0.0%) | 0 (0.0%) |
| Graduate Degree | 5 (100.0%) | 0 (0.0%) |
| Total | 10 (100.0%) | 0 (0.0%) |
Employment Characteristics in Clear Lake Shores
Employment by Class of Employer in Clear Lake Shores
Among the 589 employed individuals in Clear Lake Shores, private company employees (378 | 64.2%), self-employed (not incorporated) (79 | 13.4%), and self-employed (incorporated) (40 | 6.8%) make up the most common classes of employment.
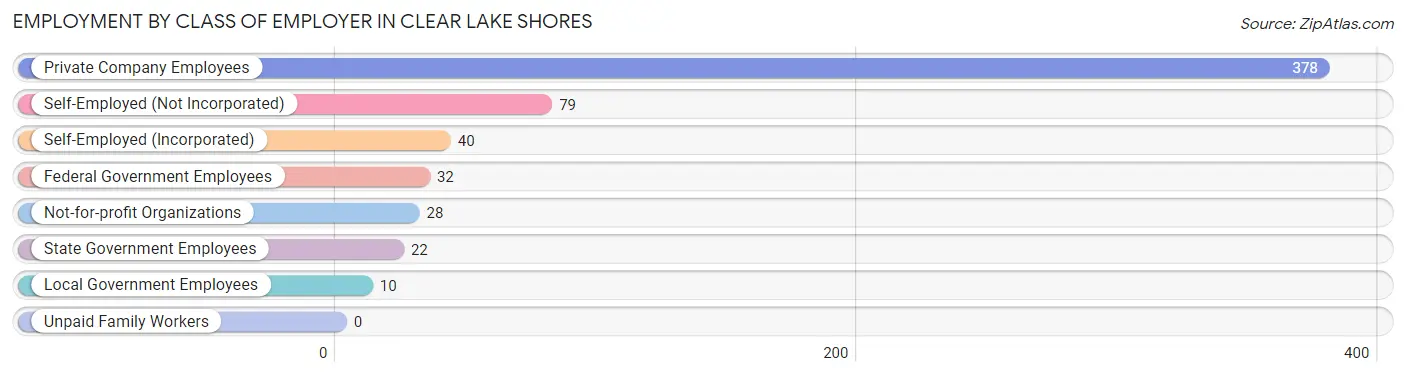
| Employer Class | # Employees | % Employees |
| Private Company Employees | 378 | 64.2% |
| Self-Employed (Incorporated) | 40 | 6.8% |
| Self-Employed (Not Incorporated) | 79 | 13.4% |
| Not-for-profit Organizations | 28 | 4.8% |
| Local Government Employees | 10 | 1.7% |
| State Government Employees | 22 | 3.7% |
| Federal Government Employees | 32 | 5.4% |
| Unpaid Family Workers | 0 | 0.0% |
| Total | 589 | 100.0% |
Employment Status by Age in Clear Lake Shores
According to the labor force statistics for Clear Lake Shores, out of the total population over 16 years of age (1,072), 58.7% or 629 individuals are in the labor force, with 5.0% or 31 of them unemployed. The age group with the highest labor force participation rate is 35 to 44 years, with 89.9% or 80 individuals in the labor force. Within the labor force, the 30 to 34 years age range has the highest percentage of unemployed individuals, with 26.7% or 4 of them being unemployed.
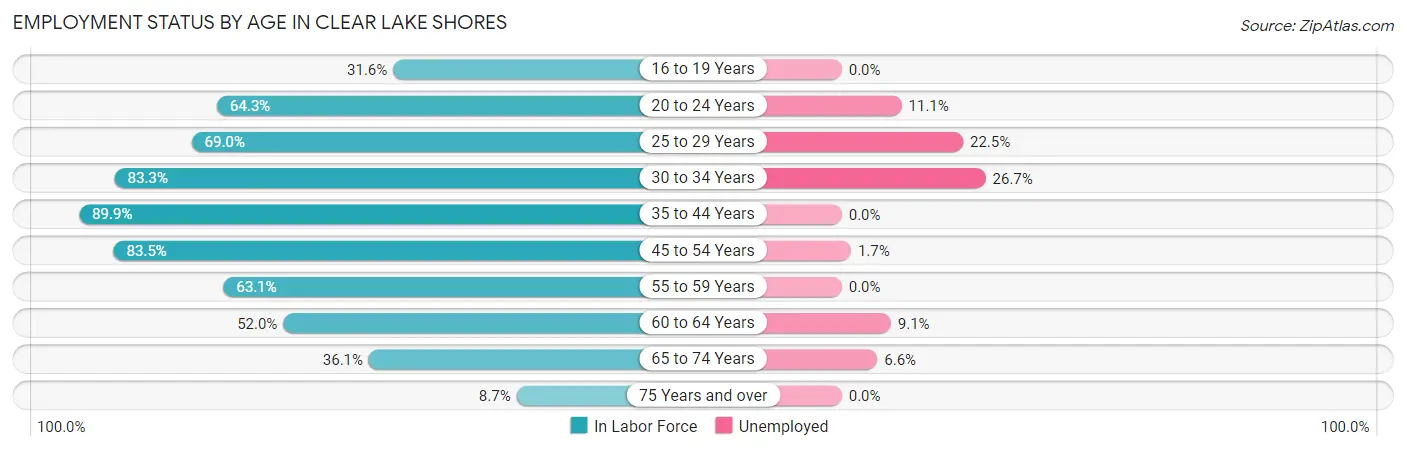
| Age Bracket | In Labor Force | Unemployed |
| 16 to 19 Years | 12 (31.6%) | 0 (0.0%) |
| 20 to 24 Years | 27 (64.3%) | 3 (11.1%) |
| 25 to 29 Years | 40 (69.0%) | 9 (22.5%) |
| 30 to 34 Years | 15 (83.3%) | 4 (26.7%) |
| 35 to 44 Years | 80 (89.9%) | 0 (0.0%) |
| 45 to 54 Years | 237 (83.5%) | 4 (1.7%) |
| 55 to 59 Years | 70 (63.1%) | 0 (0.0%) |
| 60 to 64 Years | 77 (52.0%) | 7 (9.1%) |
| 65 to 74 Years | 61 (36.1%) | 4 (6.6%) |
| 75 Years and over | 10 (8.7%) | 0 (0.0%) |
| Total | 629 (58.7%) | 31 (5.0%) |
Employment Status by Educational Attainment in Clear Lake Shores
According to labor force statistics for Clear Lake Shores, 73.3% of individuals (519) out of the total population between 25 and 64 years of age (708) are in the labor force, with 4.7% or 24 of them being unemployed. The group with the highest labor force participation rate are those with the educational attainment of high school diploma, with 83.2% or 89 individuals in the labor force. Within the labor force, individuals with bachelor's degree or higher education have the highest percentage of unemployment, with 7.6% or 20 of them being unemployed.
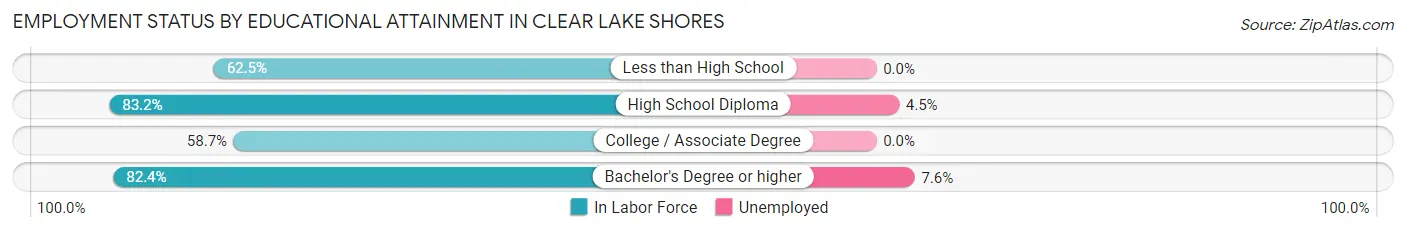
| Educational Attainment | In Labor Force | Unemployed |
| Less than High School | 5 (62.5%) | 0 (0.0%) |
| High School Diploma | 89 (83.2%) | 5 (4.5%) |
| College / Associate Degree | 158 (58.7%) | 0 (0.0%) |
| Bachelor's Degree or higher | 267 (82.4%) | 25 (7.6%) |
| Total | 519 (73.3%) | 33 (4.7%) |
Employment Occupations by Sex in Clear Lake Shores
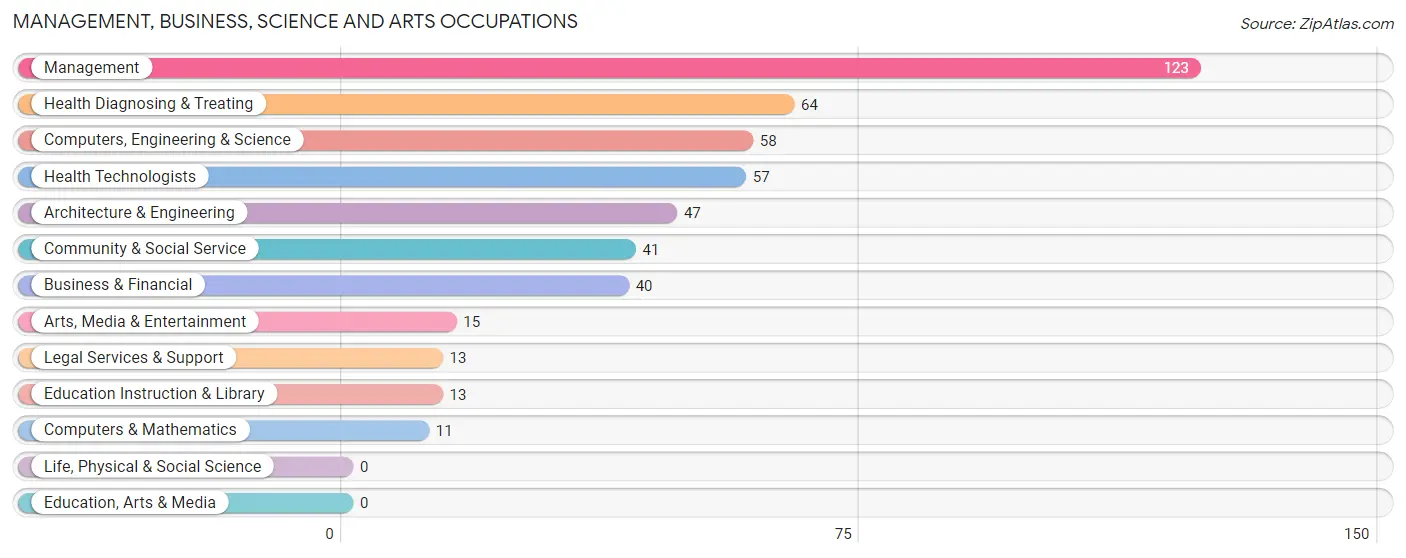
Management, Business, Science and Arts Occupations
The most common Management, Business, Science and Arts occupations in Clear Lake Shores are Management (123 | 20.7%), Health Diagnosing & Treating (64 | 10.8%), Computers, Engineering & Science (58 | 9.8%), Health Technologists (57 | 9.6%), and Architecture & Engineering (47 | 7.9%).
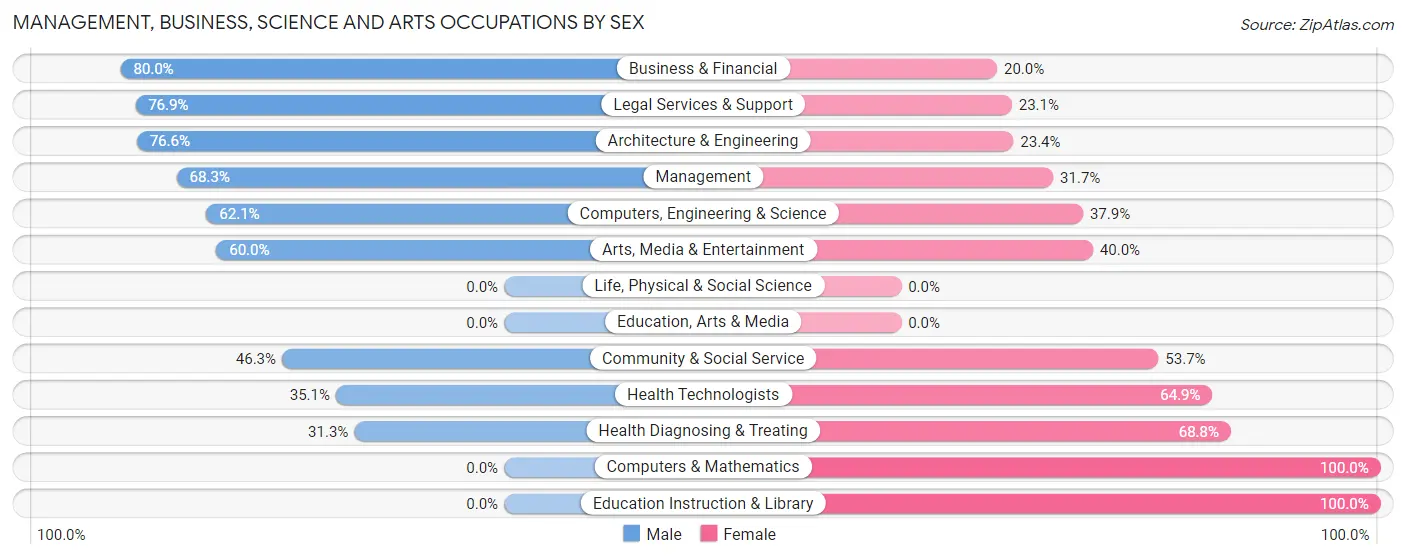
Management, Business, Science and Arts Occupations by Sex
Within the Management, Business, Science and Arts occupations in Clear Lake Shores, the most male-oriented occupations are Business & Financial (80.0%), Legal Services & Support (76.9%), and Architecture & Engineering (76.6%), while the most female-oriented occupations are Computers & Mathematics (100.0%), Education Instruction & Library (100.0%), and Health Diagnosing & Treating (68.8%).
| Occupation | Male | Female |
| Management | 84 (68.3%) | 39 (31.7%) |
| Business & Financial | 32 (80.0%) | 8 (20.0%) |
| Computers, Engineering & Science | 36 (62.1%) | 22 (37.9%) |
| Computers & Mathematics | 0 (0.0%) | 11 (100.0%) |
| Architecture & Engineering | 36 (76.6%) | 11 (23.4%) |
| Life, Physical & Social Science | 0 (0.0%) | 0 (0.0%) |
| Community & Social Service | 19 (46.3%) | 22 (53.7%) |
| Education, Arts & Media | 0 (0.0%) | 0 (0.0%) |
| Legal Services & Support | 10 (76.9%) | 3 (23.1%) |
| Education Instruction & Library | 0 (0.0%) | 13 (100.0%) |
| Arts, Media & Entertainment | 9 (60.0%) | 6 (40.0%) |
| Health Diagnosing & Treating | 20 (31.2%) | 44 (68.8%) |
| Health Technologists | 20 (35.1%) | 37 (64.9%) |
| Total (Category) | 191 (58.6%) | 135 (41.4%) |
| Total (Overall) | 346 (58.2%) | 249 (41.8%) |
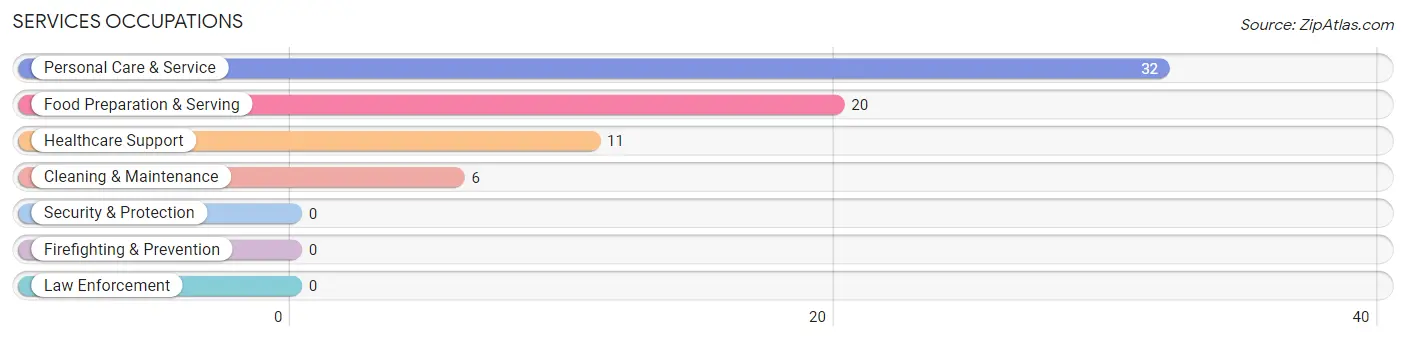
Services Occupations
The most common Services occupations in Clear Lake Shores are Personal Care & Service (32 | 5.4%), Food Preparation & Serving (20 | 3.4%), Healthcare Support (11 | 1.8%), and Cleaning & Maintenance (6 | 1.0%).
Services Occupations by Sex
Within the Services occupations in Clear Lake Shores, the most male-oriented occupations are Cleaning & Maintenance (100.0%), Personal Care & Service (59.4%), and Food Preparation & Serving (30.0%), while the most female-oriented occupations are Healthcare Support (100.0%), Food Preparation & Serving (70.0%), and Personal Care & Service (40.6%).
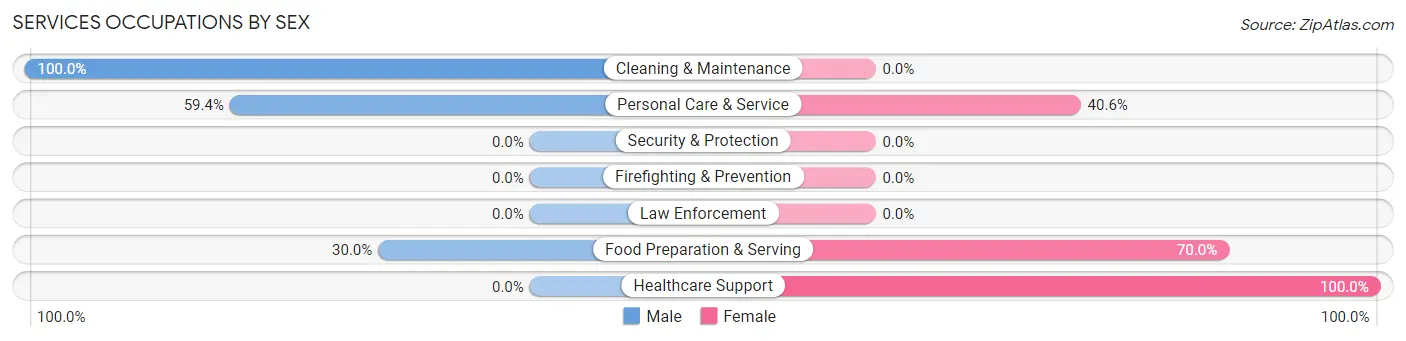
| Occupation | Male | Female |
| Healthcare Support | 0 (0.0%) | 11 (100.0%) |
| Security & Protection | 0 (0.0%) | 0 (0.0%) |
| Firefighting & Prevention | 0 (0.0%) | 0 (0.0%) |
| Law Enforcement | 0 (0.0%) | 0 (0.0%) |
| Food Preparation & Serving | 6 (30.0%) | 14 (70.0%) |
| Cleaning & Maintenance | 6 (100.0%) | 0 (0.0%) |
| Personal Care & Service | 19 (59.4%) | 13 (40.6%) |
| Total (Category) | 31 (44.9%) | 38 (55.1%) |
| Total (Overall) | 346 (58.2%) | 249 (41.8%) |
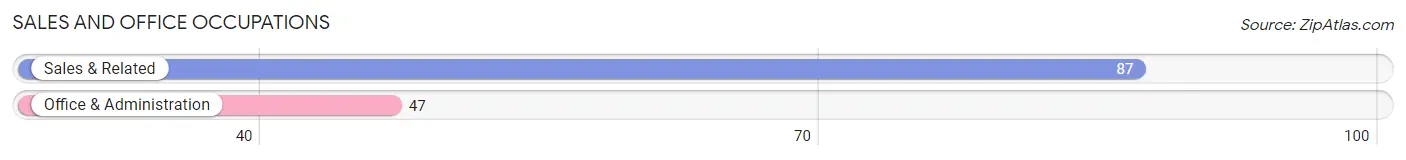
Sales and Office Occupations
The most common Sales and Office occupations in Clear Lake Shores are Sales & Related (87 | 14.6%), and Office & Administration (47 | 7.9%).
Sales and Office Occupations by Sex
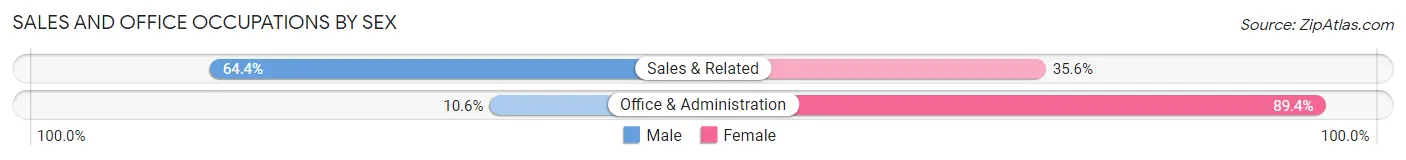
| Occupation | Male | Female |
| Sales & Related | 56 (64.4%) | 31 (35.6%) |
| Office & Administration | 5 (10.6%) | 42 (89.4%) |
| Total (Category) | 61 (45.5%) | 73 (54.5%) |
| Total (Overall) | 346 (58.2%) | 249 (41.8%) |
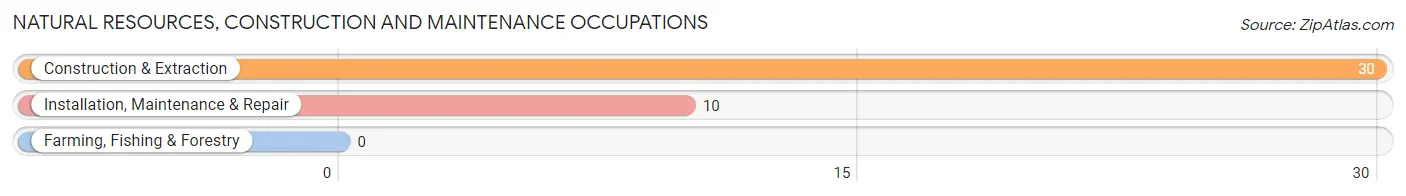
Natural Resources, Construction and Maintenance Occupations
The most common Natural Resources, Construction and Maintenance occupations in Clear Lake Shores are Construction & Extraction (30 | 5.0%), and Installation, Maintenance & Repair (10 | 1.7%).
Natural Resources, Construction and Maintenance Occupations by Sex
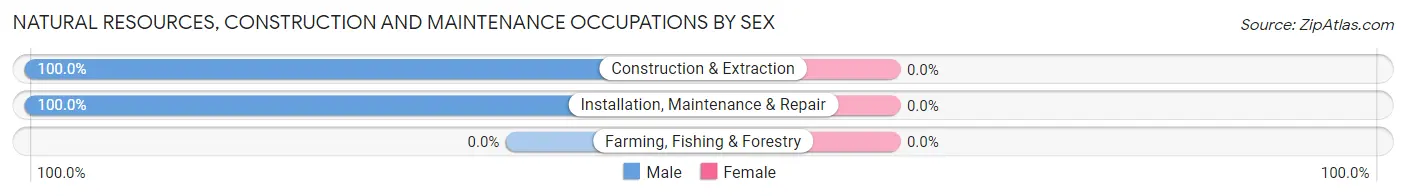
| Occupation | Male | Female |
| Farming, Fishing & Forestry | 0 (0.0%) | 0 (0.0%) |
| Construction & Extraction | 30 (100.0%) | 0 (0.0%) |
| Installation, Maintenance & Repair | 10 (100.0%) | 0 (0.0%) |
| Total (Category) | 40 (100.0%) | 0 (0.0%) |
| Total (Overall) | 346 (58.2%) | 249 (41.8%) |
Production, Transportation and Moving Occupations
The most common Production, Transportation and Moving occupations in Clear Lake Shores are Material Moving (20 | 3.4%), and Transportation (6 | 1.0%).
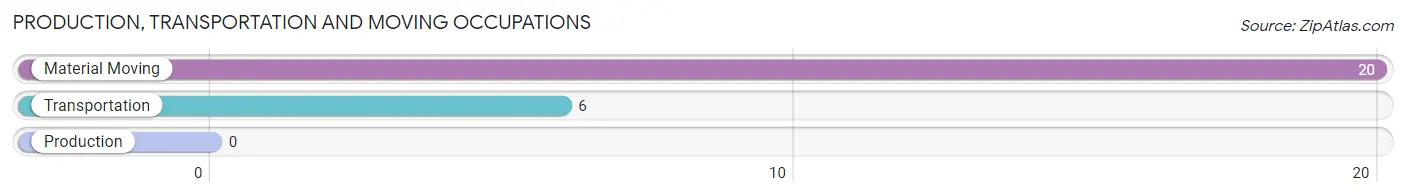
Production, Transportation and Moving Occupations by Sex
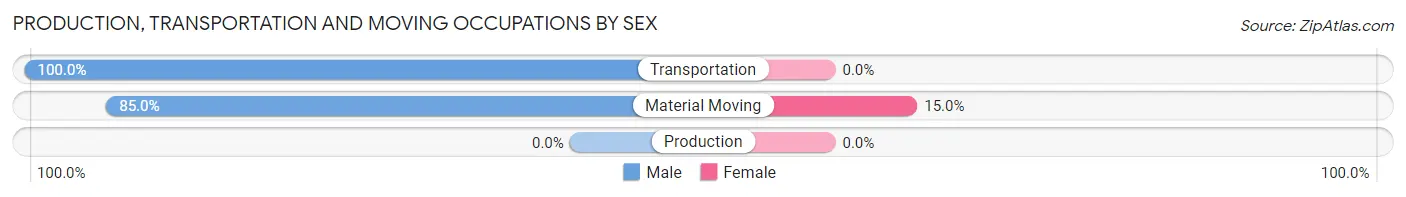
| Occupation | Male | Female |
| Production | 0 (0.0%) | 0 (0.0%) |
| Transportation | 6 (100.0%) | 0 (0.0%) |
| Material Moving | 17 (85.0%) | 3 (15.0%) |
| Total (Category) | 23 (88.5%) | 3 (11.5%) |
| Total (Overall) | 346 (58.2%) | 249 (41.8%) |
Employment Industries by Sex in Clear Lake Shores
Employment Industries in Clear Lake Shores
The major employment industries in Clear Lake Shores include Professional & Scientific (94 | 15.8%), Health Care & Social Assistance (93 | 15.6%), Construction (76 | 12.8%), Retail Trade (54 | 9.1%), and Educational Services (44 | 7.4%).
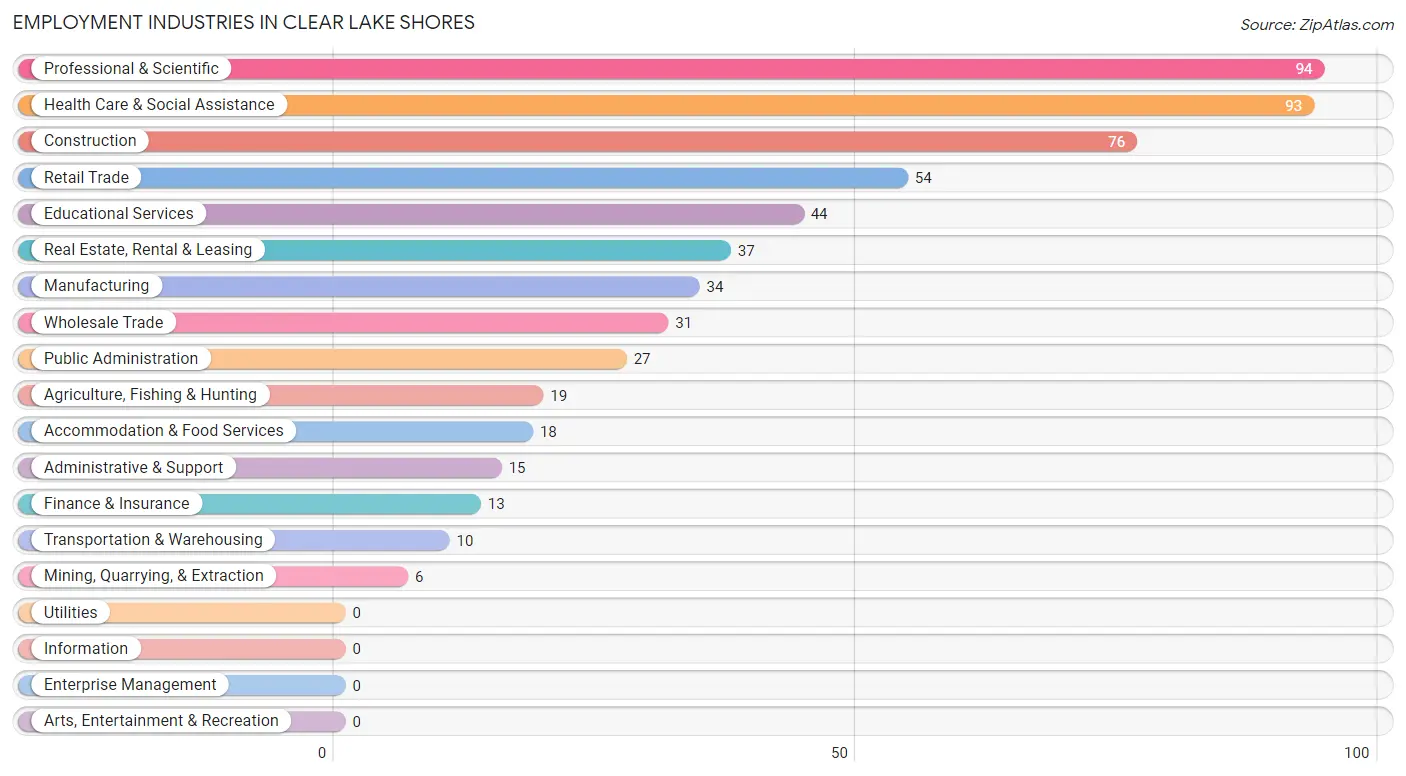
Employment Industries by Sex in Clear Lake Shores
The Clear Lake Shores industries that see more men than women are Agriculture, Fishing & Hunting (100.0%), Mining, Quarrying, & Extraction (100.0%), and Administrative & Support (100.0%), whereas the industries that tend to have a higher number of women are Finance & Insurance (100.0%), Accommodation & Food Services (77.8%), and Real Estate, Rental & Leasing (75.7%).
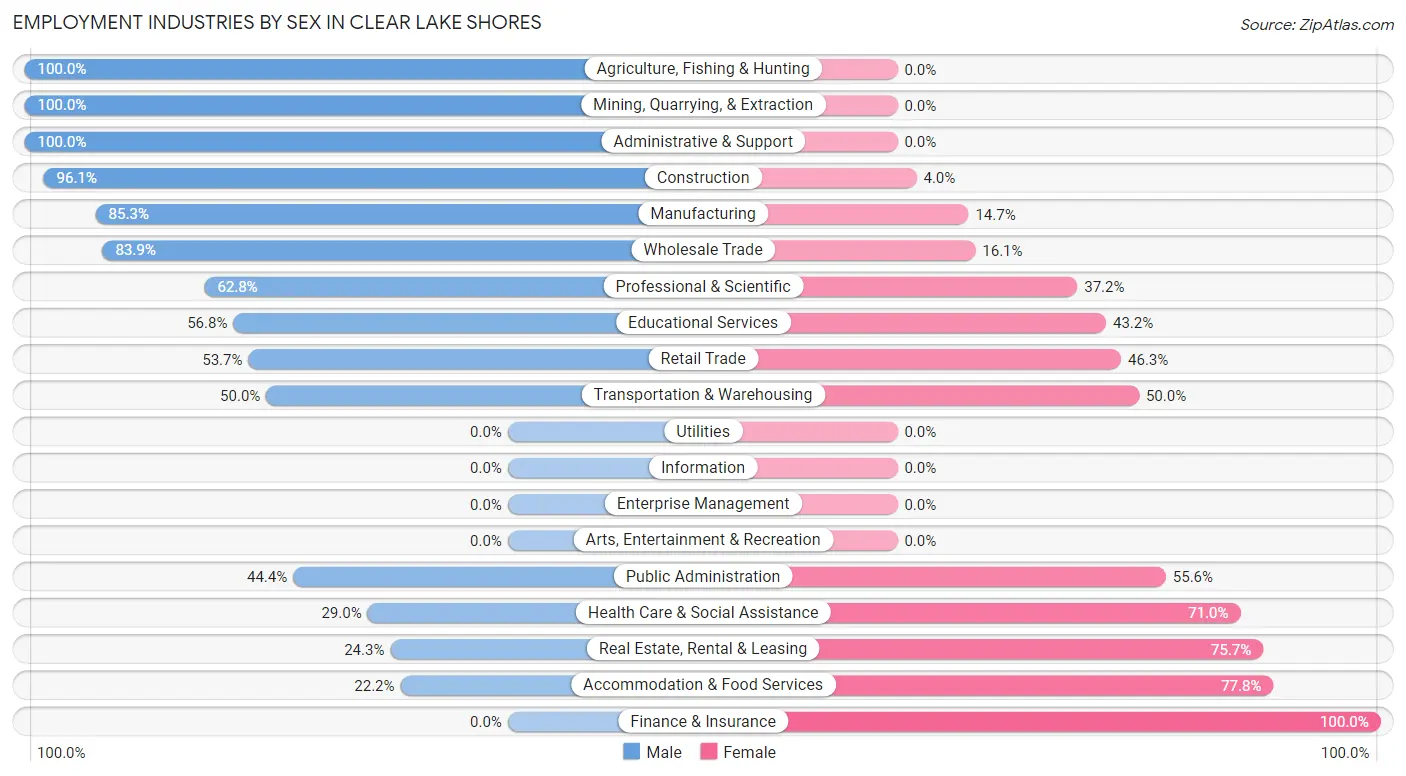
| Industry | Male | Female |
| Agriculture, Fishing & Hunting | 19 (100.0%) | 0 (0.0%) |
| Mining, Quarrying, & Extraction | 6 (100.0%) | 0 (0.0%) |
| Construction | 73 (96.1%) | 3 (4.0%) |
| Manufacturing | 29 (85.3%) | 5 (14.7%) |
| Wholesale Trade | 26 (83.9%) | 5 (16.1%) |
| Retail Trade | 29 (53.7%) | 25 (46.3%) |
| Transportation & Warehousing | 5 (50.0%) | 5 (50.0%) |
| Utilities | 0 (0.0%) | 0 (0.0%) |
| Information | 0 (0.0%) | 0 (0.0%) |
| Finance & Insurance | 0 (0.0%) | 13 (100.0%) |
| Real Estate, Rental & Leasing | 9 (24.3%) | 28 (75.7%) |
| Professional & Scientific | 59 (62.8%) | 35 (37.2%) |
| Enterprise Management | 0 (0.0%) | 0 (0.0%) |
| Administrative & Support | 15 (100.0%) | 0 (0.0%) |
| Educational Services | 25 (56.8%) | 19 (43.2%) |
| Health Care & Social Assistance | 27 (29.0%) | 66 (71.0%) |
| Arts, Entertainment & Recreation | 0 (0.0%) | 0 (0.0%) |
| Accommodation & Food Services | 4 (22.2%) | 14 (77.8%) |
| Public Administration | 12 (44.4%) | 15 (55.6%) |
| Total | 346 (58.2%) | 249 (41.8%) |
Education in Clear Lake Shores
School Enrollment in Clear Lake Shores
The most common levels of schooling among the 244 students in Clear Lake Shores are college / undergraduate (95 | 38.9%), high school (60 | 24.6%), and middle school (56 | 23.0%).
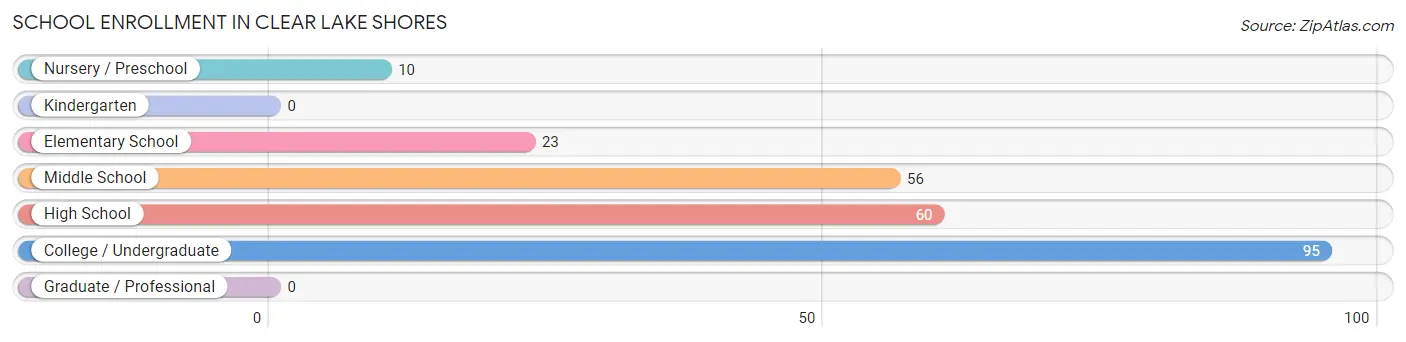
| School Level | # Students | % Students |
| Nursery / Preschool | 10 | 4.1% |
| Kindergarten | 0 | 0.0% |
| Elementary School | 23 | 9.4% |
| Middle School | 56 | 23.0% |
| High School | 60 | 24.6% |
| College / Undergraduate | 95 | 38.9% |
| Graduate / Professional | 0 | 0.0% |
| Total | 244 | 100.0% |
School Enrollment by Age by Funding Source in Clear Lake Shores
Out of a total of 244 students who are enrolled in schools in Clear Lake Shores, 11 (4.5%) attend a private institution, while the remaining 233 (95.5%) are enrolled in public schools. The age group of 20 to 24 year olds has the highest likelihood of being enrolled in private schools, with 11 (34.4% in the age bracket) enrolled. Conversely, the age group of 3 to 4 year olds has the lowest likelihood of being enrolled in a private school, with 10 (100.0% in the age bracket) attending a public institution.
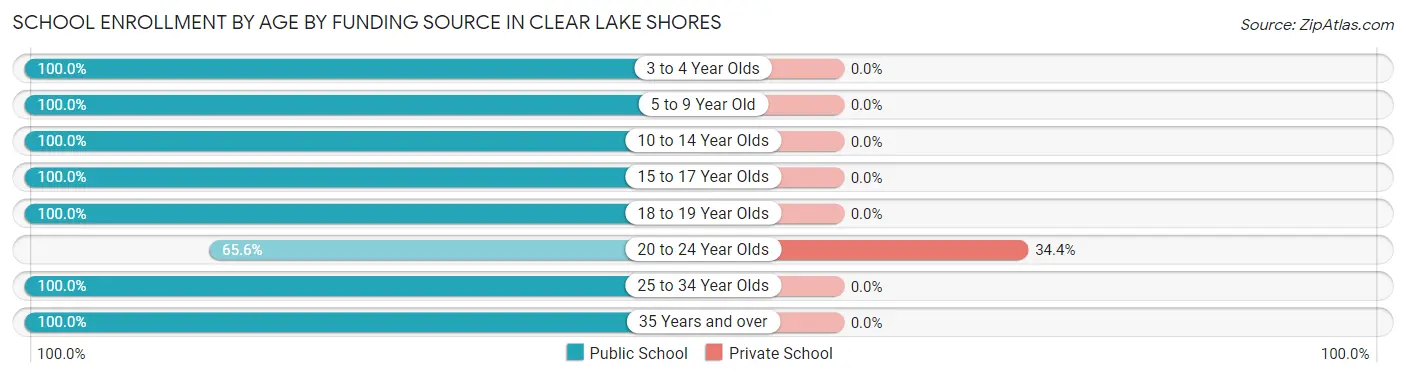
| Age Bracket | Public School | Private School |
| 3 to 4 Year Olds | 10 (100.0%) | 0 (0.0%) |
| 5 to 9 Year Old | 17 (100.0%) | 0 (0.0%) |
| 10 to 14 Year Olds | 82 (100.0%) | 0 (0.0%) |
| 15 to 17 Year Olds | 37 (100.0%) | 0 (0.0%) |
| 18 to 19 Year Olds | 15 (100.0%) | 0 (0.0%) |
| 20 to 24 Year Olds | 21 (65.6%) | 11 (34.4%) |
| 25 to 34 Year Olds | 36 (100.0%) | 0 (0.0%) |
| 35 Years and over | 15 (100.0%) | 0 (0.0%) |
| Total | 233 (95.5%) | 11 (4.5%) |
Educational Attainment by Field of Study in Clear Lake Shores
Business (111 | 22.8%), engineering (83 | 17.0%), bio, nature & agricultural (75 | 15.4%), science & technology (43 | 8.8%), and social sciences (40 | 8.2%) are the most common fields of study among 488 individuals in Clear Lake Shores who have obtained a bachelor's degree or higher.
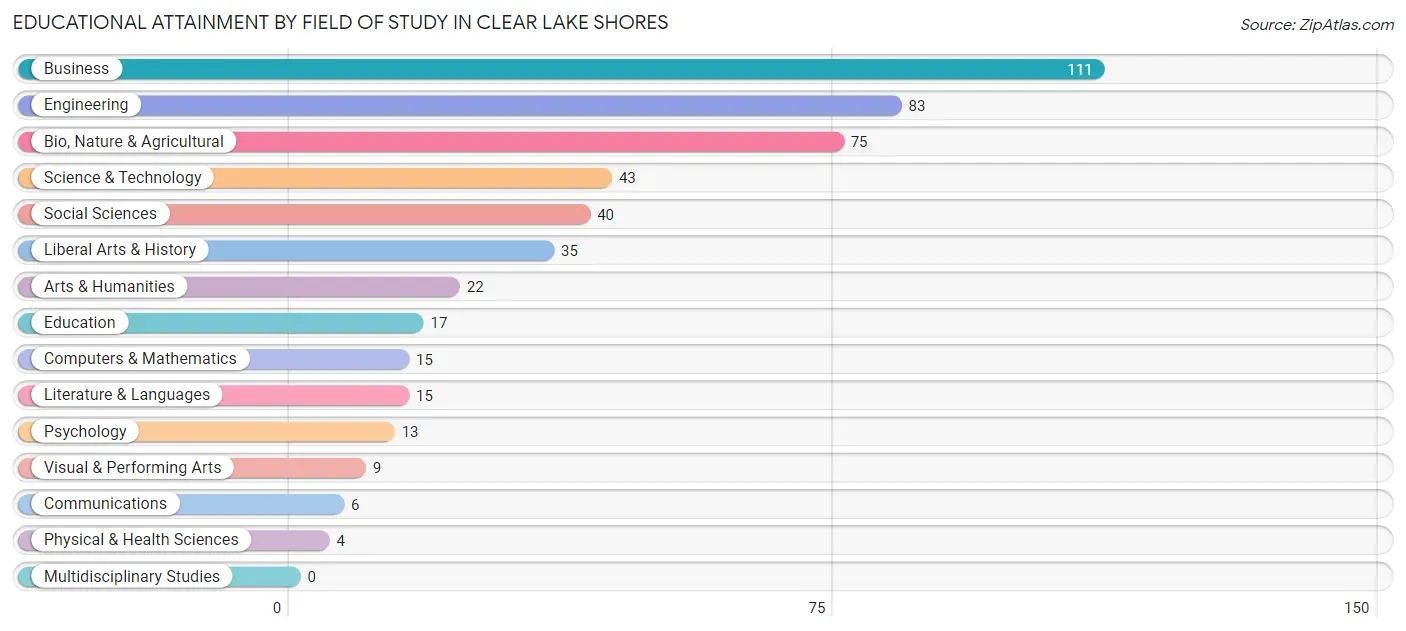
| Field of Study | # Graduates | % Graduates |
| Computers & Mathematics | 15 | 3.1% |
| Bio, Nature & Agricultural | 75 | 15.4% |
| Physical & Health Sciences | 4 | 0.8% |
| Psychology | 13 | 2.7% |
| Social Sciences | 40 | 8.2% |
| Engineering | 83 | 17.0% |
| Multidisciplinary Studies | 0 | 0.0% |
| Science & Technology | 43 | 8.8% |
| Business | 111 | 22.8% |
| Education | 17 | 3.5% |
| Literature & Languages | 15 | 3.1% |
| Liberal Arts & History | 35 | 7.2% |
| Visual & Performing Arts | 9 | 1.8% |
| Communications | 6 | 1.2% |
| Arts & Humanities | 22 | 4.5% |
| Total | 488 | 100.0% |
Transportation & Commute in Clear Lake Shores
Vehicle Availability by Sex in Clear Lake Shores
The most prevalent vehicle ownership categories in Clear Lake Shores are males with 2 vehicles (183, accounting for 52.9%) and females with 2 vehicles (87, making up 75.3%).
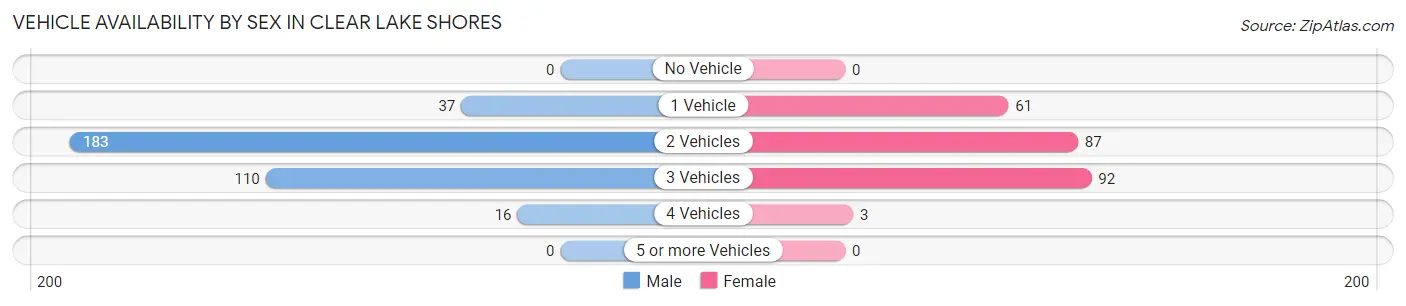
| Vehicles Available | Male | Female |
| No Vehicle | 0 (0.0%) | 0 (0.0%) |
| 1 Vehicle | 37 (10.7%) | 61 (25.1%) |
| 2 Vehicles | 183 (52.9%) | 87 (35.8%) |
| 3 Vehicles | 110 (31.8%) | 92 (37.9%) |
| 4 Vehicles | 16 (4.6%) | 3 (1.2%) |
| 5 or more Vehicles | 0 (0.0%) | 0 (0.0%) |
| Total | 346 (100.0%) | 243 (100.0%) |
Commute Time in Clear Lake Shores
The most frequently occuring commute durations in Clear Lake Shores are 20 to 24 minutes (93 commuters, 18.0%), 30 to 34 minutes (76 commuters, 14.7%), and 10 to 14 minutes (75 commuters, 14.5%).
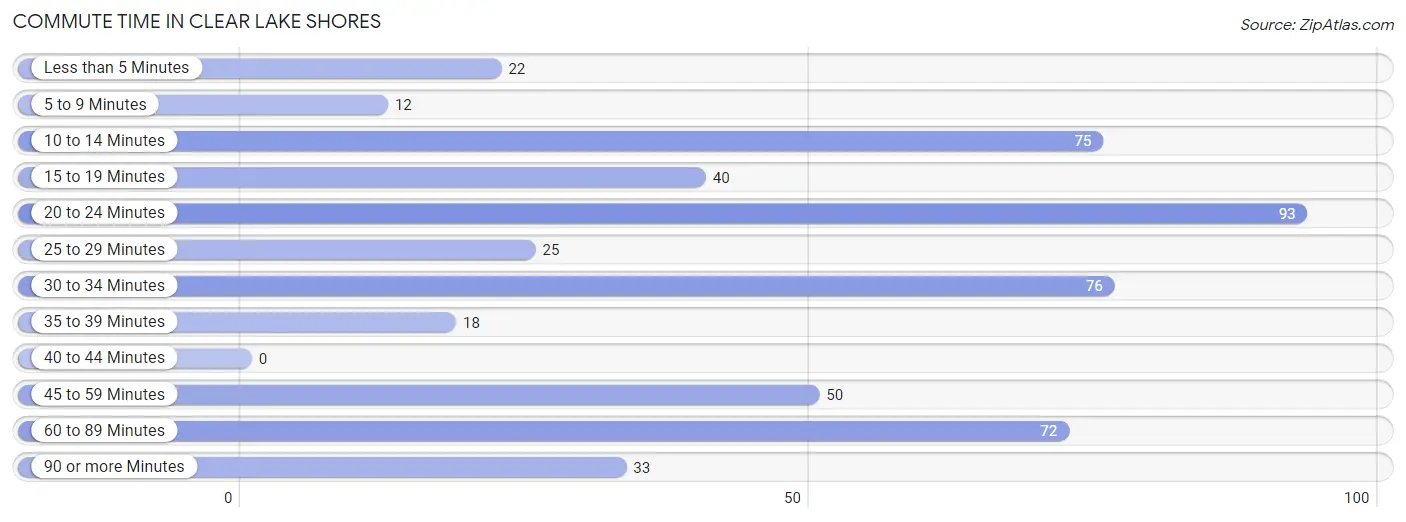
| Commute Time | # Commuters | % Commuters |
| Less than 5 Minutes | 22 | 4.3% |
| 5 to 9 Minutes | 12 | 2.3% |
| 10 to 14 Minutes | 75 | 14.5% |
| 15 to 19 Minutes | 40 | 7.7% |
| 20 to 24 Minutes | 93 | 18.0% |
| 25 to 29 Minutes | 25 | 4.8% |
| 30 to 34 Minutes | 76 | 14.7% |
| 35 to 39 Minutes | 18 | 3.5% |
| 40 to 44 Minutes | 0 | 0.0% |
| 45 to 59 Minutes | 50 | 9.7% |
| 60 to 89 Minutes | 72 | 14.0% |
| 90 or more Minutes | 33 | 6.4% |
Commute Time by Sex in Clear Lake Shores
The most common commute times in Clear Lake Shores are 60 to 89 minutes (51 commuters, 17.4%) for males and 20 to 24 minutes (44 commuters, 19.7%) for females.
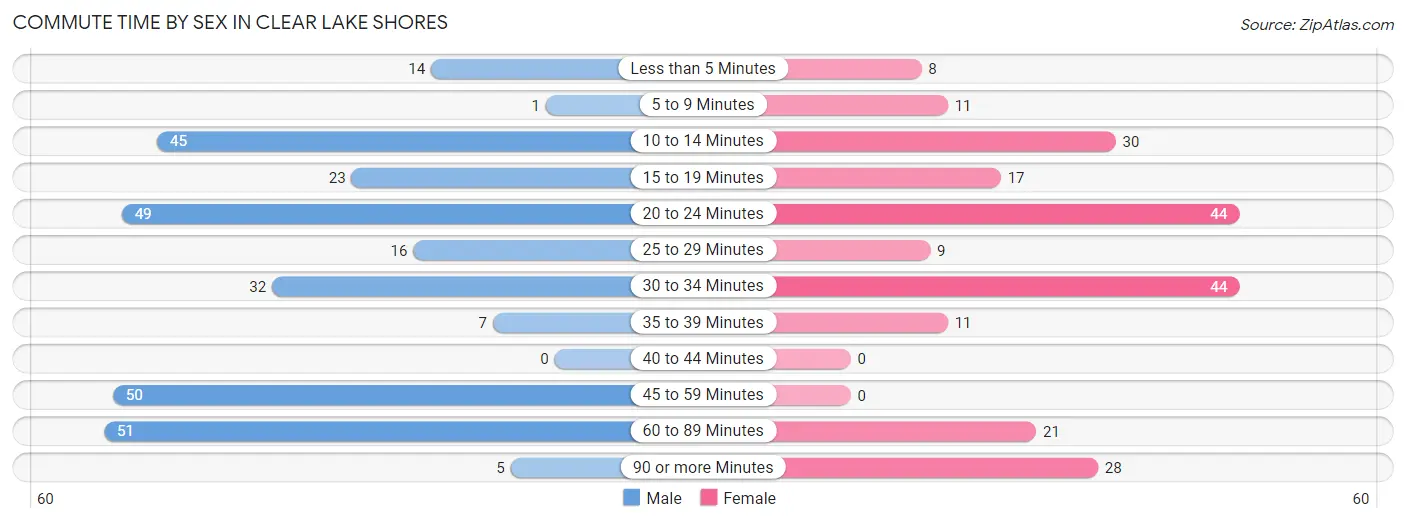
| Commute Time | Male | Female |
| Less than 5 Minutes | 14 (4.8%) | 8 (3.6%) |
| 5 to 9 Minutes | 1 (0.3%) | 11 (4.9%) |
| 10 to 14 Minutes | 45 (15.4%) | 30 (13.5%) |
| 15 to 19 Minutes | 23 (7.9%) | 17 (7.6%) |
| 20 to 24 Minutes | 49 (16.7%) | 44 (19.7%) |
| 25 to 29 Minutes | 16 (5.5%) | 9 (4.0%) |
| 30 to 34 Minutes | 32 (10.9%) | 44 (19.7%) |
| 35 to 39 Minutes | 7 (2.4%) | 11 (4.9%) |
| 40 to 44 Minutes | 0 (0.0%) | 0 (0.0%) |
| 45 to 59 Minutes | 50 (17.1%) | 0 (0.0%) |
| 60 to 89 Minutes | 51 (17.4%) | 21 (9.4%) |
| 90 or more Minutes | 5 (1.7%) | 28 (12.6%) |
Time of Departure to Work by Sex in Clear Lake Shores
The most frequent times of departure to work in Clear Lake Shores are 8:00 AM to 8:29 AM (65, 22.2%) for males and 7:30 AM to 7:59 AM (38, 17.0%) for females.
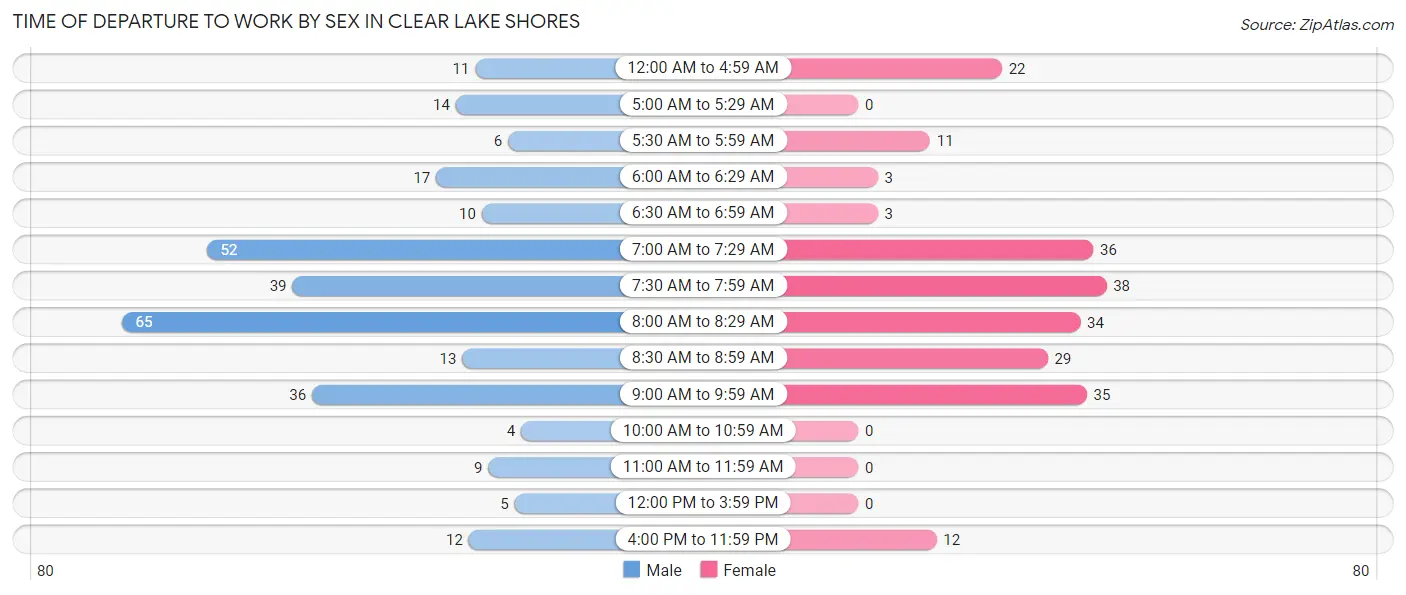
| Time of Departure | Male | Female |
| 12:00 AM to 4:59 AM | 11 (3.7%) | 22 (9.9%) |
| 5:00 AM to 5:29 AM | 14 (4.8%) | 0 (0.0%) |
| 5:30 AM to 5:59 AM | 6 (2.1%) | 11 (4.9%) |
| 6:00 AM to 6:29 AM | 17 (5.8%) | 3 (1.3%) |
| 6:30 AM to 6:59 AM | 10 (3.4%) | 3 (1.3%) |
| 7:00 AM to 7:29 AM | 52 (17.7%) | 36 (16.1%) |
| 7:30 AM to 7:59 AM | 39 (13.3%) | 38 (17.0%) |
| 8:00 AM to 8:29 AM | 65 (22.2%) | 34 (15.2%) |
| 8:30 AM to 8:59 AM | 13 (4.4%) | 29 (13.0%) |
| 9:00 AM to 9:59 AM | 36 (12.3%) | 35 (15.7%) |
| 10:00 AM to 10:59 AM | 4 (1.4%) | 0 (0.0%) |
| 11:00 AM to 11:59 AM | 9 (3.1%) | 0 (0.0%) |
| 12:00 PM to 3:59 PM | 5 (1.7%) | 0 (0.0%) |
| 4:00 PM to 11:59 PM | 12 (4.1%) | 12 (5.4%) |
| Total | 293 (100.0%) | 223 (100.0%) |
Housing Occupancy in Clear Lake Shores
Occupancy by Ownership in Clear Lake Shores
Of the total 549 dwellings in Clear Lake Shores, owner-occupied units account for 461 (84.0%), while renter-occupied units make up 88 (16.0%).
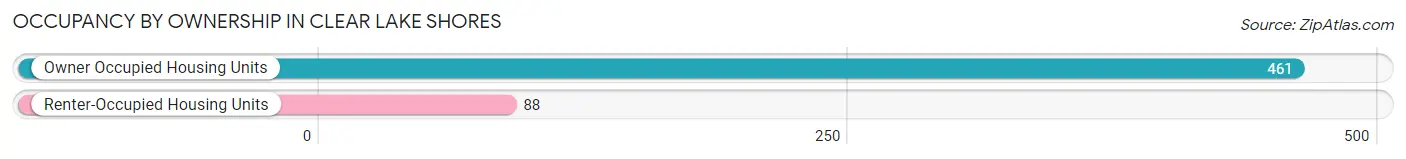
| Occupancy | # Housing Units | % Housing Units |
| Owner Occupied Housing Units | 461 | 84.0% |
| Renter-Occupied Housing Units | 88 | 16.0% |
| Total Occupied Housing Units | 549 | 100.0% |
Occupancy by Household Size in Clear Lake Shores
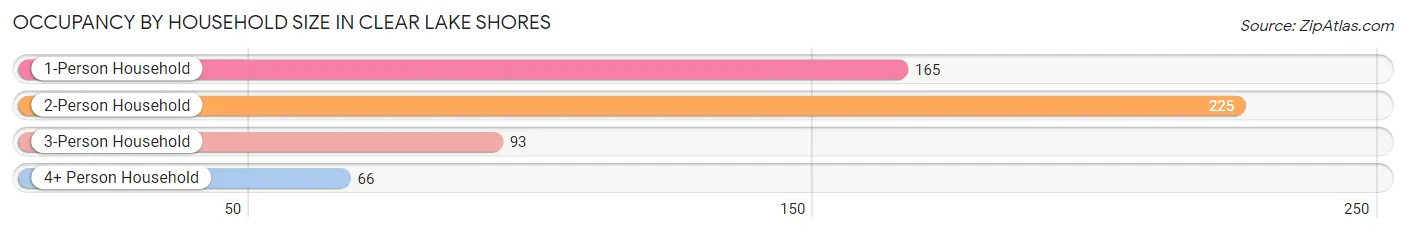
| Household Size | # Housing Units | % Housing Units |
| 1-Person Household | 165 | 30.0% |
| 2-Person Household | 225 | 41.0% |
| 3-Person Household | 93 | 16.9% |
| 4+ Person Household | 66 | 12.0% |
| Total Housing Units | 549 | 100.0% |
Occupancy by Ownership by Household Size in Clear Lake Shores
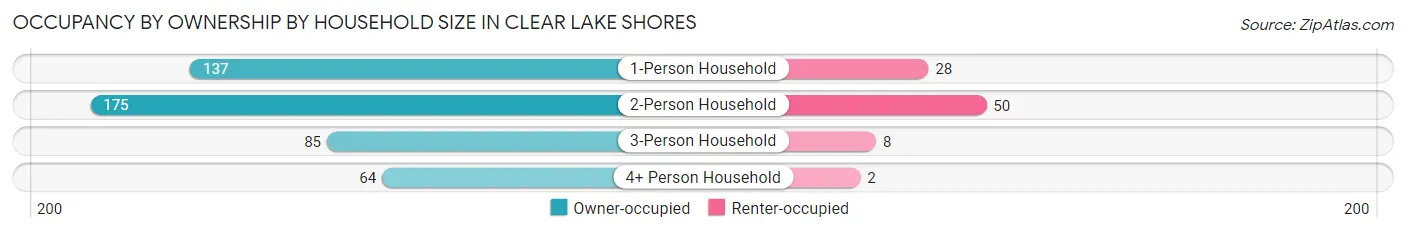
| Household Size | Owner-occupied | Renter-occupied |
| 1-Person Household | 137 (83.0%) | 28 (17.0%) |
| 2-Person Household | 175 (77.8%) | 50 (22.2%) |
| 3-Person Household | 85 (91.4%) | 8 (8.6%) |
| 4+ Person Household | 64 (97.0%) | 2 (3.0%) |
| Total Housing Units | 461 (84.0%) | 88 (16.0%) |
Occupancy by Educational Attainment in Clear Lake Shores
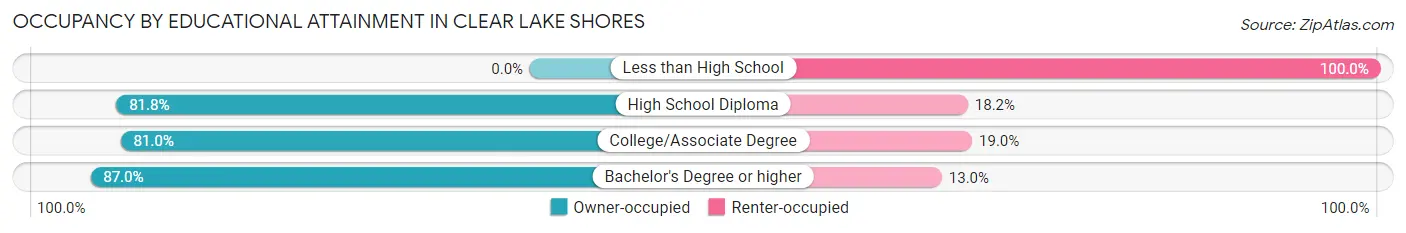
| Household Size | Owner-occupied | Renter-occupied |
| Less than High School | 0 (0.0%) | 3 (100.0%) |
| High School Diploma | 45 (81.8%) | 10 (18.2%) |
| College/Associate Degree | 149 (81.0%) | 35 (19.0%) |
| Bachelor's Degree or higher | 267 (87.0%) | 40 (13.0%) |
Occupancy by Age of Householder in Clear Lake Shores
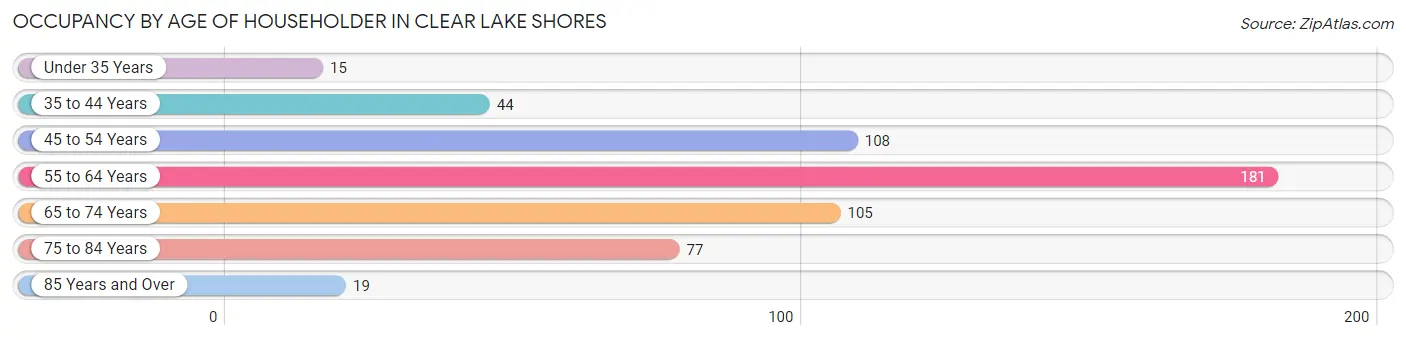
| Age Bracket | # Households | % Households |
| Under 35 Years | 15 | 2.7% |
| 35 to 44 Years | 44 | 8.0% |
| 45 to 54 Years | 108 | 19.7% |
| 55 to 64 Years | 181 | 33.0% |
| 65 to 74 Years | 105 | 19.1% |
| 75 to 84 Years | 77 | 14.0% |
| 85 Years and Over | 19 | 3.5% |
| Total | 549 | 100.0% |
Housing Finances in Clear Lake Shores
Median Income by Occupancy in Clear Lake Shores
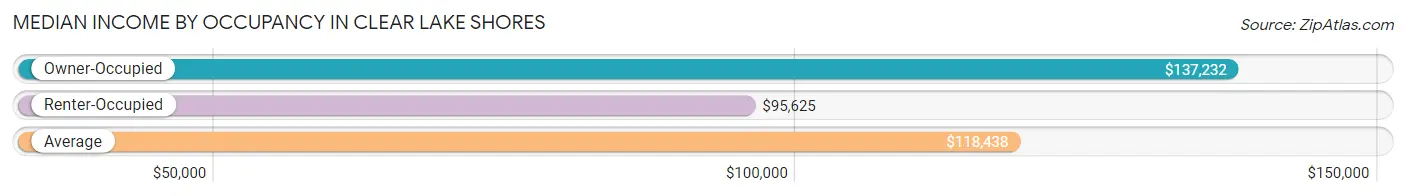
| Occupancy Type | # Households | Median Income |
| Owner-Occupied | 461 (84.0%) | $137,232 |
| Renter-Occupied | 88 (16.0%) | $95,625 |
| Average | 549 (100.0%) | $118,438 |
Occupancy by Householder Income Bracket in Clear Lake Shores
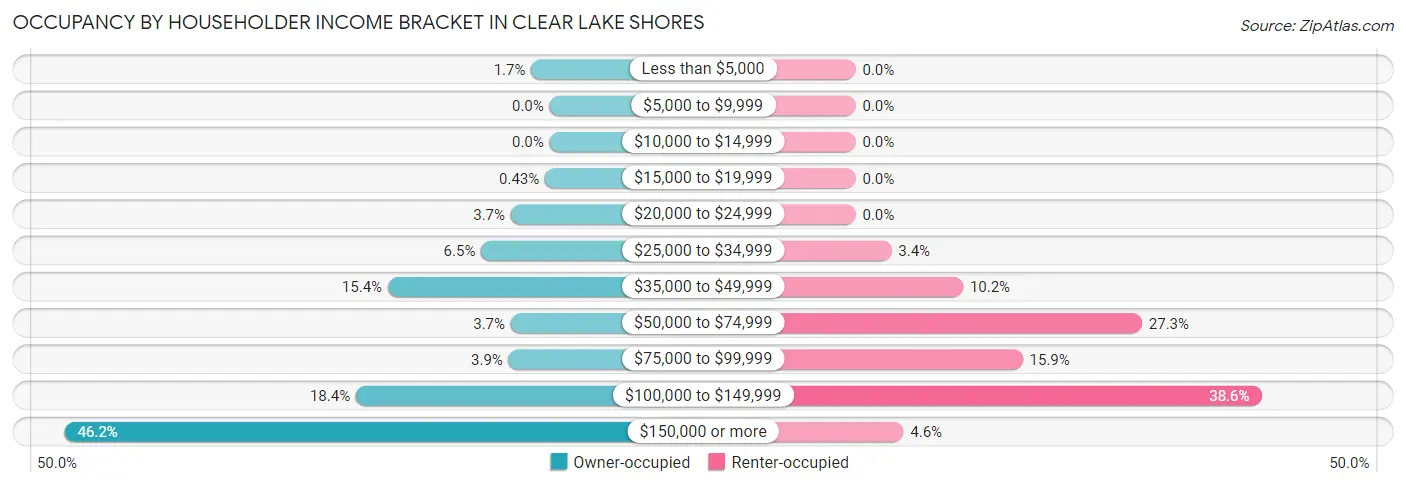
| Income Bracket | Owner-occupied | Renter-occupied |
| Less than $5,000 | 8 (1.7%) | 0 (0.0%) |
| $5,000 to $9,999 | 0 (0.0%) | 0 (0.0%) |
| $10,000 to $14,999 | 0 (0.0%) | 0 (0.0%) |
| $15,000 to $19,999 | 2 (0.4%) | 0 (0.0%) |
| $20,000 to $24,999 | 17 (3.7%) | 0 (0.0%) |
| $25,000 to $34,999 | 30 (6.5%) | 3 (3.4%) |
| $35,000 to $49,999 | 71 (15.4%) | 9 (10.2%) |
| $50,000 to $74,999 | 17 (3.7%) | 24 (27.3%) |
| $75,000 to $99,999 | 18 (3.9%) | 14 (15.9%) |
| $100,000 to $149,999 | 85 (18.4%) | 34 (38.6%) |
| $150,000 or more | 213 (46.2%) | 4 (4.5%) |
| Total | 461 (100.0%) | 88 (100.0%) |
Monthly Housing Cost Tiers in Clear Lake Shores
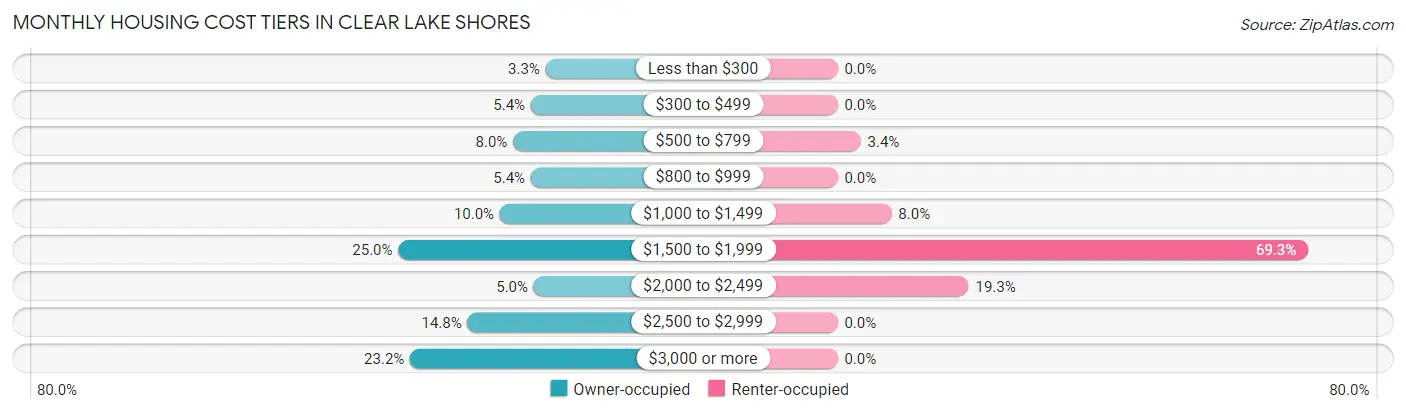
| Monthly Cost | Owner-occupied | Renter-occupied |
| Less than $300 | 15 (3.3%) | 0 (0.0%) |
| $300 to $499 | 25 (5.4%) | 0 (0.0%) |
| $500 to $799 | 37 (8.0%) | 3 (3.4%) |
| $800 to $999 | 25 (5.4%) | 0 (0.0%) |
| $1,000 to $1,499 | 46 (10.0%) | 7 (8.0%) |
| $1,500 to $1,999 | 115 (24.9%) | 61 (69.3%) |
| $2,000 to $2,499 | 23 (5.0%) | 17 (19.3%) |
| $2,500 to $2,999 | 68 (14.7%) | 0 (0.0%) |
| $3,000 or more | 107 (23.2%) | 0 (0.0%) |
| Total | 461 (100.0%) | 88 (100.0%) |
Physical Housing Characteristics in Clear Lake Shores
Housing Structures in Clear Lake Shores
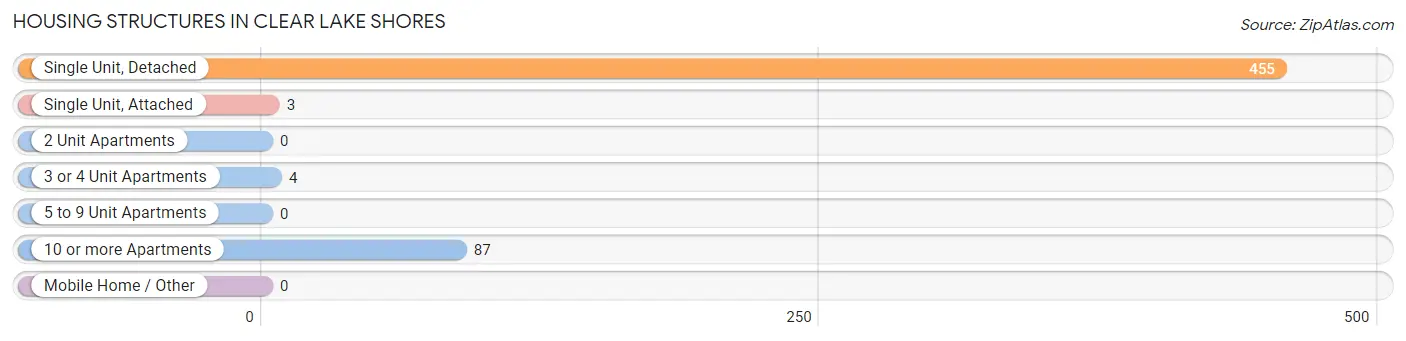
| Structure Type | # Housing Units | % Housing Units |
| Single Unit, Detached | 455 | 82.9% |
| Single Unit, Attached | 3 | 0.5% |
| 2 Unit Apartments | 0 | 0.0% |
| 3 or 4 Unit Apartments | 4 | 0.7% |
| 5 to 9 Unit Apartments | 0 | 0.0% |
| 10 or more Apartments | 87 | 15.9% |
| Mobile Home / Other | 0 | 0.0% |
| Total | 549 | 100.0% |
Housing Structures by Occupancy in Clear Lake Shores
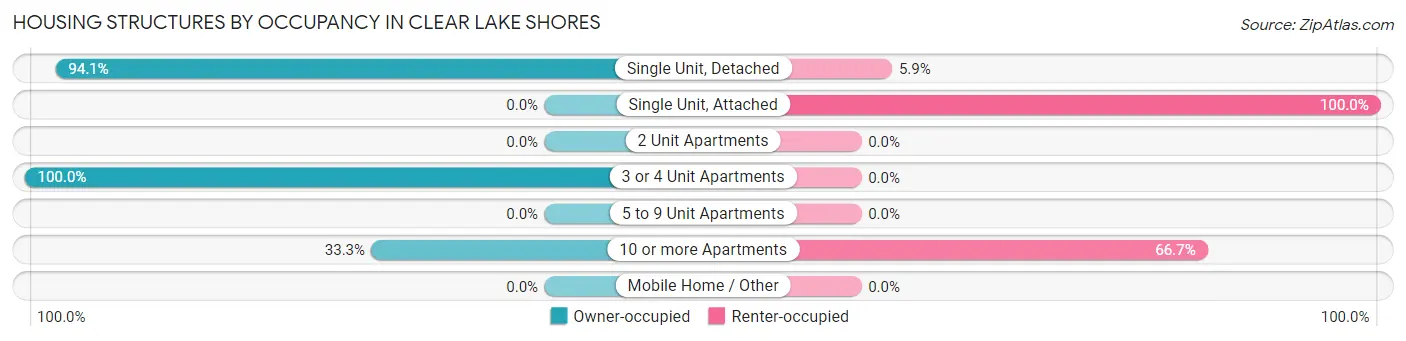
| Structure Type | Owner-occupied | Renter-occupied |
| Single Unit, Detached | 428 (94.1%) | 27 (5.9%) |
| Single Unit, Attached | 0 (0.0%) | 3 (100.0%) |
| 2 Unit Apartments | 0 (0.0%) | 0 (0.0%) |
| 3 or 4 Unit Apartments | 4 (100.0%) | 0 (0.0%) |
| 5 to 9 Unit Apartments | 0 (0.0%) | 0 (0.0%) |
| 10 or more Apartments | 29 (33.3%) | 58 (66.7%) |
| Mobile Home / Other | 0 (0.0%) | 0 (0.0%) |
| Total | 461 (84.0%) | 88 (16.0%) |
Housing Structures by Number of Rooms in Clear Lake Shores
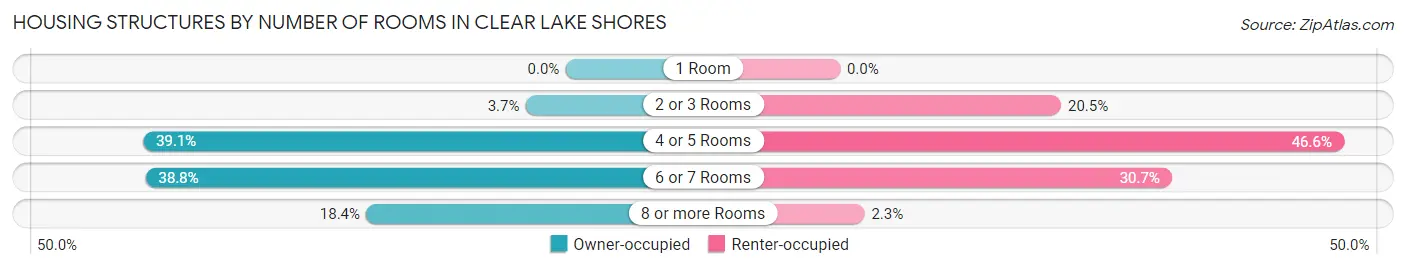
| Number of Rooms | Owner-occupied | Renter-occupied |
| 1 Room | 0 (0.0%) | 0 (0.0%) |
| 2 or 3 Rooms | 17 (3.7%) | 18 (20.4%) |
| 4 or 5 Rooms | 180 (39.1%) | 41 (46.6%) |
| 6 or 7 Rooms | 179 (38.8%) | 27 (30.7%) |
| 8 or more Rooms | 85 (18.4%) | 2 (2.3%) |
| Total | 461 (100.0%) | 88 (100.0%) |
Housing Structure by Heating Type in Clear Lake Shores
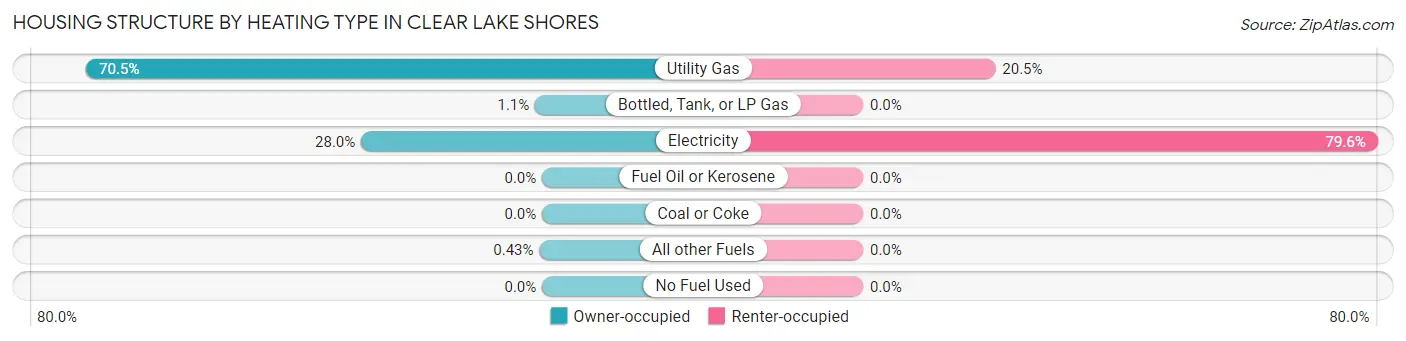
| Heating Type | Owner-occupied | Renter-occupied |
| Utility Gas | 325 (70.5%) | 18 (20.4%) |
| Bottled, Tank, or LP Gas | 5 (1.1%) | 0 (0.0%) |
| Electricity | 129 (28.0%) | 70 (79.5%) |
| Fuel Oil or Kerosene | 0 (0.0%) | 0 (0.0%) |
| Coal or Coke | 0 (0.0%) | 0 (0.0%) |
| All other Fuels | 2 (0.4%) | 0 (0.0%) |
| No Fuel Used | 0 (0.0%) | 0 (0.0%) |
| Total | 461 (100.0%) | 88 (100.0%) |
Household Vehicle Usage in Clear Lake Shores
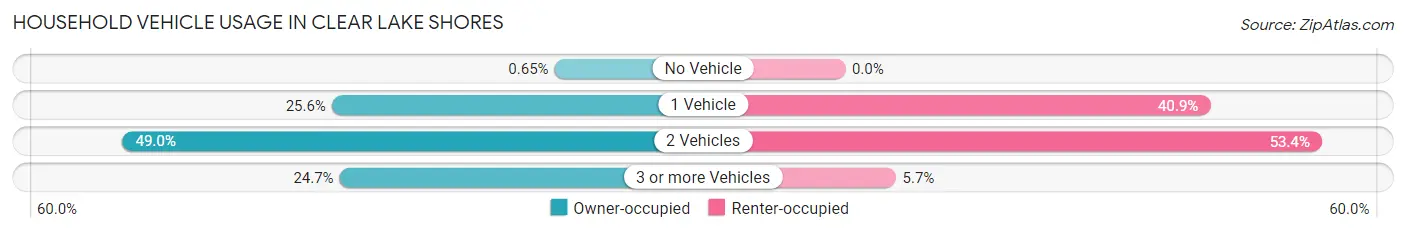
| Vehicles per Household | Owner-occupied | Renter-occupied |
| No Vehicle | 3 (0.6%) | 0 (0.0%) |
| 1 Vehicle | 118 (25.6%) | 36 (40.9%) |
| 2 Vehicles | 226 (49.0%) | 47 (53.4%) |
| 3 or more Vehicles | 114 (24.7%) | 5 (5.7%) |
| Total | 461 (100.0%) | 88 (100.0%) |
Real Estate & Mortgages in Clear Lake Shores
Real Estate and Mortgage Overview in Clear Lake Shores
| Characteristic | Without Mortgage | With Mortgage |
| Housing Units | 201 | 260 |
| Median Property Value | $431,300 | $384,100 |
| Median Household Income | $79,861 | $163 |
| Monthly Housing Costs | $1,008 | $104 |
| Real Estate Taxes | $5,513 | $9 |
Property Value by Mortgage Status in Clear Lake Shores
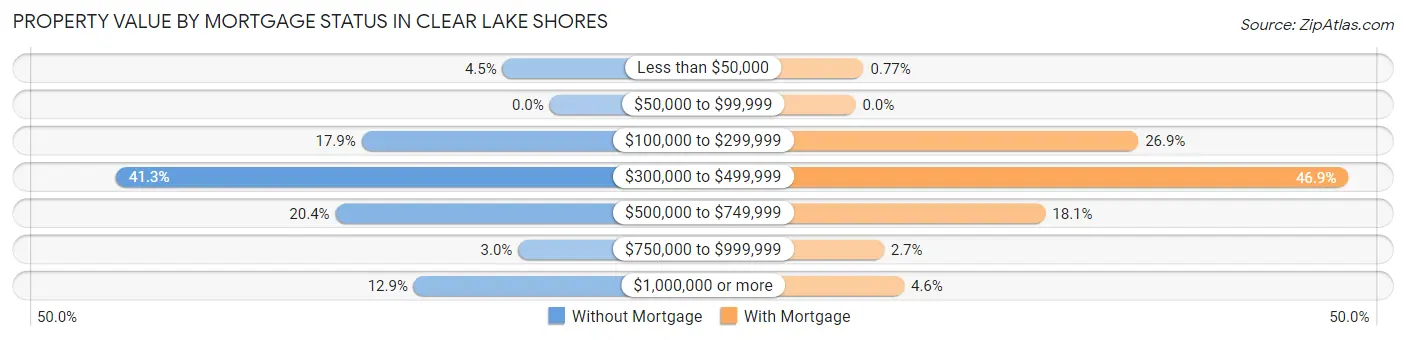
| Property Value | Without Mortgage | With Mortgage |
| Less than $50,000 | 9 (4.5%) | 2 (0.8%) |
| $50,000 to $99,999 | 0 (0.0%) | 0 (0.0%) |
| $100,000 to $299,999 | 36 (17.9%) | 70 (26.9%) |
| $300,000 to $499,999 | 83 (41.3%) | 122 (46.9%) |
| $500,000 to $749,999 | 41 (20.4%) | 47 (18.1%) |
| $750,000 to $999,999 | 6 (3.0%) | 7 (2.7%) |
| $1,000,000 or more | 26 (12.9%) | 12 (4.6%) |
| Total | 201 (100.0%) | 260 (100.0%) |
Household Income by Mortgage Status in Clear Lake Shores
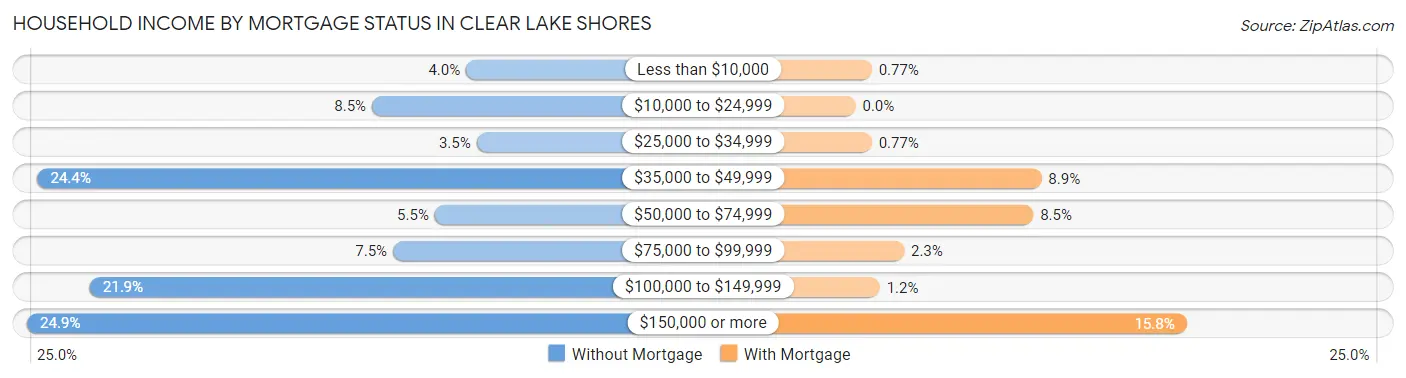
| Household Income | Without Mortgage | With Mortgage |
| Less than $10,000 | 8 (4.0%) | 2 (0.8%) |
| $10,000 to $24,999 | 17 (8.5%) | 0 (0.0%) |
| $25,000 to $34,999 | 7 (3.5%) | 2 (0.8%) |
| $35,000 to $49,999 | 49 (24.4%) | 23 (8.8%) |
| $50,000 to $74,999 | 11 (5.5%) | 22 (8.5%) |
| $75,000 to $99,999 | 15 (7.5%) | 6 (2.3%) |
| $100,000 to $149,999 | 44 (21.9%) | 3 (1.1%) |
| $150,000 or more | 50 (24.9%) | 41 (15.8%) |
| Total | 201 (100.0%) | 260 (100.0%) |
Property Value to Household Income Ratio in Clear Lake Shores
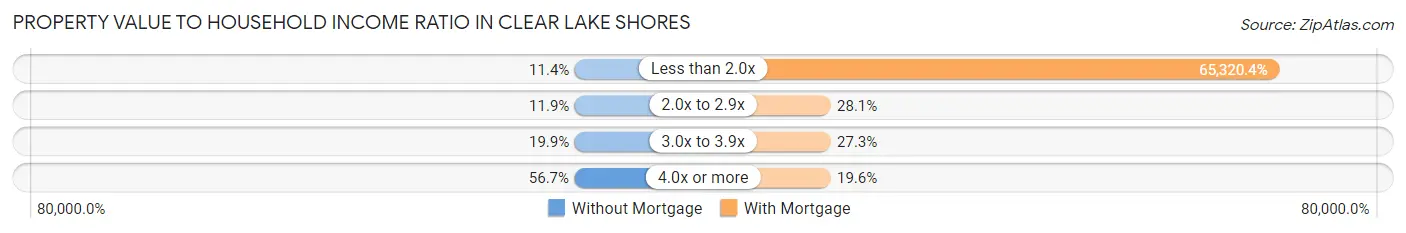
| Value-to-Income Ratio | Without Mortgage | With Mortgage |
| Less than 2.0x | 23 (11.4%) | 169,833 (65,320.4%) |
| 2.0x to 2.9x | 24 (11.9%) | 73 (28.1%) |
| 3.0x to 3.9x | 40 (19.9%) | 71 (27.3%) |
| 4.0x or more | 114 (56.7%) | 51 (19.6%) |
| Total | 201 (100.0%) | 260 (100.0%) |
Real Estate Taxes by Mortgage Status in Clear Lake Shores
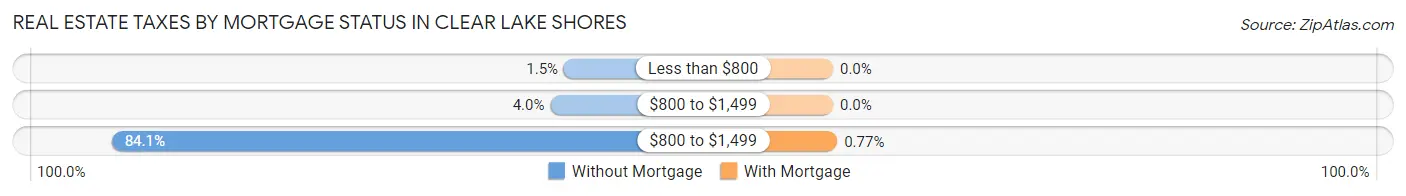
| Property Taxes | Without Mortgage | With Mortgage |
| Less than $800 | 3 (1.5%) | 0 (0.0%) |
| $800 to $1,499 | 8 (4.0%) | 0 (0.0%) |
| $800 to $1,499 | 169 (84.1%) | 2 (0.8%) |
| Total | 201 (100.0%) | 260 (100.0%) |
Health & Disability in Clear Lake Shores
Health Insurance Coverage by Age in Clear Lake Shores
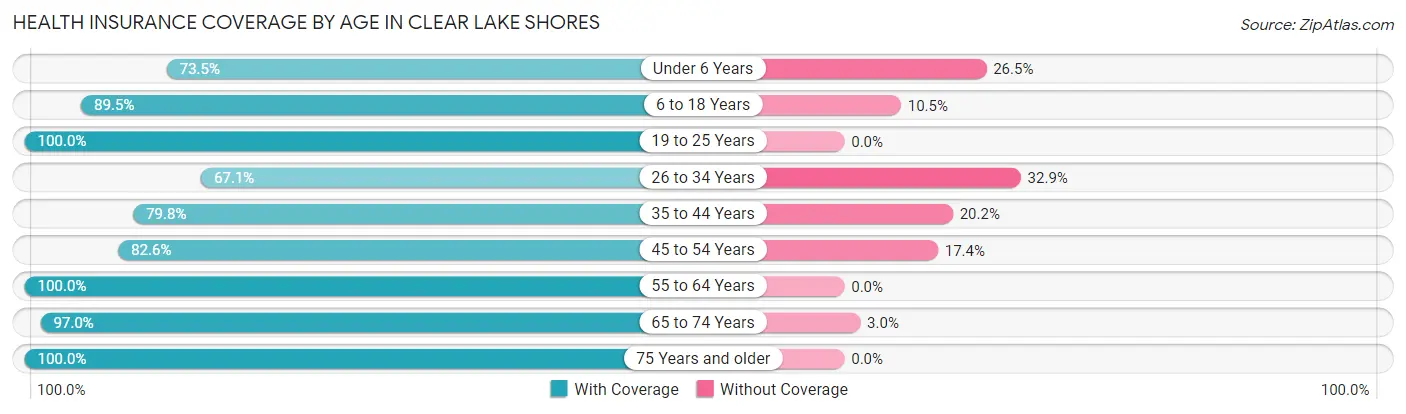
| Age Bracket | With Coverage | Without Coverage |
| Under 6 Years | 25 (73.5%) | 9 (26.5%) |
| 6 to 18 Years | 136 (89.5%) | 16 (10.5%) |
| 19 to 25 Years | 54 (100.0%) | 0 (0.0%) |
| 26 to 34 Years | 51 (67.1%) | 25 (32.9%) |
| 35 to 44 Years | 71 (79.8%) | 18 (20.2%) |
| 45 to 54 Years | 232 (82.6%) | 49 (17.4%) |
| 55 to 64 Years | 259 (100.0%) | 0 (0.0%) |
| 65 to 74 Years | 164 (97.0%) | 5 (3.0%) |
| 75 Years and older | 115 (100.0%) | 0 (0.0%) |
| Total | 1,107 (90.1%) | 122 (9.9%) |
Health Insurance Coverage by Citizenship Status in Clear Lake Shores
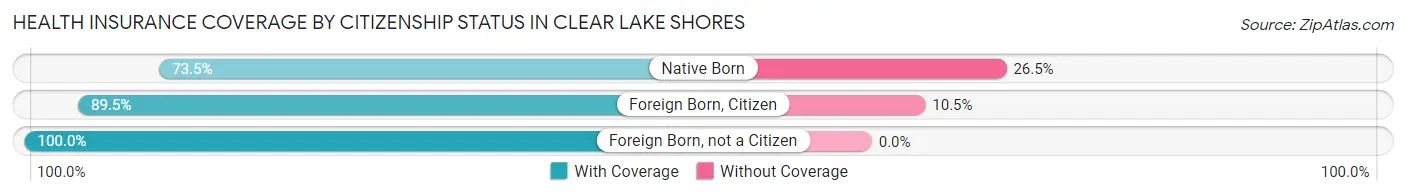
| Citizenship Status | With Coverage | Without Coverage |
| Native Born | 25 (73.5%) | 9 (26.5%) |
| Foreign Born, Citizen | 136 (89.5%) | 16 (10.5%) |
| Foreign Born, not a Citizen | 54 (100.0%) | 0 (0.0%) |
Health Insurance Coverage by Household Income in Clear Lake Shores
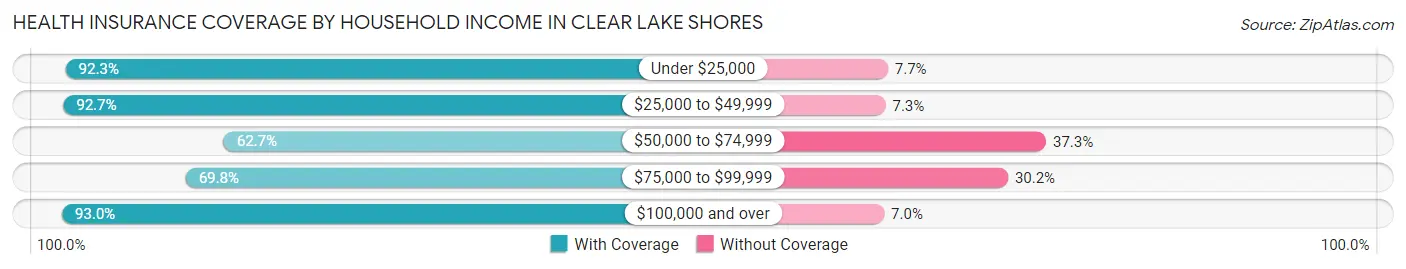
| Household Income | With Coverage | Without Coverage |
| Under $25,000 | 36 (92.3%) | 3 (7.7%) |
| $25,000 to $49,999 | 217 (92.7%) | 17 (7.3%) |
| $50,000 to $74,999 | 47 (62.7%) | 28 (37.3%) |
| $75,000 to $99,999 | 37 (69.8%) | 16 (30.2%) |
| $100,000 and over | 770 (93.0%) | 58 (7.0%) |
Public vs Private Health Insurance Coverage by Age in Clear Lake Shores
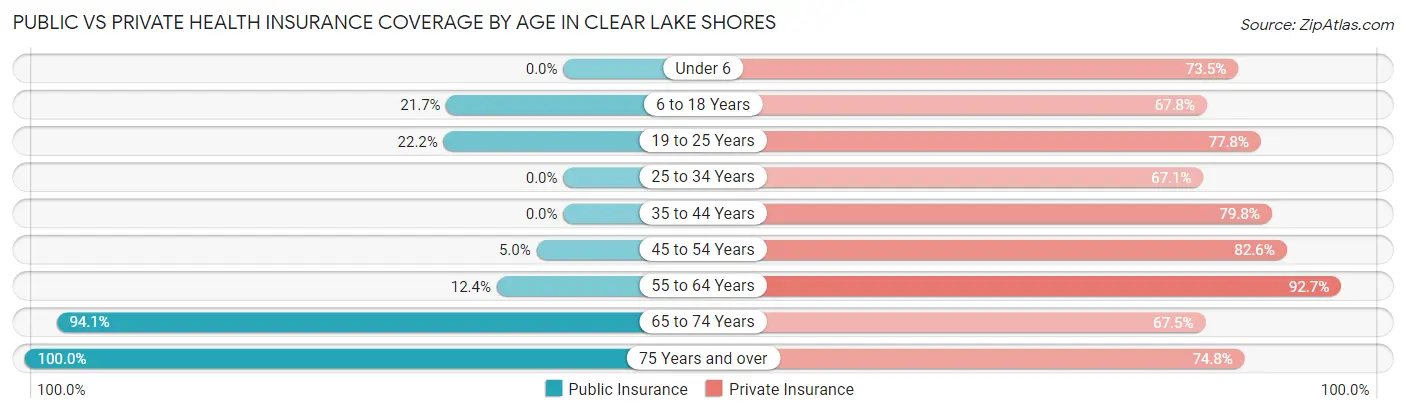
| Age Bracket | Public Insurance | Private Insurance |
| Under 6 | 0 (0.0%) | 25 (73.5%) |
| 6 to 18 Years | 33 (21.7%) | 103 (67.8%) |
| 19 to 25 Years | 12 (22.2%) | 42 (77.8%) |
| 25 to 34 Years | 0 (0.0%) | 51 (67.1%) |
| 35 to 44 Years | 0 (0.0%) | 71 (79.8%) |
| 45 to 54 Years | 14 (5.0%) | 232 (82.6%) |
| 55 to 64 Years | 32 (12.4%) | 240 (92.7%) |
| 65 to 74 Years | 159 (94.1%) | 114 (67.5%) |
| 75 Years and over | 115 (100.0%) | 86 (74.8%) |
| Total | 365 (29.7%) | 964 (78.4%) |
Disability Status by Sex by Age in Clear Lake Shores
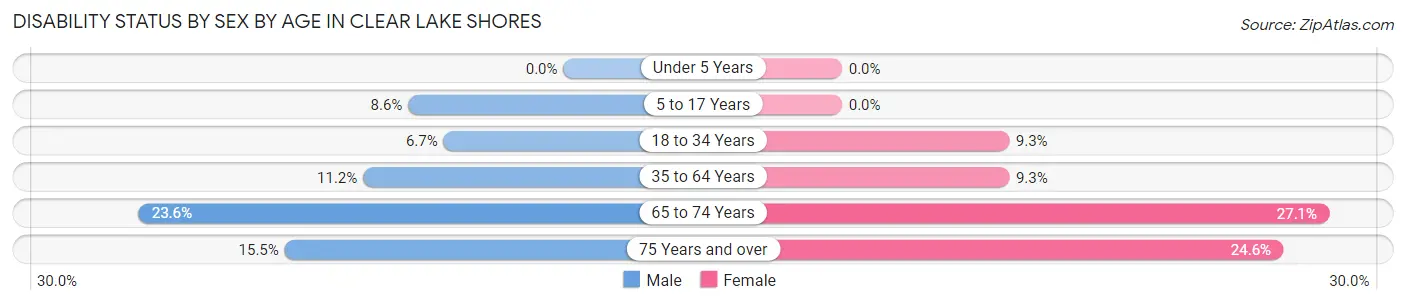
| Age Bracket | Male | Female |
| Under 5 Years | 0 (0.0%) | 0 (0.0%) |
| 5 to 17 Years | 7 (8.6%) | 0 (0.0%) |
| 18 to 34 Years | 6 (6.7%) | 4 (9.3%) |
| 35 to 64 Years | 33 (11.2%) | 31 (9.3%) |
| 65 to 74 Years | 26 (23.6%) | 16 (27.1%) |
| 75 Years and over | 9 (15.5%) | 14 (24.6%) |
Disability Class by Sex by Age in Clear Lake Shores
Disability Class: Hearing Difficulty
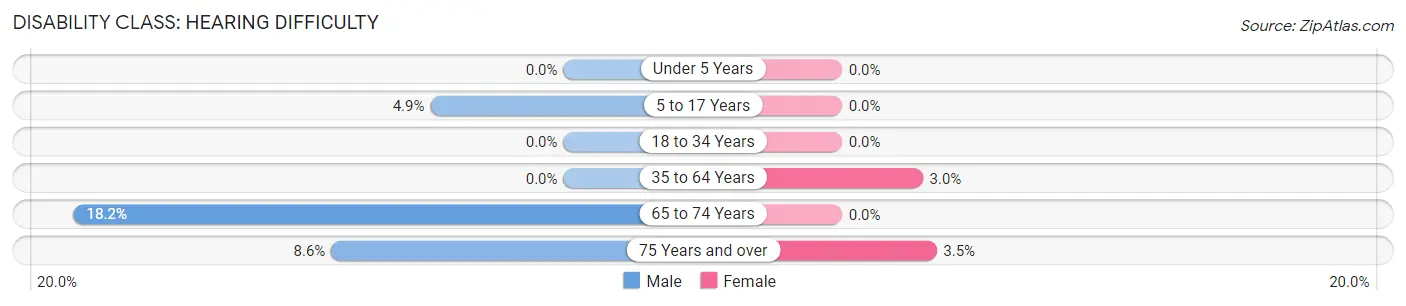
| Age Bracket | Male | Female |
| Under 5 Years | 0 (0.0%) | 0 (0.0%) |
| 5 to 17 Years | 4 (4.9%) | 0 (0.0%) |
| 18 to 34 Years | 0 (0.0%) | 0 (0.0%) |
| 35 to 64 Years | 0 (0.0%) | 10 (3.0%) |
| 65 to 74 Years | 20 (18.2%) | 0 (0.0%) |
| 75 Years and over | 5 (8.6%) | 2 (3.5%) |
Disability Class: Vision Difficulty
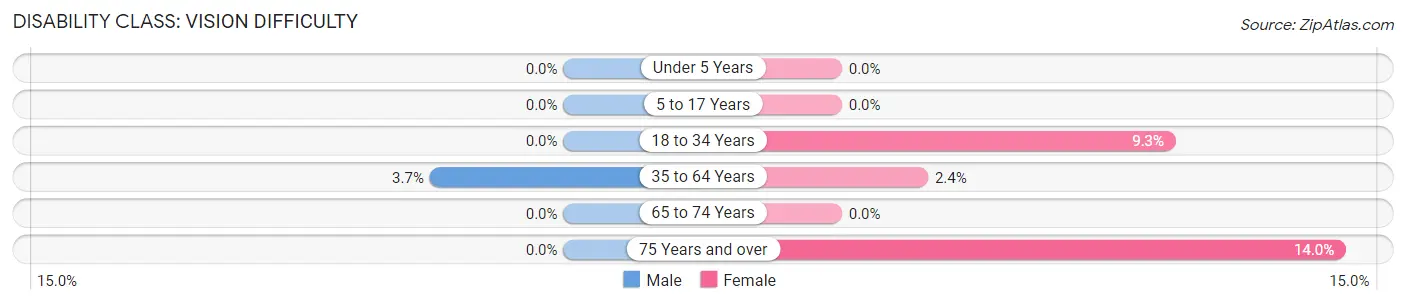
| Age Bracket | Male | Female |
| Under 5 Years | 0 (0.0%) | 0 (0.0%) |
| 5 to 17 Years | 0 (0.0%) | 0 (0.0%) |
| 18 to 34 Years | 0 (0.0%) | 4 (9.3%) |
| 35 to 64 Years | 11 (3.7%) | 8 (2.4%) |
| 65 to 74 Years | 0 (0.0%) | 0 (0.0%) |
| 75 Years and over | 0 (0.0%) | 8 (14.0%) |
Disability Class: Cognitive Difficulty
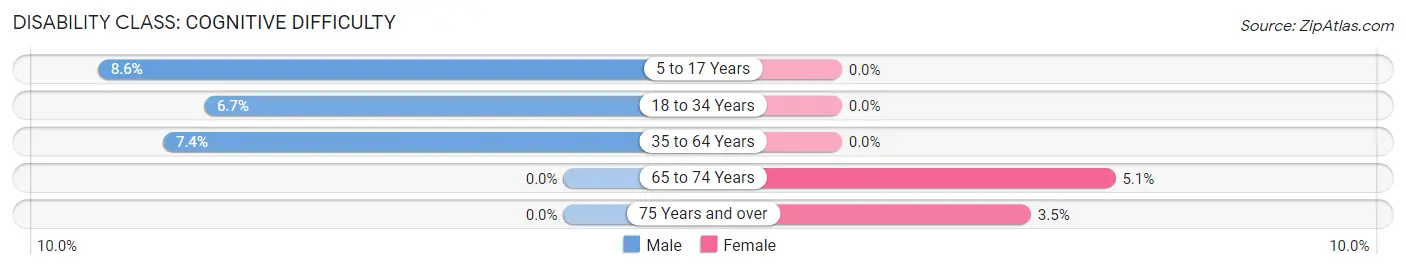
| Age Bracket | Male | Female |
| 5 to 17 Years | 7 (8.6%) | 0 (0.0%) |
| 18 to 34 Years | 6 (6.7%) | 0 (0.0%) |
| 35 to 64 Years | 22 (7.4%) | 0 (0.0%) |
| 65 to 74 Years | 0 (0.0%) | 3 (5.1%) |
| 75 Years and over | 0 (0.0%) | 2 (3.5%) |
Disability Class: Ambulatory Difficulty
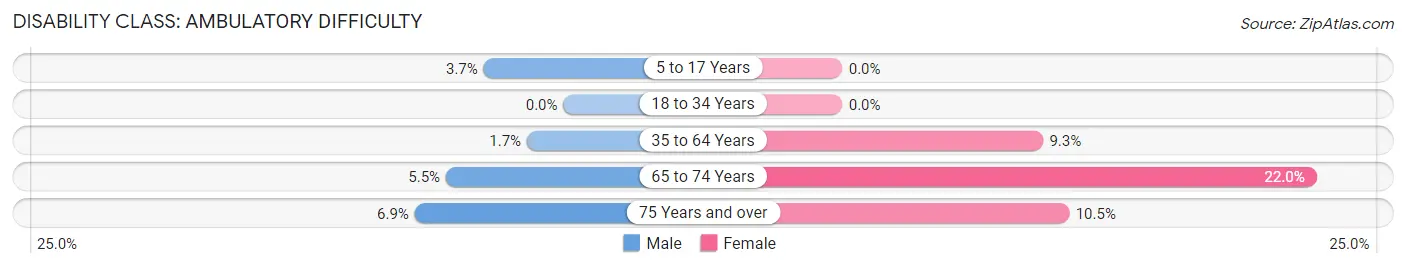
| Age Bracket | Male | Female |
| 5 to 17 Years | 3 (3.7%) | 0 (0.0%) |
| 18 to 34 Years | 0 (0.0%) | 0 (0.0%) |
| 35 to 64 Years | 5 (1.7%) | 31 (9.3%) |
| 65 to 74 Years | 6 (5.4%) | 13 (22.0%) |
| 75 Years and over | 4 (6.9%) | 6 (10.5%) |
Disability Class: Self-Care Difficulty
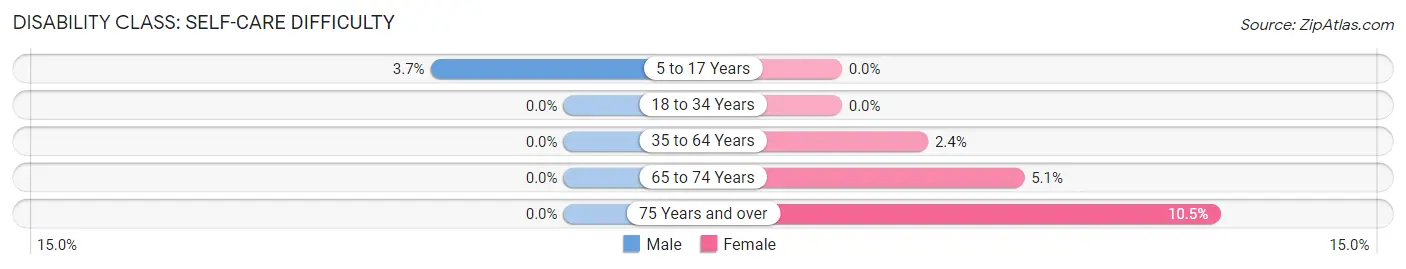
| Age Bracket | Male | Female |
| 5 to 17 Years | 3 (3.7%) | 0 (0.0%) |
| 18 to 34 Years | 0 (0.0%) | 0 (0.0%) |
| 35 to 64 Years | 0 (0.0%) | 8 (2.4%) |
| 65 to 74 Years | 0 (0.0%) | 3 (5.1%) |
| 75 Years and over | 0 (0.0%) | 6 (10.5%) |
Technology Access in Clear Lake Shores
Computing Device Access in Clear Lake Shores
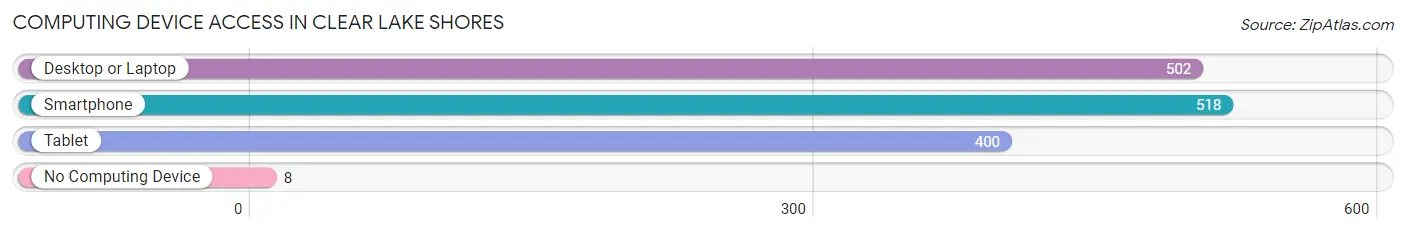
| Device Type | # Households | % Households |
| Desktop or Laptop | 502 | 91.4% |
| Smartphone | 518 | 94.4% |
| Tablet | 400 | 72.9% |
| No Computing Device | 8 | 1.5% |
| Total | 549 | 100.0% |
Internet Access in Clear Lake Shores
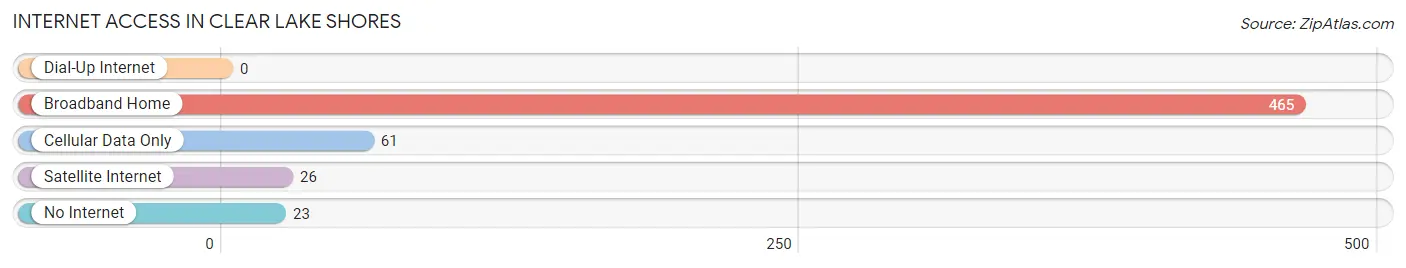
| Internet Type | # Households | % Households |
| Dial-Up Internet | 0 | 0.0% |
| Broadband Home | 465 | 84.7% |
| Cellular Data Only | 61 | 11.1% |
| Satellite Internet | 26 | 4.7% |
| No Internet | 23 | 4.2% |
| Total | 549 | 100.0% |
Clear Lake Shores Summary
History
Located on the south shore of Clear Lake, Clear Lake Shores is a small city in Galveston County, Texas. The city was founded in the 1950s by a group of developers who wanted to create a residential community on the lake. The city was incorporated in 1959 and has since grown to a population of over 2,000 people.
The city was named after Clear Lake, which is a large lake located in the Houston-Galveston area. The lake is fed by several rivers and streams, including the San Jacinto River, and is home to a variety of fish and wildlife. The lake is also a popular destination for recreational activities such as fishing, boating, and swimming.
The city of Clear Lake Shores is located on the western shore of the lake and is bordered by the cities of Kemah, League City, and Seabrook. The city is home to several parks, including the Clear Lake Shores Park, which features a playground, picnic areas, and a boat ramp. The city also has a marina, which provides access to the lake for boaters.
Geography
Clear Lake Shores is located in Galveston County, Texas, on the south shore of Clear Lake. The city is bordered by the cities of Kemah, League City, and Seabrook. The city is located approximately 25 miles southeast of Houston and is part of the Houston-The Woodlands-Sugar Land metropolitan area.
The city has a total area of 1.3 square miles, all of which is land. The terrain is mostly flat, with some areas of low hills. The climate is humid subtropical, with hot summers and mild winters.
Economy
The economy of Clear Lake Shores is largely based on tourism and recreation. The city is home to several marinas, which provide access to the lake for boaters. The city also has several parks, which are popular destinations for visitors.
The city is also home to several businesses, including restaurants, retail stores, and professional services. The city is also home to several technology companies, including a software development company and a medical device manufacturer.
Demographics
As of the 2010 census, the population of Clear Lake Shores was 2,099. The racial makeup of the city was 94.3% White, 1.2% African American, 0.3% Native American, 1.2% Asian, 0.1% Pacific Islander, 1.2% from other races, and 1.9% from two or more races. Hispanic or Latino of any race were 4.2% of the population.
The median household income in Clear Lake Shores was $76,250, and the median family income was $86,250. The per capita income was $37,890. About 4.3% of families and 5.2% of the population were below the poverty line, including 6.3% of those under age 18 and 4.2% of those age 65 or over.
Common Questions
What is Per Capita Income in Clear Lake Shores?
Per Capita income in Clear Lake Shores is $66,034.
What is the Median Family Income in Clear Lake Shores?
Median Family Income in Clear Lake Shores is $162,917.
What is the Median Household income in Clear Lake Shores?
Median Household Income in Clear Lake Shores is $118,438.
What is Income or Wage Gap in Clear Lake Shores?
Income or Wage Gap in Clear Lake Shores is 28.6%.
Women in Clear Lake Shores earn 71.4 cents for every dollar earned by a man.
What is Inequality or Gini Index in Clear Lake Shores?
Inequality or Gini Index in Clear Lake Shores is 0.43.
What is the Total Population of Clear Lake Shores?
Total Population of Clear Lake Shores is 1,232.
What is the Total Male Population of Clear Lake Shores?
Total Male Population of Clear Lake Shores is 649.
What is the Total Female Population of Clear Lake Shores?
Total Female Population of Clear Lake Shores is 583.
What is the Ratio of Males per 100 Females in Clear Lake Shores?
There are 111.32 Males per 100 Females in Clear Lake Shores.
What is the Ratio of Females per 100 Males in Clear Lake Shores?
There are 89.83 Females per 100 Males in Clear Lake Shores.
What is the Median Population Age in Clear Lake Shores?
Median Population Age in Clear Lake Shores is 51.6 Years.
What is the Average Family Size in Clear Lake Shores
Average Family Size in Clear Lake Shores is 2.9 People.
What is the Average Household Size in Clear Lake Shores
Average Household Size in Clear Lake Shores is 2.2 People.
How Large is the Labor Force in Clear Lake Shores?
There are 629 People in the Labor Forcein in Clear Lake Shores.
What is the Percentage of People in the Labor Force in Clear Lake Shores?
58.7% of People are in the Labor Force in Clear Lake Shores.
What is the Unemployment Rate in Clear Lake Shores?
Unemployment Rate in Clear Lake Shores is 5.0%.