Zip Codes with the Highest Percentage of Population Employed in Architecture & Engineering in Mcallen, TX
RELATED REPORTS & OPTIONS
Architecture & Engineering
Mcallen
Compare Zip Codes
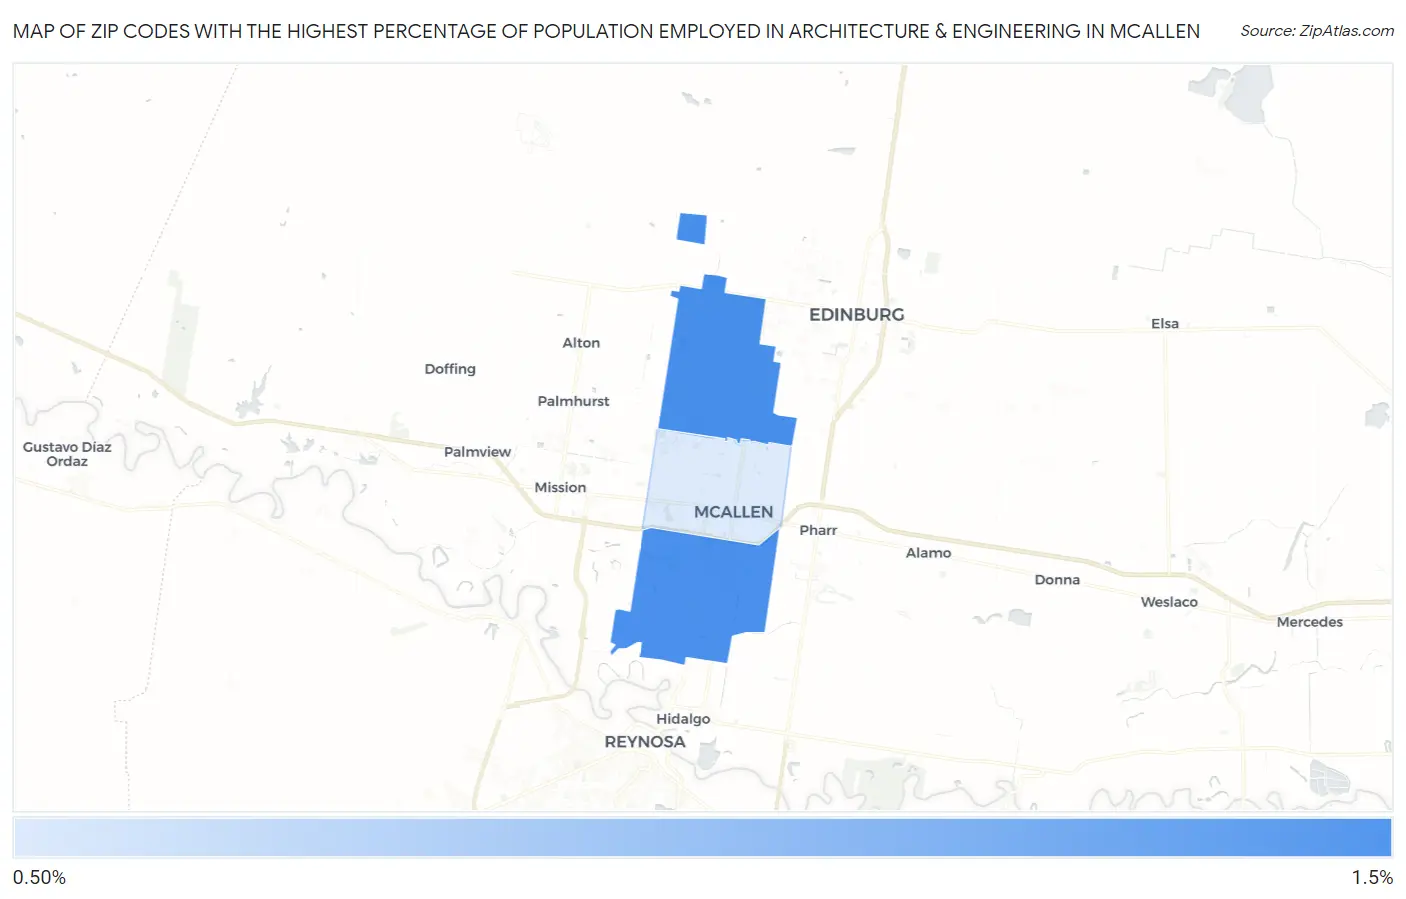
Map of Zip Codes with the Highest Percentage of Population Employed in Architecture & Engineering in Mcallen
0.87%
1.3%
Zip Codes with the Highest Percentage of Population Employed in Architecture & Engineering in Mcallen, TX
| Zip Code | % Employed | vs State | vs National | |
| 1. | 78504 | 1.3% | 2.2%(-0.967)#790 | 2.1%(-0.894)#14,640 |
| 2. | 78503 | 1.3% | 2.2%(-0.972)#792 | 2.1%(-0.899)#14,674 |
| 3. | 78501 | 0.87% | 2.2%(-1.35)#952 | 2.1%(-1.28)#17,607 |
1
Common Questions
What are the Top Zip Codes with the Highest Percentage of Population Employed in Architecture & Engineering in Mcallen, TX?
Top Zip Codes with the Highest Percentage of Population Employed in Architecture & Engineering in Mcallen, TX are:
What zip code has the Highest Percentage of Population Employed in Architecture & Engineering in Mcallen, TX?
78504 has the Highest Percentage of Population Employed in Architecture & Engineering in Mcallen, TX with 1.3%.
What is the Percentage of Population Employed in Architecture & Engineering in Mcallen, TX?
Percentage of Population Employed in Architecture & Engineering in Mcallen is 1.2%.
What is the Percentage of Population Employed in Architecture & Engineering in Texas?
Percentage of Population Employed in Architecture & Engineering in Texas is 2.2%.
What is the Percentage of Population Employed in Architecture & Engineering in the United States?
Percentage of Population Employed in Architecture & Engineering in the United States is 2.1%.