Zip Codes with the Highest Percentage of Population Employed in Architecture & Engineering in Longview, TX
RELATED REPORTS & OPTIONS
Architecture & Engineering
Longview
Compare Zip Codes
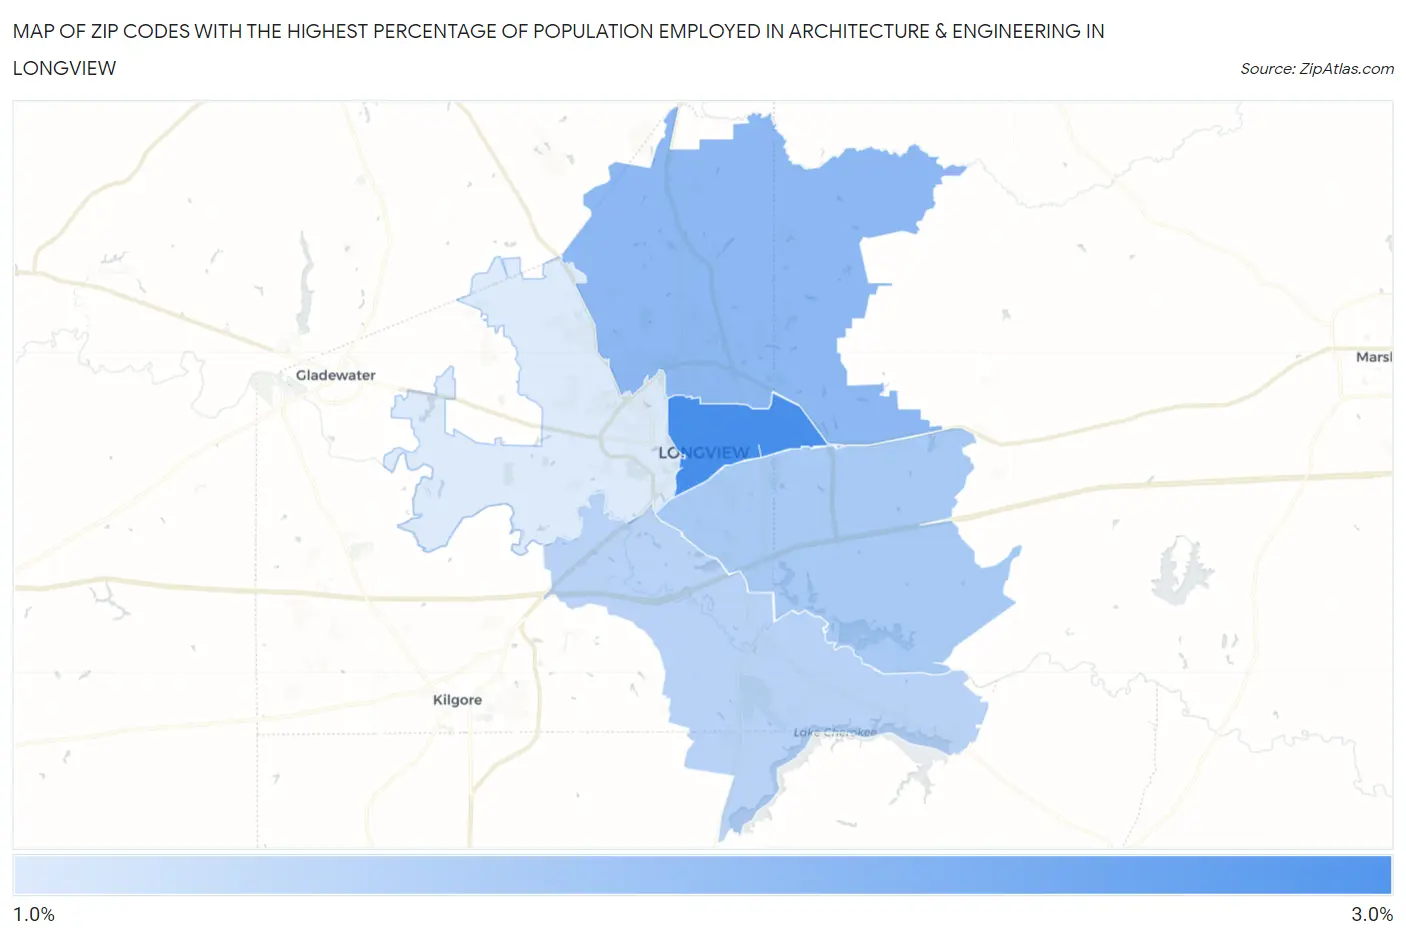
Map of Zip Codes with the Highest Percentage of Population Employed in Architecture & Engineering in Longview
1.4%
2.9%
Zip Codes with the Highest Percentage of Population Employed in Architecture & Engineering in Longview, TX
| Zip Code | % Employed | vs State | vs National | |
| 1. | 75601 | 2.9% | 2.2%(+0.692)#311 | 2.1%(+0.765)#5,378 |
| 2. | 75605 | 2.2% | 2.2%(-0.035)#466 | 2.1%(+0.038)#8,547 |
| 3. | 75602 | 1.9% | 2.2%(-0.309)#553 | 2.1%(-0.236)#10,148 |
| 4. | 75603 | 1.7% | 2.2%(-0.482)#609 | 2.1%(-0.409)#11,240 |
| 5. | 75604 | 1.4% | 2.2%(-0.864)#756 | 2.1%(-0.791)#13,894 |
1
Common Questions
What are the Top 3 Zip Codes with the Highest Percentage of Population Employed in Architecture & Engineering in Longview, TX?
Top 3 Zip Codes with the Highest Percentage of Population Employed in Architecture & Engineering in Longview, TX are:
What zip code has the Highest Percentage of Population Employed in Architecture & Engineering in Longview, TX?
75601 has the Highest Percentage of Population Employed in Architecture & Engineering in Longview, TX with 2.9%.
What is the Percentage of Population Employed in Architecture & Engineering in Longview, TX?
Percentage of Population Employed in Architecture & Engineering in Longview is 1.7%.
What is the Percentage of Population Employed in Architecture & Engineering in Texas?
Percentage of Population Employed in Architecture & Engineering in Texas is 2.2%.
What is the Percentage of Population Employed in Architecture & Engineering in the United States?
Percentage of Population Employed in Architecture & Engineering in the United States is 2.1%.