Zip Codes with the Highest Percentage of Population Employed in Architecture & Engineering in Lewisville, TX
RELATED REPORTS & OPTIONS
Architecture & Engineering
Lewisville
Compare Zip Codes
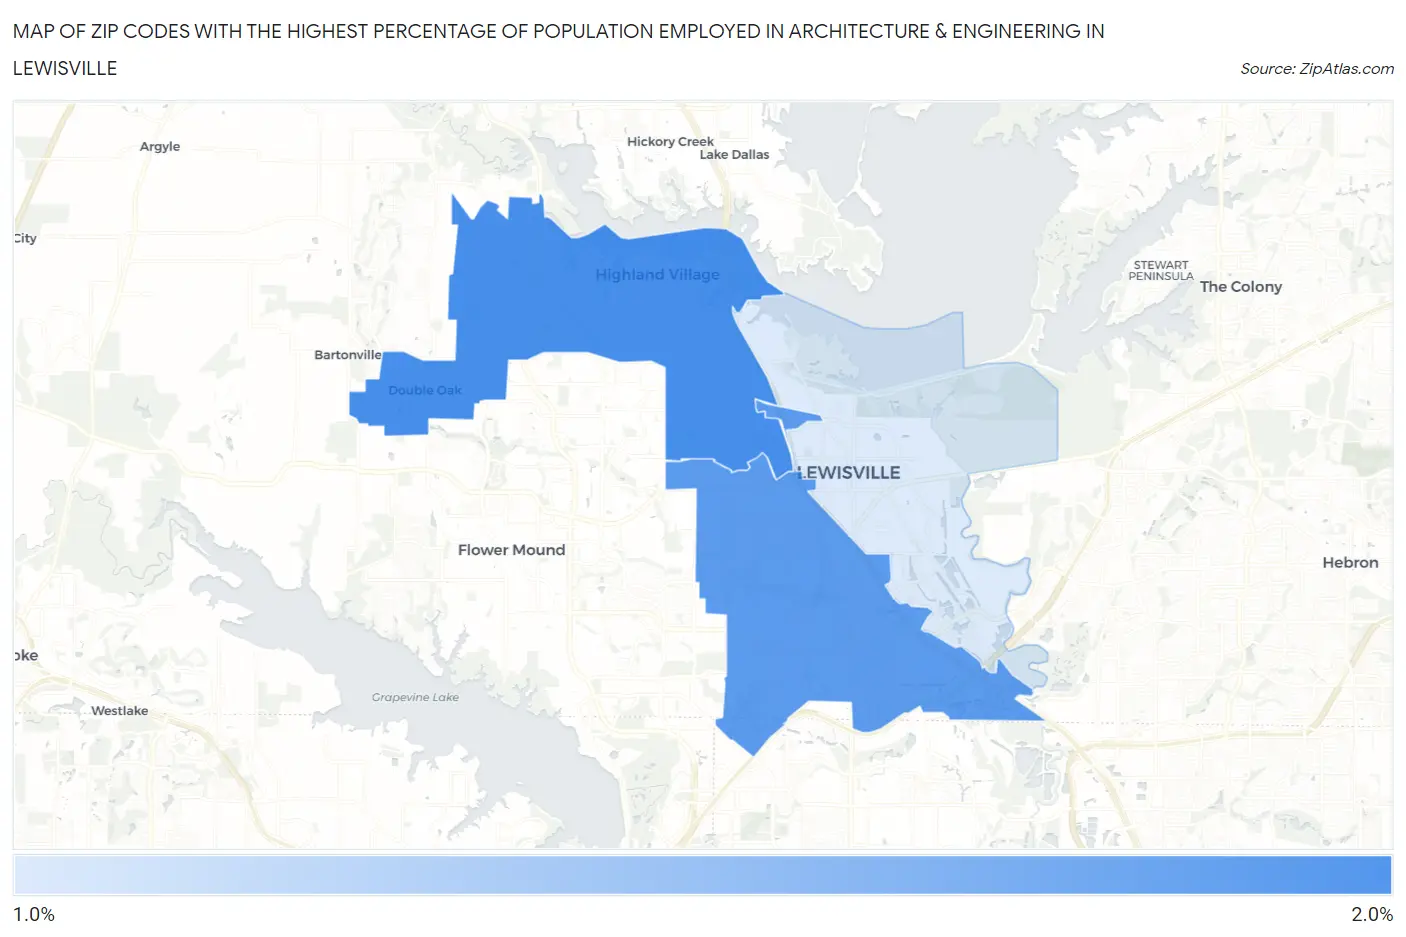
Map of Zip Codes with the Highest Percentage of Population Employed in Architecture & Engineering in Lewisville
1.0%
2.0%
Zip Codes with the Highest Percentage of Population Employed in Architecture & Engineering in Lewisville, TX
| Zip Code | % Employed | vs State | vs National | |
| 1. | 75077 | 2.0% | 2.2%(-0.233)#529 | 2.1%(-0.160)#9,679 |
| 2. | 75067 | 1.9% | 2.2%(-0.368)#570 | 2.1%(-0.295)#10,522 |
| 3. | 75057 | 1.0% | 2.2%(-1.22)#896 | 2.1%(-1.14)#16,555 |
1
Common Questions
What are the Top Zip Codes with the Highest Percentage of Population Employed in Architecture & Engineering in Lewisville, TX?
Top Zip Codes with the Highest Percentage of Population Employed in Architecture & Engineering in Lewisville, TX are:
What zip code has the Highest Percentage of Population Employed in Architecture & Engineering in Lewisville, TX?
75077 has the Highest Percentage of Population Employed in Architecture & Engineering in Lewisville, TX with 2.0%.
What is the Percentage of Population Employed in Architecture & Engineering in Lewisville, TX?
Percentage of Population Employed in Architecture & Engineering in Lewisville is 1.9%.
What is the Percentage of Population Employed in Architecture & Engineering in Texas?
Percentage of Population Employed in Architecture & Engineering in Texas is 2.2%.
What is the Percentage of Population Employed in Architecture & Engineering in the United States?
Percentage of Population Employed in Architecture & Engineering in the United States is 2.1%.