Zip Codes with the Highest Percentage of Population Employed in Architecture & Engineering in Magnolia, TX
RELATED REPORTS & OPTIONS
Architecture & Engineering
Magnolia
Compare Zip Codes
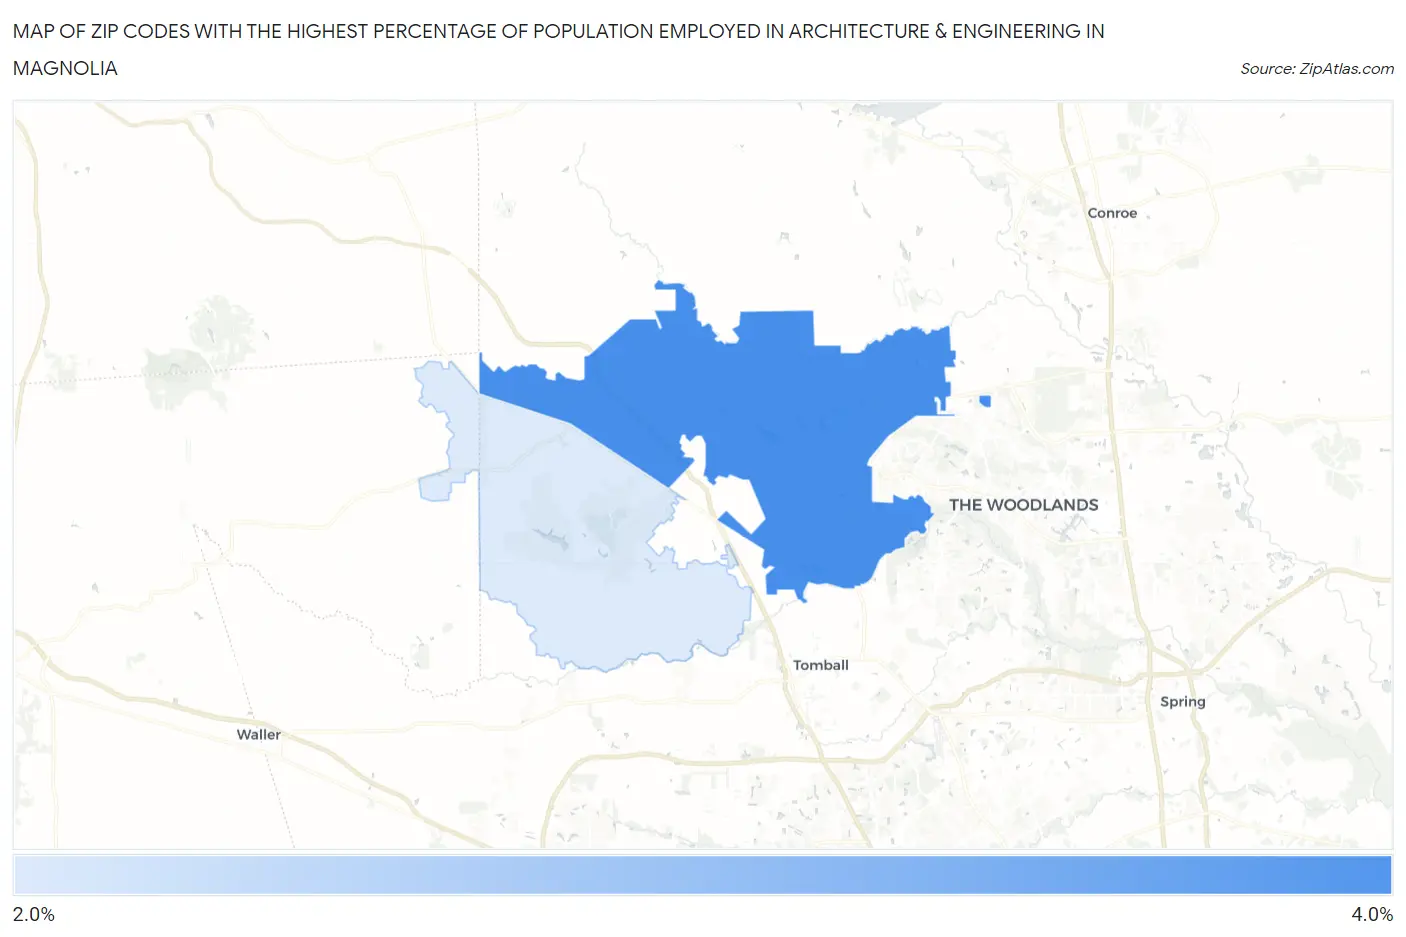
Map of Zip Codes with the Highest Percentage of Population Employed in Architecture & Engineering in Magnolia
2.1%
3.9%
Zip Codes with the Highest Percentage of Population Employed in Architecture & Engineering in Magnolia, TX
| Zip Code | % Employed | vs State | vs National | |
| 1. | 77354 | 3.9% | 2.2%(+1.68)#162 | 2.1%(+1.75)#2,934 |
| 2. | 77355 | 2.1% | 2.2%(-0.110)#490 | 2.1%(-0.037)#8,970 |
1
Common Questions
What are the Top Zip Codes with the Highest Percentage of Population Employed in Architecture & Engineering in Magnolia, TX?
Top Zip Codes with the Highest Percentage of Population Employed in Architecture & Engineering in Magnolia, TX are:
What zip code has the Highest Percentage of Population Employed in Architecture & Engineering in Magnolia, TX?
77354 has the Highest Percentage of Population Employed in Architecture & Engineering in Magnolia, TX with 3.9%.
What is the Percentage of Population Employed in Architecture & Engineering in Magnolia, TX?
Percentage of Population Employed in Architecture & Engineering in Magnolia is 1.4%.
What is the Percentage of Population Employed in Architecture & Engineering in Texas?
Percentage of Population Employed in Architecture & Engineering in Texas is 2.2%.
What is the Percentage of Population Employed in Architecture & Engineering in the United States?
Percentage of Population Employed in Architecture & Engineering in the United States is 2.1%.