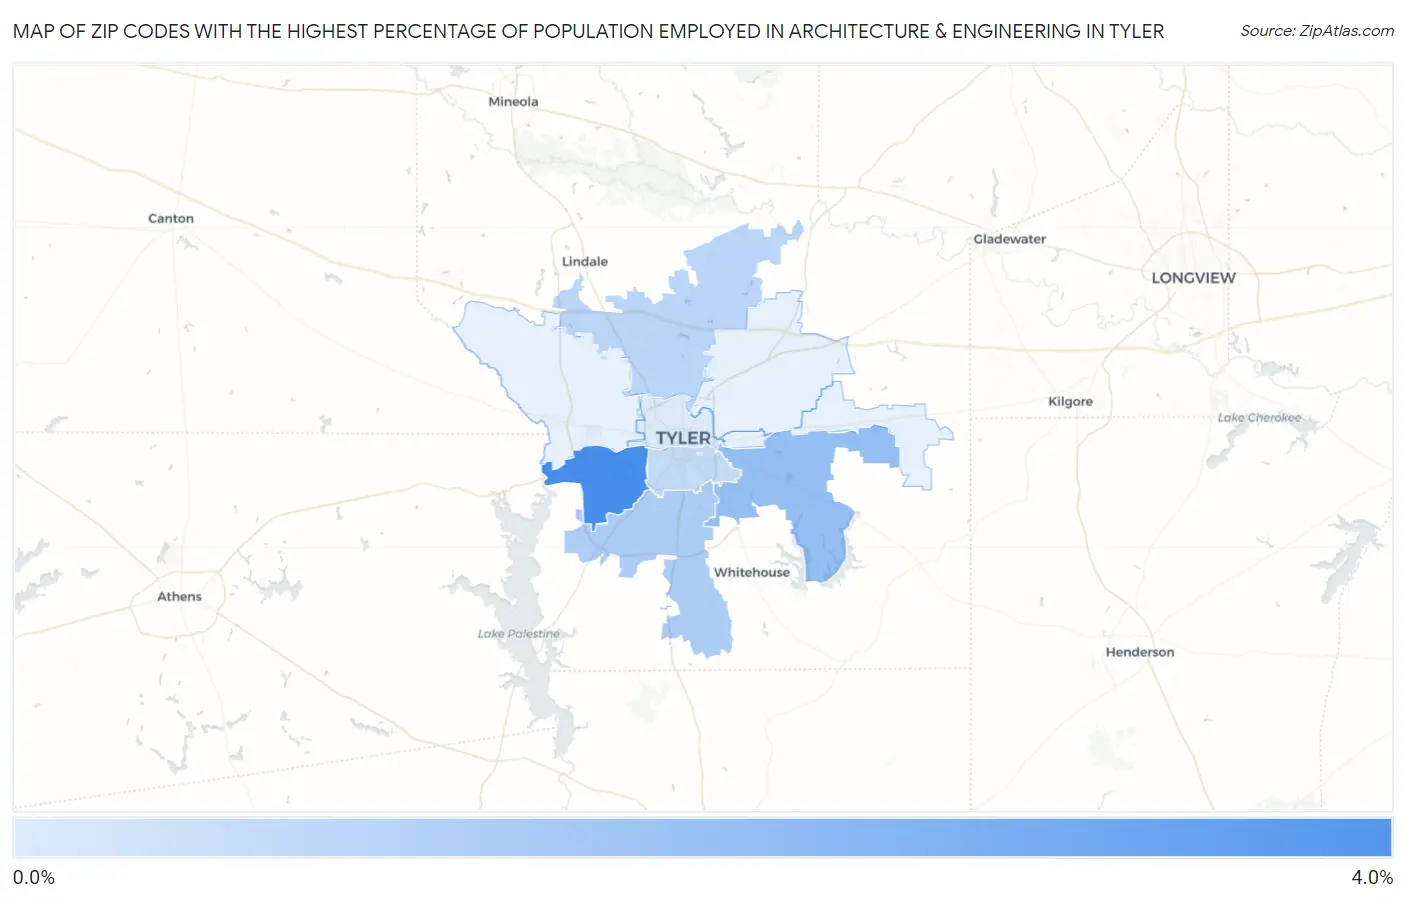
Zip Codes with the Highest Percentage of Population Employed in Architecture & Engineering in Tyler, TX
RELATED REPORTS & OPTIONS
Architecture & Engineering
Tyler
Compare Zip Codes
Map of Zip Codes with the Highest Percentage of Population Employed in Architecture & Engineering in Tyler
0.52%
3.9%
Zip Codes with the Highest Percentage of Population Employed in Architecture & Engineering in Tyler, TX
| Zip Code | % Employed | vs State | vs National | |
| 1. | 75709 | 3.9% | 2.2%(+1.70)#157 | 2.1%(+1.77)#2,901 |
| 2. | 75707 | 2.1% | 2.2%(-0.118)#492 | 2.1%(-0.045)#9,024 |
| 3. | 75703 | 1.6% | 2.2%(-0.601)#660 | 2.1%(-0.528)#12,039 |
| 4. | 75706 | 1.3% | 2.2%(-0.916)#774 | 2.1%(-0.843)#14,272 |
| 5. | 75701 | 1.1% | 2.2%(-1.13)#851 | 2.1%(-1.06)#15,957 |
| 6. | 75702 | 0.52% | 2.2%(-1.70)#1,118 | 2.1%(-1.63)#20,146 |
1
Common Questions
What are the Top 5 Zip Codes with the Highest Percentage of Population Employed in Architecture & Engineering in Tyler, TX?
Top 5 Zip Codes with the Highest Percentage of Population Employed in Architecture & Engineering in Tyler, TX are:
What zip code has the Highest Percentage of Population Employed in Architecture & Engineering in Tyler, TX?
75709 has the Highest Percentage of Population Employed in Architecture & Engineering in Tyler, TX with 3.9%.
What is the Percentage of Population Employed in Architecture & Engineering in Tyler, TX?
Percentage of Population Employed in Architecture & Engineering in Tyler is 1.2%.
What is the Percentage of Population Employed in Architecture & Engineering in Texas?
Percentage of Population Employed in Architecture & Engineering in Texas is 2.2%.
What is the Percentage of Population Employed in Architecture & Engineering in the United States?
Percentage of Population Employed in Architecture & Engineering in the United States is 2.1%.