Tomball, TX Map & Demographics
Tomball Map
Tomball Overview
$37,154
PER CAPITA INCOME
$99,583
AVG FAMILY INCOME
$70,829
AVG HOUSEHOLD INCOME
49.7%
WAGE / INCOME GAP [ % ]
50.3¢/ $1
WAGE / INCOME GAP [ $ ]
$9,793
FAMILY INCOME DEFICIT
0.49
INEQUALITY / GINI INDEX
12,630
TOTAL POPULATION
5,983
MALE POPULATION
6,647
FEMALE POPULATION
90.01
MALES / 100 FEMALES
111.10
FEMALES / 100 MALES
38.2
MEDIAN AGE
3.4
AVG FAMILY SIZE
2.5
AVG HOUSEHOLD SIZE
5,772
LABOR FORCE [ PEOPLE ]
56.4%
PERCENT IN LABOR FORCE
3.2%
UNEMPLOYMENT RATE
Income in Tomball
Income Overview in Tomball
Per Capita Income in Tomball is $37,154, while median incomes of families and households are $99,583 and $70,829 respectively.
| Characteristic | Number | Measure |
| Per Capita Income | 12,630 | $37,154 |
| Median Family Income | 2,778 | $99,583 |
| Mean Family Income | 2,778 | $129,403 |
| Median Household Income | 4,773 | $70,829 |
| Mean Household Income | 4,773 | $96,296 |
| Income Deficit | 2,778 | $9,793 |
| Wage / Income Gap (%) | 12,630 | 49.67% |
| Wage / Income Gap ($) | 12,630 | 50.33¢ per $1 |
| Gini / Inequality Index | 12,630 | 0.49 |
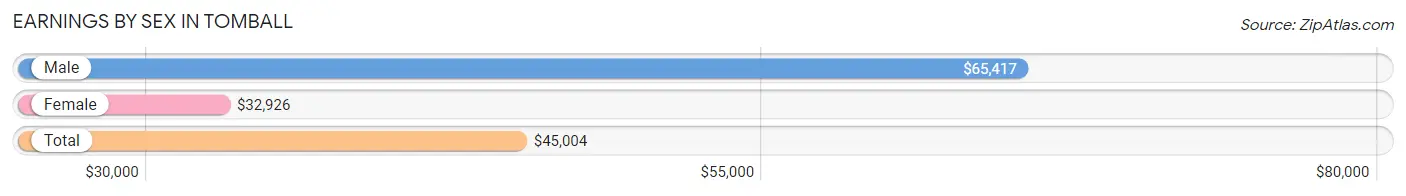
Earnings by Sex in Tomball
Average Earnings in Tomball are $45,004, $65,417 for men and $32,926 for women, a difference of 49.7%.
| Sex | Number | Average Earnings |
| Male | 3,367 (53.5%) | $65,417 |
| Female | 2,928 (46.5%) | $32,926 |
| Total | 6,295 (100.0%) | $45,004 |
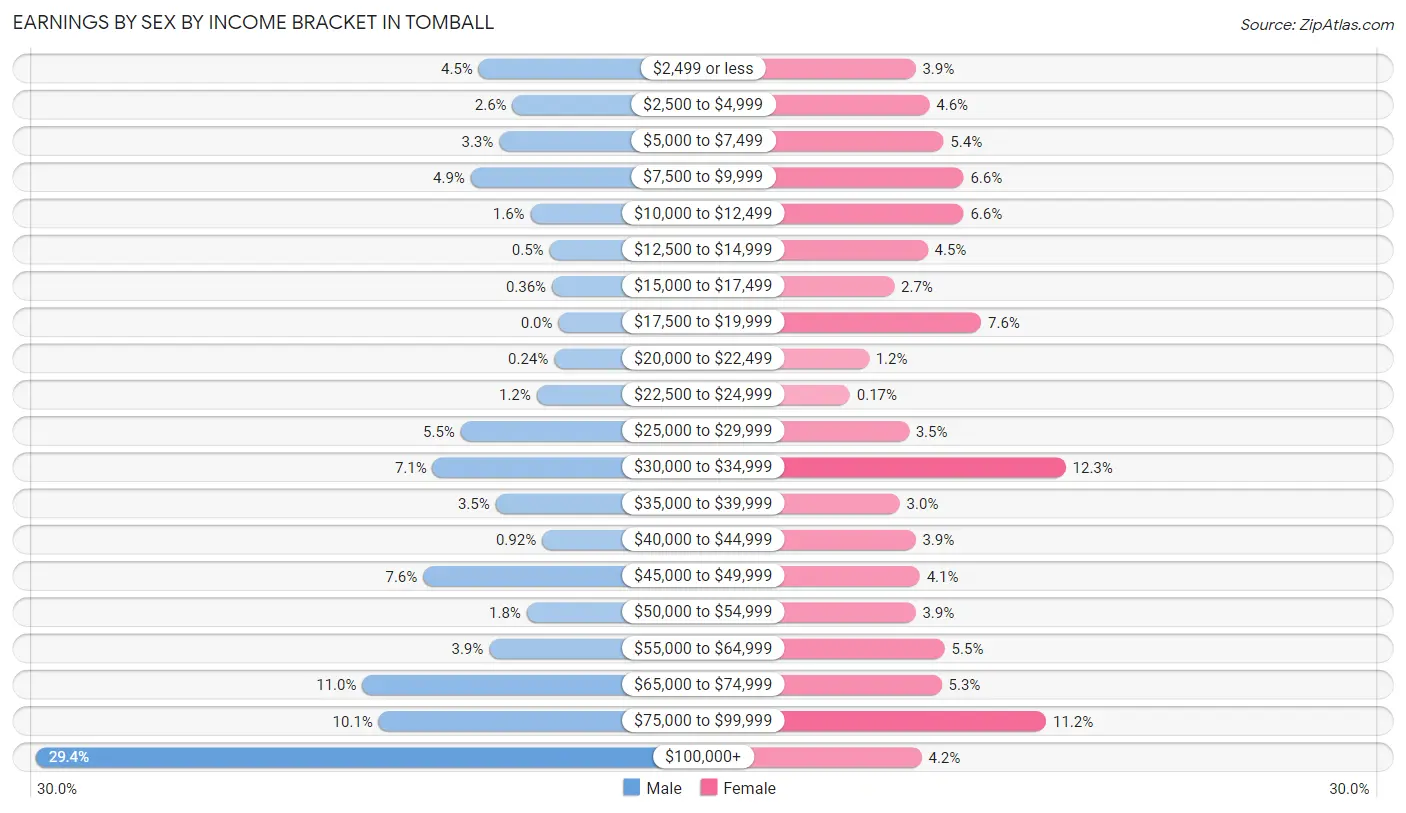
Earnings by Sex by Income Bracket in Tomball
The most common earnings brackets in Tomball are $100,000+ for men (989 | 29.4%) and $30,000 to $34,999 for women (360 | 12.3%).
| Income | Male | Female |
| $2,499 or less | 151 (4.5%) | 113 (3.9%) |
| $2,500 to $4,999 | 87 (2.6%) | 136 (4.6%) |
| $5,000 to $7,499 | 112 (3.3%) | 159 (5.4%) |
| $7,500 to $9,999 | 166 (4.9%) | 192 (6.6%) |
| $10,000 to $12,499 | 53 (1.6%) | 192 (6.6%) |
| $12,500 to $14,999 | 17 (0.5%) | 133 (4.5%) |
| $15,000 to $17,499 | 12 (0.4%) | 78 (2.7%) |
| $17,500 to $19,999 | 0 (0.0%) | 221 (7.5%) |
| $20,000 to $22,499 | 8 (0.2%) | 36 (1.2%) |
| $22,500 to $24,999 | 41 (1.2%) | 5 (0.2%) |
| $25,000 to $29,999 | 185 (5.5%) | 102 (3.5%) |
| $30,000 to $34,999 | 238 (7.1%) | 360 (12.3%) |
| $35,000 to $39,999 | 119 (3.5%) | 87 (3.0%) |
| $40,000 to $44,999 | 31 (0.9%) | 113 (3.9%) |
| $45,000 to $49,999 | 256 (7.6%) | 120 (4.1%) |
| $50,000 to $54,999 | 60 (1.8%) | 113 (3.9%) |
| $55,000 to $64,999 | 131 (3.9%) | 161 (5.5%) |
| $65,000 to $74,999 | 371 (11.0%) | 156 (5.3%) |
| $75,000 to $99,999 | 340 (10.1%) | 328 (11.2%) |
| $100,000+ | 989 (29.4%) | 123 (4.2%) |
| Total | 3,367 (100.0%) | 2,928 (100.0%) |
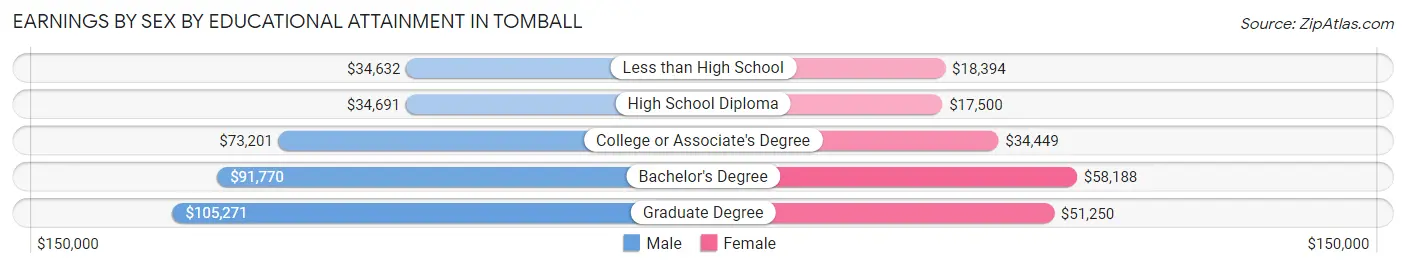
Earnings by Sex by Educational Attainment in Tomball
Average earnings in Tomball are $73,663 for men and $33,569 for women, a difference of 54.4%. Men with an educational attainment of graduate degree enjoy the highest average annual earnings of $105,271, while those with less than high school education earn the least with $34,632. Women with an educational attainment of bachelor's degree earn the most with the average annual earnings of $58,188, while those with high school diploma education have the smallest earnings of $17,500.
| Educational Attainment | Male Income | Female Income |
| Less than High School | $34,632 | $18,394 |
| High School Diploma | $34,691 | $17,500 |
| College or Associate's Degree | $73,201 | $34,449 |
| Bachelor's Degree | $91,770 | $58,188 |
| Graduate Degree | $105,271 | $51,250 |
| Total | $73,663 | $33,569 |
Family Income in Tomball
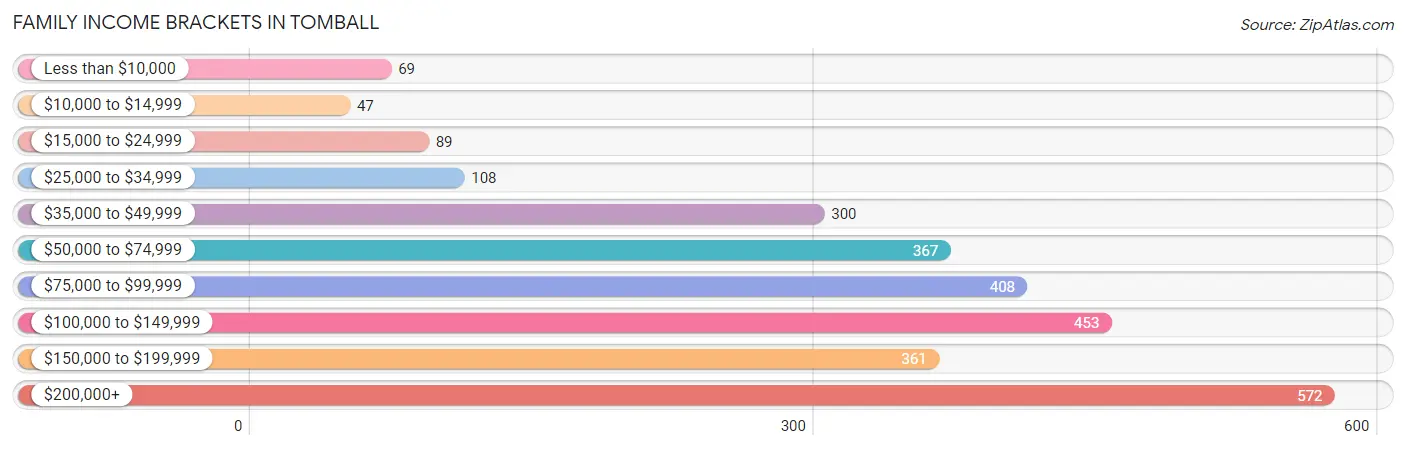
Family Income Brackets in Tomball
According to the Tomball family income data, there are 572 families falling into the $200,000+ income range, which is the most common income bracket and makes up 20.6% of all families. Conversely, the $10,000 to $14,999 income bracket is the least frequent group with only 47 families (1.7%) belonging to this category.
| Income Bracket | # Families | % Families |
| Less than $10,000 | 69 | 2.5% |
| $10,000 to $14,999 | 47 | 1.7% |
| $15,000 to $24,999 | 89 | 3.2% |
| $25,000 to $34,999 | 108 | 3.9% |
| $35,000 to $49,999 | 300 | 10.8% |
| $50,000 to $74,999 | 367 | 13.2% |
| $75,000 to $99,999 | 408 | 14.7% |
| $100,000 to $149,999 | 453 | 16.3% |
| $150,000 to $199,999 | 361 | 13.0% |
| $200,000+ | 572 | 20.6% |
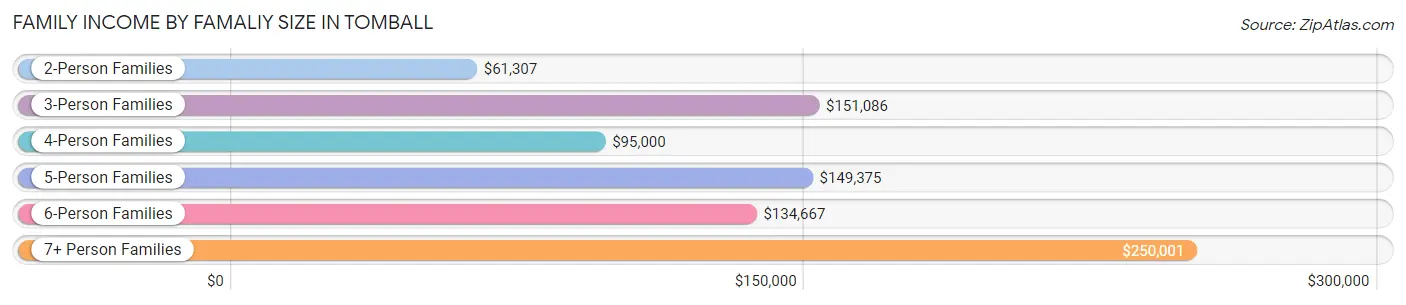
Family Income by Famaliy Size in Tomball
7+ person families (89 | 3.2%) account for the highest median family income in Tomball with $250,001 per family, while 3-person families (438 | 15.8%) have the highest median income of $50,362 per family member.
| Income Bracket | # Families | Median Income |
| 2-Person Families | 1,115 (40.1%) | $61,307 |
| 3-Person Families | 438 (15.8%) | $151,086 |
| 4-Person Families | 688 (24.8%) | $95,000 |
| 5-Person Families | 364 (13.1%) | $149,375 |
| 6-Person Families | 84 (3.0%) | $134,667 |
| 7+ Person Families | 89 (3.2%) | $250,001 |
| Total | 2,778 (100.0%) | $99,583 |
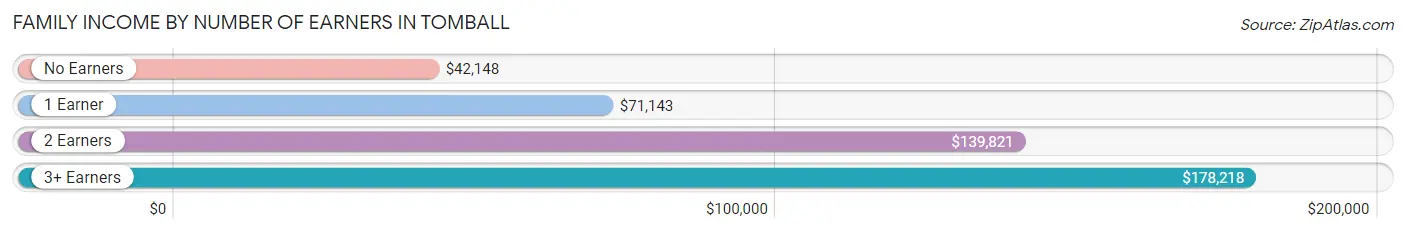
Family Income by Number of Earners in Tomball
The median family income in Tomball is $99,583, with families comprising 3+ earners (361) having the highest median family income of $178,218, while families with no earners (277) have the lowest median family income of $42,148, accounting for 13.0% and 10.0% of families, respectively.
| Number of Earners | # Families | Median Income |
| No Earners | 277 (10.0%) | $42,148 |
| 1 Earner | 952 (34.3%) | $71,143 |
| 2 Earners | 1,188 (42.8%) | $139,821 |
| 3+ Earners | 361 (13.0%) | $178,218 |
| Total | 2,778 (100.0%) | $99,583 |
Household Income in Tomball
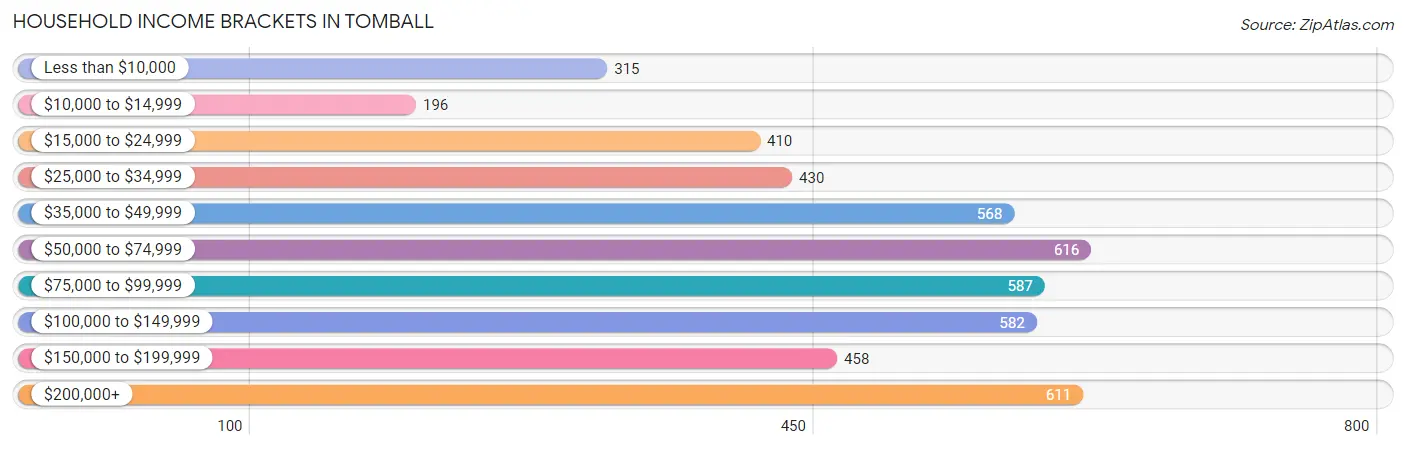
Household Income Brackets in Tomball
With 616 households falling in the category, the $50,000 to $74,999 income range is the most frequent in Tomball, accounting for 12.9% of all households. In contrast, only 196 households (4.1%) fall into the $10,000 to $14,999 income bracket, making it the least populous group.
| Income Bracket | # Households | % Households |
| Less than $10,000 | 315 | 6.6% |
| $10,000 to $14,999 | 196 | 4.1% |
| $15,000 to $24,999 | 410 | 8.6% |
| $25,000 to $34,999 | 430 | 9.0% |
| $35,000 to $49,999 | 568 | 11.9% |
| $50,000 to $74,999 | 616 | 12.9% |
| $75,000 to $99,999 | 587 | 12.3% |
| $100,000 to $149,999 | 582 | 12.2% |
| $150,000 to $199,999 | 458 | 9.6% |
| $200,000+ | 611 | 12.8% |
Household Income by Householder Age in Tomball
The median household income in Tomball is $70,829, with the highest median household income of $83,784 found in the 45 to 64 years age bracket for the primary householder. A total of 1,590 households (33.3%) fall into this category. Meanwhile, the 15 to 24 years age bracket for the primary householder has the lowest median household income of $0, with 103 households (2.2%) in this group.
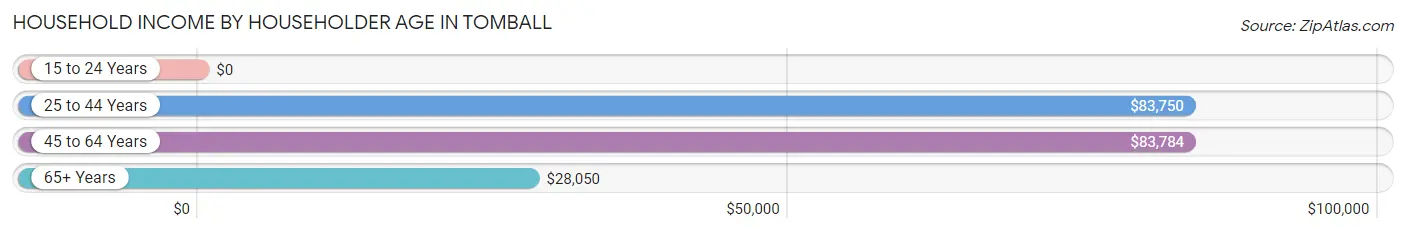
| Income Bracket | # Households | Median Income |
| 15 to 24 Years | 103 (2.2%) | $0 |
| 25 to 44 Years | 1,471 (30.8%) | $83,750 |
| 45 to 64 Years | 1,590 (33.3%) | $83,784 |
| 65+ Years | 1,609 (33.7%) | $28,050 |
| Total | 4,773 (100.0%) | $70,829 |
Poverty in Tomball
Income Below Poverty by Sex and Age in Tomball
With 9.3% poverty level for males and 12.6% for females among the residents of Tomball, 18 to 24 year old males and 75 year old and over females are the most vulnerable to poverty, with 174 males (32.8%) and 228 females (27.7%) in their respective age groups living below the poverty level.
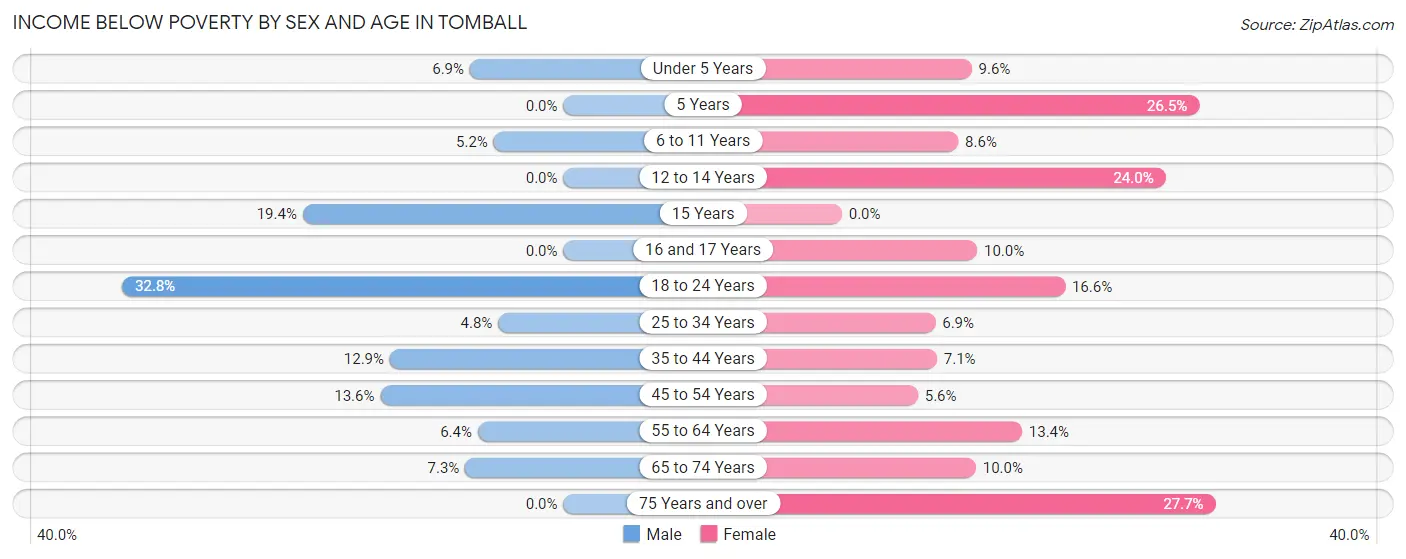
| Age Bracket | Male | Female |
| Under 5 Years | 32 (6.9%) | 40 (9.6%) |
| 5 Years | 0 (0.0%) | 26 (26.5%) |
| 6 to 11 Years | 25 (5.2%) | 33 (8.6%) |
| 12 to 14 Years | 0 (0.0%) | 31 (24.0%) |
| 15 Years | 6 (19.4%) | 0 (0.0%) |
| 16 and 17 Years | 0 (0.0%) | 27 (10.0%) |
| 18 to 24 Years | 174 (32.8%) | 90 (16.6%) |
| 25 to 34 Years | 49 (4.8%) | 53 (6.9%) |
| 35 to 44 Years | 97 (12.9%) | 48 (7.1%) |
| 45 to 54 Years | 75 (13.6%) | 31 (5.6%) |
| 55 to 64 Years | 43 (6.4%) | 129 (13.4%) |
| 65 to 74 Years | 46 (7.3%) | 61 (10.0%) |
| 75 Years and over | 0 (0.0%) | 228 (27.7%) |
| Total | 547 (9.3%) | 797 (12.6%) |
Income Above Poverty by Sex and Age in Tomball
According to the poverty statistics in Tomball, males aged 5 years and females aged 15 years are the age groups that are most secure financially, with 100.0% of males and 100.0% of females in these age groups living above the poverty line.
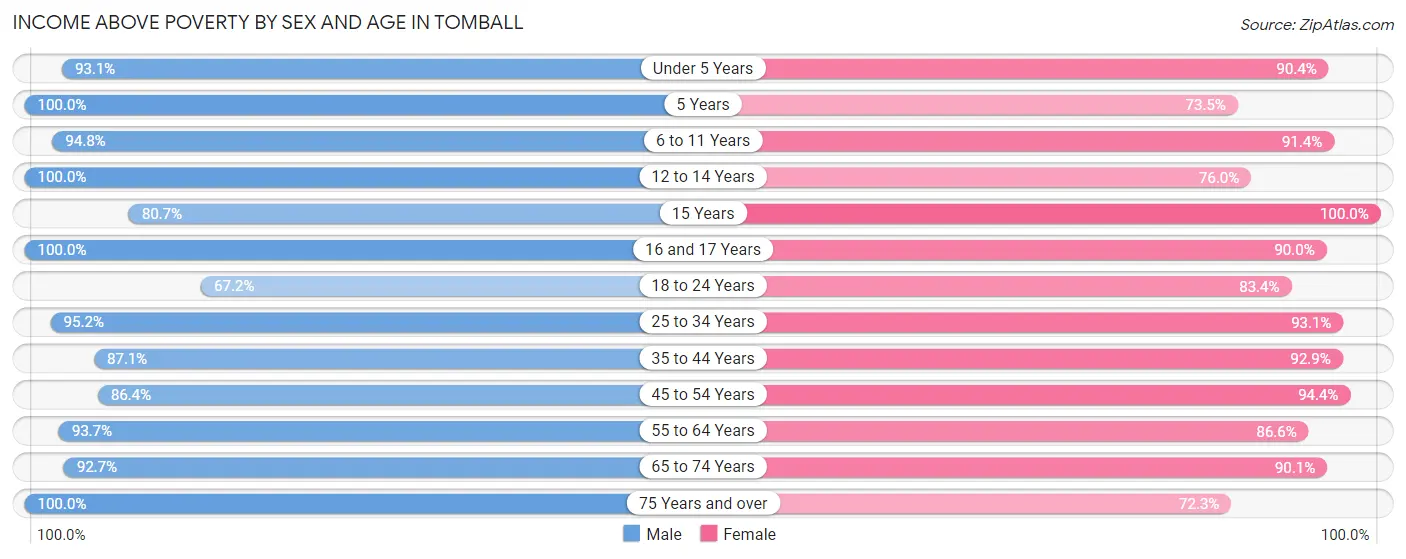
| Age Bracket | Male | Female |
| Under 5 Years | 429 (93.1%) | 375 (90.4%) |
| 5 Years | 55 (100.0%) | 72 (73.5%) |
| 6 to 11 Years | 459 (94.8%) | 349 (91.4%) |
| 12 to 14 Years | 245 (100.0%) | 98 (76.0%) |
| 15 Years | 25 (80.6%) | 91 (100.0%) |
| 16 and 17 Years | 128 (100.0%) | 242 (90.0%) |
| 18 to 24 Years | 357 (67.2%) | 453 (83.4%) |
| 25 to 34 Years | 963 (95.2%) | 711 (93.1%) |
| 35 to 44 Years | 656 (87.1%) | 632 (92.9%) |
| 45 to 54 Years | 477 (86.4%) | 519 (94.4%) |
| 55 to 64 Years | 634 (93.6%) | 836 (86.6%) |
| 65 to 74 Years | 585 (92.7%) | 552 (90.0%) |
| 75 Years and over | 290 (100.0%) | 594 (72.3%) |
| Total | 5,303 (90.6%) | 5,524 (87.4%) |
Income Below Poverty Among Married-Couple Families in Tomball
The poverty statistics for married-couple families in Tomball show that 4.4% or 94 of the total 2,146 families live below the poverty line. Families with 3 or 4 children have the highest poverty rate of 27.8%, comprising of 32 families. On the other hand, families with 5 or more children have the lowest poverty rate of 0.0%, which includes 0 families.
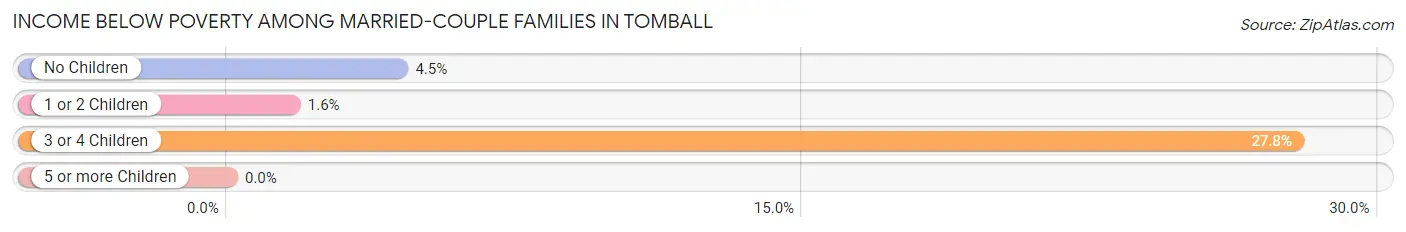
| Children | Above Poverty | Below Poverty |
| No Children | 988 (95.6%) | 46 (4.4%) |
| 1 or 2 Children | 962 (98.4%) | 16 (1.6%) |
| 3 or 4 Children | 83 (72.2%) | 32 (27.8%) |
| 5 or more Children | 19 (100.0%) | 0 (0.0%) |
| Total | 2,052 (95.6%) | 94 (4.4%) |
Income Below Poverty Among Single-Parent Households in Tomball
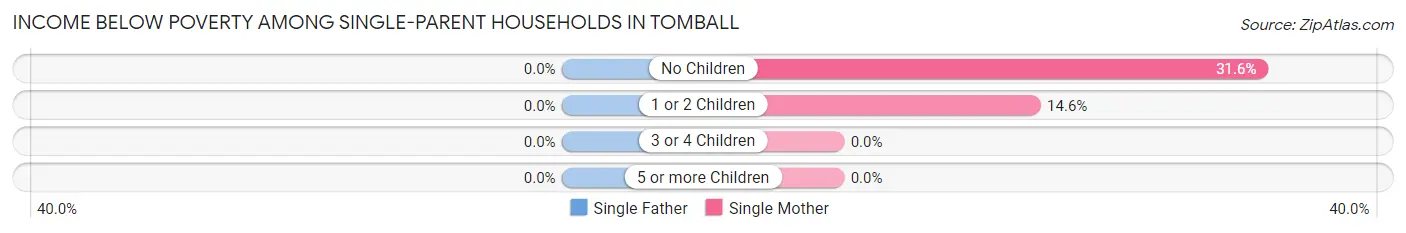
| Children | Single Father | Single Mother |
| No Children | 0 (0.0%) | 31 (31.6%) |
| 1 or 2 Children | 0 (0.0%) | 59 (14.6%) |
| 3 or 4 Children | 0 (0.0%) | 0 (0.0%) |
| 5 or more Children | 0 (0.0%) | 0 (0.0%) |
| Total | 0 (0.0%) | 90 (15.9%) |
Income Below Poverty Among Married-Couple vs Single-Parent Households in Tomball
The poverty data for Tomball shows that 94 of the married-couple family households (4.4%) and 90 of the single-parent households (14.2%) are living below the poverty level. Within the married-couple family households, those with 3 or 4 children have the highest poverty rate, with 32 households (27.8%) falling below the poverty line. Among the single-parent households, those with no children have the highest poverty rate, with 31 household (19.6%) living below poverty.
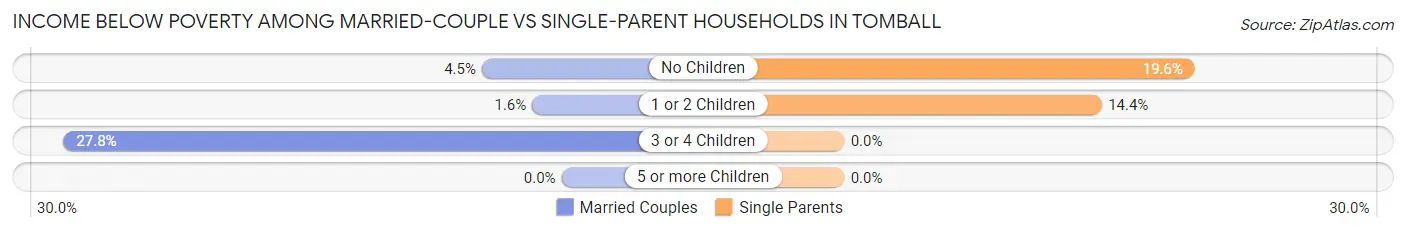
| Children | Married-Couple Families | Single-Parent Households |
| No Children | 46 (4.4%) | 31 (19.6%) |
| 1 or 2 Children | 16 (1.6%) | 59 (14.4%) |
| 3 or 4 Children | 32 (27.8%) | 0 (0.0%) |
| 5 or more Children | 0 (0.0%) | 0 (0.0%) |
| Total | 94 (4.4%) | 90 (14.2%) |
Race in Tomball
The most populous races in Tomball are White / Caucasian (9,878 | 78.2%), Hispanic or Latino (3,350 | 26.5%), and Two or more Races (1,402 | 11.1%).
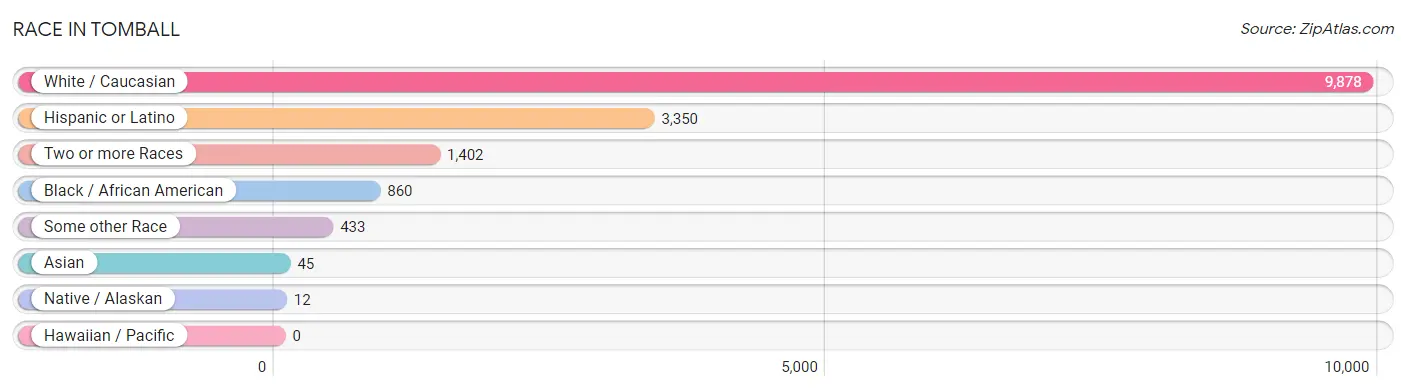
| Race | # Population | % Population |
| Asian | 45 | 0.4% |
| Black / African American | 860 | 6.8% |
| Hawaiian / Pacific | 0 | 0.0% |
| Hispanic or Latino | 3,350 | 26.5% |
| Native / Alaskan | 12 | 0.1% |
| White / Caucasian | 9,878 | 78.2% |
| Two or more Races | 1,402 | 11.1% |
| Some other Race | 433 | 3.4% |
| Total | 12,630 | 100.0% |
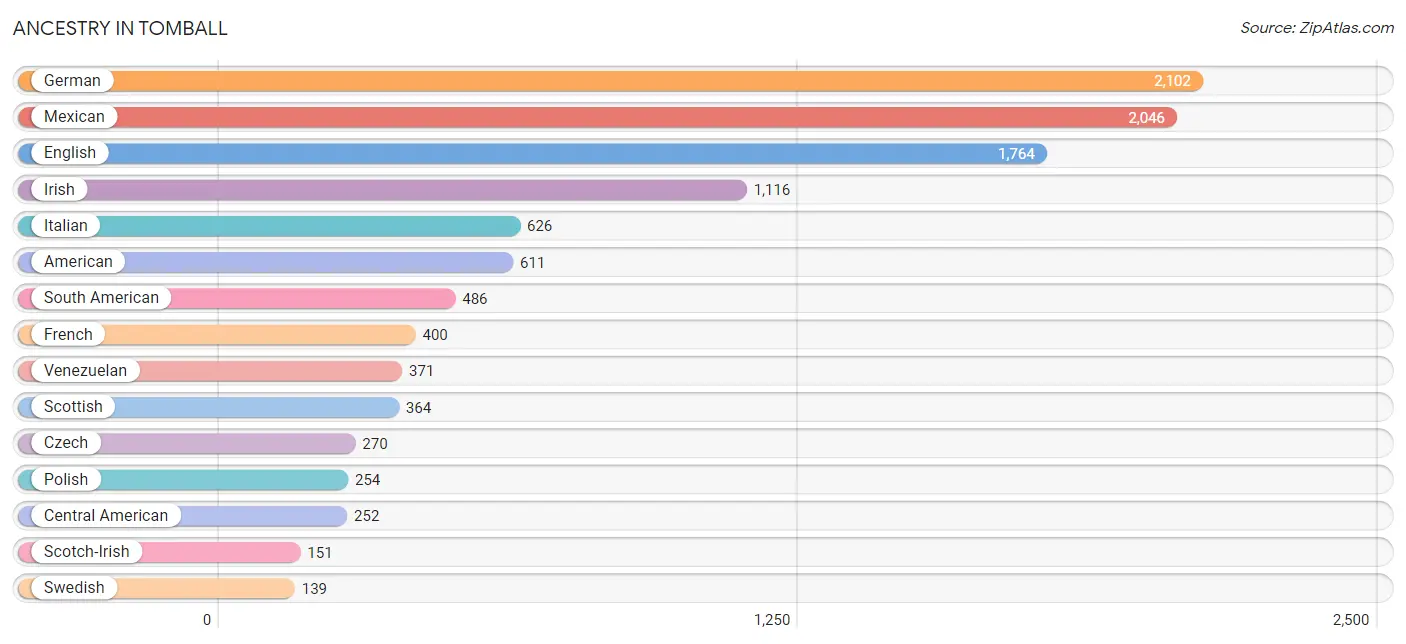
Ancestry in Tomball
The most populous ancestries reported in Tomball are German (2,102 | 16.6%), Mexican (2,046 | 16.2%), English (1,764 | 14.0%), Irish (1,116 | 8.8%), and Italian (626 | 5.0%), together accounting for 60.6% of all Tomball residents.
| Ancestry | # Population | % Population |
| African | 90 | 0.7% |
| American | 611 | 4.8% |
| Arab | 56 | 0.4% |
| Austrian | 50 | 0.4% |
| Belgian | 3 | 0.0% |
| Belizean | 72 | 0.6% |
| Bhutanese | 1 | 0.0% |
| British | 65 | 0.5% |
| Burmese | 26 | 0.2% |
| Cajun | 5 | 0.0% |
| Canadian | 26 | 0.2% |
| Central American | 252 | 2.0% |
| Chippewa | 8 | 0.1% |
| Colombian | 39 | 0.3% |
| Croatian | 82 | 0.6% |
| Cuban | 71 | 0.6% |
| Czech | 270 | 2.1% |
| Czechoslovakian | 40 | 0.3% |
| Dutch | 52 | 0.4% |
| Eastern European | 14 | 0.1% |
| English | 1,764 | 14.0% |
| European | 107 | 0.9% |
| French | 400 | 3.2% |
| French Canadian | 19 | 0.2% |
| German | 2,102 | 16.6% |
| Honduran | 124 | 1.0% |
| Hungarian | 22 | 0.2% |
| Indian (Asian) | 15 | 0.1% |
| Irish | 1,116 | 8.8% |
| Italian | 626 | 5.0% |
| Jordanian | 52 | 0.4% |
| Korean | 12 | 0.1% |
| Latvian | 58 | 0.5% |
| Lebanese | 4 | 0.0% |
| Mexican | 2,046 | 16.2% |
| Native Hawaiian | 4 | 0.0% |
| Nigerian | 6 | 0.1% |
| Northern European | 5 | 0.0% |
| Norwegian | 21 | 0.2% |
| Panamanian | 6 | 0.1% |
| Peruvian | 76 | 0.6% |
| Polish | 254 | 2.0% |
| Portuguese | 4 | 0.0% |
| Puerto Rican | 129 | 1.0% |
| Russian | 25 | 0.2% |
| Salvadoran | 122 | 1.0% |
| Scandinavian | 28 | 0.2% |
| Scotch-Irish | 151 | 1.2% |
| Scottish | 364 | 2.9% |
| South American | 486 | 3.8% |
| Spaniard | 87 | 0.7% |
| Spanish | 36 | 0.3% |
| Sri Lankan | 29 | 0.2% |
| Subsaharan African | 96 | 0.8% |
| Swedish | 139 | 1.1% |
| Swiss | 18 | 0.1% |
| Thai | 8 | 0.1% |
| Ukrainian | 4 | 0.0% |
| Venezuelan | 371 | 2.9% |
| Welsh | 39 | 0.3% | View All 60 Rows |
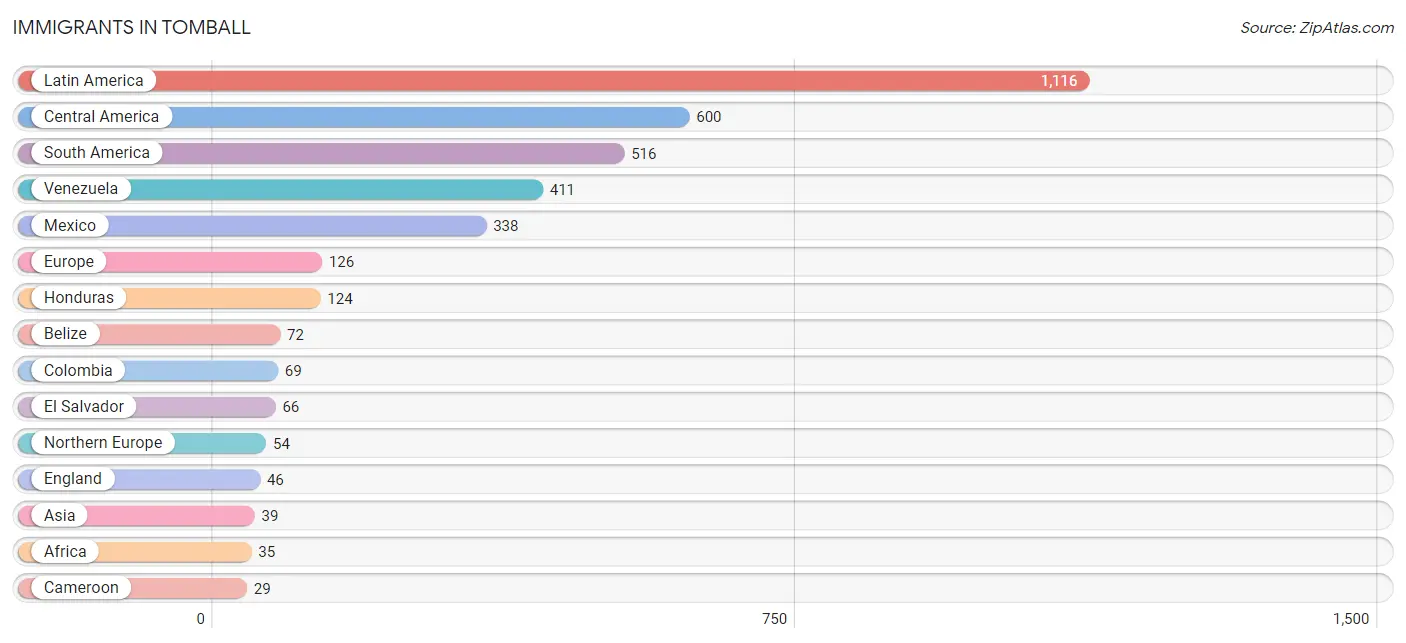
Immigrants in Tomball
The most numerous immigrant groups reported in Tomball came from Latin America (1,116 | 8.8%), Central America (600 | 4.8%), South America (516 | 4.1%), Venezuela (411 | 3.3%), and Mexico (338 | 2.7%), together accounting for 23.6% of all Tomball residents.
| Immigration Origin | # Population | % Population |
| Africa | 35 | 0.3% |
| Asia | 39 | 0.3% |
| Austria | 10 | 0.1% |
| Belize | 72 | 0.6% |
| Brazil | 10 | 0.1% |
| Cameroon | 29 | 0.2% |
| Canada | 12 | 0.1% |
| Central America | 600 | 4.8% |
| China | 10 | 0.1% |
| Colombia | 69 | 0.5% |
| Eastern Asia | 10 | 0.1% |
| Eastern Europe | 25 | 0.2% |
| El Salvador | 66 | 0.5% |
| England | 46 | 0.4% |
| Europe | 126 | 1.0% |
| Germany | 10 | 0.1% |
| Honduras | 124 | 1.0% |
| India | 8 | 0.1% |
| Ireland | 8 | 0.1% |
| Italy | 8 | 0.1% |
| Latin America | 1,116 | 8.8% |
| Mexico | 338 | 2.7% |
| Middle Africa | 29 | 0.2% |
| Northern Europe | 54 | 0.4% |
| Pakistan | 9 | 0.1% |
| Peru | 26 | 0.2% |
| Philippines | 12 | 0.1% |
| Russia | 25 | 0.2% |
| South America | 516 | 4.1% |
| South Central Asia | 17 | 0.1% |
| South Eastern Asia | 12 | 0.1% |
| Southern Europe | 27 | 0.2% |
| Spain | 19 | 0.2% |
| Taiwan | 1 | 0.0% |
| Venezuela | 411 | 3.3% |
| Western Europe | 20 | 0.2% | View All 36 Rows |
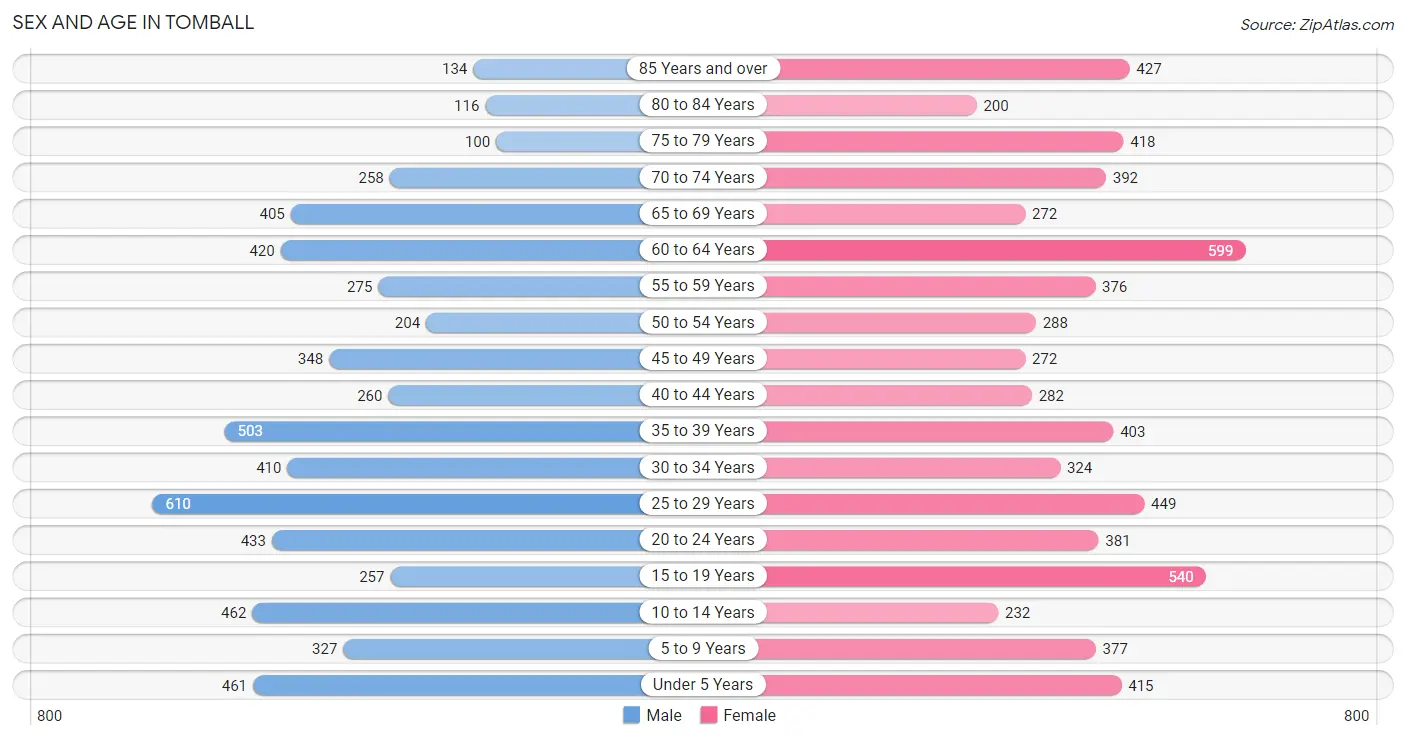
Sex and Age in Tomball
Sex and Age in Tomball
The most populous age groups in Tomball are 25 to 29 Years (610 | 10.2%) for men and 60 to 64 Years (599 | 9.0%) for women.
| Age Bracket | Male | Female |
| Under 5 Years | 461 (7.7%) | 415 (6.2%) |
| 5 to 9 Years | 327 (5.5%) | 377 (5.7%) |
| 10 to 14 Years | 462 (7.7%) | 232 (3.5%) |
| 15 to 19 Years | 257 (4.3%) | 540 (8.1%) |
| 20 to 24 Years | 433 (7.2%) | 381 (5.7%) |
| 25 to 29 Years | 610 (10.2%) | 449 (6.8%) |
| 30 to 34 Years | 410 (6.9%) | 324 (4.9%) |
| 35 to 39 Years | 503 (8.4%) | 403 (6.1%) |
| 40 to 44 Years | 260 (4.3%) | 282 (4.2%) |
| 45 to 49 Years | 348 (5.8%) | 272 (4.1%) |
| 50 to 54 Years | 204 (3.4%) | 288 (4.3%) |
| 55 to 59 Years | 275 (4.6%) | 376 (5.7%) |
| 60 to 64 Years | 420 (7.0%) | 599 (9.0%) |
| 65 to 69 Years | 405 (6.8%) | 272 (4.1%) |
| 70 to 74 Years | 258 (4.3%) | 392 (5.9%) |
| 75 to 79 Years | 100 (1.7%) | 418 (6.3%) |
| 80 to 84 Years | 116 (1.9%) | 200 (3.0%) |
| 85 Years and over | 134 (2.2%) | 427 (6.4%) |
| Total | 5,983 (100.0%) | 6,647 (100.0%) |
Families and Households in Tomball
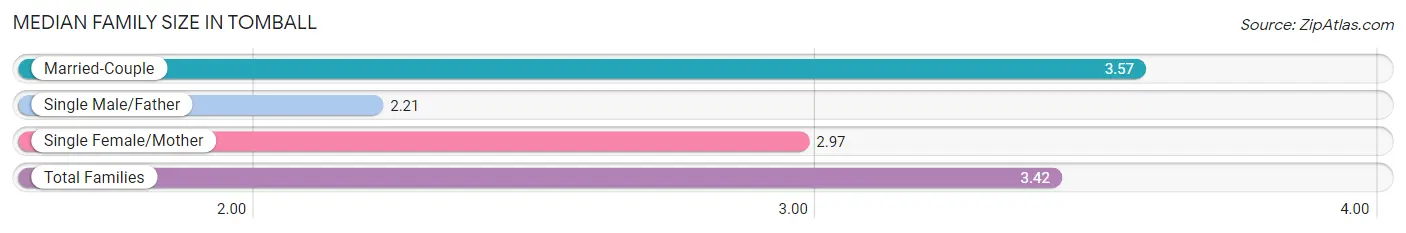
Median Family Size in Tomball
The median family size in Tomball is 3.42 persons per family, with married-couple families (2,146 | 77.2%) accounting for the largest median family size of 3.57 persons per family. On the other hand, single male/father families (67 | 2.4%) represent the smallest median family size with 2.21 persons per family.
| Family Type | # Families | Family Size |
| Married-Couple | 2,146 (77.2%) | 3.57 |
| Single Male/Father | 67 (2.4%) | 2.21 |
| Single Female/Mother | 565 (20.3%) | 2.97 |
| Total Families | 2,778 (100.0%) | 3.42 |
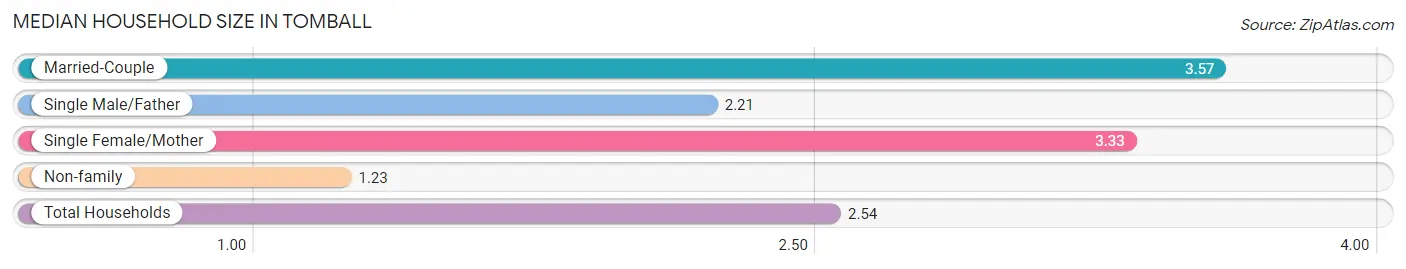
Median Household Size in Tomball
The median household size in Tomball is 2.54 persons per household, with married-couple households (2,146 | 45.0%) accounting for the largest median household size of 3.57 persons per household. non-family households (1,995 | 41.8%) represent the smallest median household size with 1.23 persons per household.
| Household Type | # Households | Household Size |
| Married-Couple | 2,146 (45.0%) | 3.57 |
| Single Male/Father | 67 (1.4%) | 2.21 |
| Single Female/Mother | 565 (11.8%) | 3.33 |
| Non-family | 1,995 (41.8%) | 1.23 |
| Total Households | 4,773 (100.0%) | 2.54 |
Household Size by Marriage Status in Tomball
Out of a total of 4,773 households in Tomball, 2,778 (58.2%) are family households, while 1,995 (41.8%) are nonfamily households. The most numerous type of family households are 2-person households, comprising 1,014, and the most common type of nonfamily households are 1-person households, comprising 1,674.
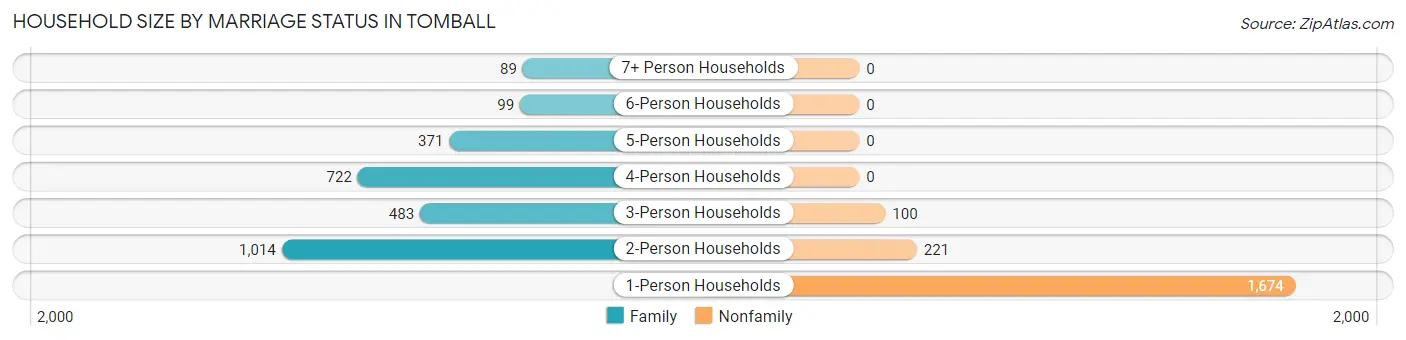
| Household Size | Family Households | Nonfamily Households |
| 1-Person Households | - | 1,674 (35.1%) |
| 2-Person Households | 1,014 (21.2%) | 221 (4.6%) |
| 3-Person Households | 483 (10.1%) | 100 (2.1%) |
| 4-Person Households | 722 (15.1%) | 0 (0.0%) |
| 5-Person Households | 371 (7.8%) | 0 (0.0%) |
| 6-Person Households | 99 (2.1%) | 0 (0.0%) |
| 7+ Person Households | 89 (1.9%) | 0 (0.0%) |
| Total | 2,778 (58.2%) | 1,995 (41.8%) |
Female Fertility in Tomball
Fertility by Age in Tomball
Average fertility rate in Tomball is 45.0 births per 1,000 women. Women in the age bracket of 20 to 34 years have the highest fertility rate with 105.0 births per 1,000 women. Women in the age bracket of 20 to 34 years acount for 100.0% of all women with births.
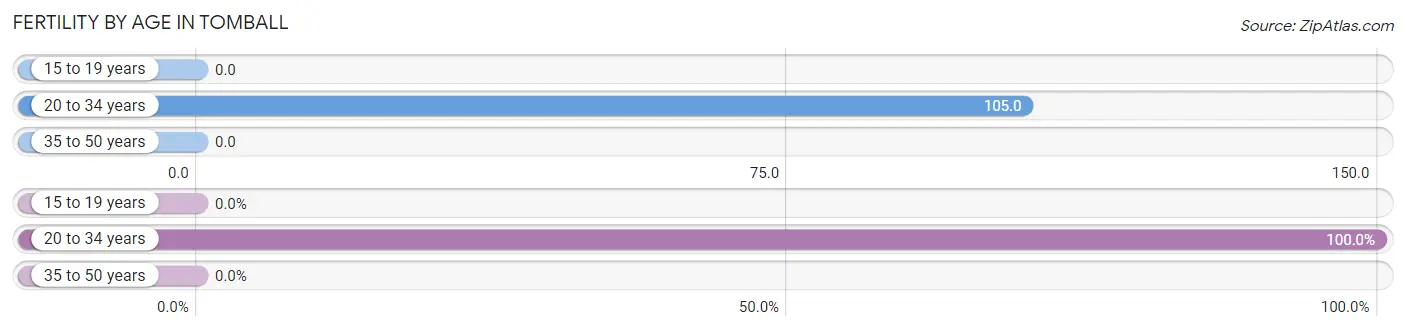
| Age Bracket | Women with Births | Births / 1,000 Women |
| 15 to 19 years | 0 (0.0%) | 0.0 |
| 20 to 34 years | 121 (100.0%) | 105.0 |
| 35 to 50 years | 0 (0.0%) | 0.0 |
| Total | 121 (100.0%) | 45.0 |
Fertility by Age by Marriage Status in Tomball
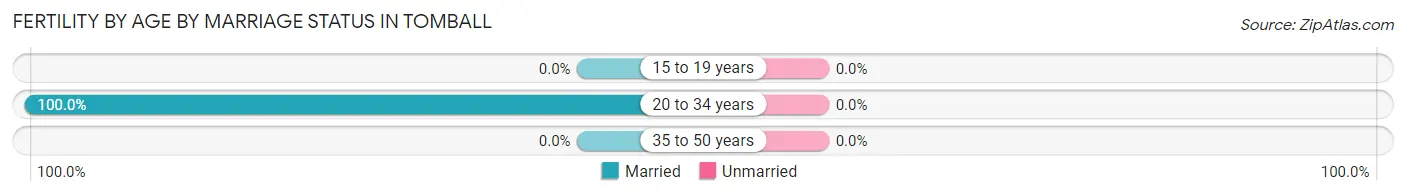
| Age Bracket | Married | Unmarried |
| 15 to 19 years | 0 (0.0%) | 0 (0.0%) |
| 20 to 34 years | 121 (100.0%) | 0 (0.0%) |
| 35 to 50 years | 0 (0.0%) | 0 (0.0%) |
| Total | 121 (100.0%) | 0 (0.0%) |
Fertility by Education in Tomball
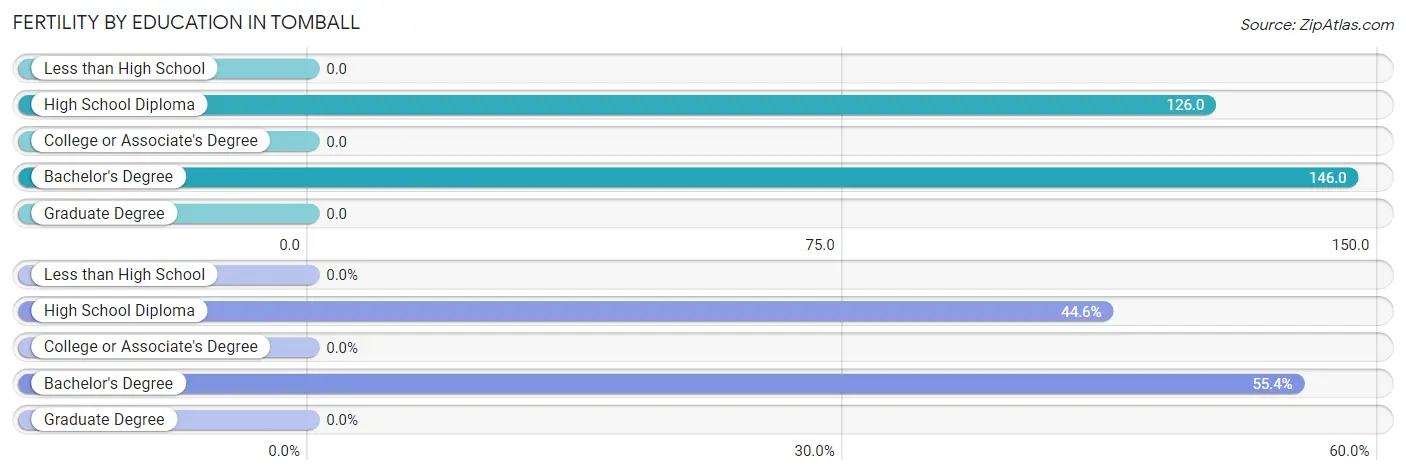
| Educational Attainment | Women with Births | Births / 1,000 Women |
| Less than High School | 0 (0.0%) | 0.0 |
| High School Diploma | 54 (44.6%) | 126.0 |
| College or Associate's Degree | 0 (0.0%) | 0.0 |
| Bachelor's Degree | 67 (55.4%) | 146.0 |
| Graduate Degree | 0 (0.0%) | 0.0 |
| Total | 121 (100.0%) | 45.0 |
Fertility by Education by Marriage Status in Tomball
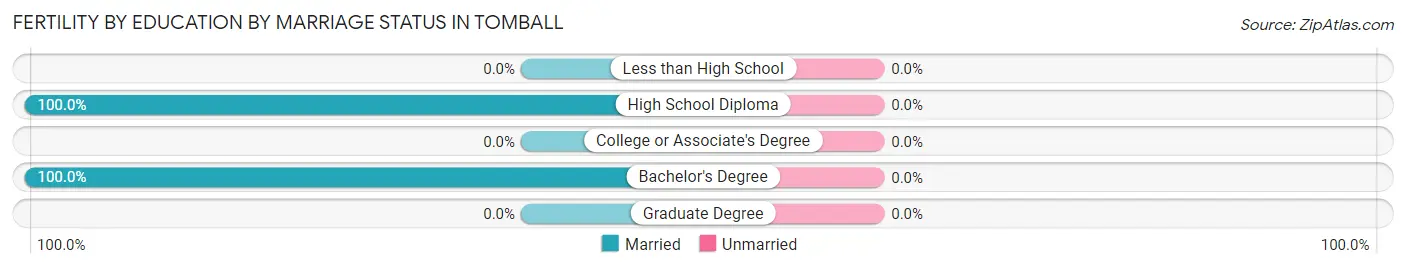
| Educational Attainment | Married | Unmarried |
| Less than High School | 0 (0.0%) | 0 (0.0%) |
| High School Diploma | 54 (100.0%) | 0 (0.0%) |
| College or Associate's Degree | 0 (0.0%) | 0 (0.0%) |
| Bachelor's Degree | 67 (100.0%) | 0 (0.0%) |
| Graduate Degree | 0 (0.0%) | 0 (0.0%) |
| Total | 121 (100.0%) | 0 (0.0%) |
Employment Characteristics in Tomball
Employment by Class of Employer in Tomball
Among the 5,476 employed individuals in Tomball, private company employees (4,014 | 73.3%), self-employed (not incorporated) (593 | 10.8%), and local government employees (411 | 7.5%) make up the most common classes of employment.
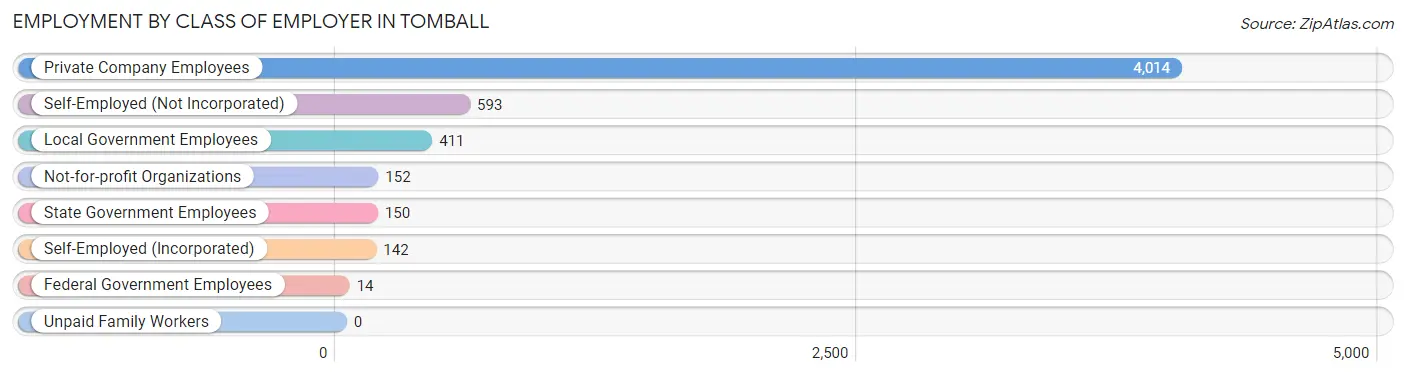
| Employer Class | # Employees | % Employees |
| Private Company Employees | 4,014 | 73.3% |
| Self-Employed (Incorporated) | 142 | 2.6% |
| Self-Employed (Not Incorporated) | 593 | 10.8% |
| Not-for-profit Organizations | 152 | 2.8% |
| Local Government Employees | 411 | 7.5% |
| State Government Employees | 150 | 2.7% |
| Federal Government Employees | 14 | 0.3% |
| Unpaid Family Workers | 0 | 0.0% |
| Total | 5,476 | 100.0% |
Employment Status by Age in Tomball
According to the labor force statistics for Tomball, out of the total population over 16 years of age (10,234), 56.4% or 5,772 individuals are in the labor force, with 3.2% or 185 of them unemployed. The age group with the highest labor force participation rate is 30 to 34 years, with 90.3% or 663 individuals in the labor force. Within the labor force, the 20 to 24 years age range has the highest percentage of unemployed individuals, with 19.6% or 72 of them being unemployed.
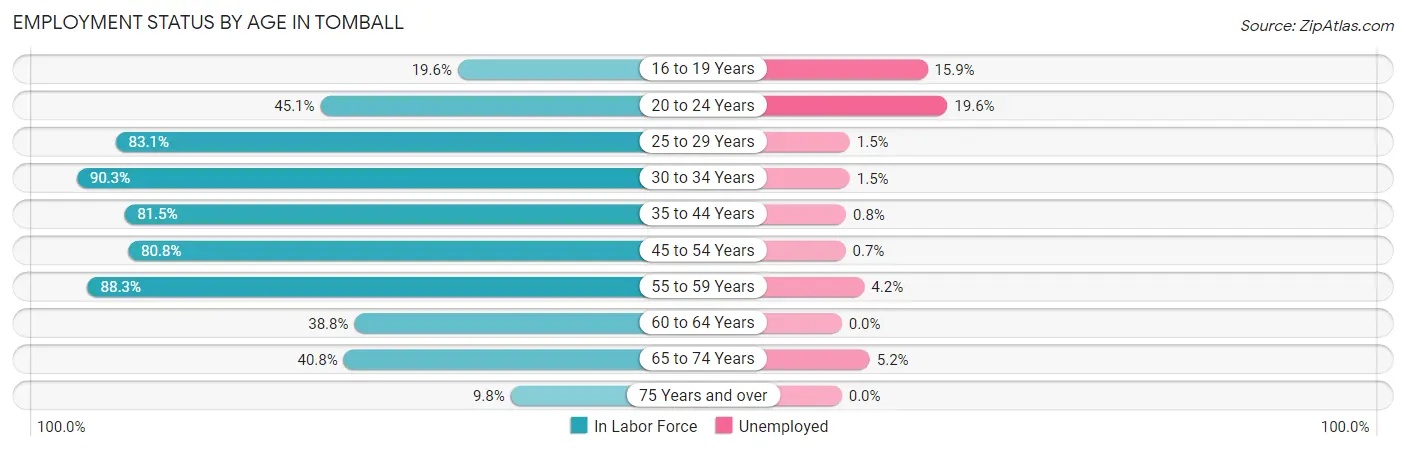
| Age Bracket | In Labor Force | Unemployed |
| 16 to 19 Years | 132 (19.6%) | 21 (15.9%) |
| 20 to 24 Years | 367 (45.1%) | 72 (19.6%) |
| 25 to 29 Years | 880 (83.1%) | 13 (1.5%) |
| 30 to 34 Years | 663 (90.3%) | 10 (1.5%) |
| 35 to 44 Years | 1,180 (81.5%) | 9 (0.8%) |
| 45 to 54 Years | 898 (80.8%) | 6 (0.7%) |
| 55 to 59 Years | 575 (88.3%) | 24 (4.2%) |
| 60 to 64 Years | 395 (38.8%) | 0 (0.0%) |
| 65 to 74 Years | 541 (40.8%) | 28 (5.2%) |
| 75 Years and over | 137 (9.8%) | 0 (0.0%) |
| Total | 5,772 (56.4%) | 185 (3.2%) |
Employment Status by Educational Attainment in Tomball
According to labor force statistics for Tomball, 76.2% of individuals (4,590) out of the total population between 25 and 64 years of age (6,023) are in the labor force, with 1.4% or 64 of them being unemployed. The group with the highest labor force participation rate are those with the educational attainment of bachelor's degree or higher, with 88.6% or 1,987 individuals in the labor force. Within the labor force, individuals with less than high school education have the highest percentage of unemployment, with 12.0% or 10 of them being unemployed.
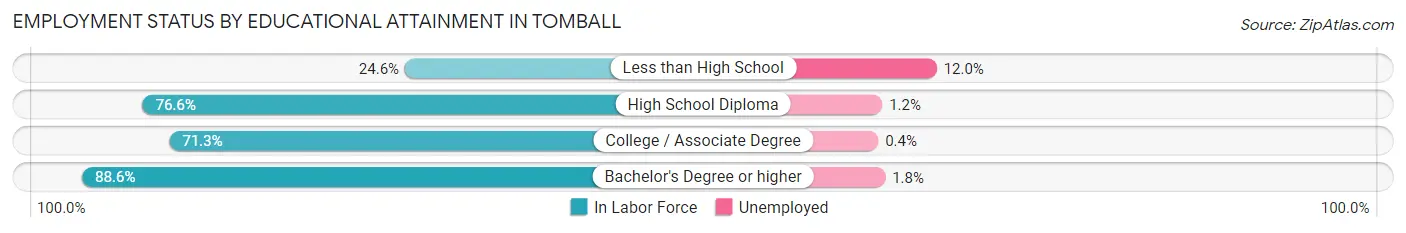
| Educational Attainment | In Labor Force | Unemployed |
| Less than High School | 83 (24.6%) | 41 (12.0%) |
| High School Diploma | 981 (76.6%) | 15 (1.2%) |
| College / Associate Degree | 1,541 (71.3%) | 9 (0.4%) |
| Bachelor's Degree or higher | 1,987 (88.6%) | 40 (1.8%) |
| Total | 4,590 (76.2%) | 84 (1.4%) |
Employment Occupations by Sex in Tomball
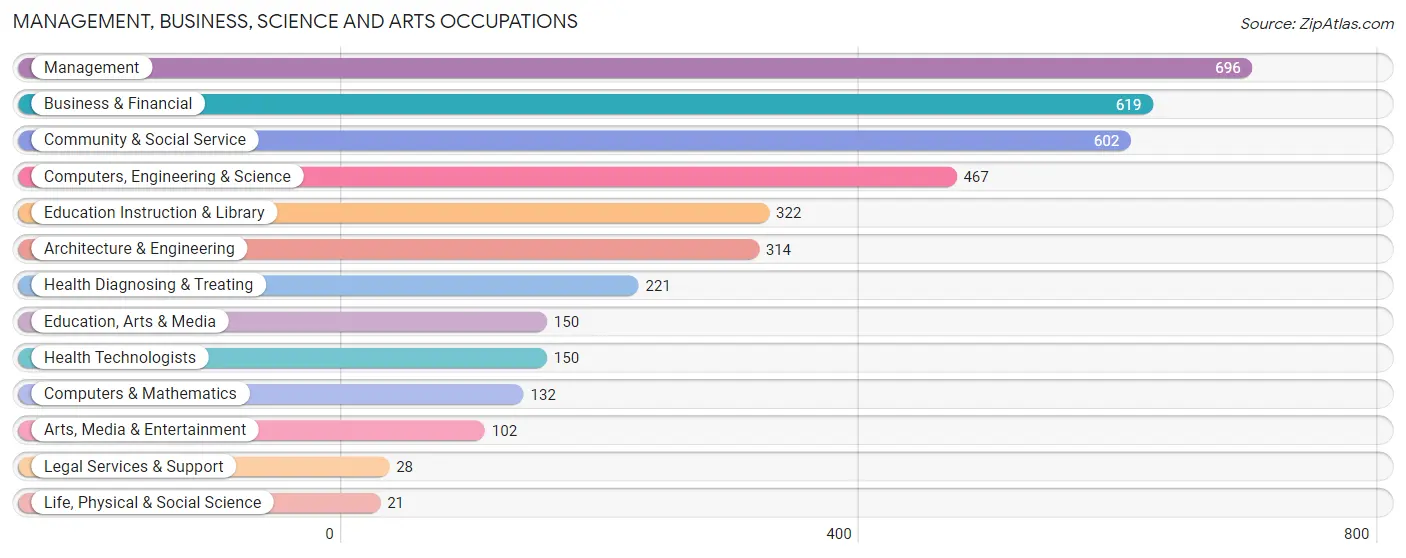
Management, Business, Science and Arts Occupations
The most common Management, Business, Science and Arts occupations in Tomball are Management (696 | 12.5%), Business & Financial (619 | 11.1%), Community & Social Service (602 | 10.8%), Computers, Engineering & Science (467 | 8.4%), and Education Instruction & Library (322 | 5.8%).
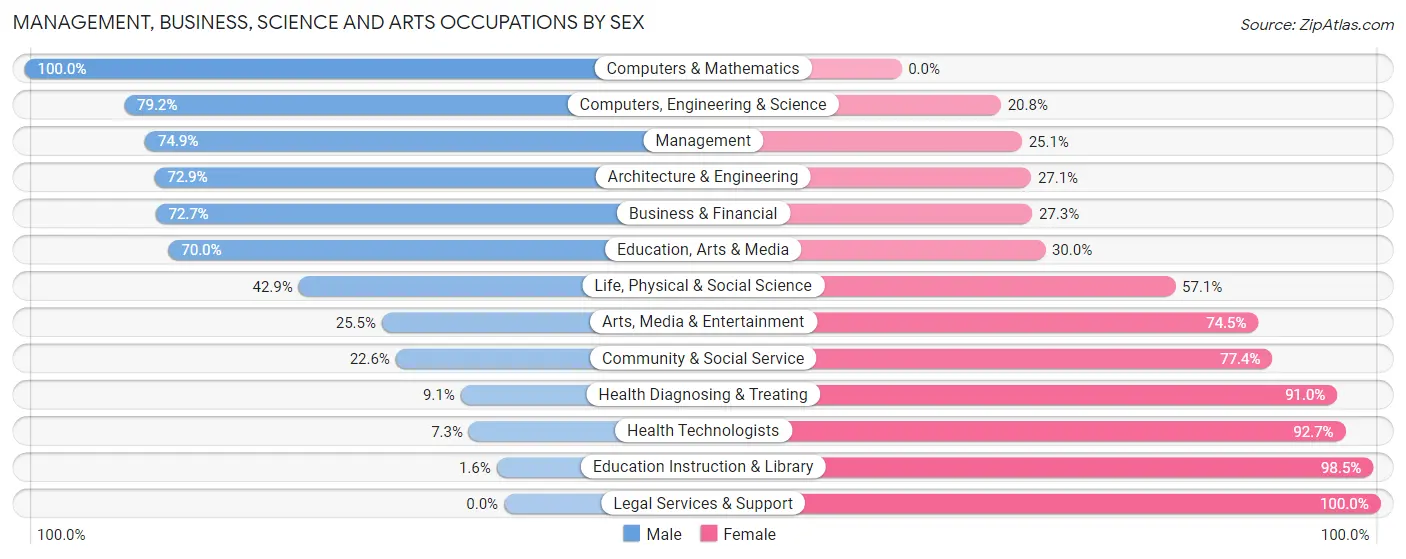
Management, Business, Science and Arts Occupations by Sex
Within the Management, Business, Science and Arts occupations in Tomball, the most male-oriented occupations are Computers & Mathematics (100.0%), Computers, Engineering & Science (79.2%), and Management (74.9%), while the most female-oriented occupations are Legal Services & Support (100.0%), Education Instruction & Library (98.5%), and Health Technologists (92.7%).
| Occupation | Male | Female |
| Management | 521 (74.9%) | 175 (25.1%) |
| Business & Financial | 450 (72.7%) | 169 (27.3%) |
| Computers, Engineering & Science | 370 (79.2%) | 97 (20.8%) |
| Computers & Mathematics | 132 (100.0%) | 0 (0.0%) |
| Architecture & Engineering | 229 (72.9%) | 85 (27.1%) |
| Life, Physical & Social Science | 9 (42.9%) | 12 (57.1%) |
| Community & Social Service | 136 (22.6%) | 466 (77.4%) |
| Education, Arts & Media | 105 (70.0%) | 45 (30.0%) |
| Legal Services & Support | 0 (0.0%) | 28 (100.0%) |
| Education Instruction & Library | 5 (1.5%) | 317 (98.5%) |
| Arts, Media & Entertainment | 26 (25.5%) | 76 (74.5%) |
| Health Diagnosing & Treating | 20 (9.0%) | 201 (90.9%) |
| Health Technologists | 11 (7.3%) | 139 (92.7%) |
| Total (Category) | 1,497 (57.5%) | 1,108 (42.5%) |
| Total (Overall) | 3,065 (54.9%) | 2,521 (45.1%) |
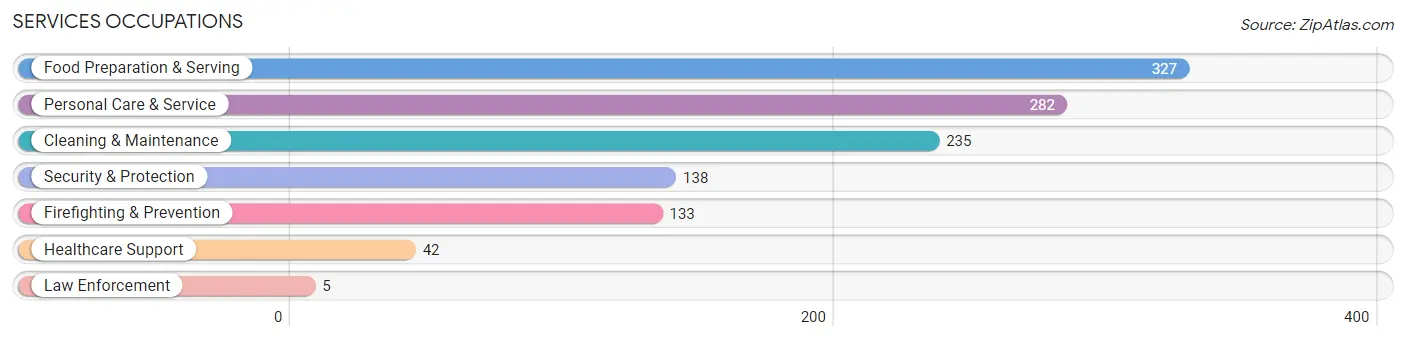
Services Occupations
The most common Services occupations in Tomball are Food Preparation & Serving (327 | 5.9%), Personal Care & Service (282 | 5.1%), Cleaning & Maintenance (235 | 4.2%), Security & Protection (138 | 2.5%), and Firefighting & Prevention (133 | 2.4%).
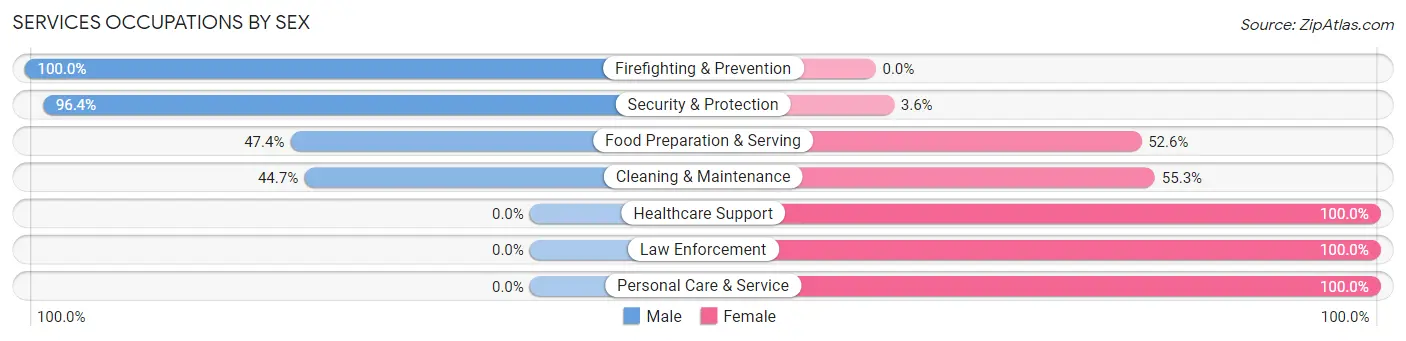
Services Occupations by Sex
Within the Services occupations in Tomball, the most male-oriented occupations are Firefighting & Prevention (100.0%), Security & Protection (96.4%), and Food Preparation & Serving (47.4%), while the most female-oriented occupations are Healthcare Support (100.0%), Law Enforcement (100.0%), and Personal Care & Service (100.0%).
| Occupation | Male | Female |
| Healthcare Support | 0 (0.0%) | 42 (100.0%) |
| Security & Protection | 133 (96.4%) | 5 (3.6%) |
| Firefighting & Prevention | 133 (100.0%) | 0 (0.0%) |
| Law Enforcement | 0 (0.0%) | 5 (100.0%) |
| Food Preparation & Serving | 155 (47.4%) | 172 (52.6%) |
| Cleaning & Maintenance | 105 (44.7%) | 130 (55.3%) |
| Personal Care & Service | 0 (0.0%) | 282 (100.0%) |
| Total (Category) | 393 (38.4%) | 631 (61.6%) |
| Total (Overall) | 3,065 (54.9%) | 2,521 (45.1%) |
Sales and Office Occupations
The most common Sales and Office occupations in Tomball are Office & Administration (582 | 10.4%), and Sales & Related (531 | 9.5%).
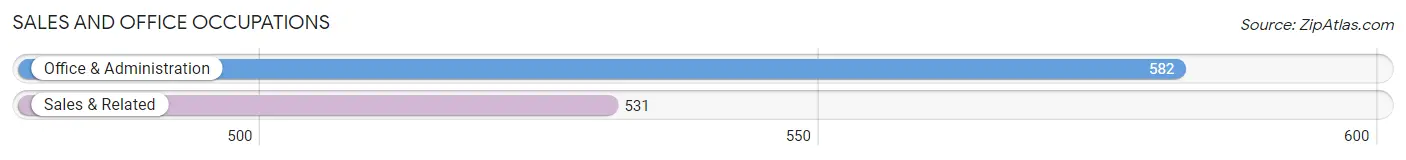
Sales and Office Occupations by Sex
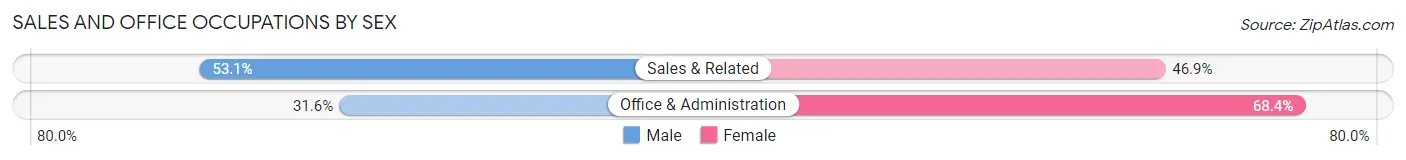
| Occupation | Male | Female |
| Sales & Related | 282 (53.1%) | 249 (46.9%) |
| Office & Administration | 184 (31.6%) | 398 (68.4%) |
| Total (Category) | 466 (41.9%) | 647 (58.1%) |
| Total (Overall) | 3,065 (54.9%) | 2,521 (45.1%) |
Natural Resources, Construction and Maintenance Occupations
The most common Natural Resources, Construction and Maintenance occupations in Tomball are Installation, Maintenance & Repair (287 | 5.1%), and Construction & Extraction (43 | 0.8%).
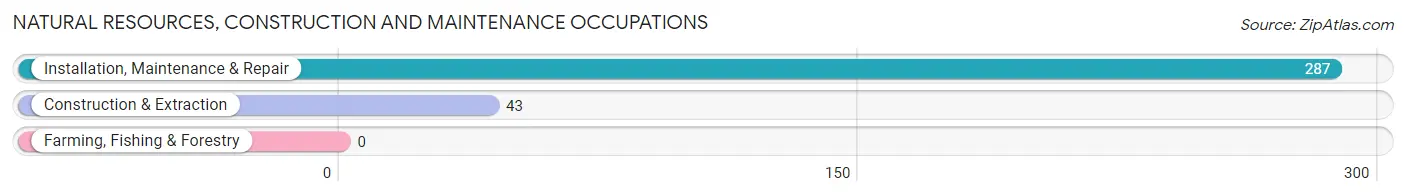
Natural Resources, Construction and Maintenance Occupations by Sex
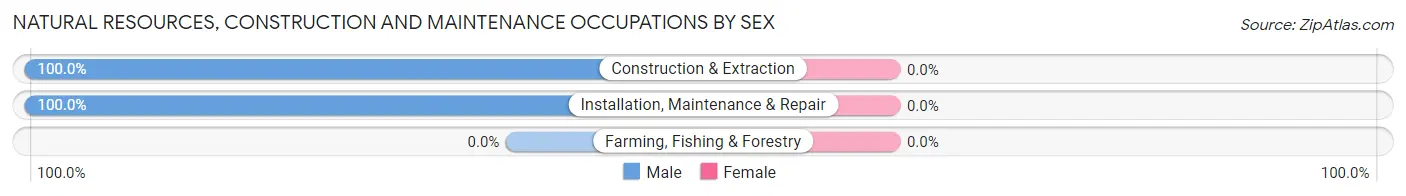
| Occupation | Male | Female |
| Farming, Fishing & Forestry | 0 (0.0%) | 0 (0.0%) |
| Construction & Extraction | 43 (100.0%) | 0 (0.0%) |
| Installation, Maintenance & Repair | 287 (100.0%) | 0 (0.0%) |
| Total (Category) | 330 (100.0%) | 0 (0.0%) |
| Total (Overall) | 3,065 (54.9%) | 2,521 (45.1%) |
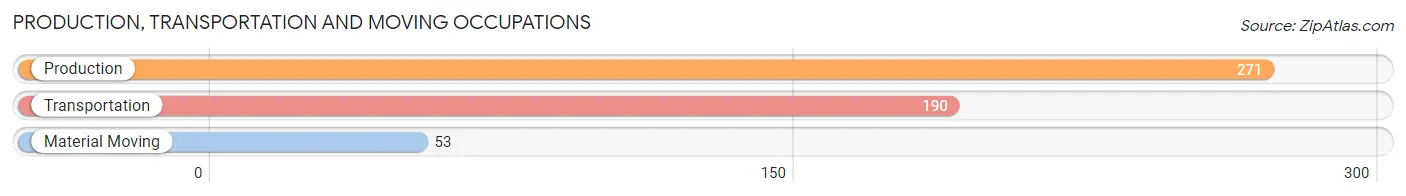
Production, Transportation and Moving Occupations
The most common Production, Transportation and Moving occupations in Tomball are Production (271 | 4.9%), Transportation (190 | 3.4%), and Material Moving (53 | 0.9%).
Production, Transportation and Moving Occupations by Sex
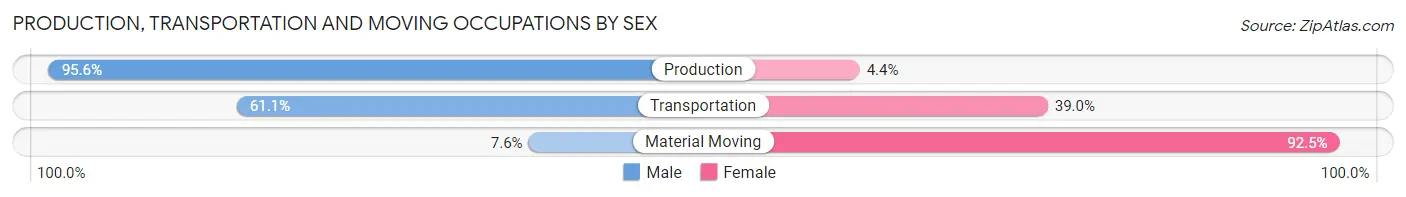
| Occupation | Male | Female |
| Production | 259 (95.6%) | 12 (4.4%) |
| Transportation | 116 (61.1%) | 74 (39.0%) |
| Material Moving | 4 (7.5%) | 49 (92.4%) |
| Total (Category) | 379 (73.7%) | 135 (26.3%) |
| Total (Overall) | 3,065 (54.9%) | 2,521 (45.1%) |
Employment Industries by Sex in Tomball
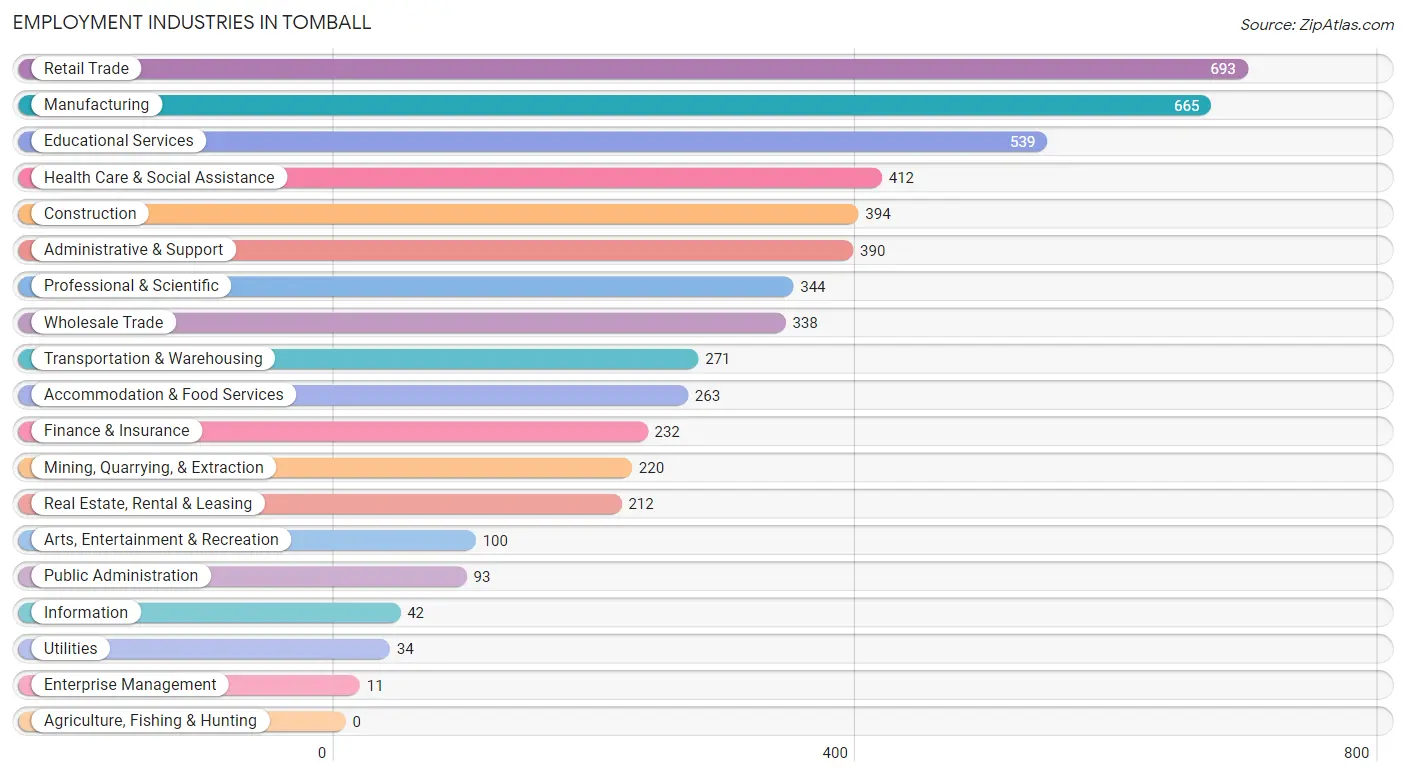
Employment Industries in Tomball
The major employment industries in Tomball include Retail Trade (693 | 12.4%), Manufacturing (665 | 11.9%), Educational Services (539 | 9.7%), Health Care & Social Assistance (412 | 7.4%), and Construction (394 | 7.0%).
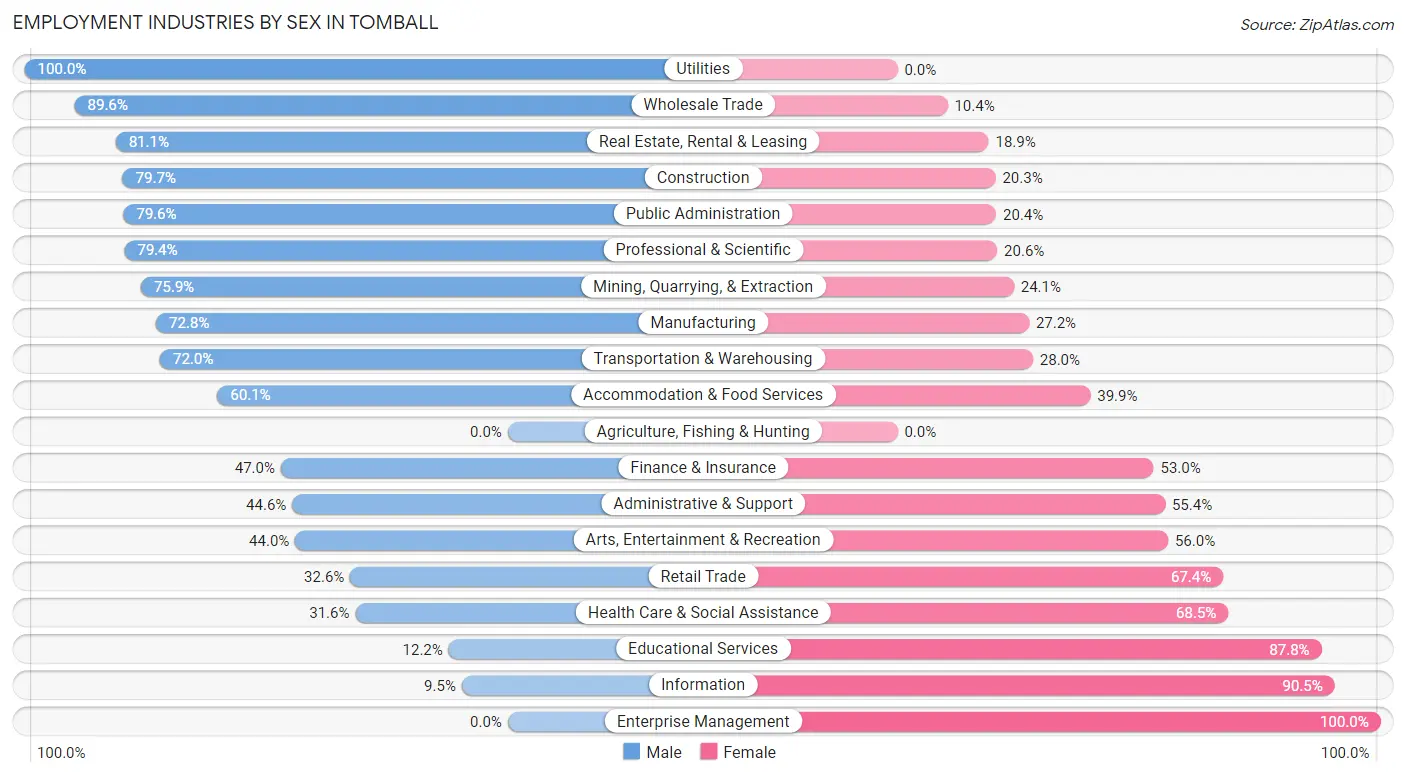
Employment Industries by Sex in Tomball
The Tomball industries that see more men than women are Utilities (100.0%), Wholesale Trade (89.6%), and Real Estate, Rental & Leasing (81.1%), whereas the industries that tend to have a higher number of women are Enterprise Management (100.0%), Information (90.5%), and Educational Services (87.8%).
| Industry | Male | Female |
| Agriculture, Fishing & Hunting | 0 (0.0%) | 0 (0.0%) |
| Mining, Quarrying, & Extraction | 167 (75.9%) | 53 (24.1%) |
| Construction | 314 (79.7%) | 80 (20.3%) |
| Manufacturing | 484 (72.8%) | 181 (27.2%) |
| Wholesale Trade | 303 (89.6%) | 35 (10.4%) |
| Retail Trade | 226 (32.6%) | 467 (67.4%) |
| Transportation & Warehousing | 195 (72.0%) | 76 (28.0%) |
| Utilities | 34 (100.0%) | 0 (0.0%) |
| Information | 4 (9.5%) | 38 (90.5%) |
| Finance & Insurance | 109 (47.0%) | 123 (53.0%) |
| Real Estate, Rental & Leasing | 172 (81.1%) | 40 (18.9%) |
| Professional & Scientific | 273 (79.4%) | 71 (20.6%) |
| Enterprise Management | 0 (0.0%) | 11 (100.0%) |
| Administrative & Support | 174 (44.6%) | 216 (55.4%) |
| Educational Services | 66 (12.2%) | 473 (87.8%) |
| Health Care & Social Assistance | 130 (31.6%) | 282 (68.4%) |
| Arts, Entertainment & Recreation | 44 (44.0%) | 56 (56.0%) |
| Accommodation & Food Services | 158 (60.1%) | 105 (39.9%) |
| Public Administration | 74 (79.6%) | 19 (20.4%) |
| Total | 3,065 (54.9%) | 2,521 (45.1%) |
Education in Tomball
School Enrollment in Tomball
The most common levels of schooling among the 2,987 students in Tomball are college / undergraduate (786 | 26.3%), high school (690 | 23.1%), and elementary school (564 | 18.9%).
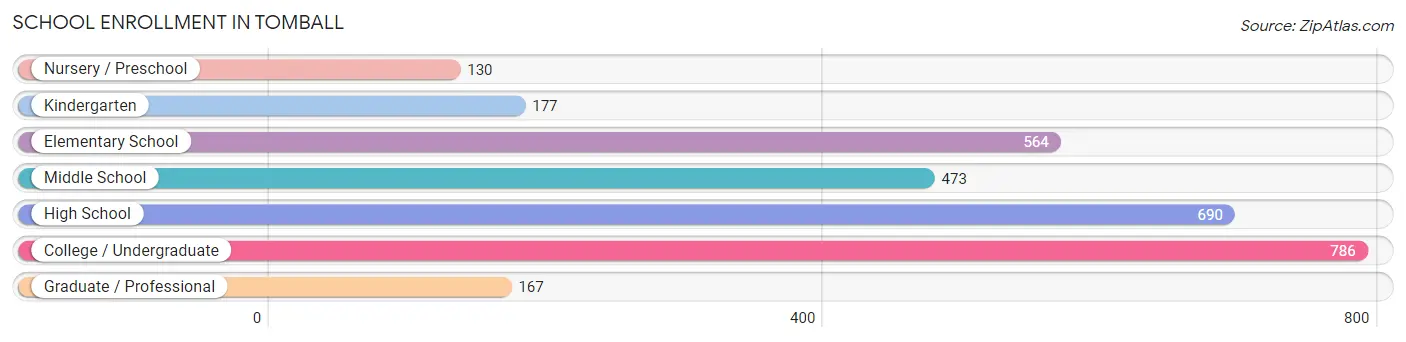
| School Level | # Students | % Students |
| Nursery / Preschool | 130 | 4.3% |
| Kindergarten | 177 | 5.9% |
| Elementary School | 564 | 18.9% |
| Middle School | 473 | 15.8% |
| High School | 690 | 23.1% |
| College / Undergraduate | 786 | 26.3% |
| Graduate / Professional | 167 | 5.6% |
| Total | 2,987 | 100.0% |
School Enrollment by Age by Funding Source in Tomball
Out of a total of 2,987 students who are enrolled in schools in Tomball, 502 (16.8%) attend a private institution, while the remaining 2,485 (83.2%) are enrolled in public schools. The age group of 3 to 4 year olds has the highest likelihood of being enrolled in private schools, with 48 (45.3% in the age bracket) enrolled. Conversely, the age group of 18 to 19 year olds has the lowest likelihood of being enrolled in a private school, with 269 (100.0% in the age bracket) attending a public institution.
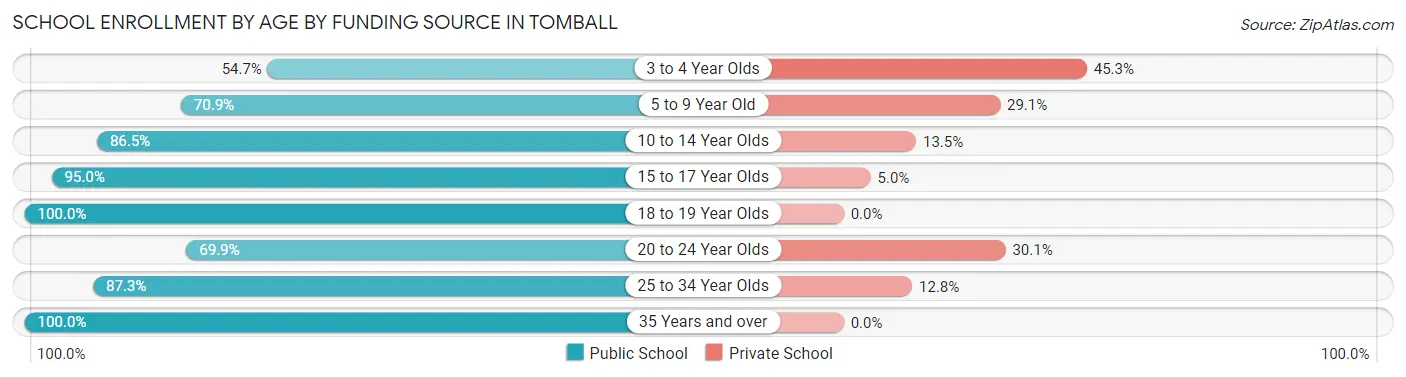
| Age Bracket | Public School | Private School |
| 3 to 4 Year Olds | 58 (54.7%) | 48 (45.3%) |
| 5 to 9 Year Old | 443 (70.9%) | 182 (29.1%) |
| 10 to 14 Year Olds | 584 (86.5%) | 91 (13.5%) |
| 15 to 17 Year Olds | 493 (95.0%) | 26 (5.0%) |
| 18 to 19 Year Olds | 269 (100.0%) | 0 (0.0%) |
| 20 to 24 Year Olds | 255 (69.9%) | 110 (30.1%) |
| 25 to 34 Year Olds | 301 (87.3%) | 44 (12.8%) |
| 35 Years and over | 83 (100.0%) | 0 (0.0%) |
| Total | 2,485 (83.2%) | 502 (16.8%) |
Educational Attainment by Field of Study in Tomball
Business (661 | 21.5%), education (518 | 16.9%), psychology (382 | 12.5%), science & technology (296 | 9.7%), and engineering (255 | 8.3%) are the most common fields of study among 3,067 individuals in Tomball who have obtained a bachelor's degree or higher.
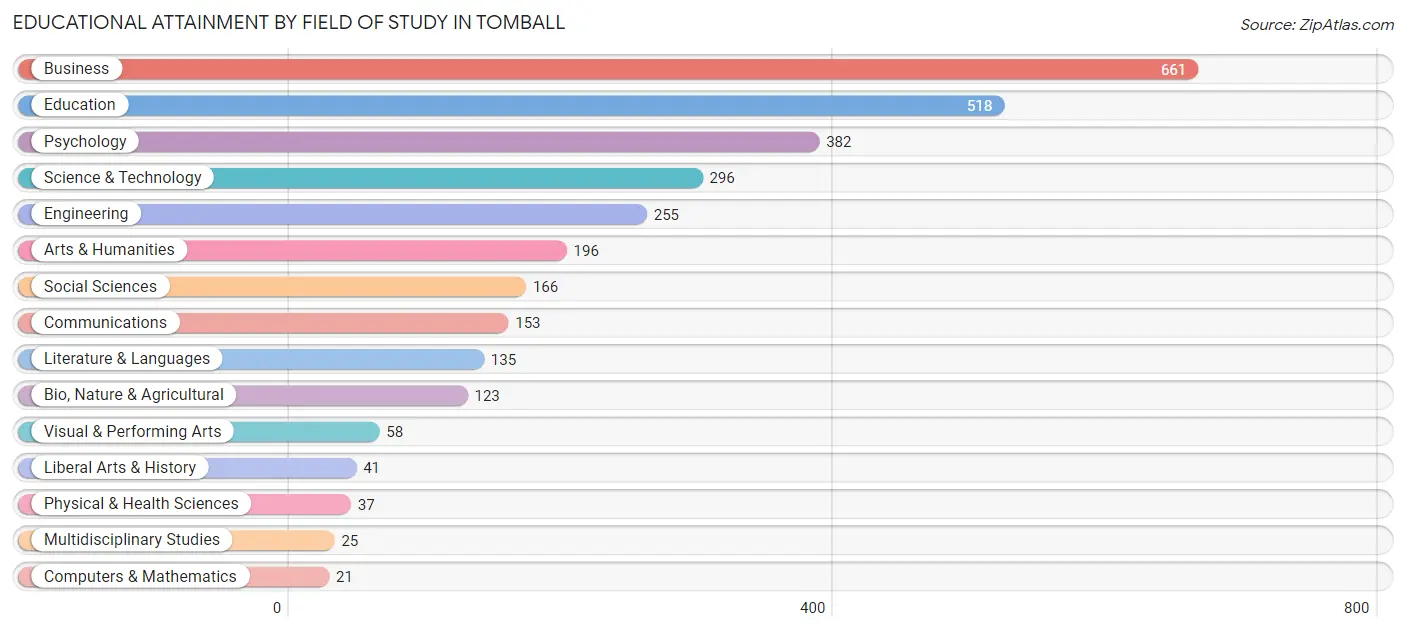
| Field of Study | # Graduates | % Graduates |
| Computers & Mathematics | 21 | 0.7% |
| Bio, Nature & Agricultural | 123 | 4.0% |
| Physical & Health Sciences | 37 | 1.2% |
| Psychology | 382 | 12.5% |
| Social Sciences | 166 | 5.4% |
| Engineering | 255 | 8.3% |
| Multidisciplinary Studies | 25 | 0.8% |
| Science & Technology | 296 | 9.7% |
| Business | 661 | 21.5% |
| Education | 518 | 16.9% |
| Literature & Languages | 135 | 4.4% |
| Liberal Arts & History | 41 | 1.3% |
| Visual & Performing Arts | 58 | 1.9% |
| Communications | 153 | 5.0% |
| Arts & Humanities | 196 | 6.4% |
| Total | 3,067 | 100.0% |
Transportation & Commute in Tomball
Vehicle Availability by Sex in Tomball
The most prevalent vehicle ownership categories in Tomball are males with 2 vehicles (1,272, accounting for 41.6%) and females with 2 vehicles (699, making up 52.6%).
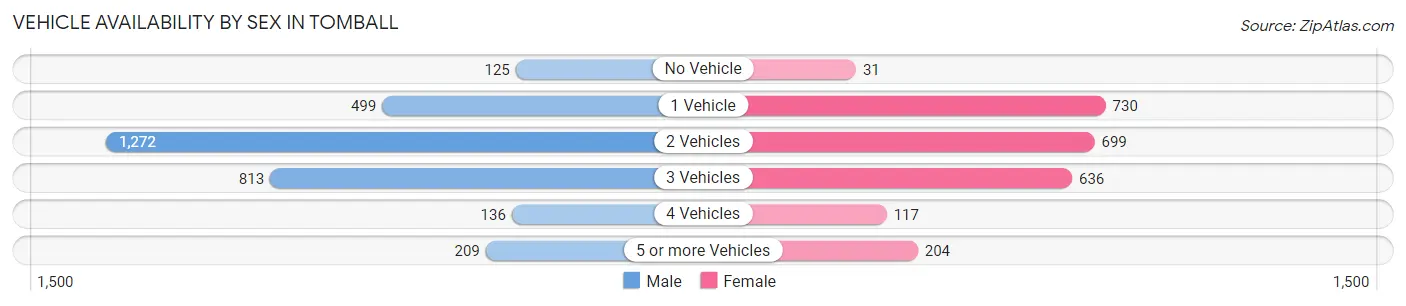
| Vehicles Available | Male | Female |
| No Vehicle | 125 (4.1%) | 31 (1.3%) |
| 1 Vehicle | 499 (16.3%) | 730 (30.2%) |
| 2 Vehicles | 1,272 (41.6%) | 699 (28.9%) |
| 3 Vehicles | 813 (26.6%) | 636 (26.3%) |
| 4 Vehicles | 136 (4.4%) | 117 (4.8%) |
| 5 or more Vehicles | 209 (6.8%) | 204 (8.4%) |
| Total | 3,054 (100.0%) | 2,417 (100.0%) |
Commute Time in Tomball
The most frequently occuring commute durations in Tomball are 10 to 14 minutes (807 commuters, 17.8%), 15 to 19 minutes (523 commuters, 11.5%), and 45 to 59 minutes (499 commuters, 11.0%).
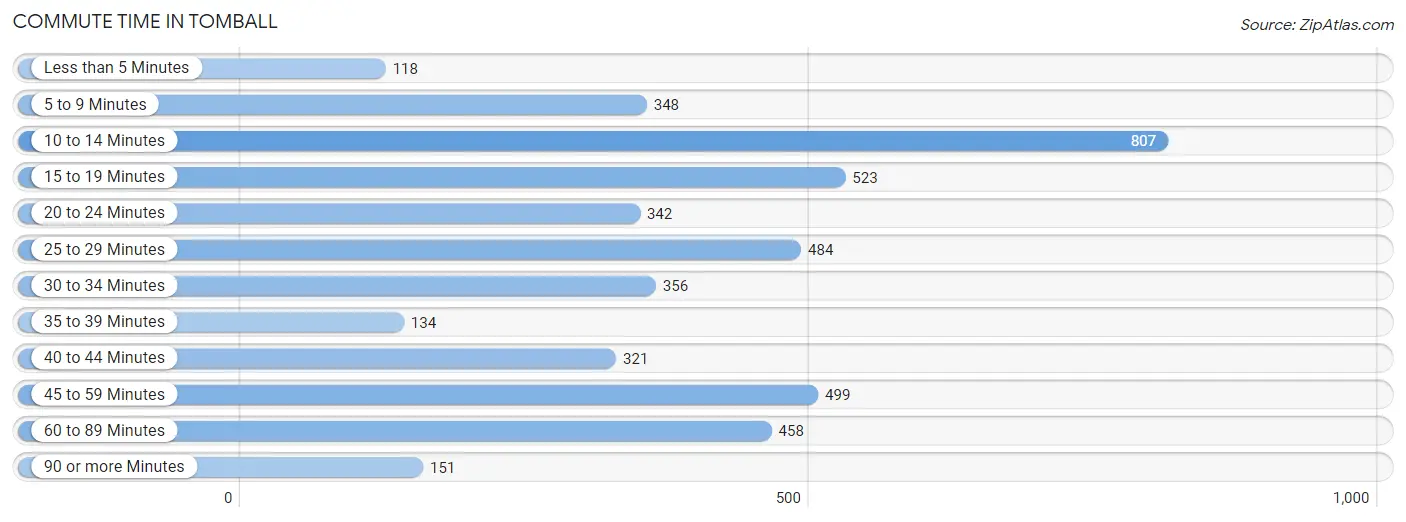
| Commute Time | # Commuters | % Commuters |
| Less than 5 Minutes | 118 | 2.6% |
| 5 to 9 Minutes | 348 | 7.7% |
| 10 to 14 Minutes | 807 | 17.8% |
| 15 to 19 Minutes | 523 | 11.5% |
| 20 to 24 Minutes | 342 | 7.5% |
| 25 to 29 Minutes | 484 | 10.7% |
| 30 to 34 Minutes | 356 | 7.8% |
| 35 to 39 Minutes | 134 | 2.9% |
| 40 to 44 Minutes | 321 | 7.1% |
| 45 to 59 Minutes | 499 | 11.0% |
| 60 to 89 Minutes | 458 | 10.1% |
| 90 or more Minutes | 151 | 3.3% |
Commute Time by Sex in Tomball
The most common commute times in Tomball are 60 to 89 minutes (353 commuters, 14.5%) for males and 10 to 14 minutes (582 commuters, 27.5%) for females.
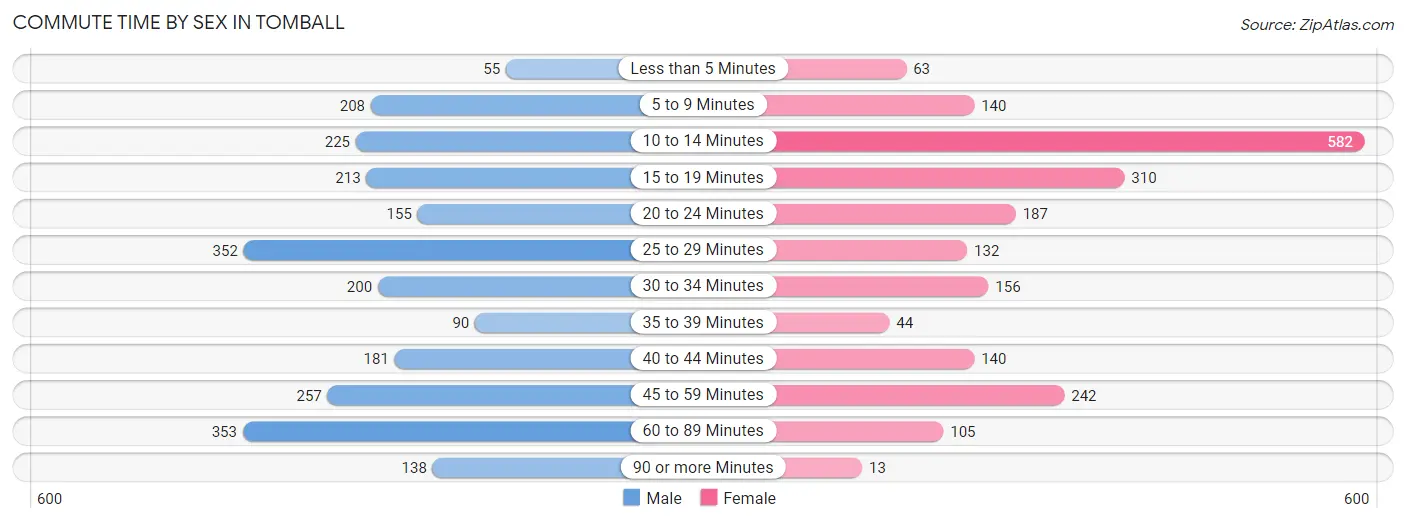
| Commute Time | Male | Female |
| Less than 5 Minutes | 55 (2.3%) | 63 (3.0%) |
| 5 to 9 Minutes | 208 (8.6%) | 140 (6.6%) |
| 10 to 14 Minutes | 225 (9.3%) | 582 (27.5%) |
| 15 to 19 Minutes | 213 (8.8%) | 310 (14.7%) |
| 20 to 24 Minutes | 155 (6.4%) | 187 (8.8%) |
| 25 to 29 Minutes | 352 (14.5%) | 132 (6.2%) |
| 30 to 34 Minutes | 200 (8.2%) | 156 (7.4%) |
| 35 to 39 Minutes | 90 (3.7%) | 44 (2.1%) |
| 40 to 44 Minutes | 181 (7.5%) | 140 (6.6%) |
| 45 to 59 Minutes | 257 (10.6%) | 242 (11.5%) |
| 60 to 89 Minutes | 353 (14.5%) | 105 (5.0%) |
| 90 or more Minutes | 138 (5.7%) | 13 (0.6%) |
Time of Departure to Work by Sex in Tomball
The most frequent times of departure to work in Tomball are 7:00 AM to 7:29 AM (477, 19.7%) for males and 7:00 AM to 7:29 AM (377, 17.8%) for females.
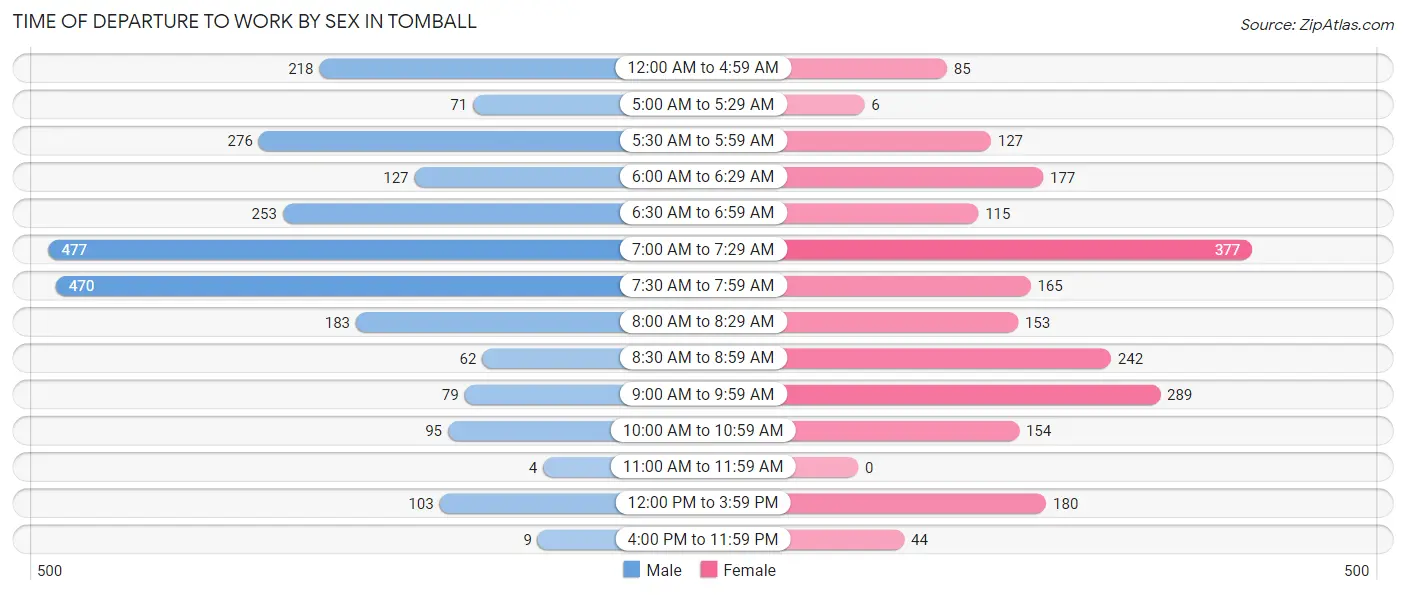
| Time of Departure | Male | Female |
| 12:00 AM to 4:59 AM | 218 (9.0%) | 85 (4.0%) |
| 5:00 AM to 5:29 AM | 71 (2.9%) | 6 (0.3%) |
| 5:30 AM to 5:59 AM | 276 (11.4%) | 127 (6.0%) |
| 6:00 AM to 6:29 AM | 127 (5.2%) | 177 (8.4%) |
| 6:30 AM to 6:59 AM | 253 (10.4%) | 115 (5.4%) |
| 7:00 AM to 7:29 AM | 477 (19.7%) | 377 (17.8%) |
| 7:30 AM to 7:59 AM | 470 (19.4%) | 165 (7.8%) |
| 8:00 AM to 8:29 AM | 183 (7.5%) | 153 (7.2%) |
| 8:30 AM to 8:59 AM | 62 (2.5%) | 242 (11.5%) |
| 9:00 AM to 9:59 AM | 79 (3.3%) | 289 (13.7%) |
| 10:00 AM to 10:59 AM | 95 (3.9%) | 154 (7.3%) |
| 11:00 AM to 11:59 AM | 4 (0.2%) | 0 (0.0%) |
| 12:00 PM to 3:59 PM | 103 (4.2%) | 180 (8.5%) |
| 4:00 PM to 11:59 PM | 9 (0.4%) | 44 (2.1%) |
| Total | 2,427 (100.0%) | 2,114 (100.0%) |
Housing Occupancy in Tomball
Occupancy by Ownership in Tomball
Of the total 4,773 dwellings in Tomball, owner-occupied units account for 2,341 (49.0%), while renter-occupied units make up 2,432 (50.9%).
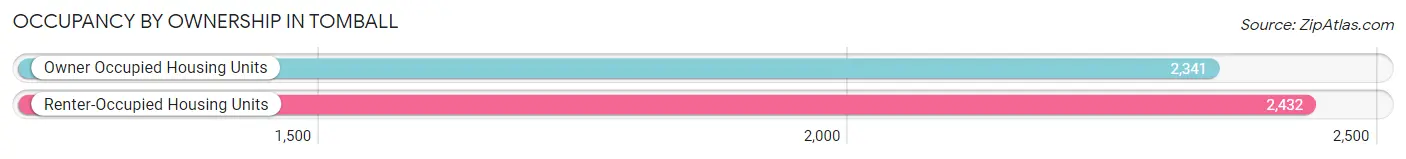
| Occupancy | # Housing Units | % Housing Units |
| Owner Occupied Housing Units | 2,341 | 49.0% |
| Renter-Occupied Housing Units | 2,432 | 50.9% |
| Total Occupied Housing Units | 4,773 | 100.0% |
Occupancy by Household Size in Tomball
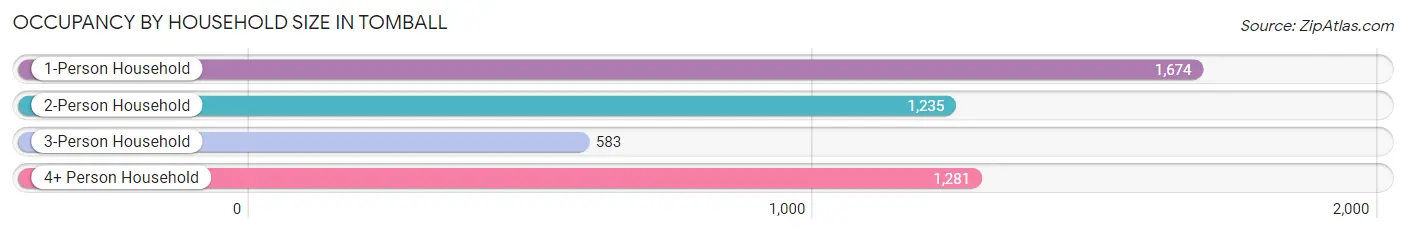
| Household Size | # Housing Units | % Housing Units |
| 1-Person Household | 1,674 | 35.1% |
| 2-Person Household | 1,235 | 25.9% |
| 3-Person Household | 583 | 12.2% |
| 4+ Person Household | 1,281 | 26.8% |
| Total Housing Units | 4,773 | 100.0% |
Occupancy by Ownership by Household Size in Tomball
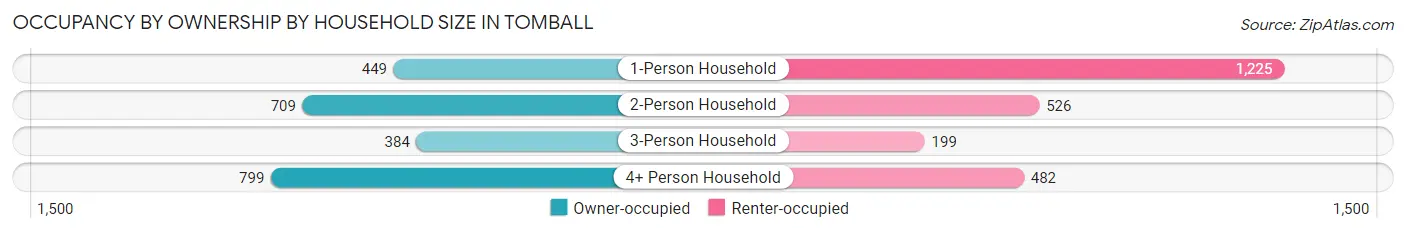
| Household Size | Owner-occupied | Renter-occupied |
| 1-Person Household | 449 (26.8%) | 1,225 (73.2%) |
| 2-Person Household | 709 (57.4%) | 526 (42.6%) |
| 3-Person Household | 384 (65.9%) | 199 (34.1%) |
| 4+ Person Household | 799 (62.4%) | 482 (37.6%) |
| Total Housing Units | 2,341 (49.0%) | 2,432 (50.9%) |
Occupancy by Educational Attainment in Tomball
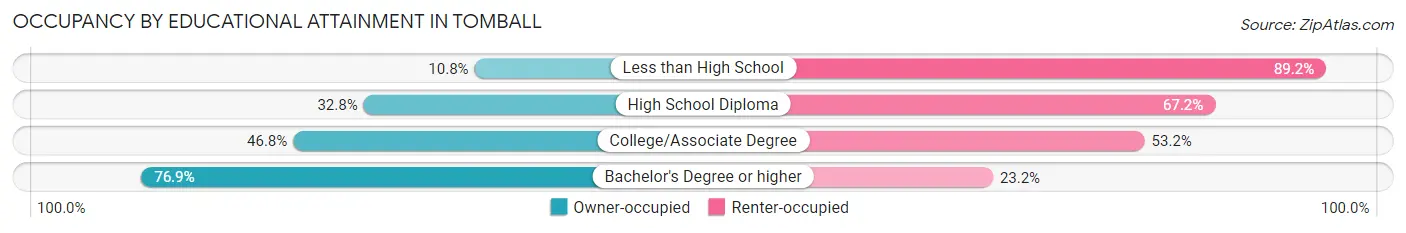
| Household Size | Owner-occupied | Renter-occupied |
| Less than High School | 65 (10.8%) | 536 (89.2%) |
| High School Diploma | 315 (32.8%) | 645 (67.2%) |
| College/Associate Degree | 789 (46.8%) | 898 (53.2%) |
| Bachelor's Degree or higher | 1,172 (76.8%) | 353 (23.2%) |
Occupancy by Age of Householder in Tomball
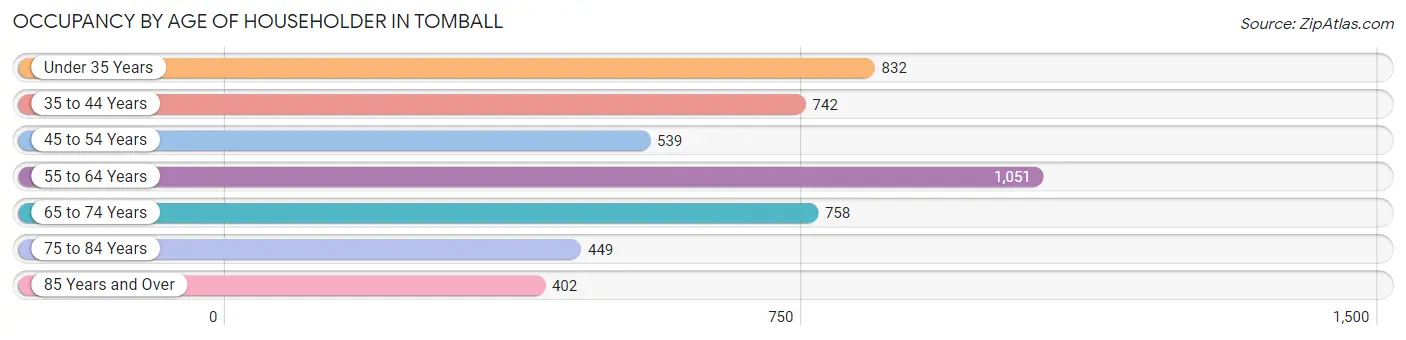
| Age Bracket | # Households | % Households |
| Under 35 Years | 832 | 17.4% |
| 35 to 44 Years | 742 | 15.5% |
| 45 to 54 Years | 539 | 11.3% |
| 55 to 64 Years | 1,051 | 22.0% |
| 65 to 74 Years | 758 | 15.9% |
| 75 to 84 Years | 449 | 9.4% |
| 85 Years and Over | 402 | 8.4% |
| Total | 4,773 | 100.0% |
Housing Finances in Tomball
Median Income by Occupancy in Tomball
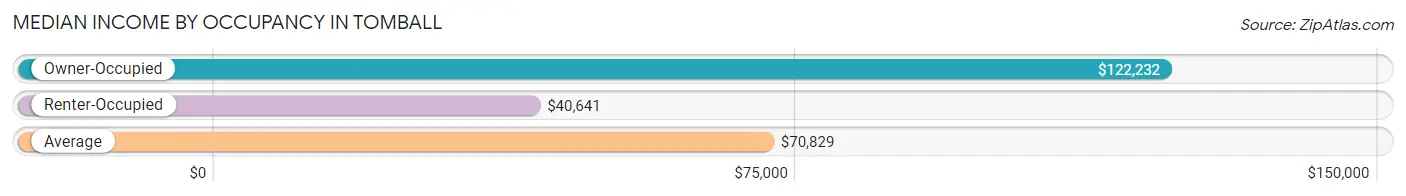
| Occupancy Type | # Households | Median Income |
| Owner-Occupied | 2,341 (49.0%) | $122,232 |
| Renter-Occupied | 2,432 (50.9%) | $40,641 |
| Average | 4,773 (100.0%) | $70,829 |
Occupancy by Householder Income Bracket in Tomball
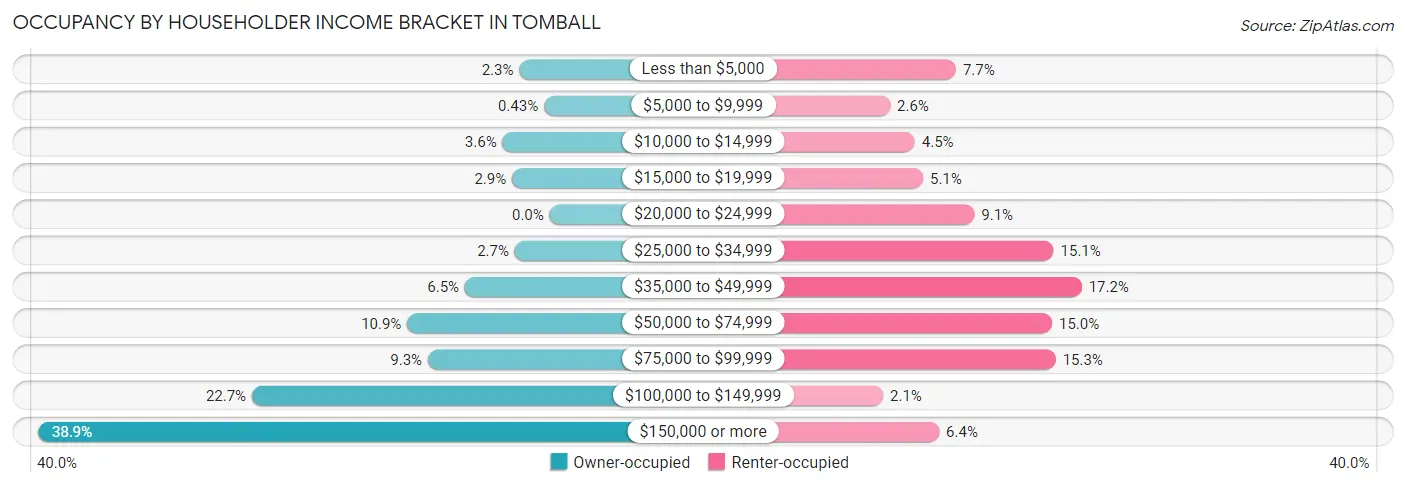
| Income Bracket | Owner-occupied | Renter-occupied |
| Less than $5,000 | 54 (2.3%) | 186 (7.6%) |
| $5,000 to $9,999 | 10 (0.4%) | 64 (2.6%) |
| $10,000 to $14,999 | 84 (3.6%) | 110 (4.5%) |
| $15,000 to $19,999 | 67 (2.9%) | 125 (5.1%) |
| $20,000 to $24,999 | 0 (0.0%) | 220 (9.0%) |
| $25,000 to $34,999 | 62 (2.6%) | 367 (15.1%) |
| $35,000 to $49,999 | 151 (6.5%) | 419 (17.2%) |
| $50,000 to $74,999 | 254 (10.8%) | 364 (15.0%) |
| $75,000 to $99,999 | 217 (9.3%) | 371 (15.2%) |
| $100,000 to $149,999 | 531 (22.7%) | 51 (2.1%) |
| $150,000 or more | 911 (38.9%) | 155 (6.4%) |
| Total | 2,341 (100.0%) | 2,432 (100.0%) |
Monthly Housing Cost Tiers in Tomball
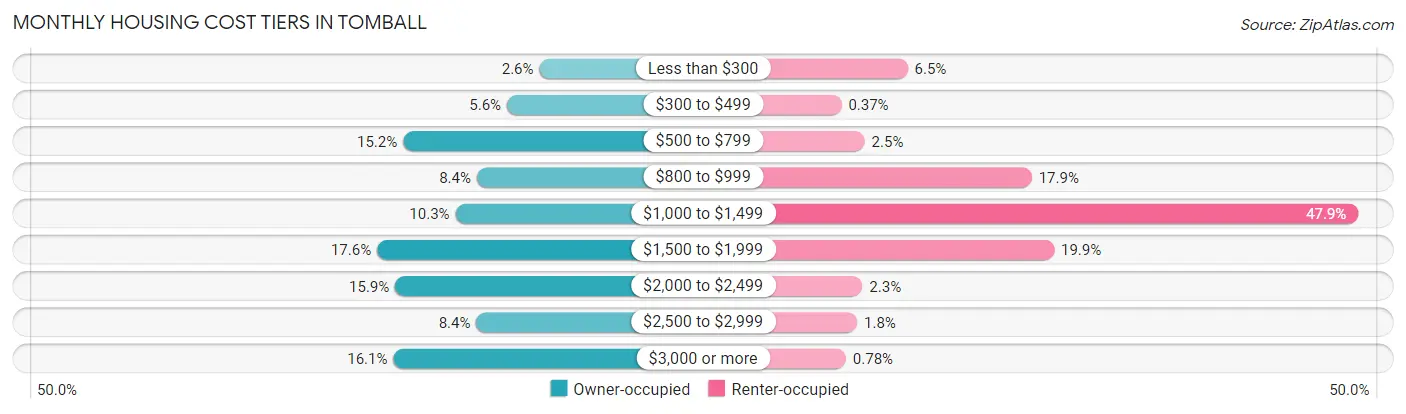
| Monthly Cost | Owner-occupied | Renter-occupied |
| Less than $300 | 61 (2.6%) | 157 (6.5%) |
| $300 to $499 | 131 (5.6%) | 9 (0.4%) |
| $500 to $799 | 355 (15.2%) | 61 (2.5%) |
| $800 to $999 | 196 (8.4%) | 435 (17.9%) |
| $1,000 to $1,499 | 242 (10.3%) | 1,166 (47.9%) |
| $1,500 to $1,999 | 411 (17.6%) | 485 (19.9%) |
| $2,000 to $2,499 | 372 (15.9%) | 56 (2.3%) |
| $2,500 to $2,999 | 197 (8.4%) | 44 (1.8%) |
| $3,000 or more | 376 (16.1%) | 19 (0.8%) |
| Total | 2,341 (100.0%) | 2,432 (100.0%) |
Physical Housing Characteristics in Tomball
Housing Structures in Tomball
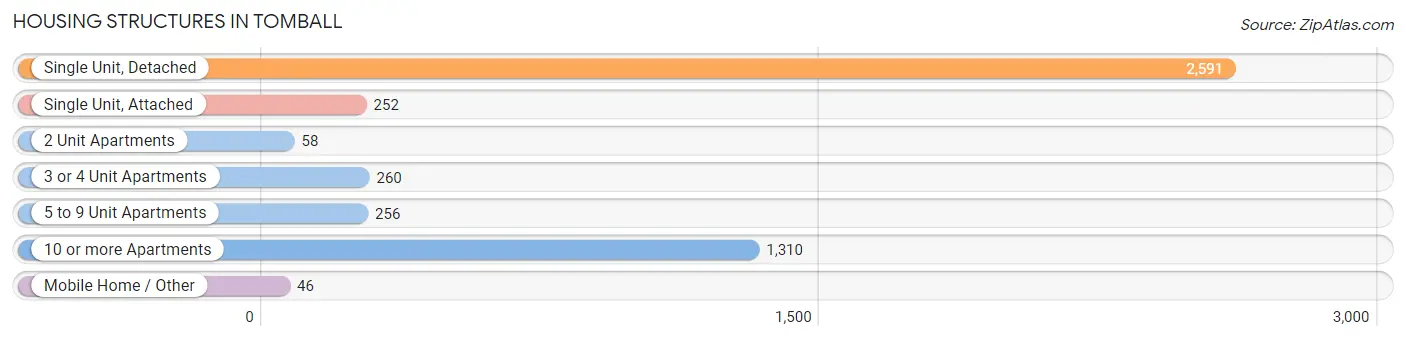
| Structure Type | # Housing Units | % Housing Units |
| Single Unit, Detached | 2,591 | 54.3% |
| Single Unit, Attached | 252 | 5.3% |
| 2 Unit Apartments | 58 | 1.2% |
| 3 or 4 Unit Apartments | 260 | 5.4% |
| 5 to 9 Unit Apartments | 256 | 5.4% |
| 10 or more Apartments | 1,310 | 27.5% |
| Mobile Home / Other | 46 | 1.0% |
| Total | 4,773 | 100.0% |
Housing Structures by Occupancy in Tomball
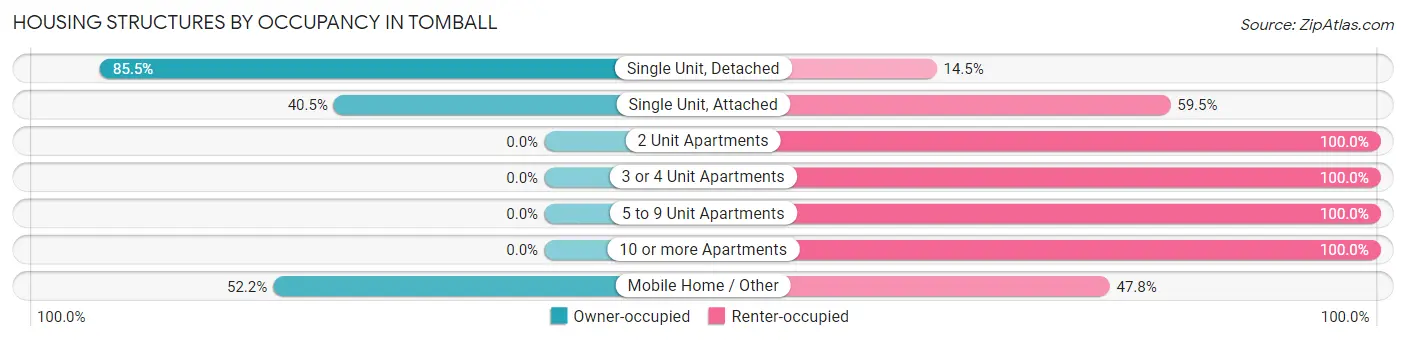
| Structure Type | Owner-occupied | Renter-occupied |
| Single Unit, Detached | 2,215 (85.5%) | 376 (14.5%) |
| Single Unit, Attached | 102 (40.5%) | 150 (59.5%) |
| 2 Unit Apartments | 0 (0.0%) | 58 (100.0%) |
| 3 or 4 Unit Apartments | 0 (0.0%) | 260 (100.0%) |
| 5 to 9 Unit Apartments | 0 (0.0%) | 256 (100.0%) |
| 10 or more Apartments | 0 (0.0%) | 1,310 (100.0%) |
| Mobile Home / Other | 24 (52.2%) | 22 (47.8%) |
| Total | 2,341 (49.0%) | 2,432 (50.9%) |
Housing Structures by Number of Rooms in Tomball
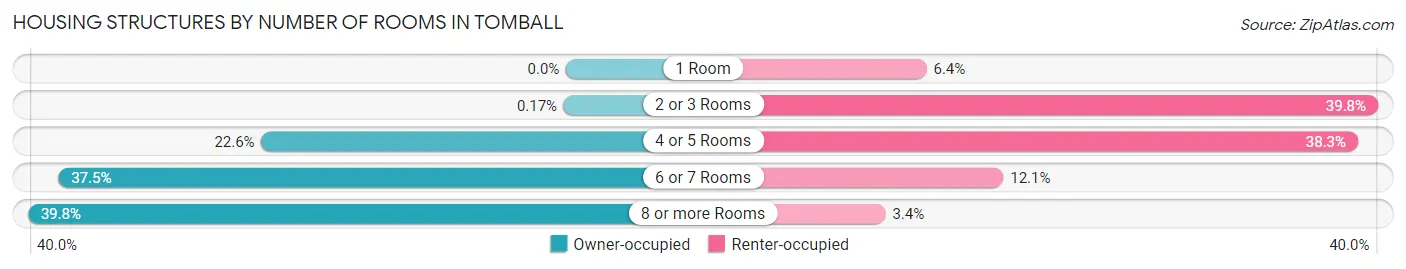
| Number of Rooms | Owner-occupied | Renter-occupied |
| 1 Room | 0 (0.0%) | 156 (6.4%) |
| 2 or 3 Rooms | 4 (0.2%) | 968 (39.8%) |
| 4 or 5 Rooms | 528 (22.6%) | 932 (38.3%) |
| 6 or 7 Rooms | 878 (37.5%) | 294 (12.1%) |
| 8 or more Rooms | 931 (39.8%) | 82 (3.4%) |
| Total | 2,341 (100.0%) | 2,432 (100.0%) |
Housing Structure by Heating Type in Tomball
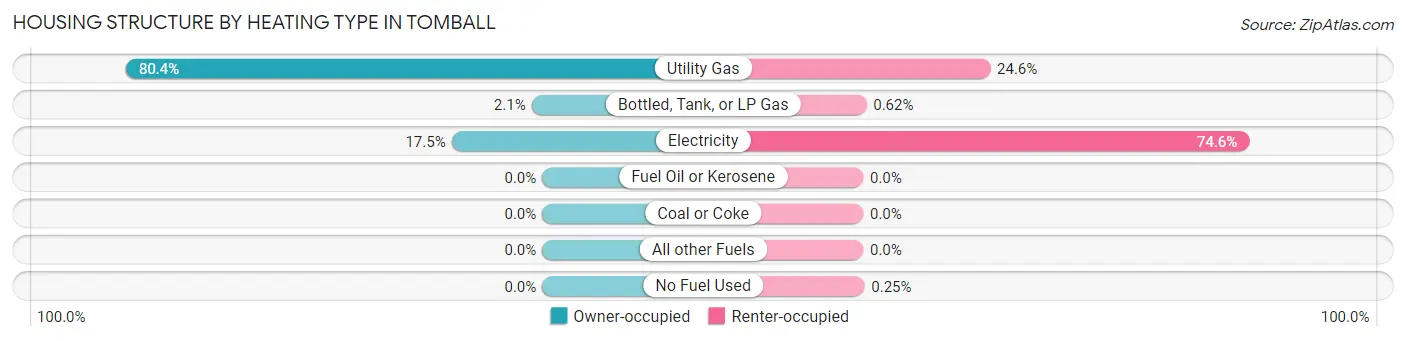
| Heating Type | Owner-occupied | Renter-occupied |
| Utility Gas | 1,883 (80.4%) | 597 (24.5%) |
| Bottled, Tank, or LP Gas | 48 (2.1%) | 15 (0.6%) |
| Electricity | 410 (17.5%) | 1,814 (74.6%) |
| Fuel Oil or Kerosene | 0 (0.0%) | 0 (0.0%) |
| Coal or Coke | 0 (0.0%) | 0 (0.0%) |
| All other Fuels | 0 (0.0%) | 0 (0.0%) |
| No Fuel Used | 0 (0.0%) | 6 (0.3%) |
| Total | 2,341 (100.0%) | 2,432 (100.0%) |
Household Vehicle Usage in Tomball
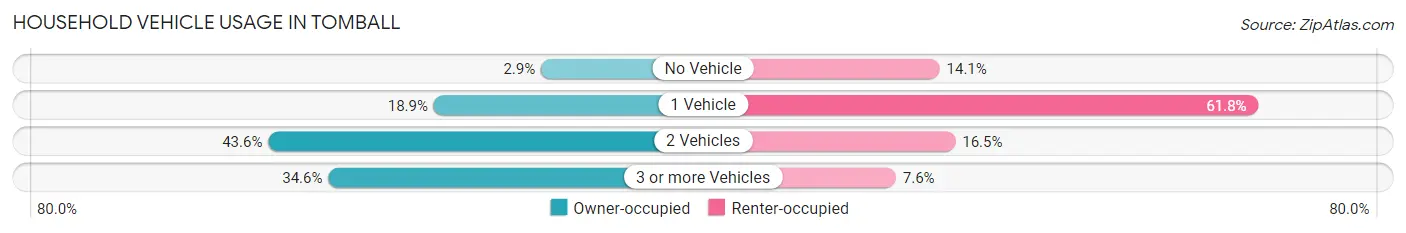
| Vehicles per Household | Owner-occupied | Renter-occupied |
| No Vehicle | 67 (2.9%) | 344 (14.1%) |
| 1 Vehicle | 442 (18.9%) | 1,502 (61.8%) |
| 2 Vehicles | 1,021 (43.6%) | 401 (16.5%) |
| 3 or more Vehicles | 811 (34.6%) | 185 (7.6%) |
| Total | 2,341 (100.0%) | 2,432 (100.0%) |
Real Estate & Mortgages in Tomball
Real Estate and Mortgage Overview in Tomball
| Characteristic | Without Mortgage | With Mortgage |
| Housing Units | 838 | 1,503 |
| Median Property Value | $234,700 | $320,200 |
| Median Household Income | $82,083 | $764 |
| Monthly Housing Costs | $733 | $376 |
| Real Estate Taxes | $4,303 | $77 |
Property Value by Mortgage Status in Tomball
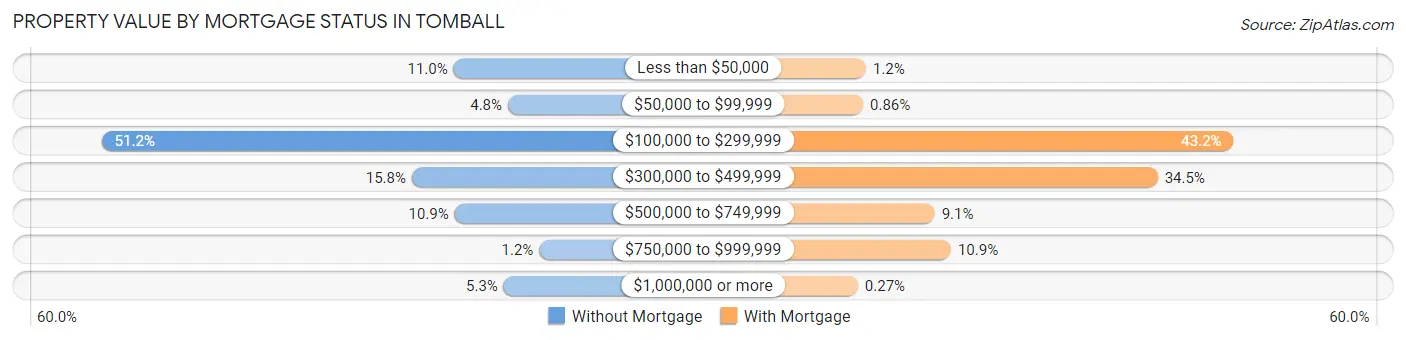
| Property Value | Without Mortgage | With Mortgage |
| Less than $50,000 | 92 (11.0%) | 18 (1.2%) |
| $50,000 to $99,999 | 40 (4.8%) | 13 (0.9%) |
| $100,000 to $299,999 | 429 (51.2%) | 649 (43.2%) |
| $300,000 to $499,999 | 132 (15.8%) | 519 (34.5%) |
| $500,000 to $749,999 | 91 (10.9%) | 136 (9.0%) |
| $750,000 to $999,999 | 10 (1.2%) | 164 (10.9%) |
| $1,000,000 or more | 44 (5.2%) | 4 (0.3%) |
| Total | 838 (100.0%) | 1,503 (100.0%) |
Household Income by Mortgage Status in Tomball
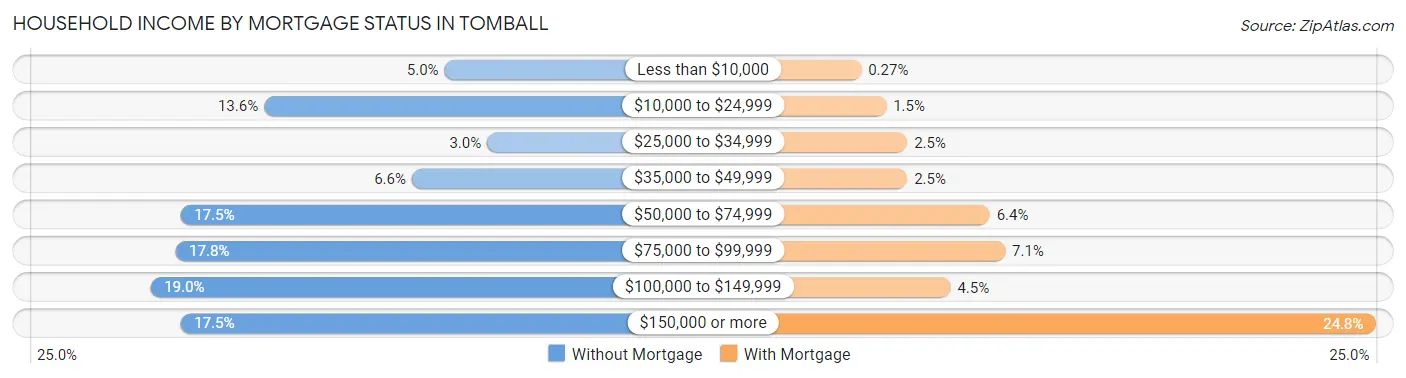
| Household Income | Without Mortgage | With Mortgage |
| Less than $10,000 | 42 (5.0%) | 4 (0.3%) |
| $10,000 to $24,999 | 114 (13.6%) | 22 (1.5%) |
| $25,000 to $34,999 | 25 (3.0%) | 37 (2.5%) |
| $35,000 to $49,999 | 55 (6.6%) | 37 (2.5%) |
| $50,000 to $74,999 | 147 (17.5%) | 96 (6.4%) |
| $75,000 to $99,999 | 149 (17.8%) | 107 (7.1%) |
| $100,000 to $149,999 | 159 (19.0%) | 68 (4.5%) |
| $150,000 or more | 147 (17.5%) | 372 (24.7%) |
| Total | 838 (100.0%) | 1,503 (100.0%) |
Property Value to Household Income Ratio in Tomball
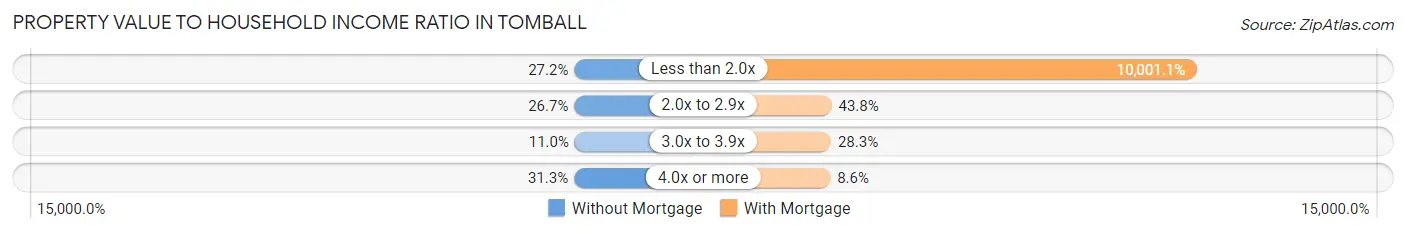
| Value-to-Income Ratio | Without Mortgage | With Mortgage |
| Less than 2.0x | 228 (27.2%) | 150,316 (10,001.1%) |
| 2.0x to 2.9x | 224 (26.7%) | 658 (43.8%) |
| 3.0x to 3.9x | 92 (11.0%) | 426 (28.3%) |
| 4.0x or more | 262 (31.3%) | 129 (8.6%) |
| Total | 838 (100.0%) | 1,503 (100.0%) |
Real Estate Taxes by Mortgage Status in Tomball
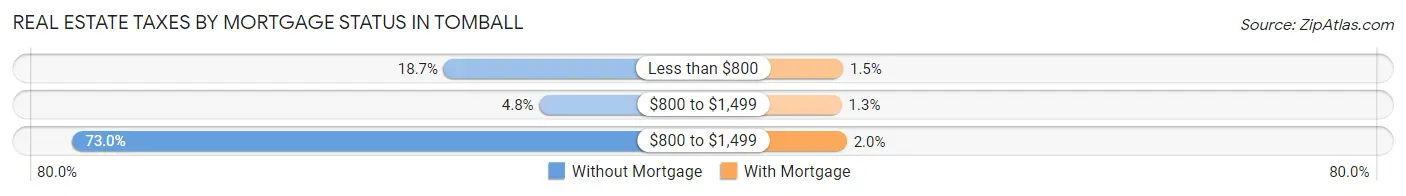
| Property Taxes | Without Mortgage | With Mortgage |
| Less than $800 | 157 (18.7%) | 22 (1.5%) |
| $800 to $1,499 | 40 (4.8%) | 19 (1.3%) |
| $800 to $1,499 | 612 (73.0%) | 30 (2.0%) |
| Total | 838 (100.0%) | 1,503 (100.0%) |
Health & Disability in Tomball
Health Insurance Coverage by Age in Tomball
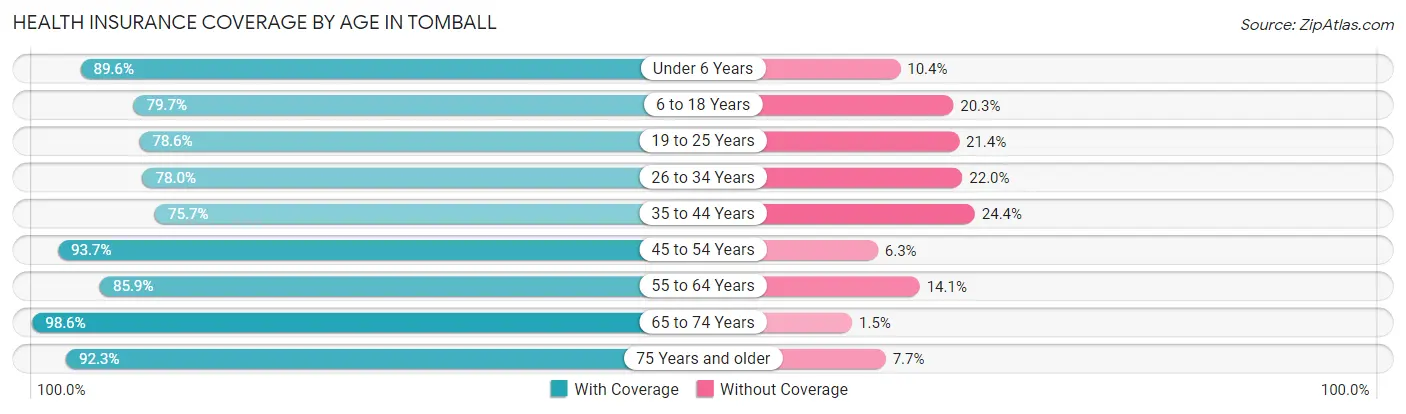
| Age Bracket | With Coverage | Without Coverage |
| Under 6 Years | 926 (89.6%) | 108 (10.4%) |
| 6 to 18 Years | 1,576 (79.7%) | 402 (20.3%) |
| 19 to 25 Years | 889 (78.6%) | 242 (21.4%) |
| 26 to 34 Years | 1,197 (78.0%) | 338 (22.0%) |
| 35 to 44 Years | 1,084 (75.6%) | 349 (24.3%) |
| 45 to 54 Years | 1,033 (93.7%) | 69 (6.3%) |
| 55 to 64 Years | 1,411 (85.9%) | 231 (14.1%) |
| 65 to 74 Years | 1,226 (98.6%) | 18 (1.5%) |
| 75 Years and older | 1,026 (92.3%) | 86 (7.7%) |
| Total | 10,368 (84.9%) | 1,843 (15.1%) |
Health Insurance Coverage by Citizenship Status in Tomball
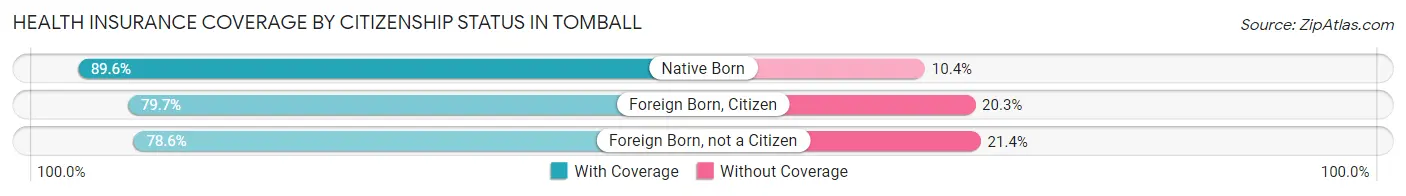
| Citizenship Status | With Coverage | Without Coverage |
| Native Born | 926 (89.6%) | 108 (10.4%) |
| Foreign Born, Citizen | 1,576 (79.7%) | 402 (20.3%) |
| Foreign Born, not a Citizen | 889 (78.6%) | 242 (21.4%) |
Health Insurance Coverage by Household Income in Tomball
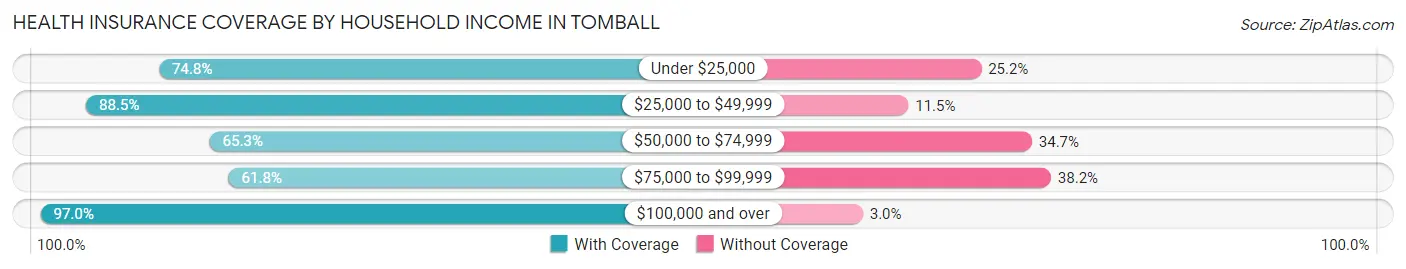
| Household Income | With Coverage | Without Coverage |
| Under $25,000 | 1,025 (74.8%) | 345 (25.2%) |
| $25,000 to $49,999 | 1,482 (88.5%) | 193 (11.5%) |
| $50,000 to $74,999 | 1,008 (65.3%) | 535 (34.7%) |
| $75,000 to $99,999 | 953 (61.8%) | 590 (38.2%) |
| $100,000 and over | 5,834 (97.0%) | 180 (3.0%) |
Public vs Private Health Insurance Coverage by Age in Tomball
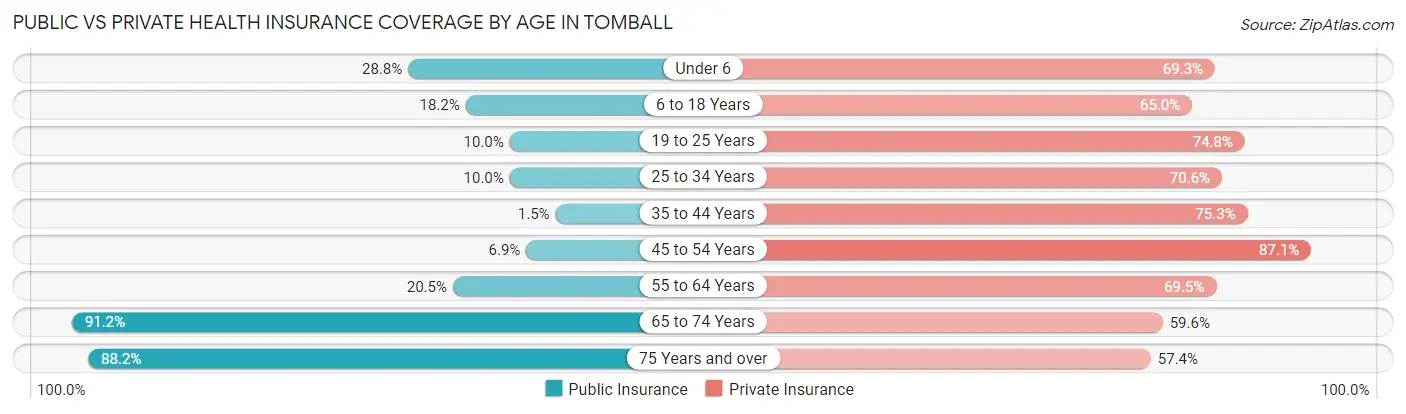
| Age Bracket | Public Insurance | Private Insurance |
| Under 6 | 298 (28.8%) | 716 (69.3%) |
| 6 to 18 Years | 359 (18.1%) | 1,286 (65.0%) |
| 19 to 25 Years | 113 (10.0%) | 846 (74.8%) |
| 25 to 34 Years | 153 (10.0%) | 1,083 (70.6%) |
| 35 to 44 Years | 21 (1.5%) | 1,079 (75.3%) |
| 45 to 54 Years | 76 (6.9%) | 960 (87.1%) |
| 55 to 64 Years | 337 (20.5%) | 1,141 (69.5%) |
| 65 to 74 Years | 1,135 (91.2%) | 741 (59.6%) |
| 75 Years and over | 981 (88.2%) | 638 (57.4%) |
| Total | 3,473 (28.4%) | 8,490 (69.5%) |
Disability Status by Sex by Age in Tomball
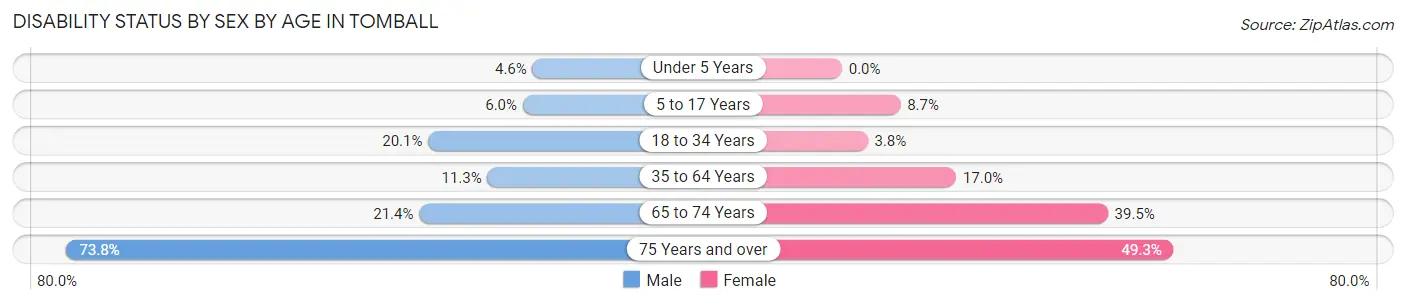
| Age Bracket | Male | Female |
| Under 5 Years | 21 (4.6%) | 0 (0.0%) |
| 5 to 17 Years | 57 (6.0%) | 84 (8.7%) |
| 18 to 34 Years | 311 (20.1%) | 51 (3.8%) |
| 35 to 64 Years | 223 (11.3%) | 372 (17.0%) |
| 65 to 74 Years | 135 (21.4%) | 242 (39.5%) |
| 75 Years and over | 214 (73.8%) | 405 (49.3%) |
Disability Class by Sex by Age in Tomball
Disability Class: Hearing Difficulty
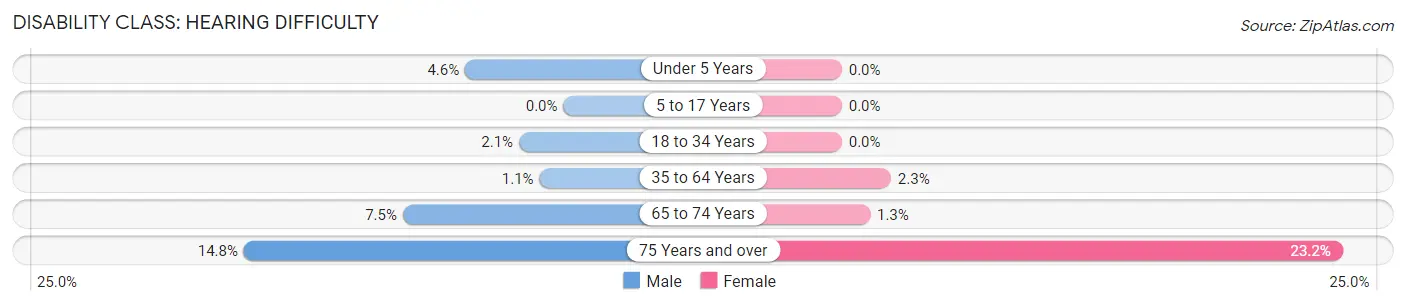
| Age Bracket | Male | Female |
| Under 5 Years | 21 (4.6%) | 0 (0.0%) |
| 5 to 17 Years | 0 (0.0%) | 0 (0.0%) |
| 18 to 34 Years | 32 (2.1%) | 0 (0.0%) |
| 35 to 64 Years | 22 (1.1%) | 50 (2.3%) |
| 65 to 74 Years | 47 (7.4%) | 8 (1.3%) |
| 75 Years and over | 43 (14.8%) | 191 (23.2%) |
Disability Class: Vision Difficulty
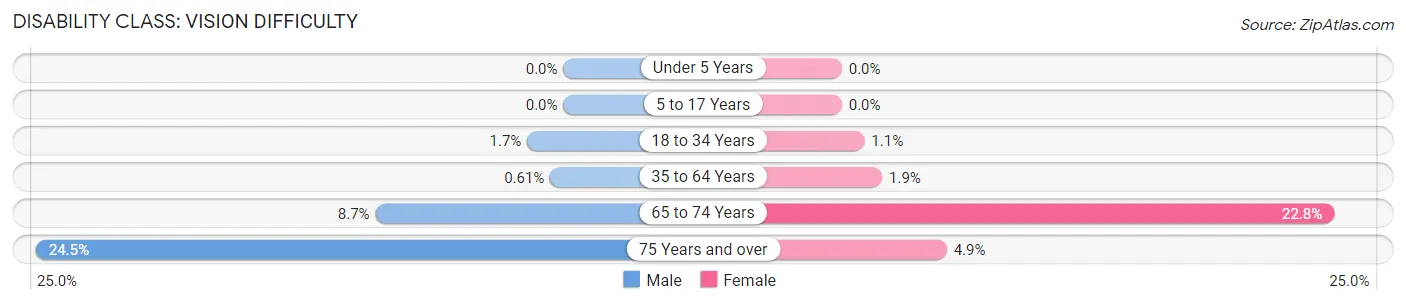
| Age Bracket | Male | Female |
| Under 5 Years | 0 (0.0%) | 0 (0.0%) |
| 5 to 17 Years | 0 (0.0%) | 0 (0.0%) |
| 18 to 34 Years | 26 (1.7%) | 14 (1.1%) |
| 35 to 64 Years | 12 (0.6%) | 41 (1.9%) |
| 65 to 74 Years | 55 (8.7%) | 140 (22.8%) |
| 75 Years and over | 71 (24.5%) | 40 (4.9%) |
Disability Class: Cognitive Difficulty
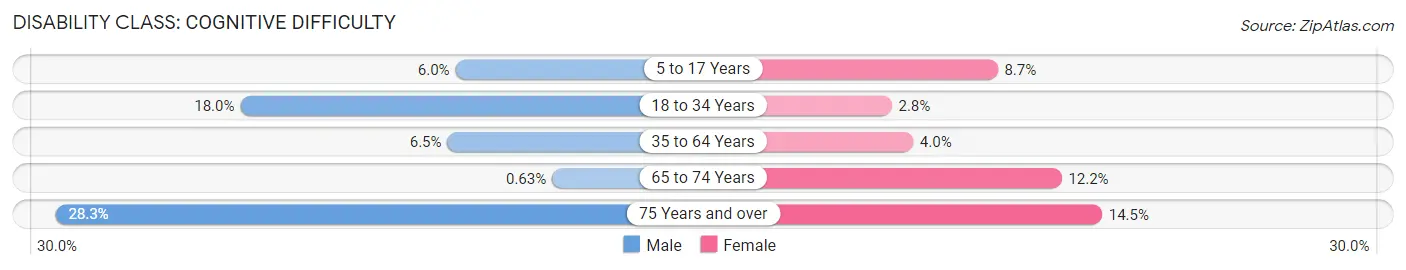
| Age Bracket | Male | Female |
| 5 to 17 Years | 57 (6.0%) | 84 (8.7%) |
| 18 to 34 Years | 279 (18.0%) | 37 (2.8%) |
| 35 to 64 Years | 128 (6.5%) | 87 (4.0%) |
| 65 to 74 Years | 4 (0.6%) | 75 (12.2%) |
| 75 Years and over | 82 (28.3%) | 119 (14.5%) |
Disability Class: Ambulatory Difficulty
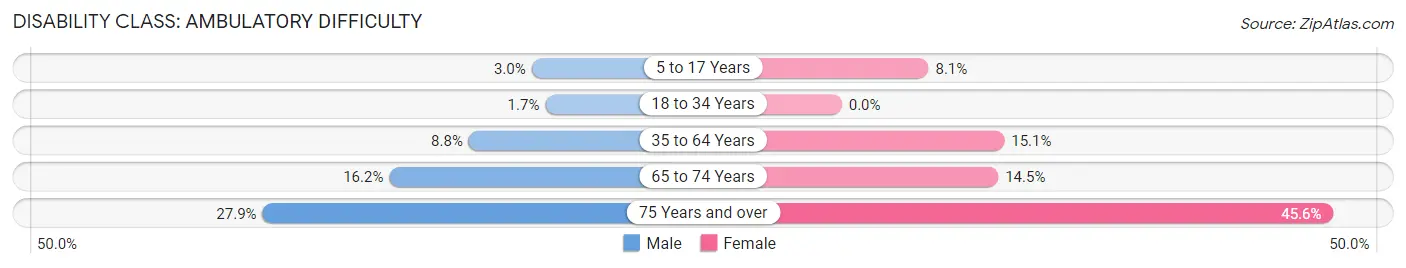
| Age Bracket | Male | Female |
| 5 to 17 Years | 28 (2.9%) | 78 (8.1%) |
| 18 to 34 Years | 26 (1.7%) | 0 (0.0%) |
| 35 to 64 Years | 174 (8.8%) | 331 (15.1%) |
| 65 to 74 Years | 102 (16.2%) | 89 (14.5%) |
| 75 Years and over | 81 (27.9%) | 375 (45.6%) |
Disability Class: Self-Care Difficulty
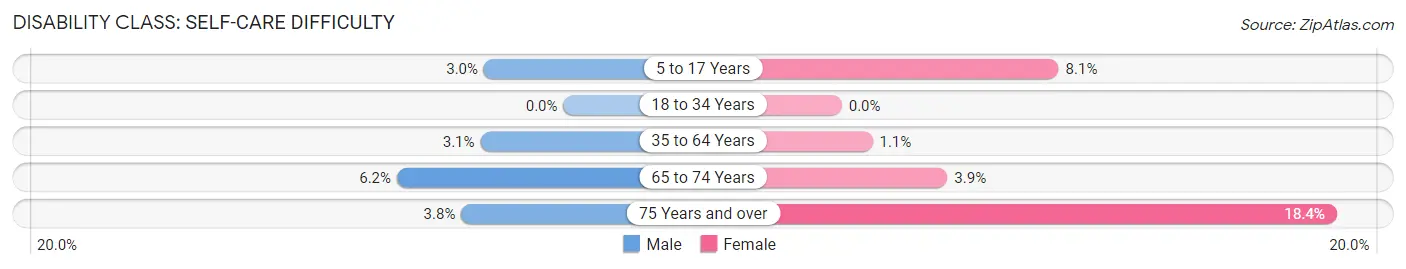
| Age Bracket | Male | Female |
| 5 to 17 Years | 28 (2.9%) | 78 (8.1%) |
| 18 to 34 Years | 0 (0.0%) | 0 (0.0%) |
| 35 to 64 Years | 61 (3.1%) | 25 (1.1%) |
| 65 to 74 Years | 39 (6.2%) | 24 (3.9%) |
| 75 Years and over | 11 (3.8%) | 151 (18.4%) |
Technology Access in Tomball
Computing Device Access in Tomball
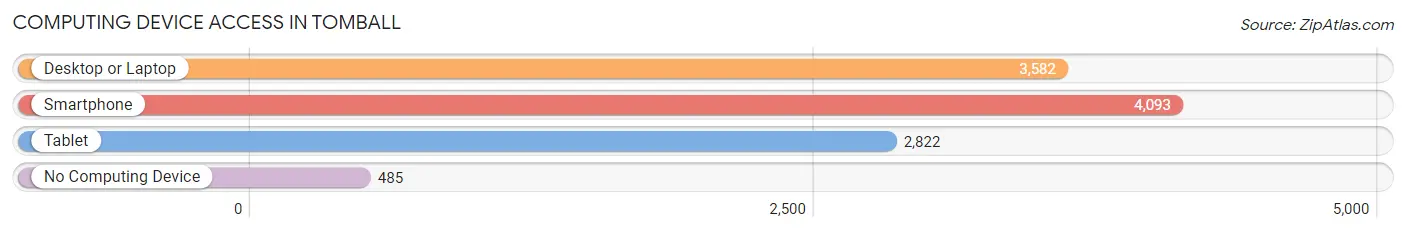
| Device Type | # Households | % Households |
| Desktop or Laptop | 3,582 | 75.0% |
| Smartphone | 4,093 | 85.8% |
| Tablet | 2,822 | 59.1% |
| No Computing Device | 485 | 10.2% |
| Total | 4,773 | 100.0% |
Internet Access in Tomball
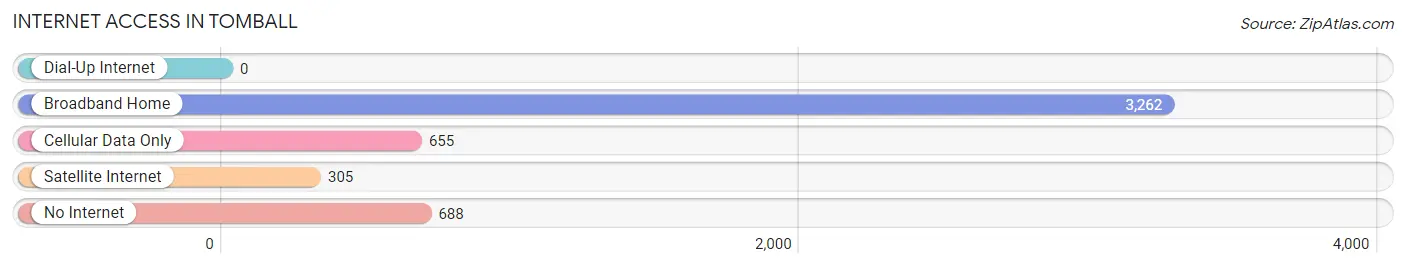
| Internet Type | # Households | % Households |
| Dial-Up Internet | 0 | 0.0% |
| Broadband Home | 3,262 | 68.3% |
| Cellular Data Only | 655 | 13.7% |
| Satellite Internet | 305 | 6.4% |
| No Internet | 688 | 14.4% |
| Total | 4,773 | 100.0% |
Tomball Summary
Tomball, Texas is a city located in Harris County, Texas, United States. It is a part of the Houston–The Woodlands–Sugar Land metropolitan area. The city is located approximately 30 miles northwest of downtown Houston. As of the 2010 census, the population of Tomball was 10,753.
History
Tomball was founded in 1907 by the state of Texas as a stop on the Houston and Great Northern Railroad. The city was named after Thomas Ball, a local landowner who donated land for the railroad. The city was incorporated in 1933.
Tomball experienced rapid growth in the 1950s and 1960s, due to the development of the oil and gas industry in the area. The city was also home to a large number of German immigrants, who established a number of businesses in the area.
Geography
Tomball is located at 29°59'25" North, 95°35'45" West (29.990278, -95.595833). The city has a total area of 8.3 square miles, of which 8.2 square miles is land and 0.1 square miles is water.
Tomball is located in the Houston–The Woodlands–Sugar Land metropolitan area. The city is bordered by the cities of Houston, Spring, and Magnolia.
Economy
Tomball is home to a number of businesses, including oil and gas companies, manufacturing companies, and retail stores. The city is also home to a number of medical facilities, including Tomball Regional Medical Center and Tomball Medical Center.
The city is home to a number of large employers, including Schlumberger, Baker Hughes, and Halliburton. The city is also home to a number of small businesses, including restaurants, retail stores, and professional services.
Demographics
As of the 2010 census, the population of Tomball was 10,753. The racial makeup of the city was 79.2% White, 8.3% African American, 0.5% Native American, 1.7% Asian, 0.1% Pacific Islander, 7.7% from other races, and 2.4% from two or more races. Hispanic or Latino of any race were 19.2% of the population.
The median income for a household in the city was $54,945, and the median income for a family was $63,945. The per capita income for the city was $25,945. About 8.3% of families and 10.7% of the population were below the poverty line, including 14.2% of those under age 18 and 8.2% of those age 65 or over.
Common Questions
What is Per Capita Income in Tomball?
Per Capita income in Tomball is $37,154.
What is the Median Family Income in Tomball?
Median Family Income in Tomball is $99,583.
What is the Median Household income in Tomball?
Median Household Income in Tomball is $70,829.
What is Income or Wage Gap in Tomball?
Income or Wage Gap in Tomball is 49.7%.
Women in Tomball earn 50.3 cents for every dollar earned by a man.
What is Family Income Deficit in Tomball?
Family Income Deficit in Tomball is $9,793.
Families that are below poverty line in Tomball earn $9,793 less on average than the poverty threshold level.
What is Inequality or Gini Index in Tomball?
Inequality or Gini Index in Tomball is 0.49.
What is the Total Population of Tomball?
Total Population of Tomball is 12,630.
What is the Total Male Population of Tomball?
Total Male Population of Tomball is 5,983.
What is the Total Female Population of Tomball?
Total Female Population of Tomball is 6,647.
What is the Ratio of Males per 100 Females in Tomball?
There are 90.01 Males per 100 Females in Tomball.
What is the Ratio of Females per 100 Males in Tomball?
There are 111.10 Females per 100 Males in Tomball.
What is the Median Population Age in Tomball?
Median Population Age in Tomball is 38.2 Years.
What is the Average Family Size in Tomball
Average Family Size in Tomball is 3.4 People.
What is the Average Household Size in Tomball
Average Household Size in Tomball is 2.5 People.
How Large is the Labor Force in Tomball?
There are 5,772 People in the Labor Forcein in Tomball.
What is the Percentage of People in the Labor Force in Tomball?
56.4% of People are in the Labor Force in Tomball.
What is the Unemployment Rate in Tomball?
Unemployment Rate in Tomball is 3.2%.