Zip Codes with the Highest Percentage of Population Employed in Architecture & Engineering in Dallas, TX
RELATED REPORTS & OPTIONS
Architecture & Engineering
Dallas
Compare Zip Codes
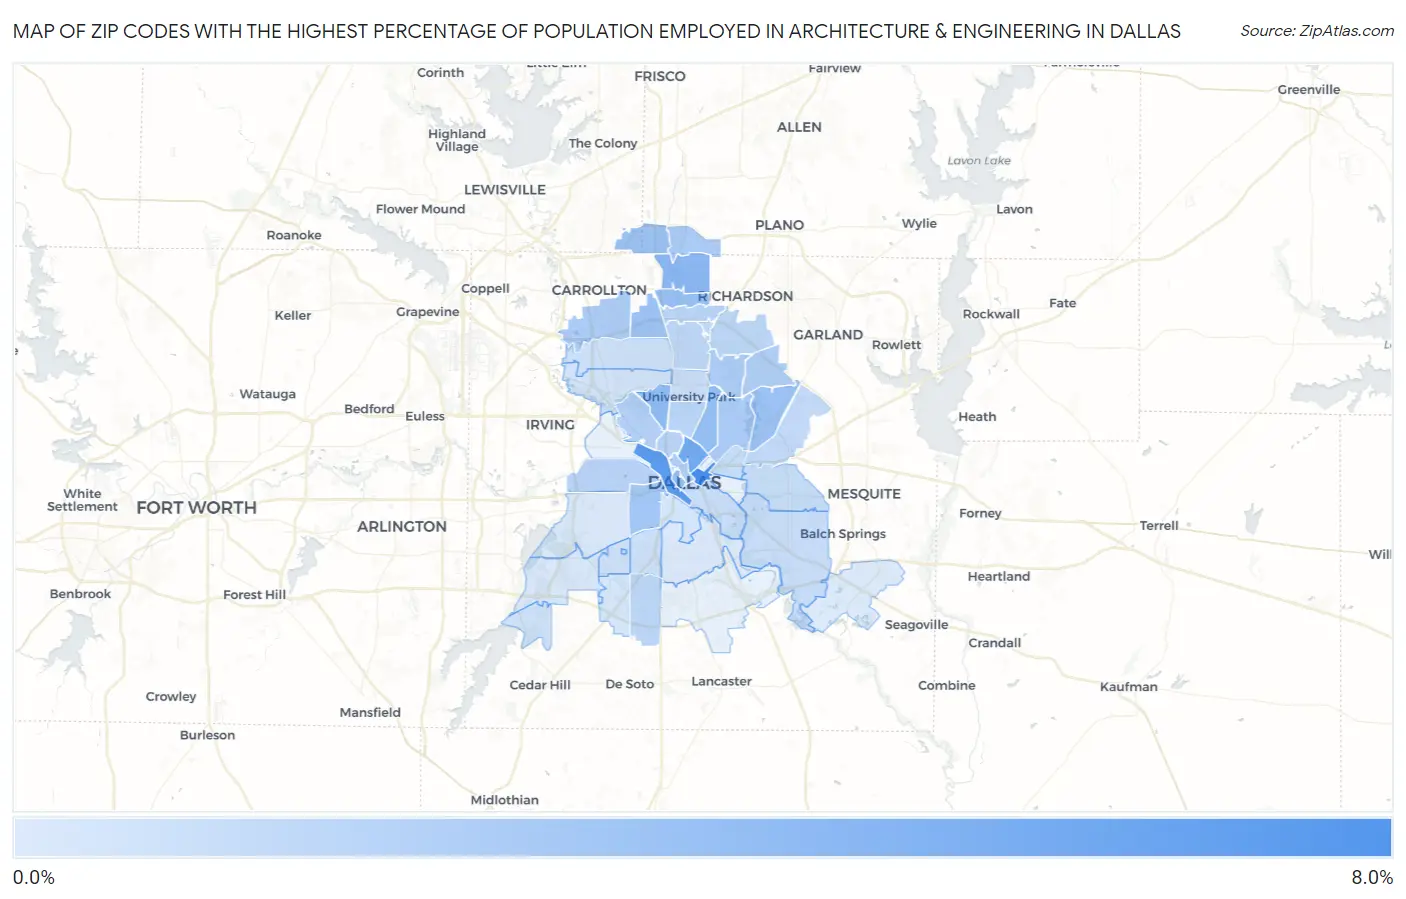
Map of Zip Codes with the Highest Percentage of Population Employed in Architecture & Engineering in Dallas
0.038%
7.1%
Zip Codes with the Highest Percentage of Population Employed in Architecture & Engineering in Dallas, TX
| Zip Code | % Employed | vs State | vs National | |
| 1. | 75226 | 7.1% | 2.2%(+4.90)#37 | 2.1%(+4.98)#719 |
| 2. | 75207 | 6.2% | 2.2%(+4.01)#49 | 2.1%(+4.08)#991 |
| 3. | 75204 | 5.0% | 2.2%(+2.78)#91 | 2.1%(+2.85)#1,654 |
| 4. | 75248 | 3.8% | 2.2%(+1.54)#173 | 2.1%(+1.62)#3,165 |
| 5. | 75209 | 3.5% | 2.2%(+1.33)#211 | 2.1%(+1.40)#3,620 |
| 6. | 75202 | 3.4% | 2.2%(+1.15)#228 | 2.1%(+1.22)#4,022 |
| 7. | 75206 | 3.3% | 2.2%(+1.11)#232 | 2.1%(+1.18)#4,112 |
| 8. | 75254 | 3.3% | 2.2%(+1.04)#248 | 2.1%(+1.11)#4,289 |
| 9. | 75218 | 3.2% | 2.2%(+0.965)#258 | 2.1%(+1.04)#4,493 |
| 10. | 75244 | 3.2% | 2.2%(+0.931)#270 | 2.1%(+1.00)#4,594 |
| 11. | 75287 | 3.0% | 2.2%(+0.822)#290 | 2.1%(+0.895)#4,911 |
| 12. | 75208 | 2.7% | 2.2%(+0.486)#341 | 2.1%(+0.559)#6,122 |
| 13. | 75252 | 2.4% | 2.2%(+0.199)#403 | 2.1%(+0.272)#7,369 |
| 14. | 75214 | 2.4% | 2.2%(+0.195)#405 | 2.1%(+0.268)#7,398 |
| 15. | 75234 | 2.3% | 2.2%(+0.064)#434 | 2.1%(+0.137)#8,022 |
| 16. | 75231 | 2.2% | 2.2%(+0.019)#455 | 2.1%(+0.092)#8,246 |
| 17. | 75201 | 2.2% | 2.2%(-0.030)#463 | 2.1%(+0.043)#8,512 |
| 18. | 75238 | 2.1% | 2.2%(-0.077)#478 | 2.1%(-0.004)#8,787 |
| 19. | 75235 | 2.0% | 2.2%(-0.257)#539 | 2.1%(-0.184)#9,824 |
| 20. | 75219 | 1.8% | 2.2%(-0.469)#601 | 2.1%(-0.397)#11,124 |
| 21. | 75212 | 1.7% | 2.2%(-0.523)#625 | 2.1%(-0.450)#11,492 |
| 22. | 75205 | 1.6% | 2.2%(-0.615)#665 | 2.1%(-0.542)#12,144 |
| 23. | 75240 | 1.6% | 2.2%(-0.626)#672 | 2.1%(-0.553)#12,209 |
| 24. | 75243 | 1.6% | 2.2%(-0.665)#683 | 2.1%(-0.592)#12,455 |
| 25. | 75232 | 1.5% | 2.2%(-0.700)#694 | 2.1%(-0.627)#12,714 |
| 26. | 75230 | 1.4% | 2.2%(-0.820)#743 | 2.1%(-0.747)#13,563 |
| 27. | 75228 | 1.3% | 2.2%(-0.907)#769 | 2.1%(-0.834)#14,213 |
| 28. | 75251 | 1.2% | 2.2%(-1.01)#806 | 2.1%(-0.940)#15,007 |
| 29. | 75227 | 1.1% | 2.2%(-1.16)#869 | 2.1%(-1.09)#16,189 |
| 30. | 75223 | 1.0% | 2.2%(-1.17)#873 | 2.1%(-1.10)#16,258 |
| 31. | 75217 | 1.0% | 2.2%(-1.19)#880 | 2.1%(-1.11)#16,341 |
| 32. | 75215 | 0.95% | 2.2%(-1.27)#919 | 2.1%(-1.19)#16,957 |
| 33. | 75225 | 0.93% | 2.2%(-1.29)#927 | 2.1%(-1.22)#17,154 |
| 34. | 75229 | 0.78% | 2.2%(-1.44)#990 | 2.1%(-1.37)#18,272 |
| 35. | 75224 | 0.76% | 2.2%(-1.46)#1,002 | 2.1%(-1.39)#18,454 |
| 36. | 75233 | 0.76% | 2.2%(-1.46)#1,003 | 2.1%(-1.39)#18,456 |
| 37. | 75249 | 0.64% | 2.2%(-1.58)#1,068 | 2.1%(-1.51)#19,299 |
| 38. | 75220 | 0.59% | 2.2%(-1.63)#1,092 | 2.1%(-1.56)#19,701 |
| 39. | 75203 | 0.46% | 2.2%(-1.76)#1,139 | 2.1%(-1.69)#20,516 |
| 40. | 75237 | 0.35% | 2.2%(-1.88)#1,209 | 2.1%(-1.80)#21,312 |
| 41. | 75236 | 0.27% | 2.2%(-1.95)#1,236 | 2.1%(-1.88)#21,731 |
| 42. | 75211 | 0.25% | 2.2%(-1.98)#1,247 | 2.1%(-1.90)#21,833 |
| 43. | 75216 | 0.13% | 2.2%(-2.09)#1,279 | 2.1%(-2.02)#22,312 |
| 44. | 75253 | 0.038% | 2.2%(-2.18)#1,295 | 2.1%(-2.11)#22,465 |
1
Common Questions
What are the Top 10 Zip Codes with the Highest Percentage of Population Employed in Architecture & Engineering in Dallas, TX?
Top 10 Zip Codes with the Highest Percentage of Population Employed in Architecture & Engineering in Dallas, TX are:
What zip code has the Highest Percentage of Population Employed in Architecture & Engineering in Dallas, TX?
75226 has the Highest Percentage of Population Employed in Architecture & Engineering in Dallas, TX with 7.1%.
What is the Percentage of Population Employed in Architecture & Engineering in Dallas, TX?
Percentage of Population Employed in Architecture & Engineering in Dallas is 1.8%.
What is the Percentage of Population Employed in Architecture & Engineering in Texas?
Percentage of Population Employed in Architecture & Engineering in Texas is 2.2%.
What is the Percentage of Population Employed in Architecture & Engineering in the United States?
Percentage of Population Employed in Architecture & Engineering in the United States is 2.1%.