Zip Codes with the Highest Percentage of Population Employed in Architecture & Engineering in Flower Mound, TX
RELATED REPORTS & OPTIONS
Architecture & Engineering
Flower Mound
Compare Zip Codes
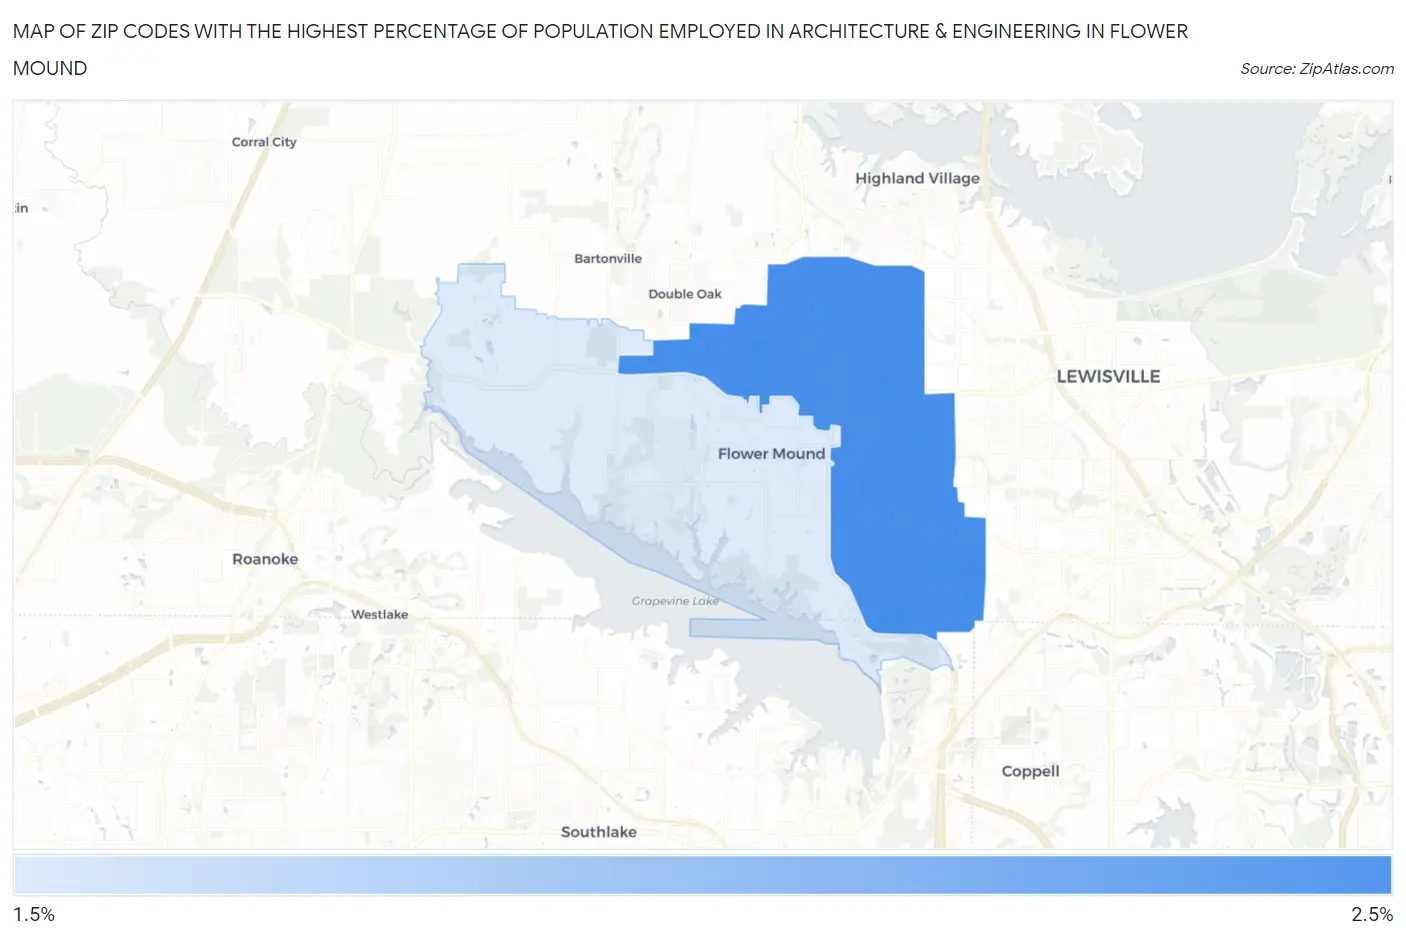
Map of Zip Codes with the Highest Percentage of Population Employed in Architecture & Engineering in Flower Mound
2.3%
2.4%
Zip Codes with the Highest Percentage of Population Employed in Architecture & Engineering in Flower Mound, TX
| Zip Code | % Employed | vs State | vs National | |
| 1. | 75028 | 2.4% | 2.2%(+0.201)#401 | 2.1%(+0.274)#7,361 |
| 2. | 75022 | 2.3% | 2.2%(+0.048)#443 | 2.1%(+0.121)#8,102 |
1
Common Questions
What are the Top Zip Codes with the Highest Percentage of Population Employed in Architecture & Engineering in Flower Mound, TX?
Top Zip Codes with the Highest Percentage of Population Employed in Architecture & Engineering in Flower Mound, TX are:
What zip code has the Highest Percentage of Population Employed in Architecture & Engineering in Flower Mound, TX?
75028 has the Highest Percentage of Population Employed in Architecture & Engineering in Flower Mound, TX with 2.4%.
What is the Percentage of Population Employed in Architecture & Engineering in Flower Mound, TX?
Percentage of Population Employed in Architecture & Engineering in Flower Mound is 2.4%.
What is the Percentage of Population Employed in Architecture & Engineering in Texas?
Percentage of Population Employed in Architecture & Engineering in Texas is 2.2%.
What is the Percentage of Population Employed in Architecture & Engineering in the United States?
Percentage of Population Employed in Architecture & Engineering in the United States is 2.1%.