Zip Codes with the Highest Percentage of Population Employed in Architecture & Engineering in College Station, TX
RELATED REPORTS & OPTIONS
Architecture & Engineering
College Station
Compare Zip Codes
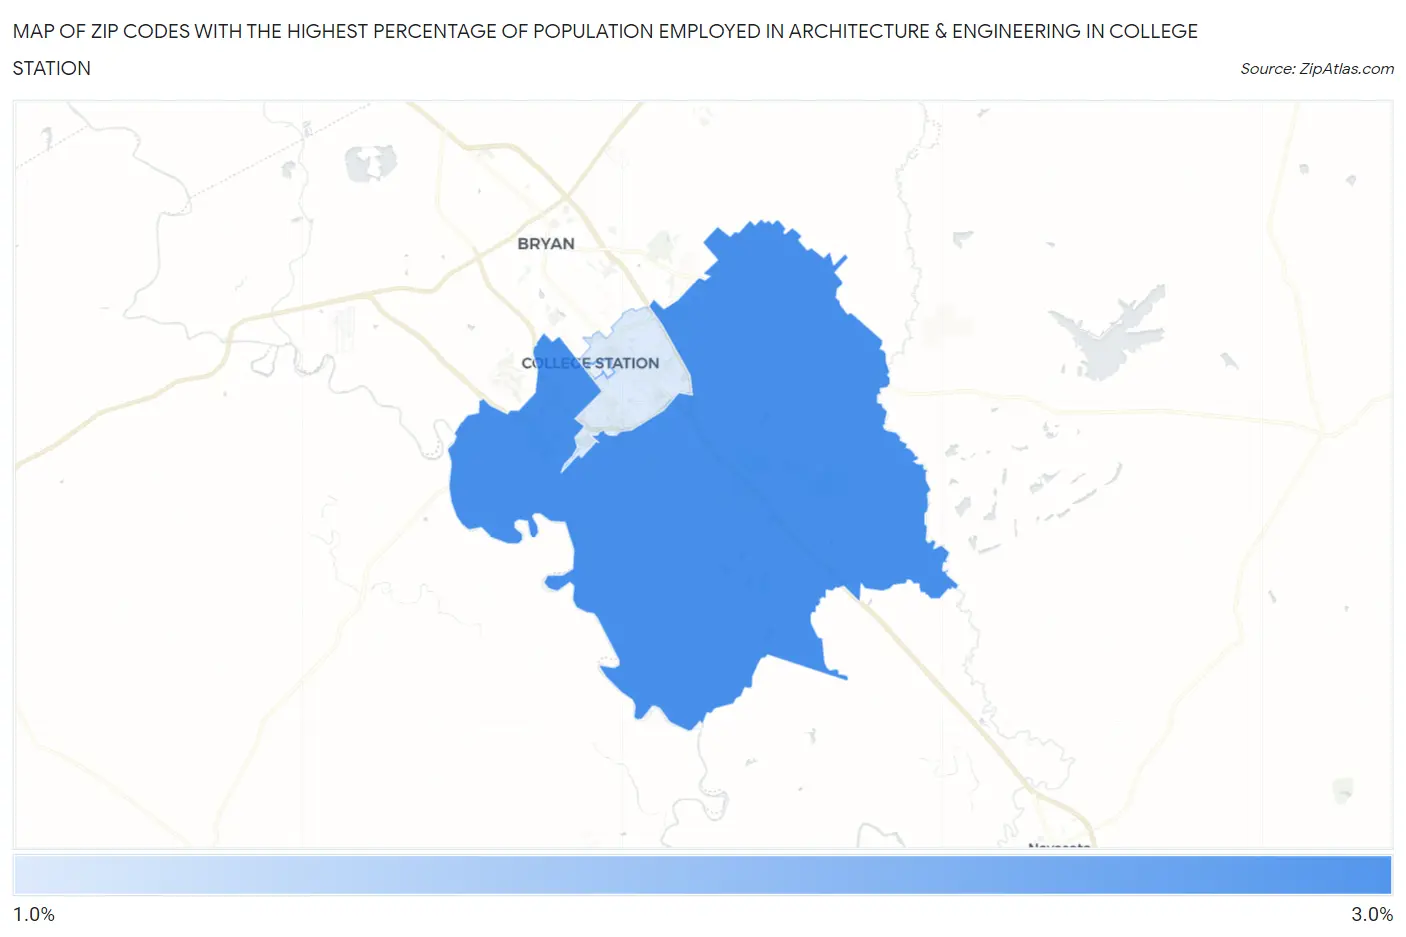
Map of Zip Codes with the Highest Percentage of Population Employed in Architecture & Engineering in College Station
1.9%
2.6%
Zip Codes with the Highest Percentage of Population Employed in Architecture & Engineering in College Station, TX
| Zip Code | % Employed | vs State | vs National | |
| 1. | 77845 | 2.6% | 2.2%(+0.345)#368 | 2.1%(+0.418)#6,712 |
| 2. | 77840 | 1.9% | 2.2%(-0.280)#546 | 2.1%(-0.207)#9,964 |
1
Common Questions
What are the Top Zip Codes with the Highest Percentage of Population Employed in Architecture & Engineering in College Station, TX?
Top Zip Codes with the Highest Percentage of Population Employed in Architecture & Engineering in College Station, TX are:
What zip code has the Highest Percentage of Population Employed in Architecture & Engineering in College Station, TX?
77845 has the Highest Percentage of Population Employed in Architecture & Engineering in College Station, TX with 2.6%.
What is the Percentage of Population Employed in Architecture & Engineering in College Station, TX?
Percentage of Population Employed in Architecture & Engineering in College Station is 2.3%.
What is the Percentage of Population Employed in Architecture & Engineering in Texas?
Percentage of Population Employed in Architecture & Engineering in Texas is 2.2%.
What is the Percentage of Population Employed in Architecture & Engineering in the United States?
Percentage of Population Employed in Architecture & Engineering in the United States is 2.1%.