McQueeney, TX Map & Demographics
McQueeney Map
McQueeney Overview
$43,930
PER CAPITA INCOME
$91,795
AVG FAMILY INCOME
$93,750
AVG HOUSEHOLD INCOME
34.8%
WAGE / INCOME GAP [ % ]
65.2¢/ $1
WAGE / INCOME GAP [ $ ]
0.42
INEQUALITY / GINI INDEX
2,371
TOTAL POPULATION
1,252
MALE POPULATION
1,119
FEMALE POPULATION
111.89
MALES / 100 FEMALES
89.38
FEMALES / 100 MALES
46.4
MEDIAN AGE
2.7
AVG FAMILY SIZE
2.5
AVG HOUSEHOLD SIZE
1,288
LABOR FORCE [ PEOPLE ]
68.8%
PERCENT IN LABOR FORCE
4.7%
UNEMPLOYMENT RATE
McQueeney Area Codes
Income in McQueeney
Income Overview in McQueeney
Per Capita Income in McQueeney is $43,930, while median incomes of families and households are $91,795 and $93,750 respectively.
| Characteristic | Number | Measure |
| Per Capita Income | 2,371 | $43,930 |
| Median Family Income | 724 | $91,795 |
| Mean Family Income | 724 | $109,267 |
| Median Household Income | 954 | $93,750 |
| Mean Household Income | 954 | $108,519 |
| Income Deficit | 724 | $0 |
| Wage / Income Gap (%) | 2,371 | 34.80% |
| Wage / Income Gap ($) | 2,371 | 65.20¢ per $1 |
| Gini / Inequality Index | 2,371 | 0.42 |
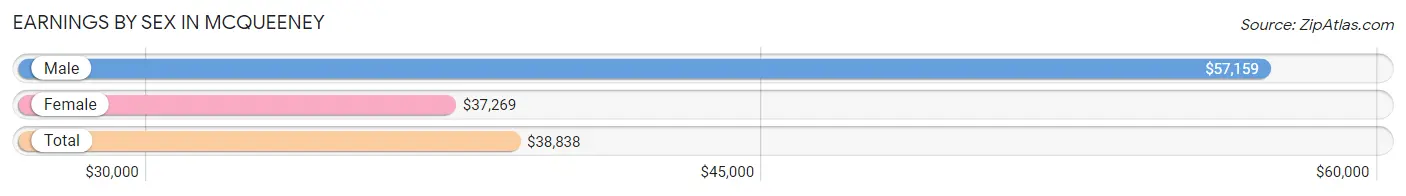
Earnings by Sex in McQueeney
Average Earnings in McQueeney are $38,838, $57,159 for men and $37,269 for women, a difference of 34.8%.
| Sex | Number | Average Earnings |
| Male | 771 (58.1%) | $57,159 |
| Female | 557 (41.9%) | $37,269 |
| Total | 1,328 (100.0%) | $38,838 |
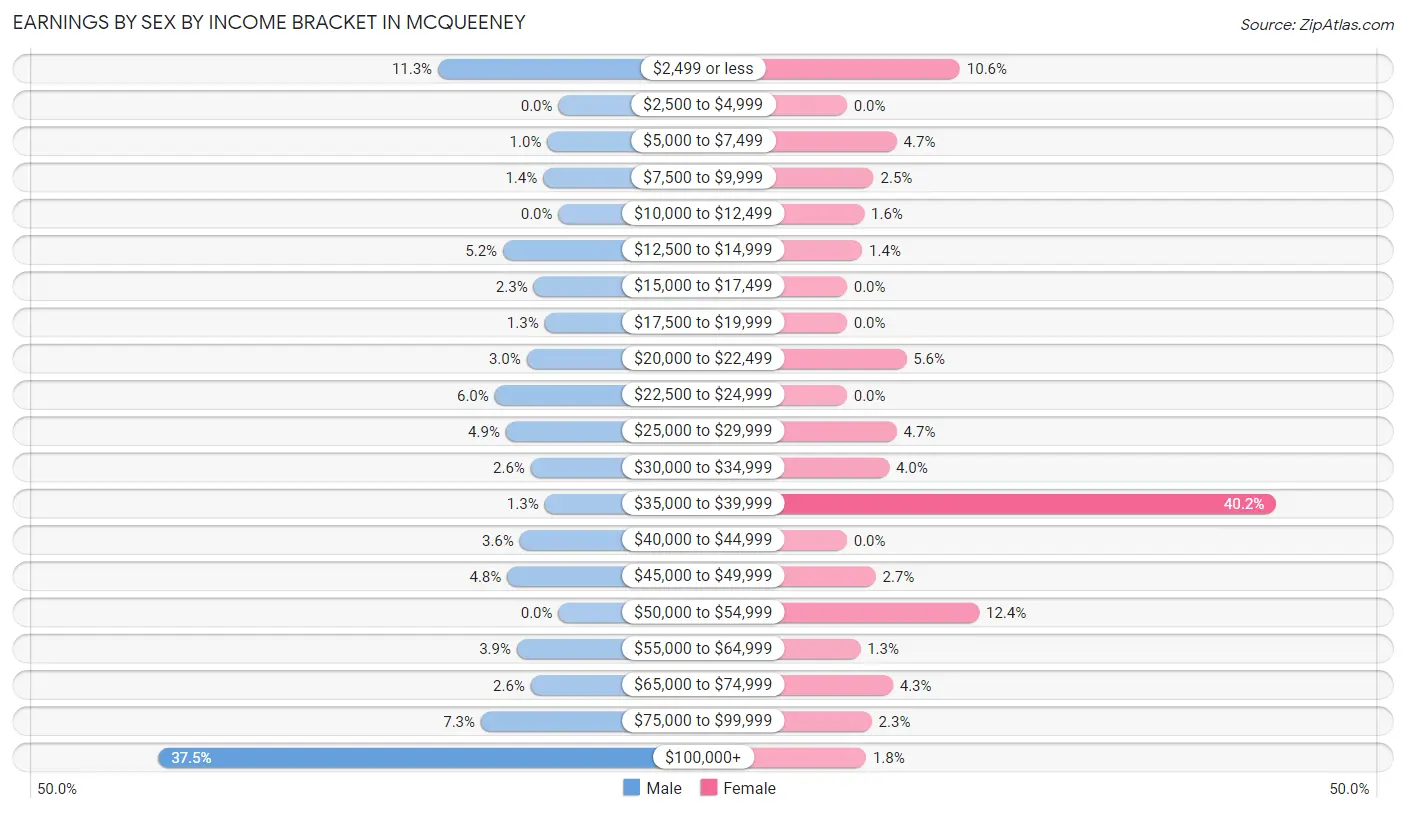
Earnings by Sex by Income Bracket in McQueeney
The most common earnings brackets in McQueeney are $100,000+ for men (289 | 37.5%) and $35,000 to $39,999 for women (224 | 40.2%).
| Income | Male | Female |
| $2,499 or less | 87 (11.3%) | 59 (10.6%) |
| $2,500 to $4,999 | 0 (0.0%) | 0 (0.0%) |
| $5,000 to $7,499 | 8 (1.0%) | 26 (4.7%) |
| $7,500 to $9,999 | 11 (1.4%) | 14 (2.5%) |
| $10,000 to $12,499 | 0 (0.0%) | 9 (1.6%) |
| $12,500 to $14,999 | 40 (5.2%) | 8 (1.4%) |
| $15,000 to $17,499 | 18 (2.3%) | 0 (0.0%) |
| $17,500 to $19,999 | 10 (1.3%) | 0 (0.0%) |
| $20,000 to $22,499 | 23 (3.0%) | 31 (5.6%) |
| $22,500 to $24,999 | 46 (6.0%) | 0 (0.0%) |
| $25,000 to $29,999 | 38 (4.9%) | 26 (4.7%) |
| $30,000 to $34,999 | 20 (2.6%) | 22 (4.0%) |
| $35,000 to $39,999 | 10 (1.3%) | 224 (40.2%) |
| $40,000 to $44,999 | 28 (3.6%) | 0 (0.0%) |
| $45,000 to $49,999 | 37 (4.8%) | 15 (2.7%) |
| $50,000 to $54,999 | 0 (0.0%) | 69 (12.4%) |
| $55,000 to $64,999 | 30 (3.9%) | 7 (1.3%) |
| $65,000 to $74,999 | 20 (2.6%) | 24 (4.3%) |
| $75,000 to $99,999 | 56 (7.3%) | 13 (2.3%) |
| $100,000+ | 289 (37.5%) | 10 (1.8%) |
| Total | 771 (100.0%) | 557 (100.0%) |
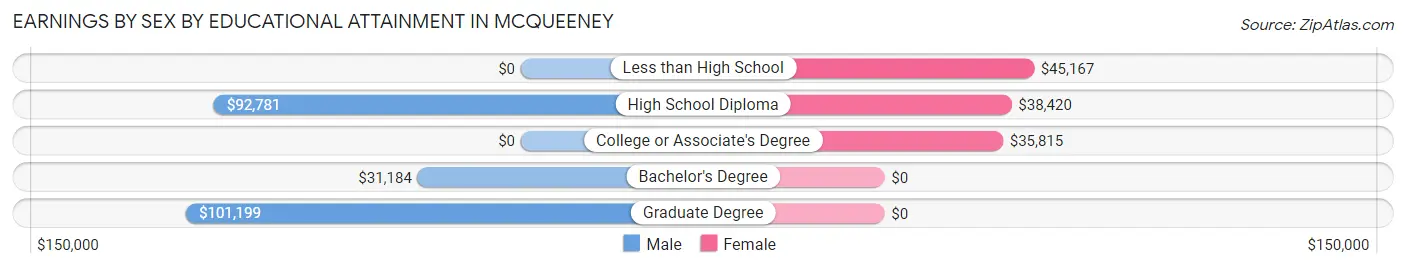
Earnings by Sex by Educational Attainment in McQueeney
Average earnings in McQueeney are $68,438 for men and $37,378 for women, a difference of 45.4%. Men with an educational attainment of graduate degree enjoy the highest average annual earnings of $101,199, while those with bachelor's degree education earn the least with $31,184. Women with an educational attainment of less than high school earn the most with the average annual earnings of $45,167, while those with college or associate's degree education have the smallest earnings of $35,815.
| Educational Attainment | Male Income | Female Income |
| Less than High School | - | - |
| High School Diploma | $92,781 | $38,420 |
| College or Associate's Degree | - | - |
| Bachelor's Degree | $31,184 | $0 |
| Graduate Degree | $101,199 | $0 |
| Total | $68,438 | $37,378 |
Family Income in McQueeney
Family Income Brackets in McQueeney
According to the McQueeney family income data, there are 221 families falling into the $100,000 to $149,999 income range, which is the most common income bracket and makes up 30.5% of all families.
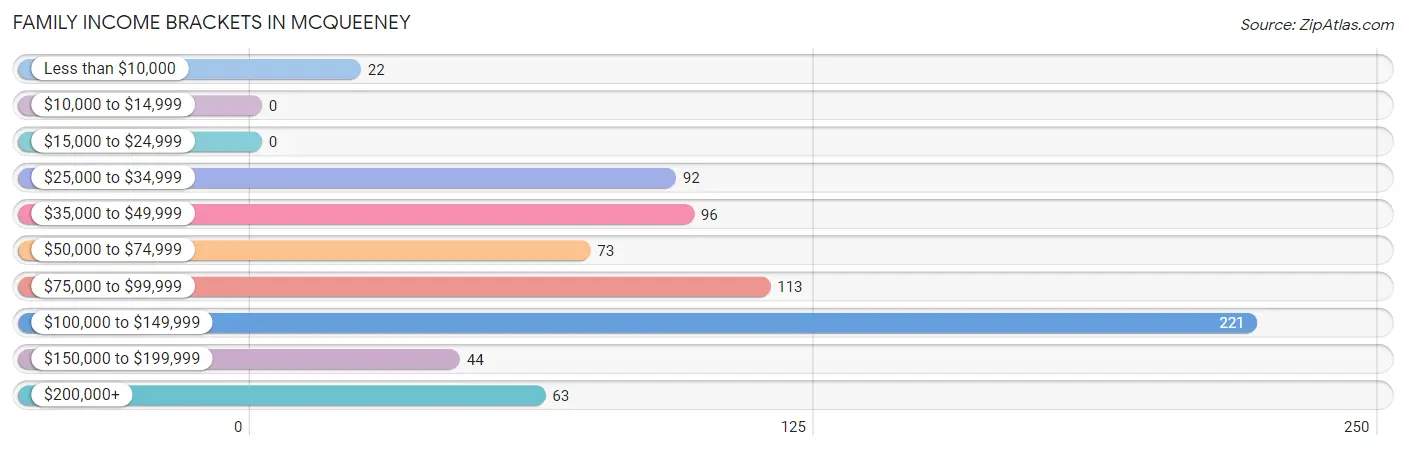
| Income Bracket | # Families | % Families |
| Less than $10,000 | 22 | 3.0% |
| $10,000 to $14,999 | 0 | 0.0% |
| $15,000 to $24,999 | 0 | 0.0% |
| $25,000 to $34,999 | 92 | 12.7% |
| $35,000 to $49,999 | 96 | 13.3% |
| $50,000 to $74,999 | 73 | 10.1% |
| $75,000 to $99,999 | 113 | 15.6% |
| $100,000 to $149,999 | 221 | 30.5% |
| $150,000 to $199,999 | 44 | 6.1% |
| $200,000+ | 63 | 8.7% |
Family Income by Famaliy Size in McQueeney
2-person families (426 | 58.8%) account for the highest median family income in McQueeney with $140,061 per family, while 2-person families (426 | 58.8%) have the highest median income of $70,030 per family member.
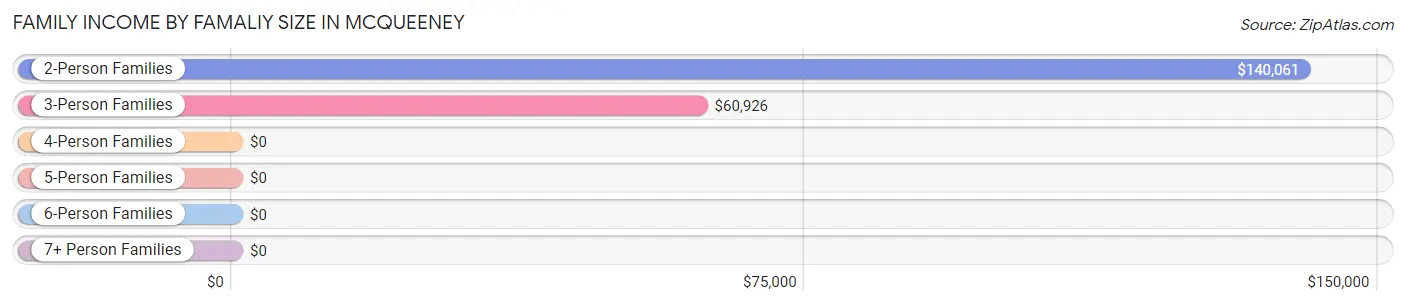
| Income Bracket | # Families | Median Income |
| 2-Person Families | 426 (58.8%) | $140,061 |
| 3-Person Families | 102 (14.1%) | $60,926 |
| 4-Person Families | 172 (23.8%) | $0 |
| 5-Person Families | 24 (3.3%) | $0 |
| 6-Person Families | 0 (0.0%) | $0 |
| 7+ Person Families | 0 (0.0%) | $0 |
| Total | 724 (100.0%) | $91,795 |
Family Income by Number of Earners in McQueeney
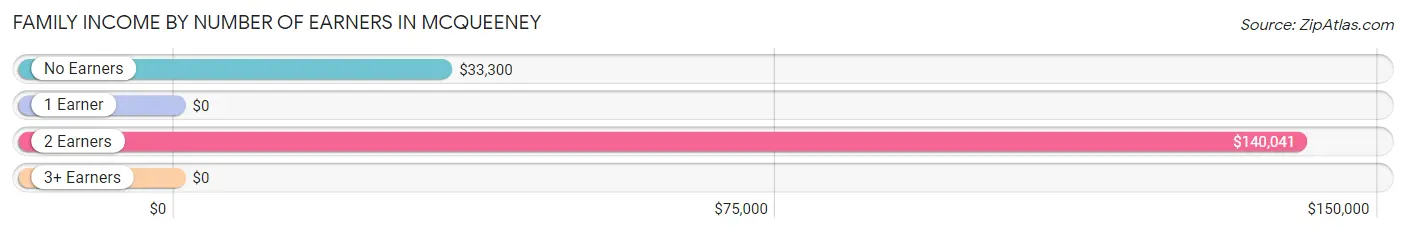
| Number of Earners | # Families | Median Income |
| No Earners | 96 (13.3%) | $33,300 |
| 1 Earner | 240 (33.2%) | $0 |
| 2 Earners | 350 (48.3%) | $140,041 |
| 3+ Earners | 38 (5.2%) | $0 |
| Total | 724 (100.0%) | $91,795 |
Household Income in McQueeney
Household Income Brackets in McQueeney
With 243 households falling in the category, the $100,000 to $149,999 income range is the most frequent in McQueeney, accounting for 25.5% of all households. In contrast, only 26 households (2.7%) fall into the $10,000 to $14,999 income bracket, making it the least populous group.
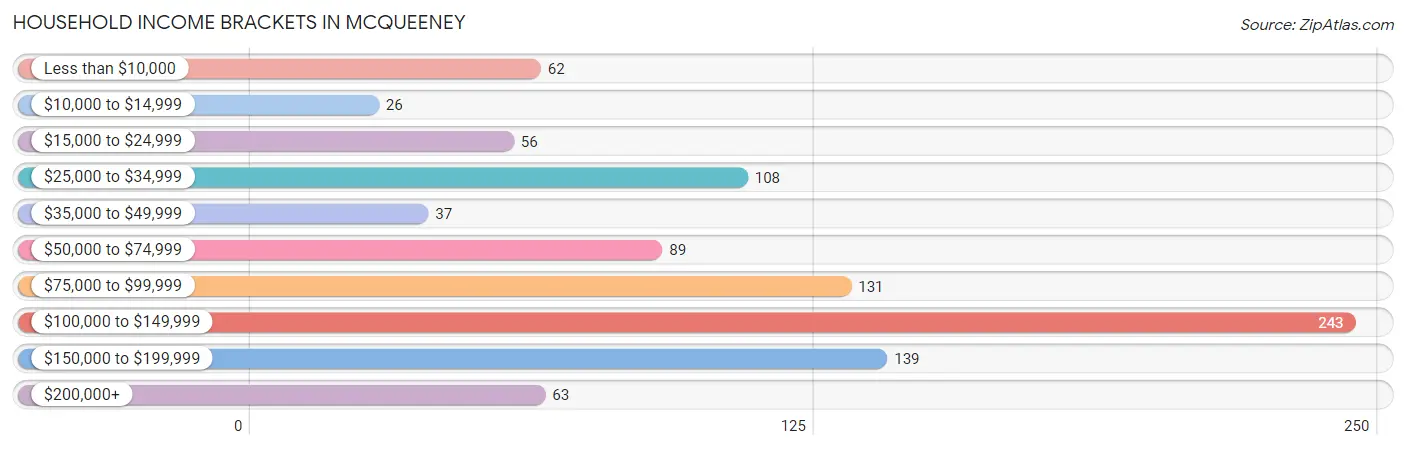
| Income Bracket | # Households | % Households |
| Less than $10,000 | 62 | 6.5% |
| $10,000 to $14,999 | 26 | 2.7% |
| $15,000 to $24,999 | 56 | 5.9% |
| $25,000 to $34,999 | 108 | 11.3% |
| $35,000 to $49,999 | 37 | 3.9% |
| $50,000 to $74,999 | 89 | 9.3% |
| $75,000 to $99,999 | 131 | 13.7% |
| $100,000 to $149,999 | 243 | 25.5% |
| $150,000 to $199,999 | 139 | 14.6% |
| $200,000+ | 63 | 6.6% |
Household Income by Householder Age in McQueeney
The median household income in McQueeney is $93,750, with the highest median household income of $140,031 found in the 45 to 64 years age bracket for the primary householder. A total of 363 households (38.1%) fall into this category.
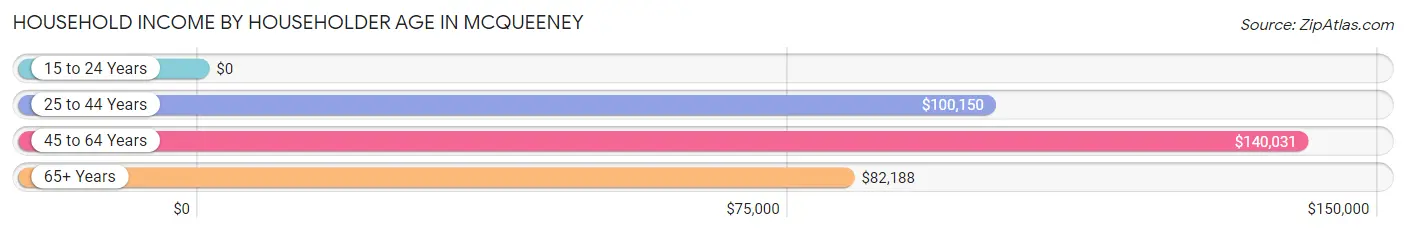
| Income Bracket | # Households | Median Income |
| 15 to 24 Years | 0 (0.0%) | $0 |
| 25 to 44 Years | 269 (28.2%) | $100,150 |
| 45 to 64 Years | 363 (38.1%) | $140,031 |
| 65+ Years | 322 (33.8%) | $82,188 |
| Total | 954 (100.0%) | $93,750 |
Poverty in McQueeney
Income Below Poverty by Sex and Age in McQueeney
With 4.5% poverty level for males and 14.1% for females among the residents of McQueeney, 16 and 17 year old males and 16 and 17 year old females are the most vulnerable to poverty, with 2 males (100.0%) and 23 females (100.0%) in their respective age groups living below the poverty level.
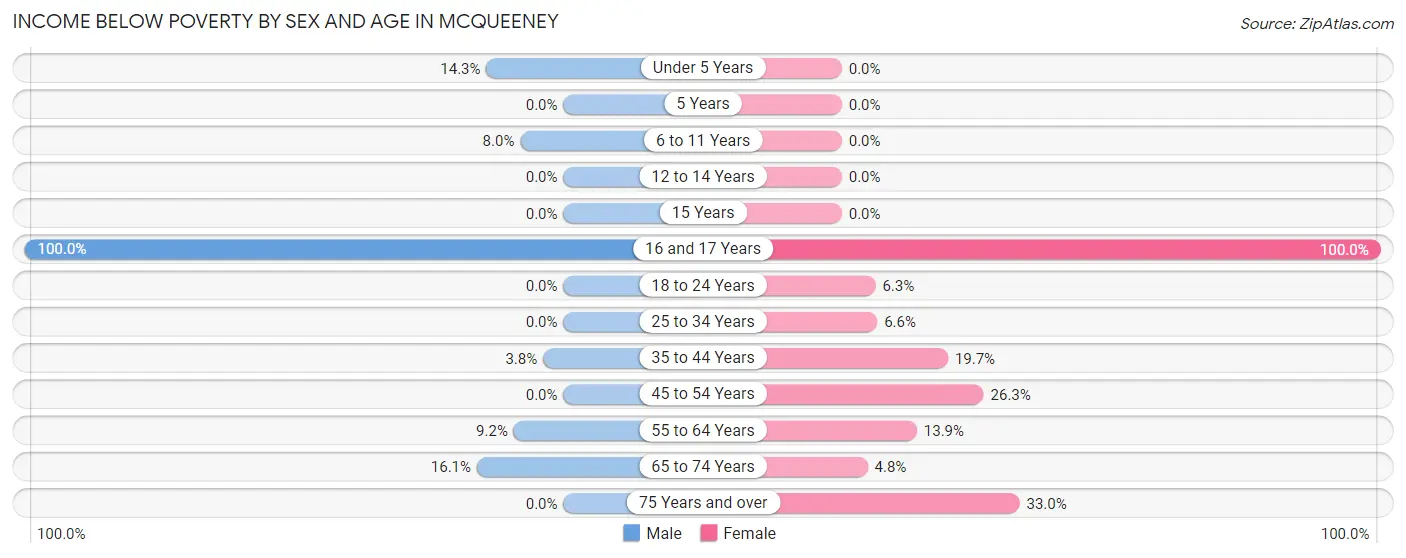
| Age Bracket | Male | Female |
| Under 5 Years | 6 (14.3%) | 0 (0.0%) |
| 5 Years | 0 (0.0%) | 0 (0.0%) |
| 6 to 11 Years | 6 (8.0%) | 0 (0.0%) |
| 12 to 14 Years | 0 (0.0%) | 0 (0.0%) |
| 15 Years | 0 (0.0%) | 0 (0.0%) |
| 16 and 17 Years | 2 (100.0%) | 23 (100.0%) |
| 18 to 24 Years | 0 (0.0%) | 1 (6.2%) |
| 25 to 34 Years | 0 (0.0%) | 9 (6.6%) |
| 35 to 44 Years | 8 (3.8%) | 26 (19.7%) |
| 45 to 54 Years | 0 (0.0%) | 25 (26.3%) |
| 55 to 64 Years | 21 (9.2%) | 34 (13.9%) |
| 65 to 74 Years | 13 (16.1%) | 8 (4.8%) |
| 75 Years and over | 0 (0.0%) | 32 (33.0%) |
| Total | 56 (4.5%) | 158 (14.1%) |
Income Above Poverty by Sex and Age in McQueeney
According to the poverty statistics in McQueeney, males aged 5 years and females aged under 5 years are the age groups that are most secure financially, with 100.0% of males and 100.0% of females in these age groups living above the poverty line.
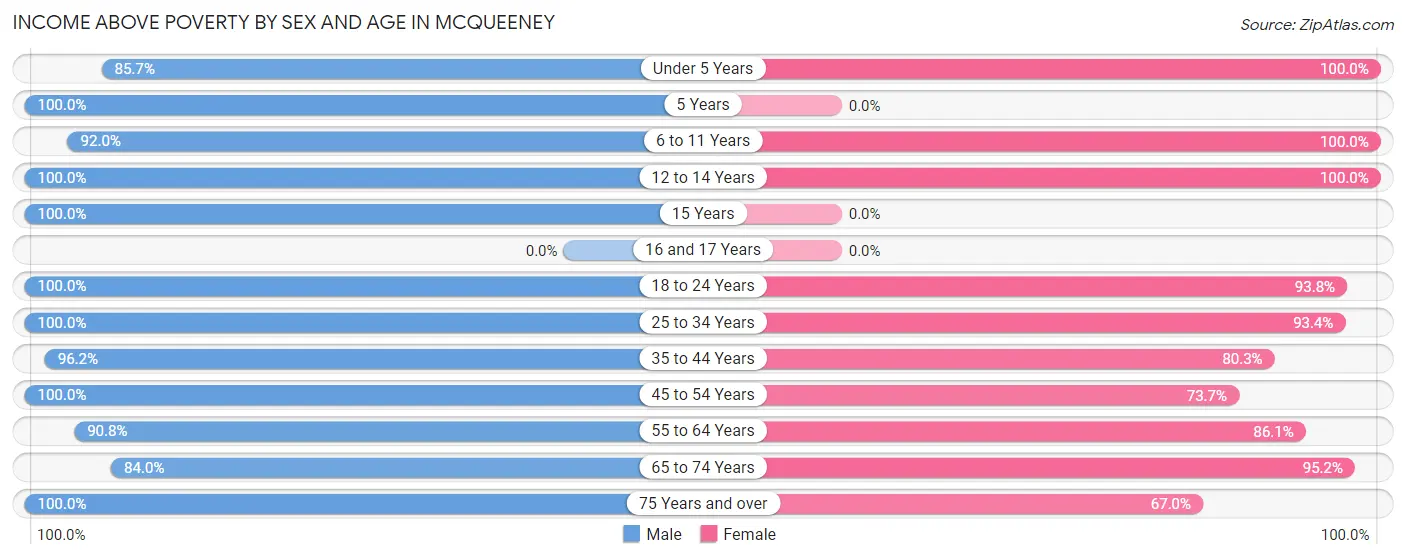
| Age Bracket | Male | Female |
| Under 5 Years | 36 (85.7%) | 102 (100.0%) |
| 5 Years | 12 (100.0%) | 0 (0.0%) |
| 6 to 11 Years | 69 (92.0%) | 87 (100.0%) |
| 12 to 14 Years | 47 (100.0%) | 19 (100.0%) |
| 15 Years | 115 (100.0%) | 0 (0.0%) |
| 16 and 17 Years | 0 (0.0%) | 0 (0.0%) |
| 18 to 24 Years | 56 (100.0%) | 15 (93.8%) |
| 25 to 34 Years | 71 (100.0%) | 128 (93.4%) |
| 35 to 44 Years | 205 (96.2%) | 106 (80.3%) |
| 45 to 54 Years | 146 (100.0%) | 70 (73.7%) |
| 55 to 64 Years | 207 (90.8%) | 210 (86.1%) |
| 65 to 74 Years | 68 (84.0%) | 159 (95.2%) |
| 75 Years and over | 164 (100.0%) | 65 (67.0%) |
| Total | 1,196 (95.5%) | 961 (85.9%) |
Income Below Poverty Among Married-Couple Families in McQueeney
The poverty statistics for married-couple families in McQueeney show that 3.7% or 22 of the total 598 families live below the poverty line. Families with 1 or 2 children have the highest poverty rate of 14.0%, comprising of 22 families. On the other hand, families with no children have the lowest poverty rate of 0.0%, which includes 0 families.
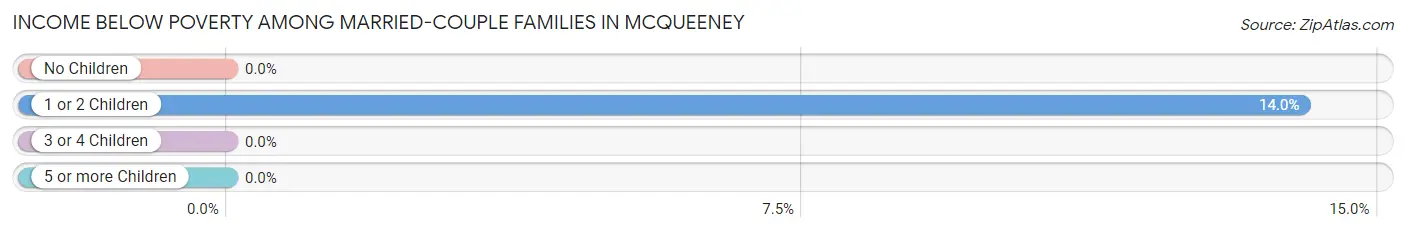
| Children | Above Poverty | Below Poverty |
| No Children | 417 (100.0%) | 0 (0.0%) |
| 1 or 2 Children | 135 (86.0%) | 22 (14.0%) |
| 3 or 4 Children | 24 (100.0%) | 0 (0.0%) |
| 5 or more Children | 0 (0.0%) | 0 (0.0%) |
| Total | 576 (96.3%) | 22 (3.7%) |
Income Below Poverty Among Single-Parent Households in McQueeney
| Children | Single Father | Single Mother |
| No Children | 0 (0.0%) | 0 (0.0%) |
| 1 or 2 Children | 0 (0.0%) | 0 (0.0%) |
| 3 or 4 Children | 0 (0.0%) | 0 (0.0%) |
| 5 or more Children | 0 (0.0%) | 0 (0.0%) |
| Total | 0 (0.0%) | 0 (0.0%) |
Income Below Poverty Among Married-Couple vs Single-Parent Households in McQueeney
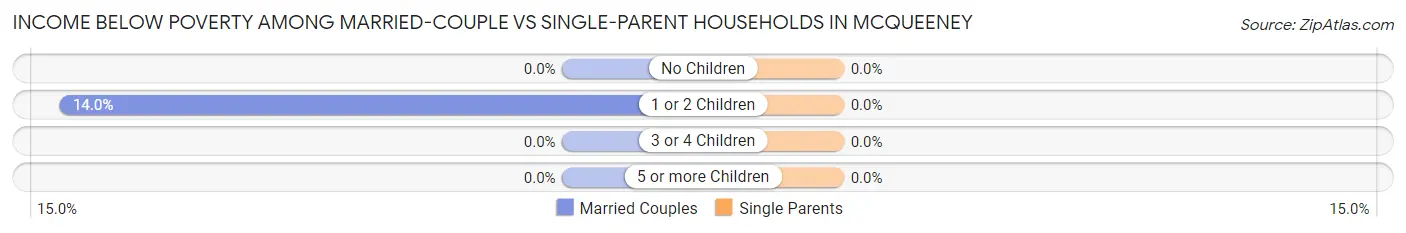
| Children | Married-Couple Families | Single-Parent Households |
| No Children | 0 (0.0%) | 0 (0.0%) |
| 1 or 2 Children | 22 (14.0%) | 0 (0.0%) |
| 3 or 4 Children | 0 (0.0%) | 0 (0.0%) |
| 5 or more Children | 0 (0.0%) | 0 (0.0%) |
| Total | 22 (3.7%) | 0 (0.0%) |
Race in McQueeney
The most populous races in McQueeney are White / Caucasian (1,609 | 67.9%), Hispanic or Latino (770 | 32.5%), and Two or more Races (435 | 18.3%).
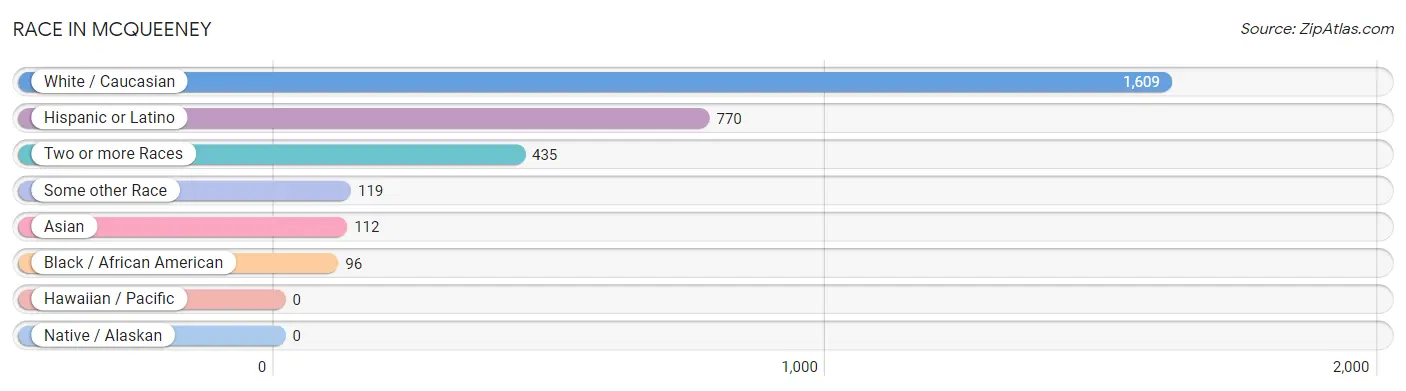
| Race | # Population | % Population |
| Asian | 112 | 4.7% |
| Black / African American | 96 | 4.1% |
| Hawaiian / Pacific | 0 | 0.0% |
| Hispanic or Latino | 770 | 32.5% |
| Native / Alaskan | 0 | 0.0% |
| White / Caucasian | 1,609 | 67.9% |
| Two or more Races | 435 | 18.3% |
| Some other Race | 119 | 5.0% |
| Total | 2,371 | 100.0% |
Ancestry in McQueeney
The most populous ancestries reported in McQueeney are Mexican (712 | 30.0%), German (442 | 18.6%), Irish (314 | 13.2%), American (168 | 7.1%), and French (134 | 5.7%), together accounting for 74.6% of all McQueeney residents.
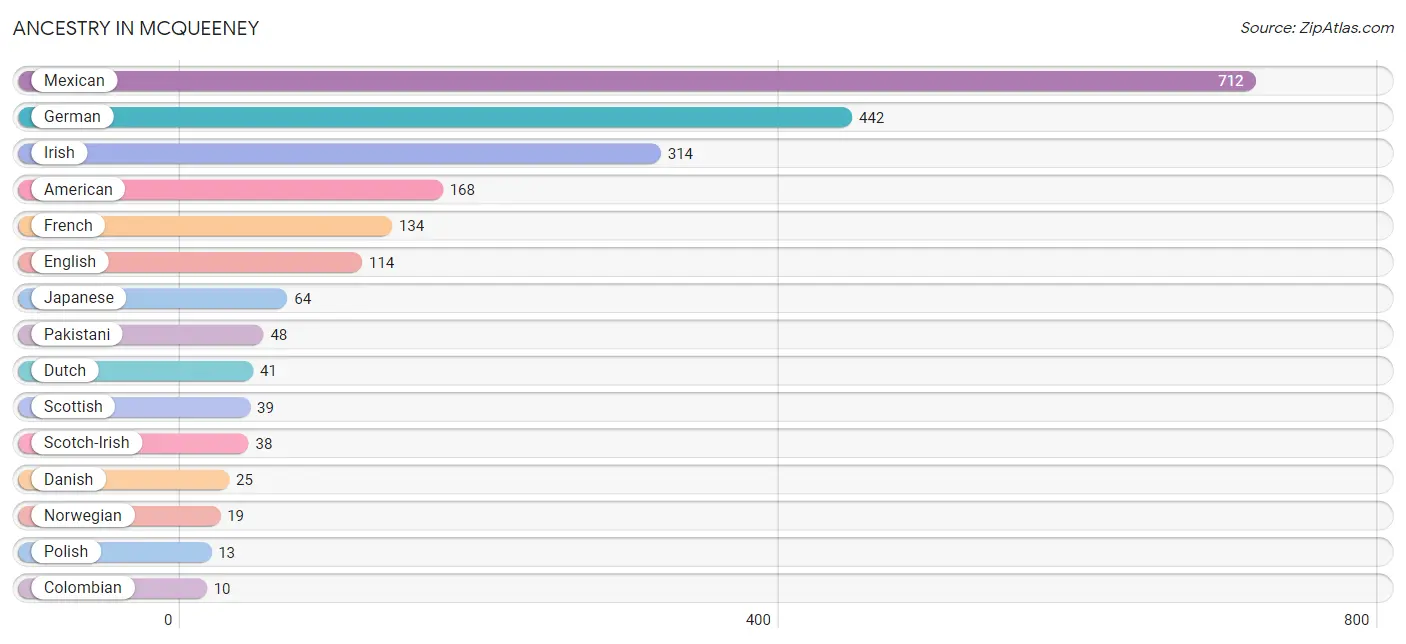
| Ancestry | # Population | % Population |
| American | 168 | 7.1% |
| Central American | 2 | 0.1% |
| Colombian | 10 | 0.4% |
| Czech | 7 | 0.3% |
| Danish | 25 | 1.1% |
| Dutch | 41 | 1.7% |
| English | 114 | 4.8% |
| European | 9 | 0.4% |
| French | 134 | 5.7% |
| German | 442 | 18.6% |
| Guatemalan | 2 | 0.1% |
| Irish | 314 | 13.2% |
| Italian | 8 | 0.3% |
| Japanese | 64 | 2.7% |
| Mexican | 712 | 30.0% |
| Northern European | 9 | 0.4% |
| Norwegian | 19 | 0.8% |
| Pakistani | 48 | 2.0% |
| Polish | 13 | 0.5% |
| Scotch-Irish | 38 | 1.6% |
| Scottish | 39 | 1.6% |
| South American | 10 | 0.4% |
| Welsh | 8 | 0.3% | View All 23 Rows |
Immigrants in McQueeney
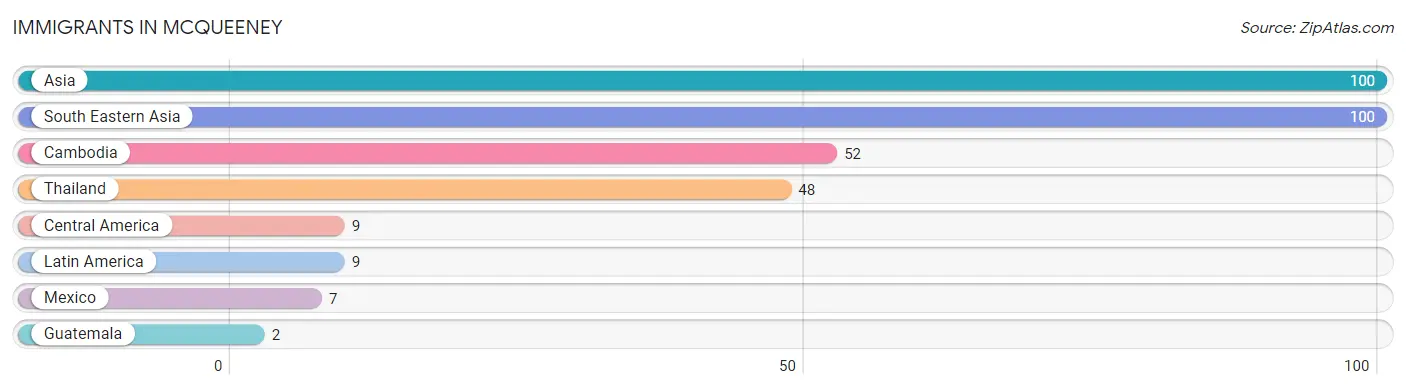
The most numerous immigrant groups reported in McQueeney came from Asia (100 | 4.2%), South Eastern Asia (100 | 4.2%), Cambodia (52 | 2.2%), Thailand (48 | 2.0%), and Central America (9 | 0.4%), together accounting for 13.0% of all McQueeney residents.
| Immigration Origin | # Population | % Population |
| Asia | 100 | 4.2% |
| Cambodia | 52 | 2.2% |
| Central America | 9 | 0.4% |
| Guatemala | 2 | 0.1% |
| Latin America | 9 | 0.4% |
| Mexico | 7 | 0.3% |
| South Eastern Asia | 100 | 4.2% |
| Thailand | 48 | 2.0% | View All 8 Rows |
Sex and Age in McQueeney
Sex and Age in McQueeney
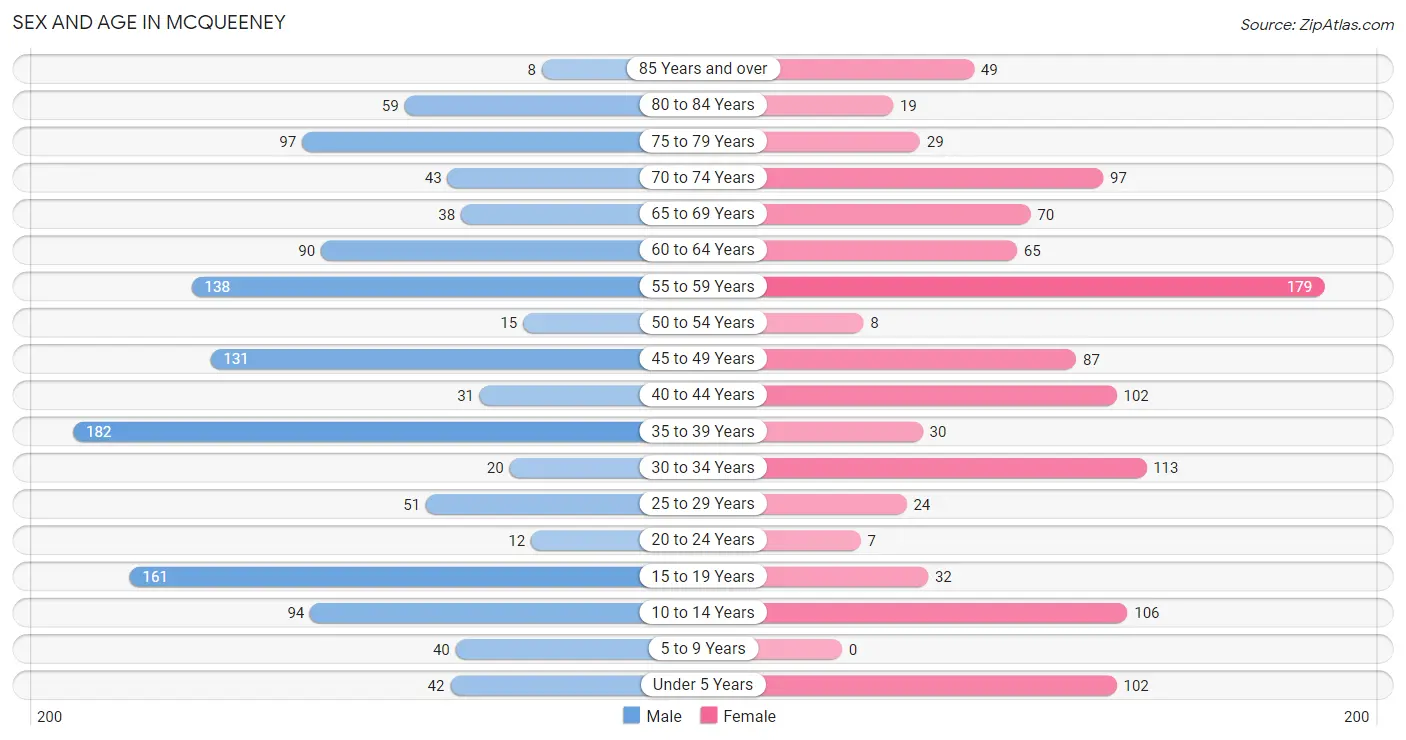
The most populous age groups in McQueeney are 35 to 39 Years (182 | 14.5%) for men and 55 to 59 Years (179 | 16.0%) for women.
| Age Bracket | Male | Female |
| Under 5 Years | 42 (3.4%) | 102 (9.1%) |
| 5 to 9 Years | 40 (3.2%) | 0 (0.0%) |
| 10 to 14 Years | 94 (7.5%) | 106 (9.5%) |
| 15 to 19 Years | 161 (12.9%) | 32 (2.9%) |
| 20 to 24 Years | 12 (1.0%) | 7 (0.6%) |
| 25 to 29 Years | 51 (4.1%) | 24 (2.1%) |
| 30 to 34 Years | 20 (1.6%) | 113 (10.1%) |
| 35 to 39 Years | 182 (14.5%) | 30 (2.7%) |
| 40 to 44 Years | 31 (2.5%) | 102 (9.1%) |
| 45 to 49 Years | 131 (10.5%) | 87 (7.8%) |
| 50 to 54 Years | 15 (1.2%) | 8 (0.7%) |
| 55 to 59 Years | 138 (11.0%) | 179 (16.0%) |
| 60 to 64 Years | 90 (7.2%) | 65 (5.8%) |
| 65 to 69 Years | 38 (3.0%) | 70 (6.3%) |
| 70 to 74 Years | 43 (3.4%) | 97 (8.7%) |
| 75 to 79 Years | 97 (7.7%) | 29 (2.6%) |
| 80 to 84 Years | 59 (4.7%) | 19 (1.7%) |
| 85 Years and over | 8 (0.6%) | 49 (4.4%) |
| Total | 1,252 (100.0%) | 1,119 (100.0%) |
Families and Households in McQueeney
Median Family Size in McQueeney
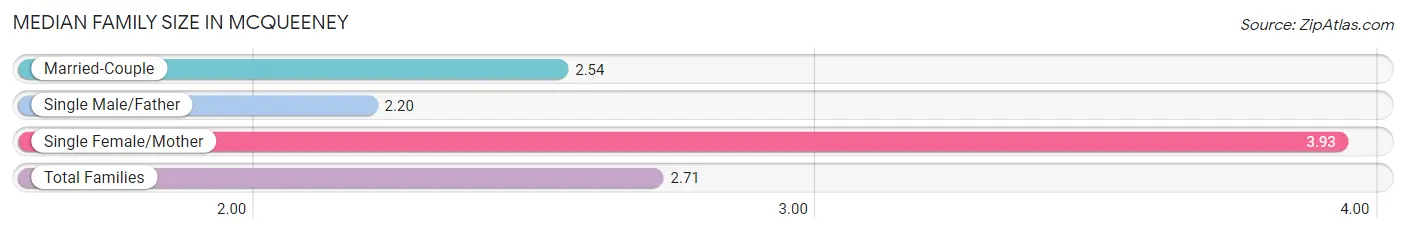
The median family size in McQueeney is 2.71 persons per family, with single female/mother families (96 | 13.3%) accounting for the largest median family size of 3.93 persons per family. On the other hand, single male/father families (30 | 4.1%) represent the smallest median family size with 2.20 persons per family.
| Family Type | # Families | Family Size |
| Married-Couple | 598 (82.6%) | 2.54 |
| Single Male/Father | 30 (4.1%) | 2.20 |
| Single Female/Mother | 96 (13.3%) | 3.93 |
| Total Families | 724 (100.0%) | 2.71 |
Median Household Size in McQueeney
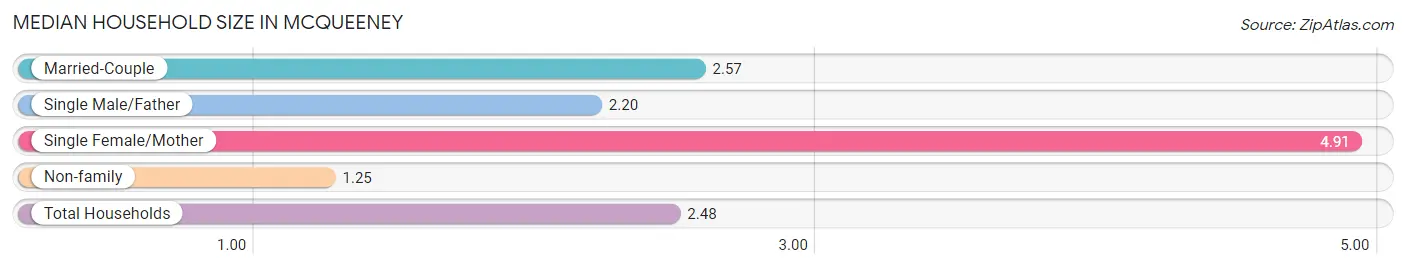
The median household size in McQueeney is 2.48 persons per household, with single female/mother households (96 | 10.1%) accounting for the largest median household size of 4.91 persons per household. non-family households (230 | 24.1%) represent the smallest median household size with 1.25 persons per household.
| Household Type | # Households | Household Size |
| Married-Couple | 598 (62.7%) | 2.57 |
| Single Male/Father | 30 (3.1%) | 2.20 |
| Single Female/Mother | 96 (10.1%) | 4.91 |
| Non-family | 230 (24.1%) | 1.25 |
| Total Households | 954 (100.0%) | 2.48 |
Household Size by Marriage Status in McQueeney
Out of a total of 954 households in McQueeney, 724 (75.9%) are family households, while 230 (24.1%) are nonfamily households. The most numerous type of family households are 2-person households, comprising 426, and the most common type of nonfamily households are 1-person households, comprising 177.
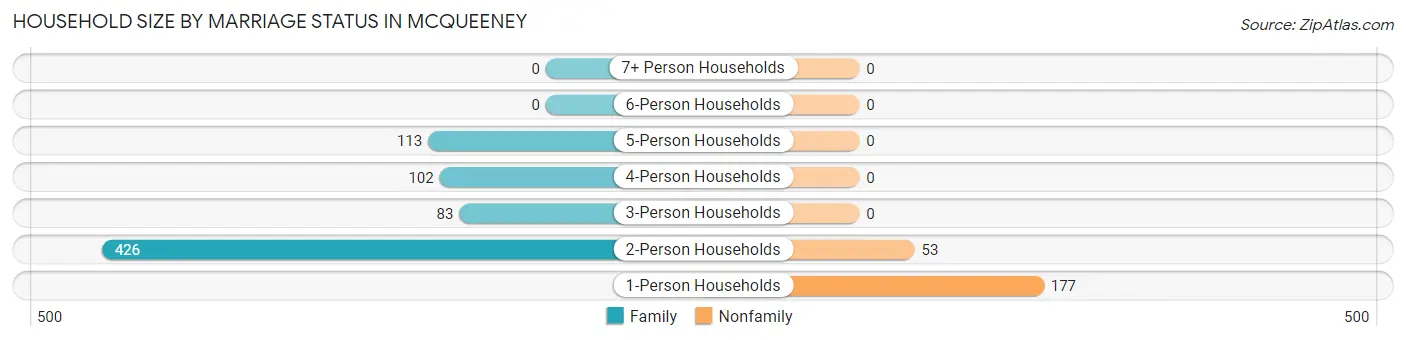
| Household Size | Family Households | Nonfamily Households |
| 1-Person Households | - | 177 (18.5%) |
| 2-Person Households | 426 (44.7%) | 53 (5.6%) |
| 3-Person Households | 83 (8.7%) | 0 (0.0%) |
| 4-Person Households | 102 (10.7%) | 0 (0.0%) |
| 5-Person Households | 113 (11.8%) | 0 (0.0%) |
| 6-Person Households | 0 (0.0%) | 0 (0.0%) |
| 7+ Person Households | 0 (0.0%) | 0 (0.0%) |
| Total | 724 (75.9%) | 230 (24.1%) |
Female Fertility in McQueeney
Fertility by Age in McQueeney
Average fertility rate in McQueeney is 22.0 births per 1,000 women. Women in the age bracket of 35 to 50 years have the highest fertility rate with 31.0 births per 1,000 women. Women in the age bracket of 35 to 50 years acount for 77.8% of all women with births.
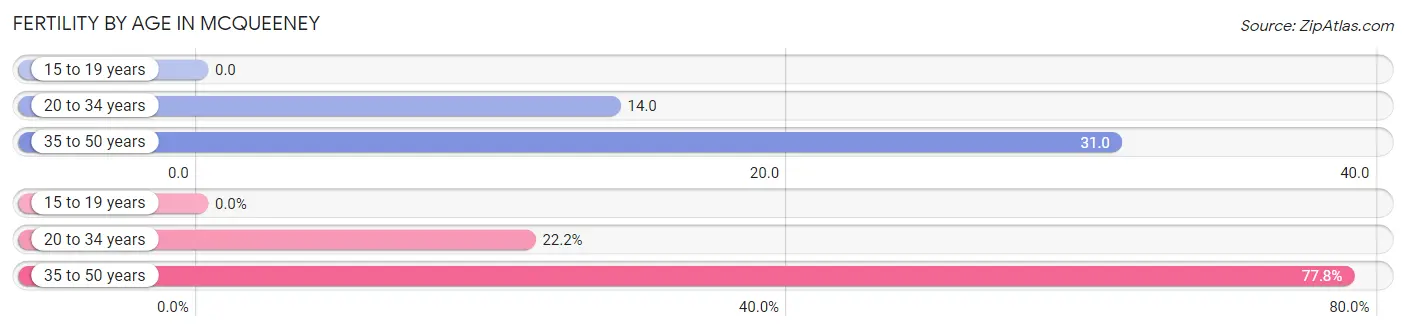
| Age Bracket | Women with Births | Births / 1,000 Women |
| 15 to 19 years | 0 (0.0%) | 0.0 |
| 20 to 34 years | 2 (22.2%) | 14.0 |
| 35 to 50 years | 7 (77.8%) | 31.0 |
| Total | 9 (100.0%) | 22.0 |
Fertility by Age by Marriage Status in McQueeney
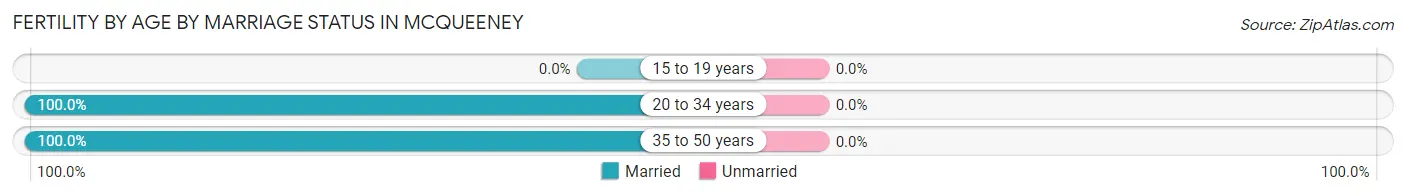
| Age Bracket | Married | Unmarried |
| 15 to 19 years | 0 (0.0%) | 0 (0.0%) |
| 20 to 34 years | 2 (100.0%) | 0 (0.0%) |
| 35 to 50 years | 7 (100.0%) | 0 (0.0%) |
| Total | 9 (100.0%) | 0 (0.0%) |
Fertility by Education in McQueeney
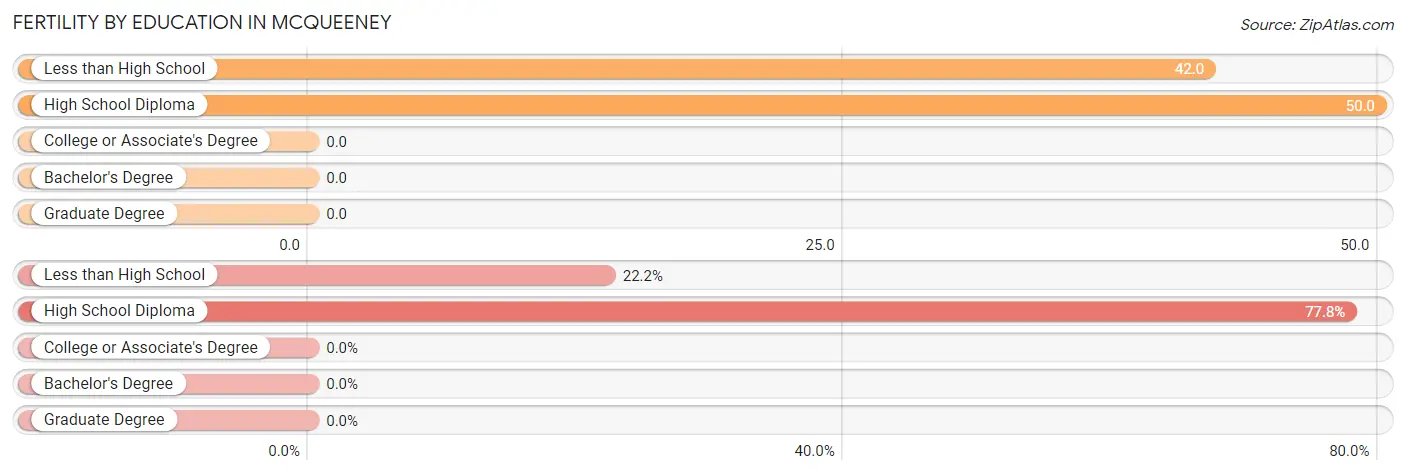
| Educational Attainment | Women with Births | Births / 1,000 Women |
| Less than High School | 2 (22.2%) | 42.0 |
| High School Diploma | 7 (77.8%) | 50.0 |
| College or Associate's Degree | 0 (0.0%) | 0.0 |
| Bachelor's Degree | 0 (0.0%) | 0.0 |
| Graduate Degree | 0 (0.0%) | 0.0 |
| Total | 9 (100.0%) | 22.0 |
Fertility by Education by Marriage Status in McQueeney
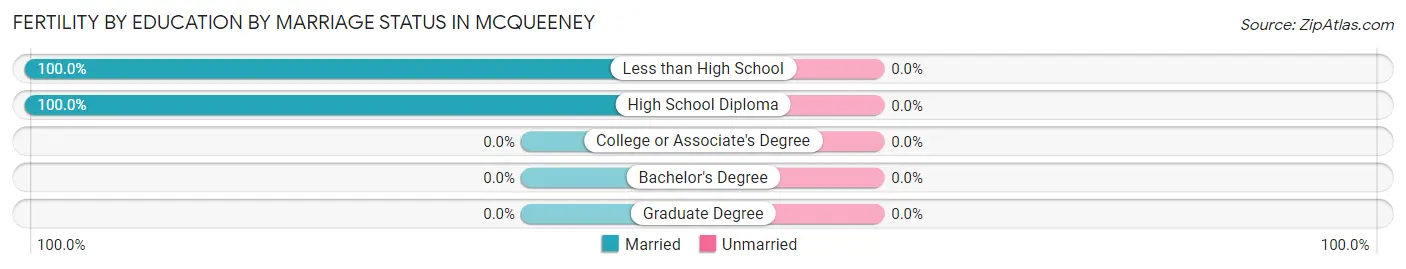
| Educational Attainment | Married | Unmarried |
| Less than High School | 2 (100.0%) | 0 (0.0%) |
| High School Diploma | 7 (100.0%) | 0 (0.0%) |
| College or Associate's Degree | 0 (0.0%) | 0 (0.0%) |
| Bachelor's Degree | 0 (0.0%) | 0 (0.0%) |
| Graduate Degree | 0 (0.0%) | 0 (0.0%) |
| Total | 9 (100.0%) | 0 (0.0%) |
Employment Characteristics in McQueeney
Employment by Class of Employer in McQueeney
Among the 1,203 employed individuals in McQueeney, private company employees (736 | 61.2%), self-employed (incorporated) (366 | 30.4%), and self-employed (not incorporated) (74 | 6.1%) make up the most common classes of employment.
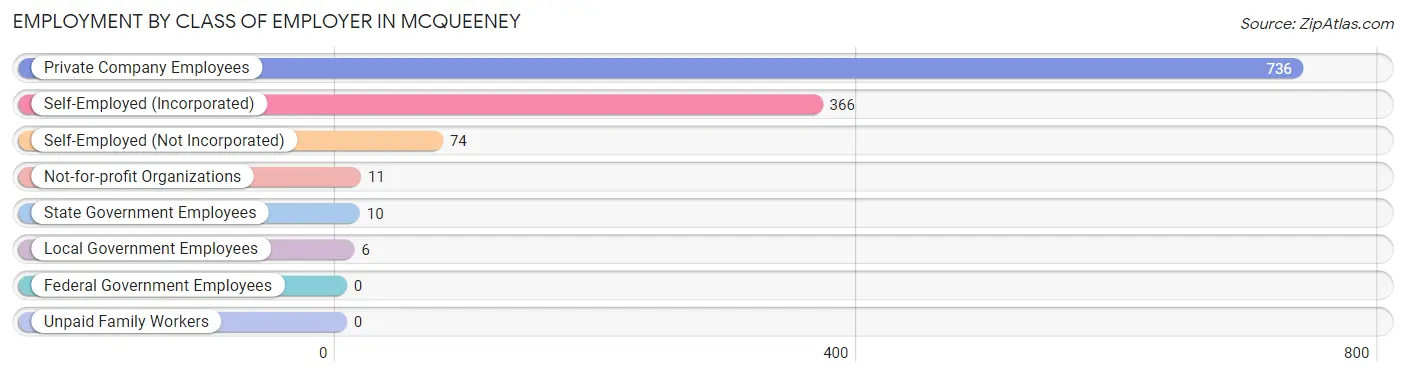
| Employer Class | # Employees | % Employees |
| Private Company Employees | 736 | 61.2% |
| Self-Employed (Incorporated) | 366 | 30.4% |
| Self-Employed (Not Incorporated) | 74 | 6.1% |
| Not-for-profit Organizations | 11 | 0.9% |
| Local Government Employees | 6 | 0.5% |
| State Government Employees | 10 | 0.8% |
| Federal Government Employees | 0 | 0.0% |
| Unpaid Family Workers | 0 | 0.0% |
| Total | 1,203 | 100.0% |
Employment Status by Age in McQueeney
According to the labor force statistics for McQueeney, out of the total population over 16 years of age (1,872), 68.8% or 1,288 individuals are in the labor force, with 4.7% or 61 of them unemployed. The age group with the highest labor force participation rate is 25 to 29 years, with 100.0% or 75 individuals in the labor force. Within the labor force, the 20 to 24 years age range has the highest percentage of unemployed individuals, with 61.1% or 11 of them being unemployed.
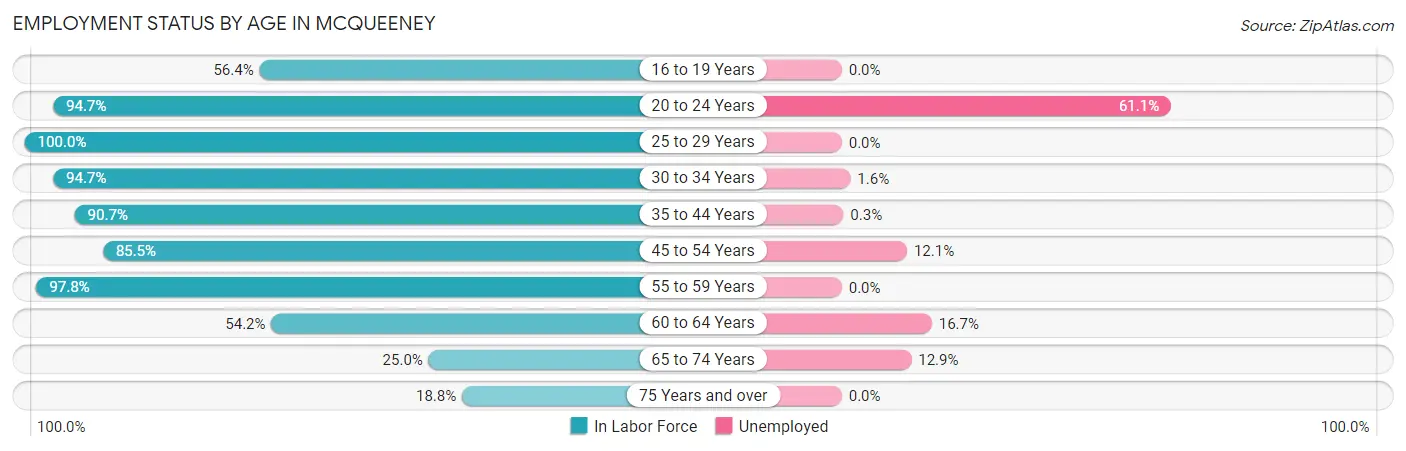
| Age Bracket | In Labor Force | Unemployed |
| 16 to 19 Years | 44 (56.4%) | 0 (0.0%) |
| 20 to 24 Years | 18 (94.7%) | 11 (61.1%) |
| 25 to 29 Years | 75 (100.0%) | 0 (0.0%) |
| 30 to 34 Years | 126 (94.7%) | 2 (1.6%) |
| 35 to 44 Years | 313 (90.7%) | 1 (0.3%) |
| 45 to 54 Years | 206 (85.5%) | 25 (12.1%) |
| 55 to 59 Years | 310 (97.8%) | 0 (0.0%) |
| 60 to 64 Years | 84 (54.2%) | 14 (16.7%) |
| 65 to 74 Years | 62 (25.0%) | 8 (12.9%) |
| 75 Years and over | 49 (18.8%) | 0 (0.0%) |
| Total | 1,288 (68.8%) | 61 (4.7%) |
Employment Status by Educational Attainment in McQueeney
According to labor force statistics for McQueeney, 88.0% of individuals (1,114) out of the total population between 25 and 64 years of age (1,266) are in the labor force, with 3.8% or 42 of them being unemployed. The group with the highest labor force participation rate are those with the educational attainment of less than high school, with 100.0% or 35 individuals in the labor force. Within the labor force, individuals with bachelor's degree or higher education have the highest percentage of unemployment, with 15.6% or 40 of them being unemployed.
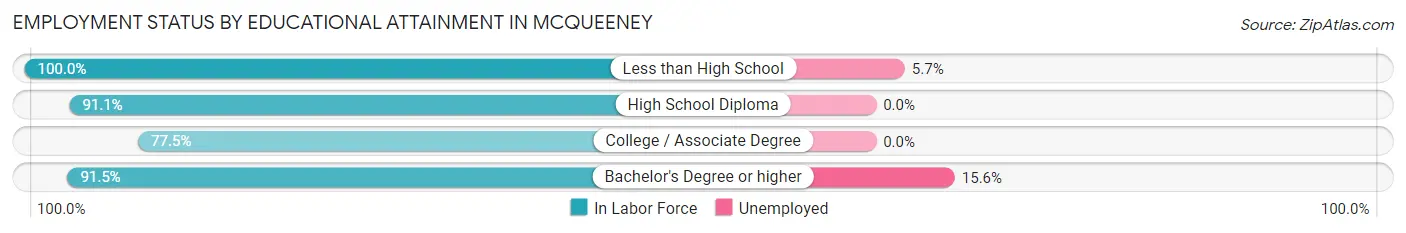
| Educational Attainment | In Labor Force | Unemployed |
| Less than High School | 35 (100.0%) | 2 (5.7%) |
| High School Diploma | 574 (91.1%) | 0 (0.0%) |
| College / Associate Degree | 248 (77.5%) | 0 (0.0%) |
| Bachelor's Degree or higher | 257 (91.5%) | 44 (15.6%) |
| Total | 1,114 (88.0%) | 48 (3.8%) |
Employment Occupations by Sex in McQueeney
Management, Business, Science and Arts Occupations
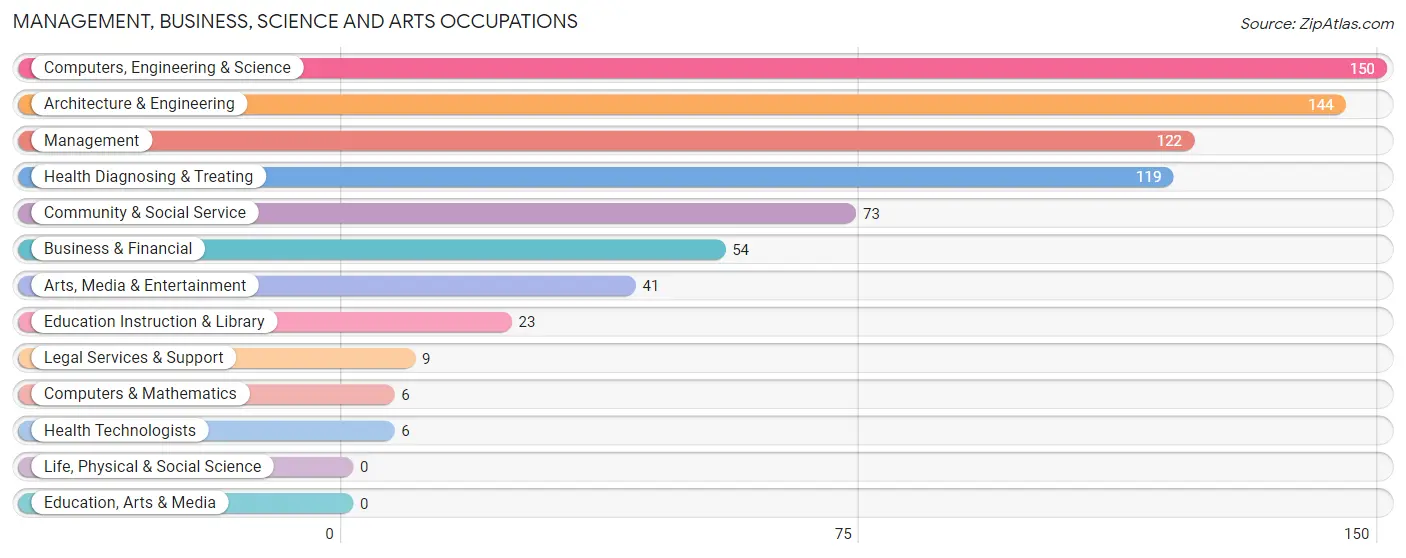
The most common Management, Business, Science and Arts occupations in McQueeney are Computers, Engineering & Science (150 | 12.2%), Architecture & Engineering (144 | 11.7%), Management (122 | 10.0%), Health Diagnosing & Treating (119 | 9.7%), and Community & Social Service (73 | 5.9%).
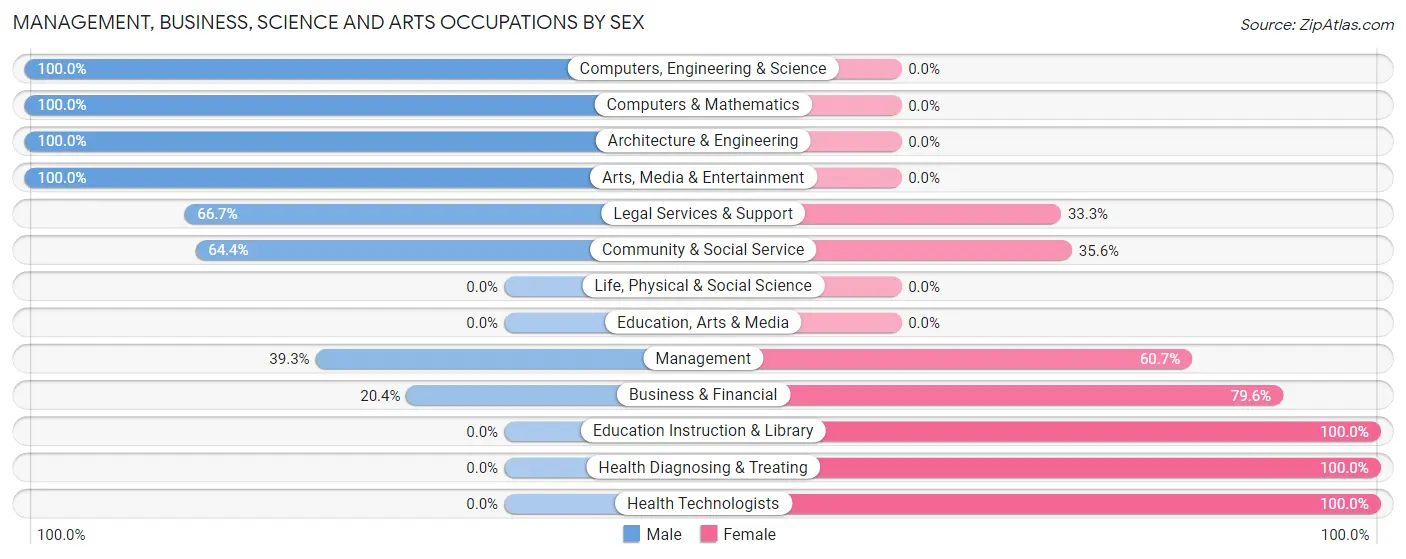
Management, Business, Science and Arts Occupations by Sex
Within the Management, Business, Science and Arts occupations in McQueeney, the most male-oriented occupations are Computers, Engineering & Science (100.0%), Computers & Mathematics (100.0%), and Architecture & Engineering (100.0%), while the most female-oriented occupations are Education Instruction & Library (100.0%), Health Diagnosing & Treating (100.0%), and Health Technologists (100.0%).
| Occupation | Male | Female |
| Management | 48 (39.3%) | 74 (60.7%) |
| Business & Financial | 11 (20.4%) | 43 (79.6%) |
| Computers, Engineering & Science | 150 (100.0%) | 0 (0.0%) |
| Computers & Mathematics | 6 (100.0%) | 0 (0.0%) |
| Architecture & Engineering | 144 (100.0%) | 0 (0.0%) |
| Life, Physical & Social Science | 0 (0.0%) | 0 (0.0%) |
| Community & Social Service | 47 (64.4%) | 26 (35.6%) |
| Education, Arts & Media | 0 (0.0%) | 0 (0.0%) |
| Legal Services & Support | 6 (66.7%) | 3 (33.3%) |
| Education Instruction & Library | 0 (0.0%) | 23 (100.0%) |
| Arts, Media & Entertainment | 41 (100.0%) | 0 (0.0%) |
| Health Diagnosing & Treating | 0 (0.0%) | 119 (100.0%) |
| Health Technologists | 0 (0.0%) | 6 (100.0%) |
| Total (Category) | 256 (49.4%) | 262 (50.6%) |
| Total (Overall) | 722 (58.9%) | 504 (41.1%) |
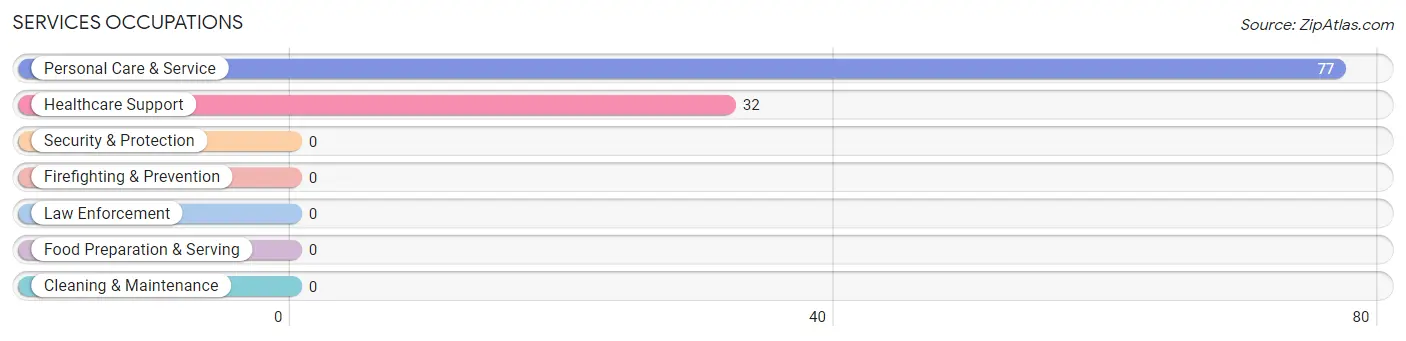
Services Occupations
The most common Services occupations in McQueeney are Personal Care & Service (77 | 6.3%), and Healthcare Support (32 | 2.6%).
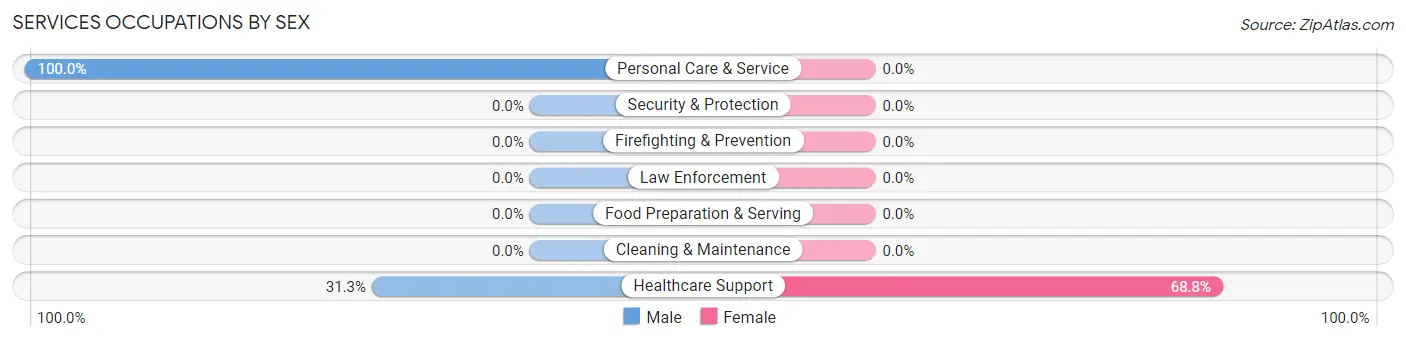
Services Occupations by Sex
| Occupation | Male | Female |
| Healthcare Support | 10 (31.2%) | 22 (68.8%) |
| Security & Protection | 0 (0.0%) | 0 (0.0%) |
| Firefighting & Prevention | 0 (0.0%) | 0 (0.0%) |
| Law Enforcement | 0 (0.0%) | 0 (0.0%) |
| Food Preparation & Serving | 0 (0.0%) | 0 (0.0%) |
| Cleaning & Maintenance | 0 (0.0%) | 0 (0.0%) |
| Personal Care & Service | 77 (100.0%) | 0 (0.0%) |
| Total (Category) | 87 (79.8%) | 22 (20.2%) |
| Total (Overall) | 722 (58.9%) | 504 (41.1%) |
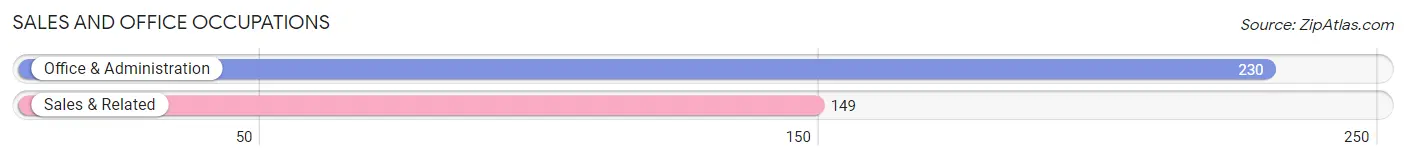
Sales and Office Occupations
The most common Sales and Office occupations in McQueeney are Office & Administration (230 | 18.8%), and Sales & Related (149 | 12.1%).
Sales and Office Occupations by Sex
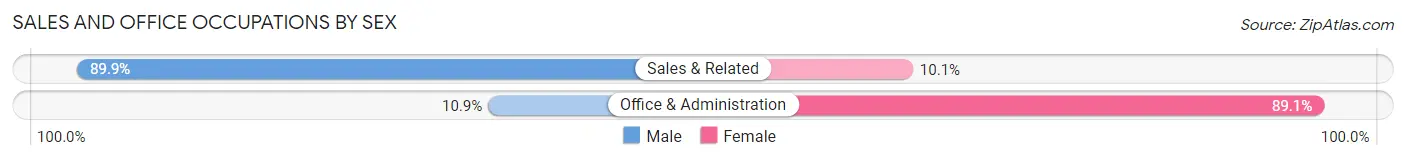
| Occupation | Male | Female |
| Sales & Related | 134 (89.9%) | 15 (10.1%) |
| Office & Administration | 25 (10.9%) | 205 (89.1%) |
| Total (Category) | 159 (41.9%) | 220 (58.1%) |
| Total (Overall) | 722 (58.9%) | 504 (41.1%) |
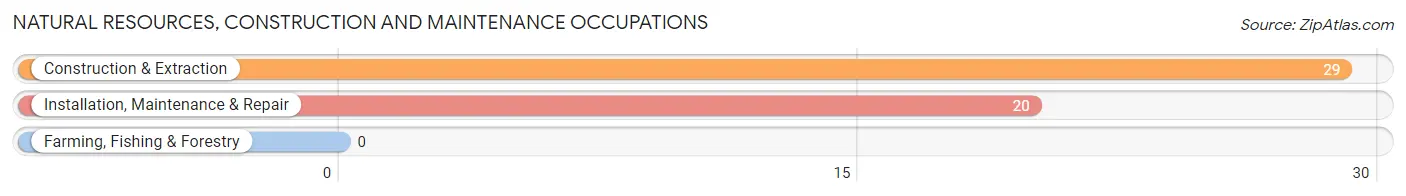
Natural Resources, Construction and Maintenance Occupations
The most common Natural Resources, Construction and Maintenance occupations in McQueeney are Construction & Extraction (29 | 2.4%), and Installation, Maintenance & Repair (20 | 1.6%).
Natural Resources, Construction and Maintenance Occupations by Sex
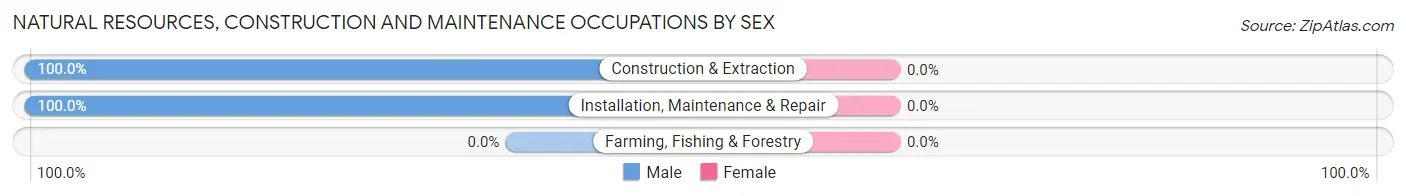
| Occupation | Male | Female |
| Farming, Fishing & Forestry | 0 (0.0%) | 0 (0.0%) |
| Construction & Extraction | 29 (100.0%) | 0 (0.0%) |
| Installation, Maintenance & Repair | 20 (100.0%) | 0 (0.0%) |
| Total (Category) | 49 (100.0%) | 0 (0.0%) |
| Total (Overall) | 722 (58.9%) | 504 (41.1%) |
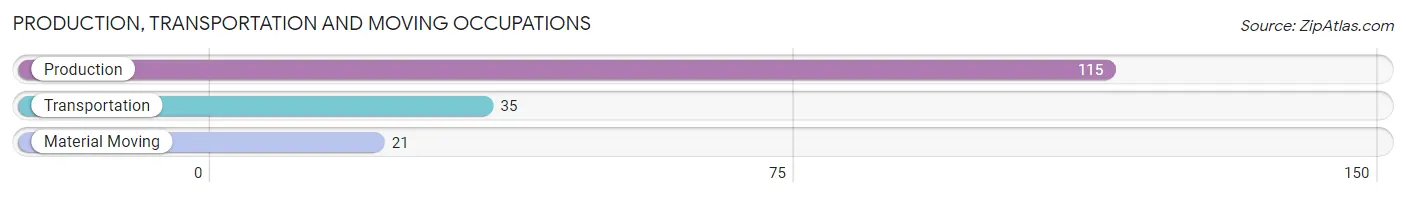
Production, Transportation and Moving Occupations
The most common Production, Transportation and Moving occupations in McQueeney are Production (115 | 9.4%), Transportation (35 | 2.9%), and Material Moving (21 | 1.7%).
Production, Transportation and Moving Occupations by Sex
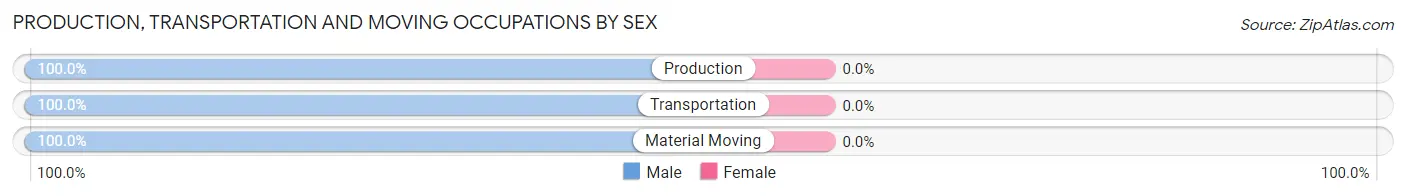
| Occupation | Male | Female |
| Production | 115 (100.0%) | 0 (0.0%) |
| Transportation | 35 (100.0%) | 0 (0.0%) |
| Material Moving | 21 (100.0%) | 0 (0.0%) |
| Total (Category) | 171 (100.0%) | 0 (0.0%) |
| Total (Overall) | 722 (58.9%) | 504 (41.1%) |
Employment Industries by Sex in McQueeney
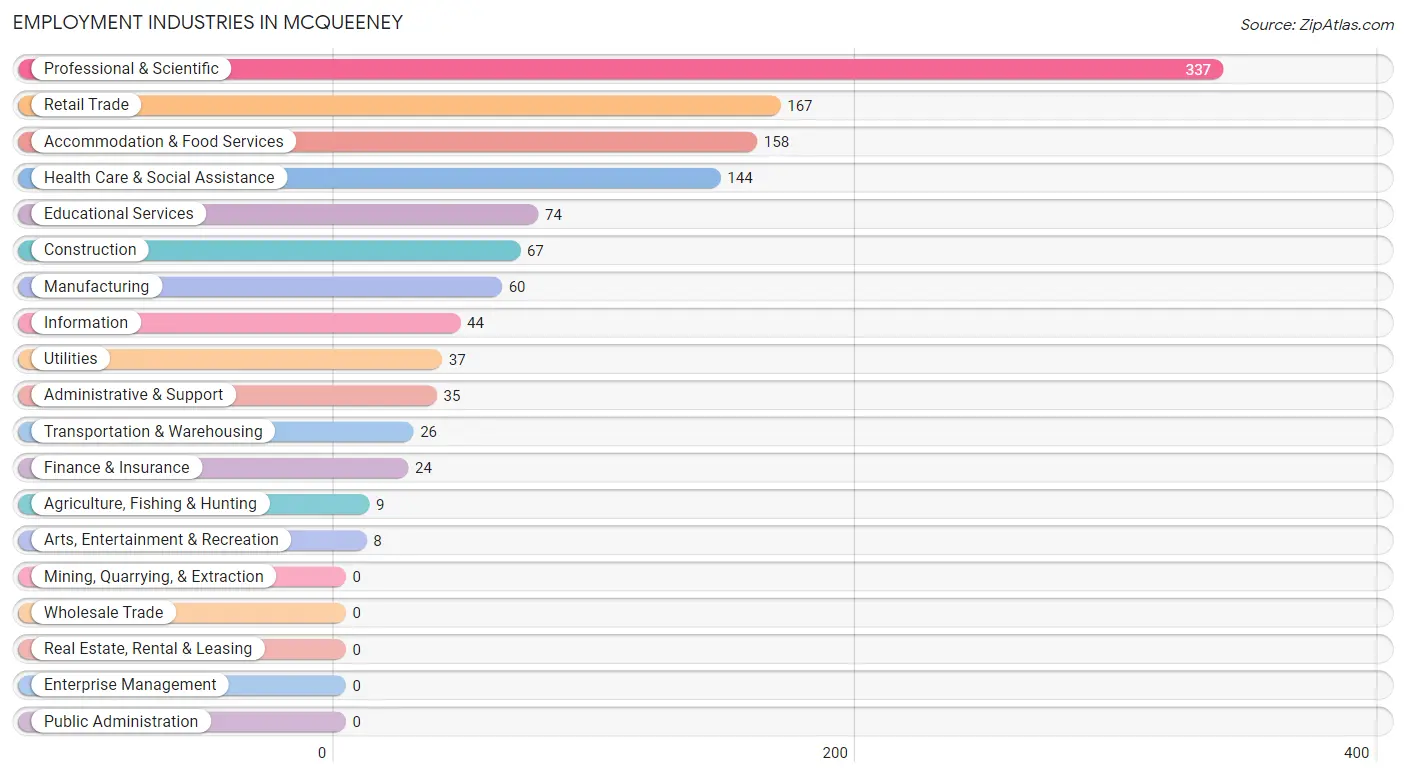
Employment Industries in McQueeney
The major employment industries in McQueeney include Professional & Scientific (337 | 27.5%), Retail Trade (167 | 13.6%), Accommodation & Food Services (158 | 12.9%), Health Care & Social Assistance (144 | 11.7%), and Educational Services (74 | 6.0%).
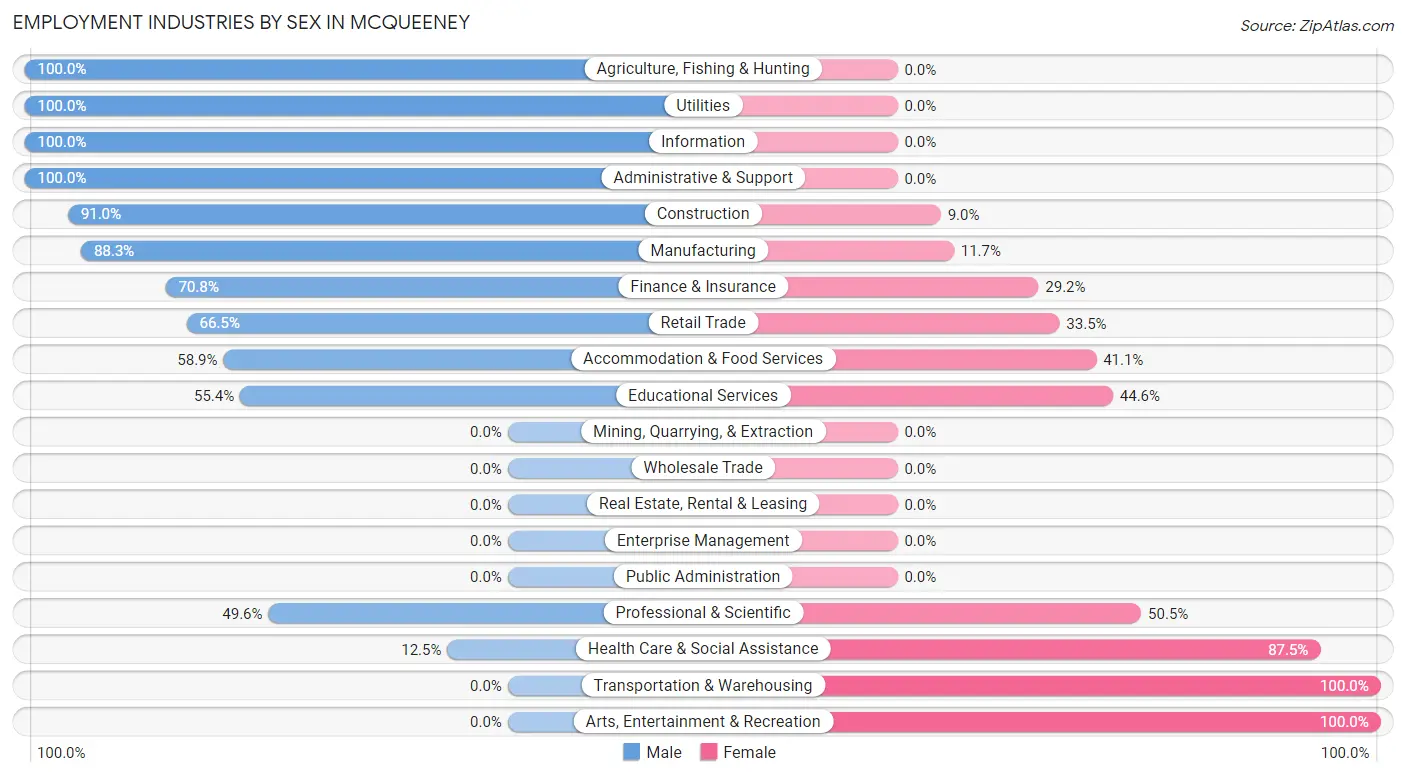
Employment Industries by Sex in McQueeney
The McQueeney industries that see more men than women are Agriculture, Fishing & Hunting (100.0%), Utilities (100.0%), and Information (100.0%), whereas the industries that tend to have a higher number of women are Transportation & Warehousing (100.0%), Arts, Entertainment & Recreation (100.0%), and Health Care & Social Assistance (87.5%).
| Industry | Male | Female |
| Agriculture, Fishing & Hunting | 9 (100.0%) | 0 (0.0%) |
| Mining, Quarrying, & Extraction | 0 (0.0%) | 0 (0.0%) |
| Construction | 61 (91.0%) | 6 (9.0%) |
| Manufacturing | 53 (88.3%) | 7 (11.7%) |
| Wholesale Trade | 0 (0.0%) | 0 (0.0%) |
| Retail Trade | 111 (66.5%) | 56 (33.5%) |
| Transportation & Warehousing | 0 (0.0%) | 26 (100.0%) |
| Utilities | 37 (100.0%) | 0 (0.0%) |
| Information | 44 (100.0%) | 0 (0.0%) |
| Finance & Insurance | 17 (70.8%) | 7 (29.2%) |
| Real Estate, Rental & Leasing | 0 (0.0%) | 0 (0.0%) |
| Professional & Scientific | 167 (49.5%) | 170 (50.4%) |
| Enterprise Management | 0 (0.0%) | 0 (0.0%) |
| Administrative & Support | 35 (100.0%) | 0 (0.0%) |
| Educational Services | 41 (55.4%) | 33 (44.6%) |
| Health Care & Social Assistance | 18 (12.5%) | 126 (87.5%) |
| Arts, Entertainment & Recreation | 0 (0.0%) | 8 (100.0%) |
| Accommodation & Food Services | 93 (58.9%) | 65 (41.1%) |
| Public Administration | 0 (0.0%) | 0 (0.0%) |
| Total | 722 (58.9%) | 504 (41.1%) |
Education in McQueeney
School Enrollment in McQueeney
The most common levels of schooling among the 559 students in McQueeney are high school (221 | 39.5%), middle school (139 | 24.9%), and nursery / preschool (129 | 23.1%).
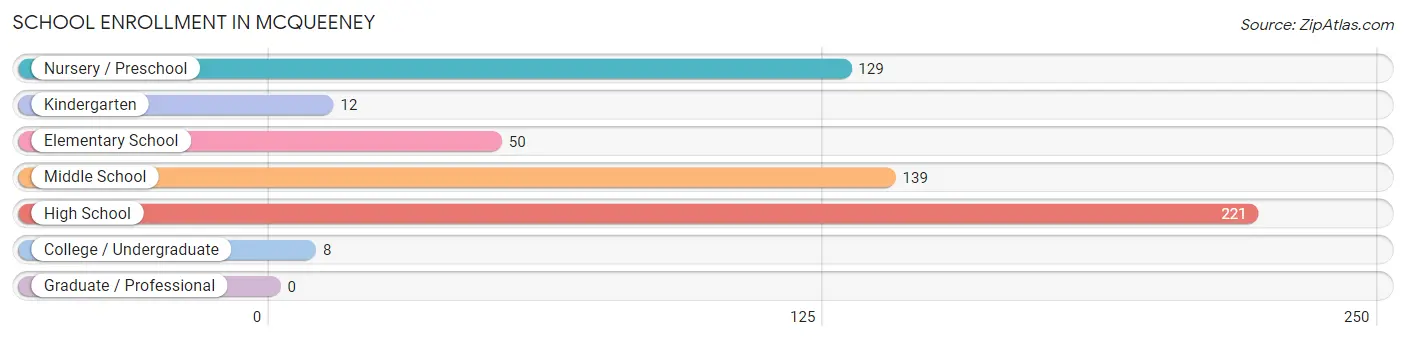
| School Level | # Students | % Students |
| Nursery / Preschool | 129 | 23.1% |
| Kindergarten | 12 | 2.1% |
| Elementary School | 50 | 8.9% |
| Middle School | 139 | 24.9% |
| High School | 221 | 39.5% |
| College / Undergraduate | 8 | 1.4% |
| Graduate / Professional | 0 | 0.0% |
| Total | 559 | 100.0% |
School Enrollment by Age by Funding Source in McQueeney
Out of a total of 559 students who are enrolled in schools in McQueeney, 49 (8.8%) attend a private institution, while the remaining 510 (91.2%) are enrolled in public schools. The age group of 20 to 24 year olds has the highest likelihood of being enrolled in private schools, with 7 (87.5% in the age bracket) enrolled. Conversely, the age group of 10 to 14 year olds has the lowest likelihood of being enrolled in a private school, with 200 (100.0% in the age bracket) attending a public institution.
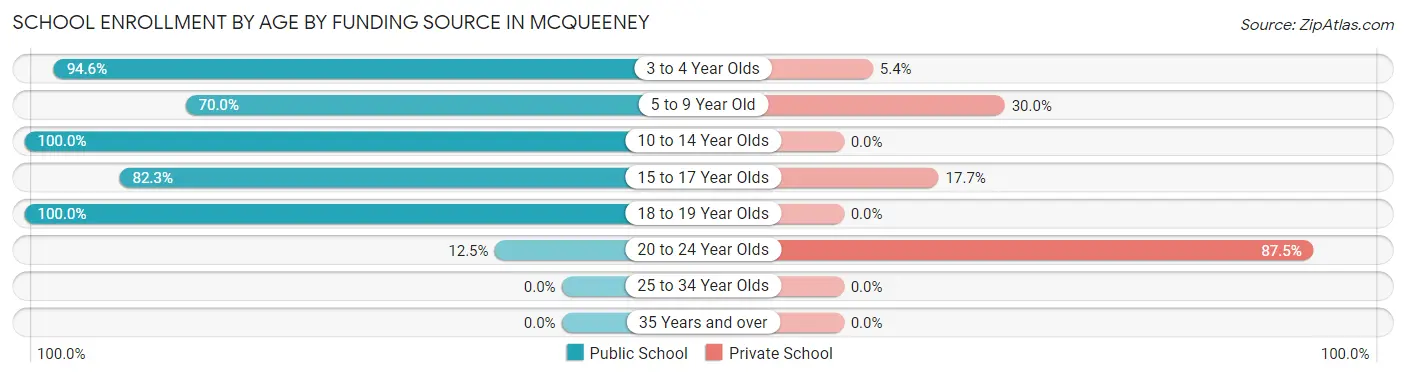
| Age Bracket | Public School | Private School |
| 3 to 4 Year Olds | 122 (94.6%) | 7 (5.4%) |
| 5 to 9 Year Old | 28 (70.0%) | 12 (30.0%) |
| 10 to 14 Year Olds | 200 (100.0%) | 0 (0.0%) |
| 15 to 17 Year Olds | 107 (82.3%) | 23 (17.7%) |
| 18 to 19 Year Olds | 52 (100.0%) | 0 (0.0%) |
| 20 to 24 Year Olds | 1 (12.5%) | 7 (87.5%) |
| 25 to 34 Year Olds | 0 (0.0%) | 0 (0.0%) |
| 35 Years and over | 0 (0.0%) | 0 (0.0%) |
| Total | 510 (91.2%) | 49 (8.8%) |
Educational Attainment by Field of Study in McQueeney
Business (176 | 36.2%), education (106 | 21.8%), liberal arts & history (45 | 9.3%), multidisciplinary studies (25 | 5.1%), and social sciences (24 | 4.9%) are the most common fields of study among 486 individuals in McQueeney who have obtained a bachelor's degree or higher.
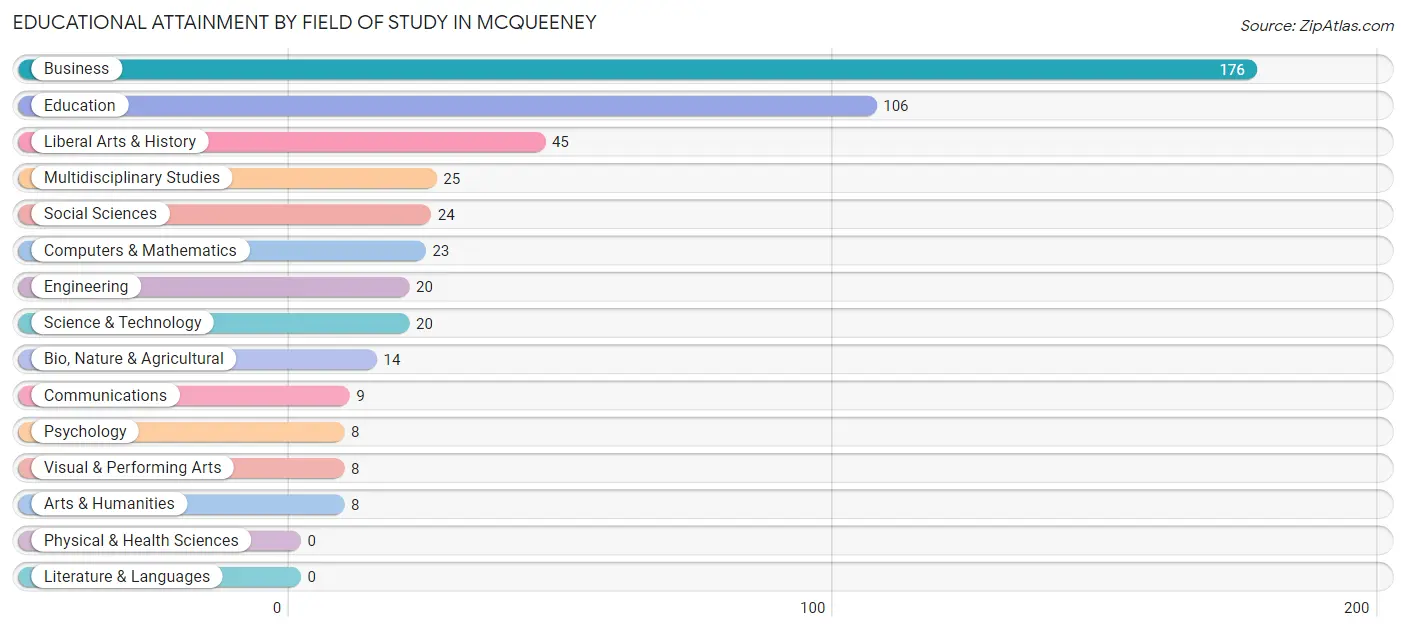
| Field of Study | # Graduates | % Graduates |
| Computers & Mathematics | 23 | 4.7% |
| Bio, Nature & Agricultural | 14 | 2.9% |
| Physical & Health Sciences | 0 | 0.0% |
| Psychology | 8 | 1.7% |
| Social Sciences | 24 | 4.9% |
| Engineering | 20 | 4.1% |
| Multidisciplinary Studies | 25 | 5.1% |
| Science & Technology | 20 | 4.1% |
| Business | 176 | 36.2% |
| Education | 106 | 21.8% |
| Literature & Languages | 0 | 0.0% |
| Liberal Arts & History | 45 | 9.3% |
| Visual & Performing Arts | 8 | 1.7% |
| Communications | 9 | 1.8% |
| Arts & Humanities | 8 | 1.7% |
| Total | 486 | 100.0% |
Transportation & Commute in McQueeney
Vehicle Availability by Sex in McQueeney
The most prevalent vehicle ownership categories in McQueeney are males with 2 vehicles (328, accounting for 46.9%) and females with 2 vehicles (253, making up 65.1%).
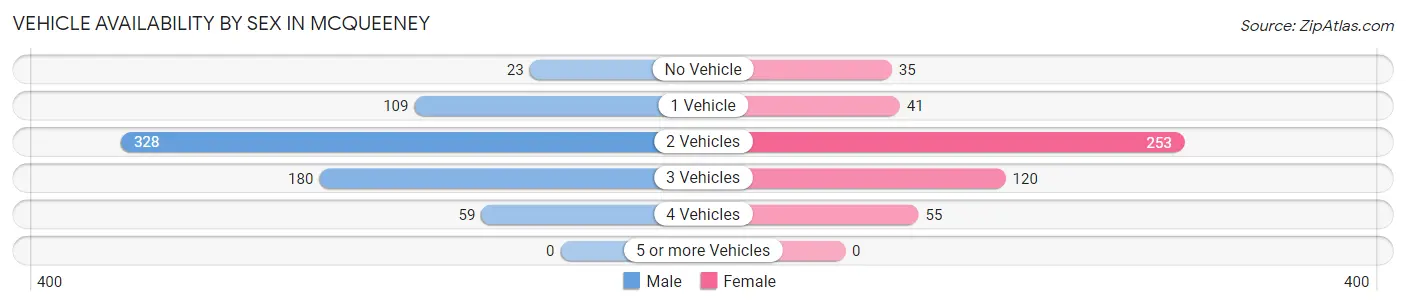
| Vehicles Available | Male | Female |
| No Vehicle | 23 (3.3%) | 35 (6.9%) |
| 1 Vehicle | 109 (15.6%) | 41 (8.1%) |
| 2 Vehicles | 328 (46.9%) | 253 (50.2%) |
| 3 Vehicles | 180 (25.8%) | 120 (23.8%) |
| 4 Vehicles | 59 (8.4%) | 55 (10.9%) |
| 5 or more Vehicles | 0 (0.0%) | 0 (0.0%) |
| Total | 699 (100.0%) | 504 (100.0%) |
Commute Time in McQueeney
The most frequently occuring commute durations in McQueeney are 20 to 24 minutes (329 commuters, 37.3%), 30 to 34 minutes (175 commuters, 19.9%), and 15 to 19 minutes (96 commuters, 10.9%).
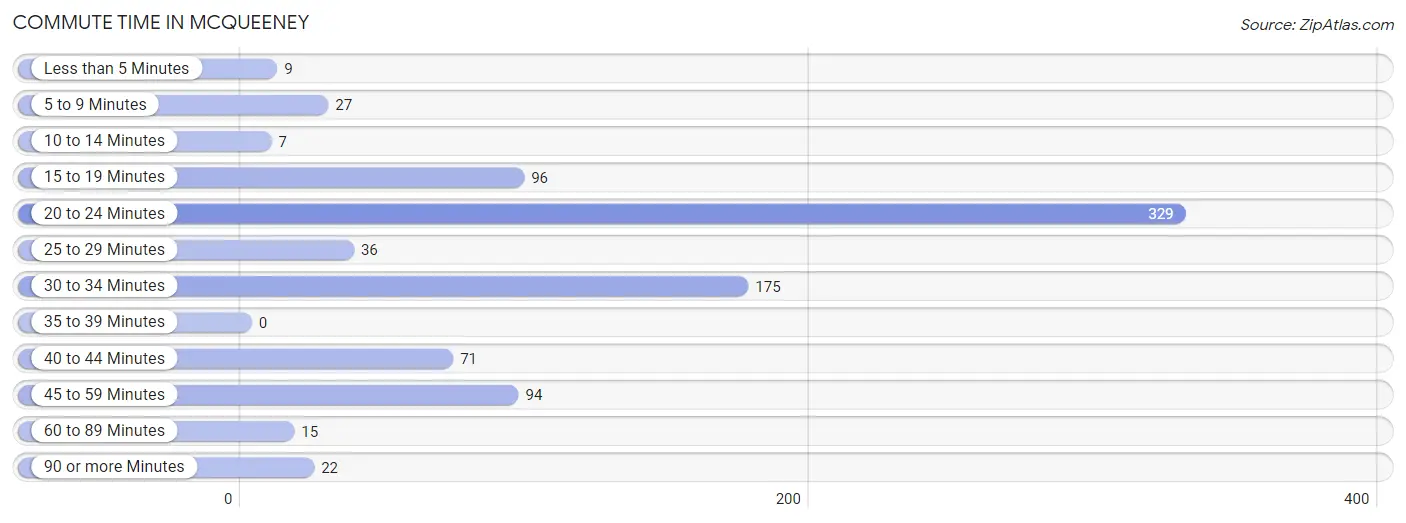
| Commute Time | # Commuters | % Commuters |
| Less than 5 Minutes | 9 | 1.0% |
| 5 to 9 Minutes | 27 | 3.1% |
| 10 to 14 Minutes | 7 | 0.8% |
| 15 to 19 Minutes | 96 | 10.9% |
| 20 to 24 Minutes | 329 | 37.3% |
| 25 to 29 Minutes | 36 | 4.1% |
| 30 to 34 Minutes | 175 | 19.9% |
| 35 to 39 Minutes | 0 | 0.0% |
| 40 to 44 Minutes | 71 | 8.1% |
| 45 to 59 Minutes | 94 | 10.7% |
| 60 to 89 Minutes | 15 | 1.7% |
| 90 or more Minutes | 22 | 2.5% |
Commute Time by Sex in McQueeney
The most common commute times in McQueeney are 20 to 24 minutes (214 commuters, 41.3%) for males and 20 to 24 minutes (115 commuters, 31.7%) for females.
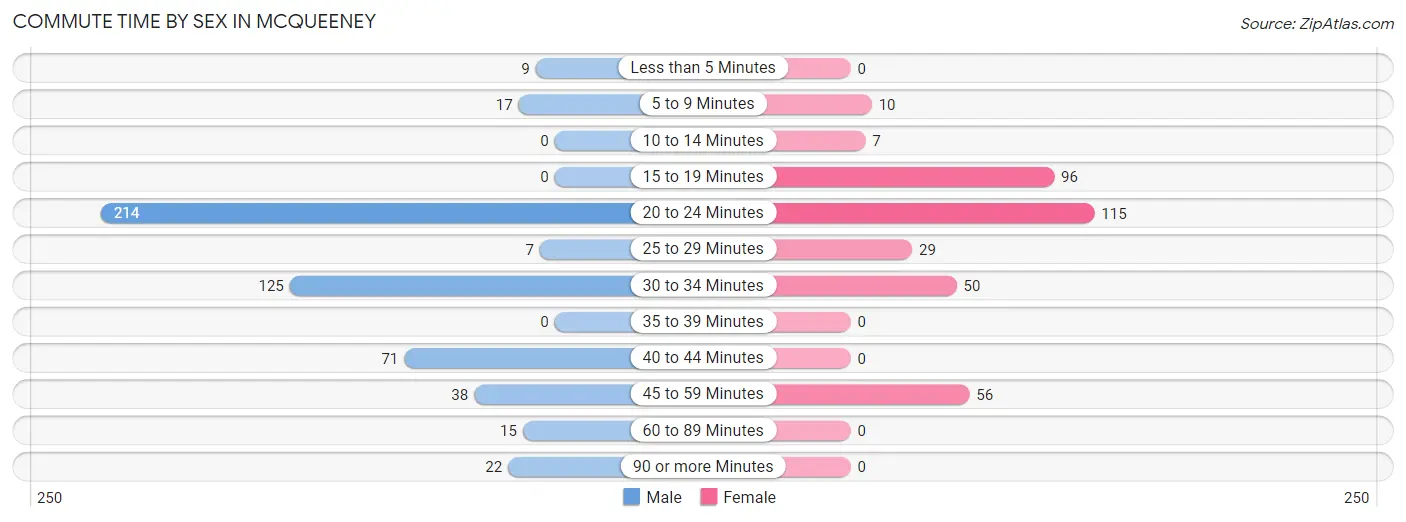
| Commute Time | Male | Female |
| Less than 5 Minutes | 9 (1.7%) | 0 (0.0%) |
| 5 to 9 Minutes | 17 (3.3%) | 10 (2.8%) |
| 10 to 14 Minutes | 0 (0.0%) | 7 (1.9%) |
| 15 to 19 Minutes | 0 (0.0%) | 96 (26.5%) |
| 20 to 24 Minutes | 214 (41.3%) | 115 (31.7%) |
| 25 to 29 Minutes | 7 (1.3%) | 29 (8.0%) |
| 30 to 34 Minutes | 125 (24.1%) | 50 (13.8%) |
| 35 to 39 Minutes | 0 (0.0%) | 0 (0.0%) |
| 40 to 44 Minutes | 71 (13.7%) | 0 (0.0%) |
| 45 to 59 Minutes | 38 (7.3%) | 56 (15.4%) |
| 60 to 89 Minutes | 15 (2.9%) | 0 (0.0%) |
| 90 or more Minutes | 22 (4.3%) | 0 (0.0%) |
Time of Departure to Work by Sex in McQueeney
The most frequent times of departure to work in McQueeney are 8:30 AM to 8:59 AM (94, 18.1%) for males and 8:00 AM to 8:29 AM (95, 26.2%) for females.
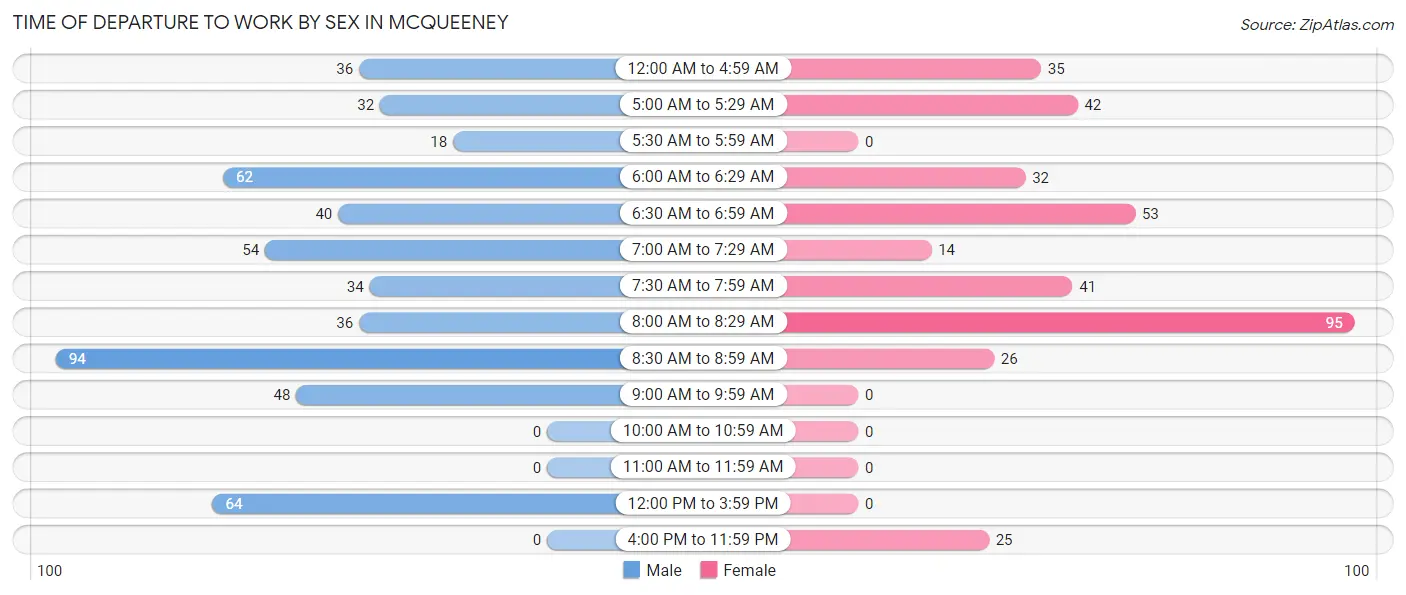
| Time of Departure | Male | Female |
| 12:00 AM to 4:59 AM | 36 (7.0%) | 35 (9.6%) |
| 5:00 AM to 5:29 AM | 32 (6.2%) | 42 (11.6%) |
| 5:30 AM to 5:59 AM | 18 (3.5%) | 0 (0.0%) |
| 6:00 AM to 6:29 AM | 62 (12.0%) | 32 (8.8%) |
| 6:30 AM to 6:59 AM | 40 (7.7%) | 53 (14.6%) |
| 7:00 AM to 7:29 AM | 54 (10.4%) | 14 (3.9%) |
| 7:30 AM to 7:59 AM | 34 (6.6%) | 41 (11.3%) |
| 8:00 AM to 8:29 AM | 36 (7.0%) | 95 (26.2%) |
| 8:30 AM to 8:59 AM | 94 (18.1%) | 26 (7.2%) |
| 9:00 AM to 9:59 AM | 48 (9.3%) | 0 (0.0%) |
| 10:00 AM to 10:59 AM | 0 (0.0%) | 0 (0.0%) |
| 11:00 AM to 11:59 AM | 0 (0.0%) | 0 (0.0%) |
| 12:00 PM to 3:59 PM | 64 (12.4%) | 0 (0.0%) |
| 4:00 PM to 11:59 PM | 0 (0.0%) | 25 (6.9%) |
| Total | 518 (100.0%) | 363 (100.0%) |
Housing Occupancy in McQueeney
Occupancy by Ownership in McQueeney
Of the total 954 dwellings in McQueeney, owner-occupied units account for 829 (86.9%), while renter-occupied units make up 125 (13.1%).
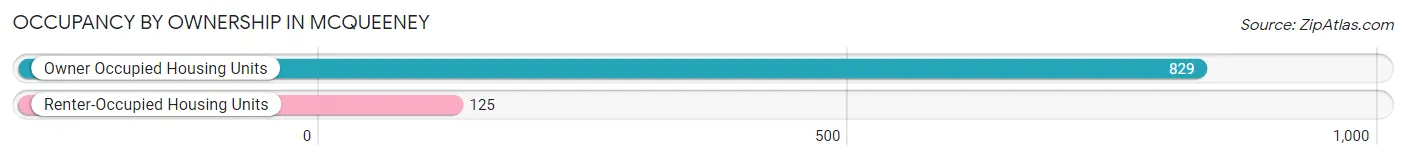
| Occupancy | # Housing Units | % Housing Units |
| Owner Occupied Housing Units | 829 | 86.9% |
| Renter-Occupied Housing Units | 125 | 13.1% |
| Total Occupied Housing Units | 954 | 100.0% |
Occupancy by Household Size in McQueeney
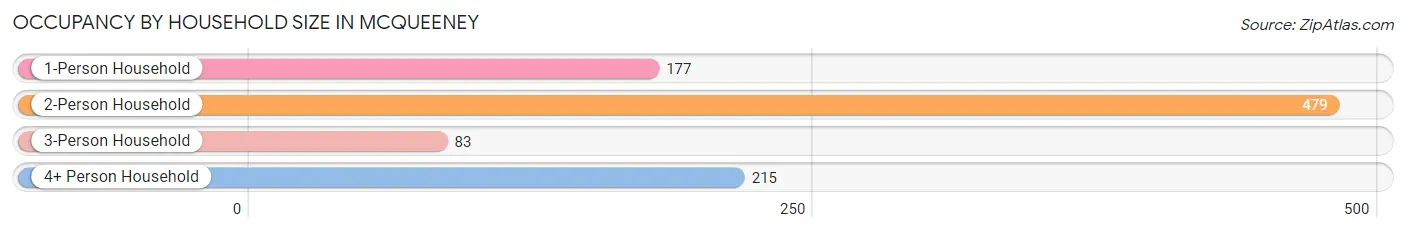
| Household Size | # Housing Units | % Housing Units |
| 1-Person Household | 177 | 18.5% |
| 2-Person Household | 479 | 50.2% |
| 3-Person Household | 83 | 8.7% |
| 4+ Person Household | 215 | 22.5% |
| Total Housing Units | 954 | 100.0% |
Occupancy by Ownership by Household Size in McQueeney
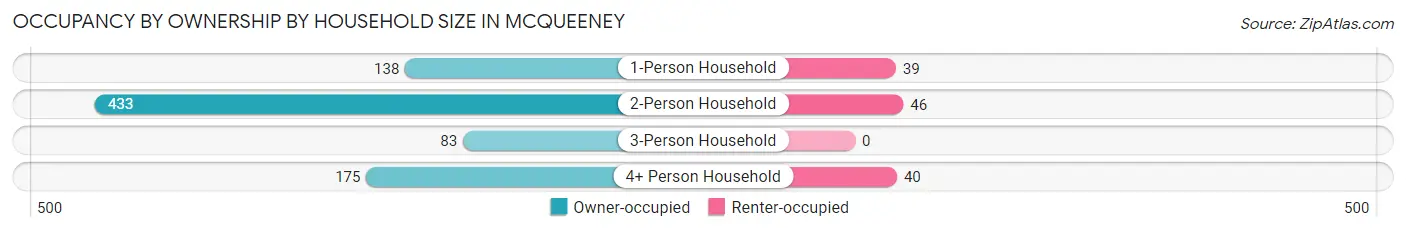
| Household Size | Owner-occupied | Renter-occupied |
| 1-Person Household | 138 (78.0%) | 39 (22.0%) |
| 2-Person Household | 433 (90.4%) | 46 (9.6%) |
| 3-Person Household | 83 (100.0%) | 0 (0.0%) |
| 4+ Person Household | 175 (81.4%) | 40 (18.6%) |
| Total Housing Units | 829 (86.9%) | 125 (13.1%) |
Occupancy by Educational Attainment in McQueeney
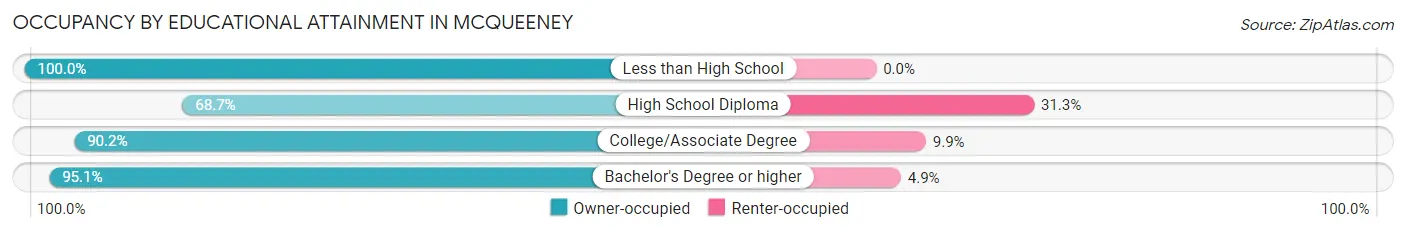
| Household Size | Owner-occupied | Renter-occupied |
| Less than High School | 66 (100.0%) | 0 (0.0%) |
| High School Diploma | 169 (68.7%) | 77 (31.3%) |
| College/Associate Degree | 302 (90.1%) | 33 (9.9%) |
| Bachelor's Degree or higher | 292 (95.1%) | 15 (4.9%) |
Occupancy by Age of Householder in McQueeney
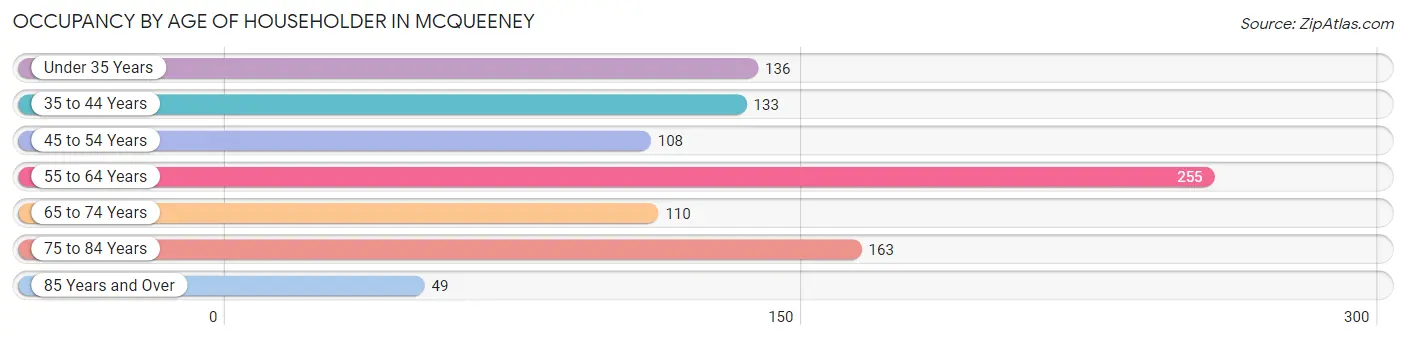
| Age Bracket | # Households | % Households |
| Under 35 Years | 136 | 14.3% |
| 35 to 44 Years | 133 | 13.9% |
| 45 to 54 Years | 108 | 11.3% |
| 55 to 64 Years | 255 | 26.7% |
| 65 to 74 Years | 110 | 11.5% |
| 75 to 84 Years | 163 | 17.1% |
| 85 Years and Over | 49 | 5.1% |
| Total | 954 | 100.0% |
Housing Finances in McQueeney
Median Income by Occupancy in McQueeney
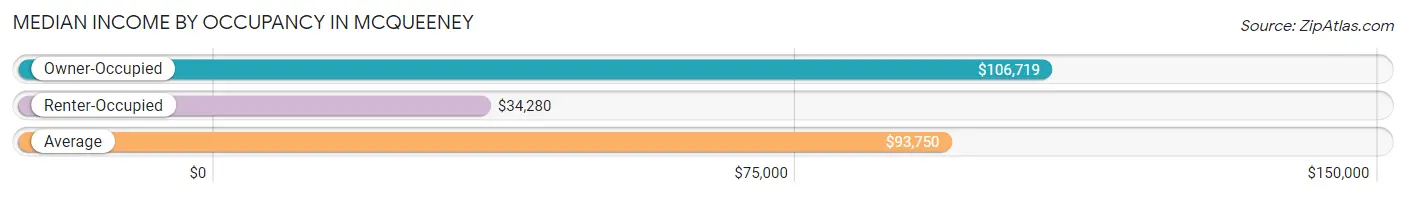
| Occupancy Type | # Households | Median Income |
| Owner-Occupied | 829 (86.9%) | $106,719 |
| Renter-Occupied | 125 (13.1%) | $34,280 |
| Average | 954 (100.0%) | $93,750 |
Occupancy by Householder Income Bracket in McQueeney
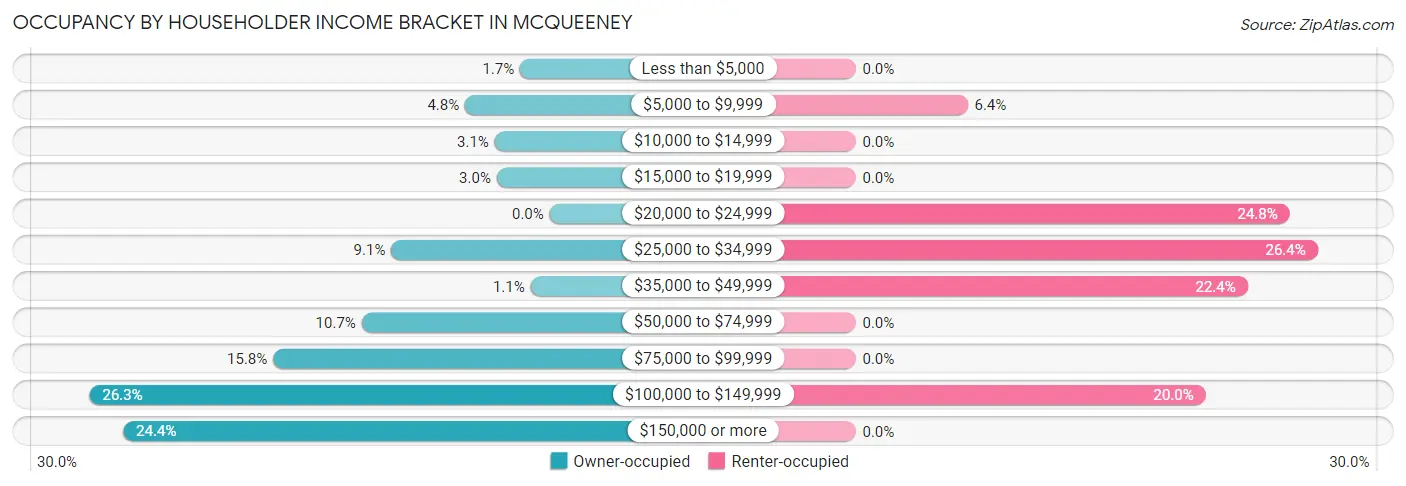
| Income Bracket | Owner-occupied | Renter-occupied |
| Less than $5,000 | 14 (1.7%) | 0 (0.0%) |
| $5,000 to $9,999 | 40 (4.8%) | 8 (6.4%) |
| $10,000 to $14,999 | 26 (3.1%) | 0 (0.0%) |
| $15,000 to $19,999 | 25 (3.0%) | 0 (0.0%) |
| $20,000 to $24,999 | 0 (0.0%) | 31 (24.8%) |
| $25,000 to $34,999 | 75 (9.0%) | 33 (26.4%) |
| $35,000 to $49,999 | 9 (1.1%) | 28 (22.4%) |
| $50,000 to $74,999 | 89 (10.7%) | 0 (0.0%) |
| $75,000 to $99,999 | 131 (15.8%) | 0 (0.0%) |
| $100,000 to $149,999 | 218 (26.3%) | 25 (20.0%) |
| $150,000 or more | 202 (24.4%) | 0 (0.0%) |
| Total | 829 (100.0%) | 125 (100.0%) |
Monthly Housing Cost Tiers in McQueeney
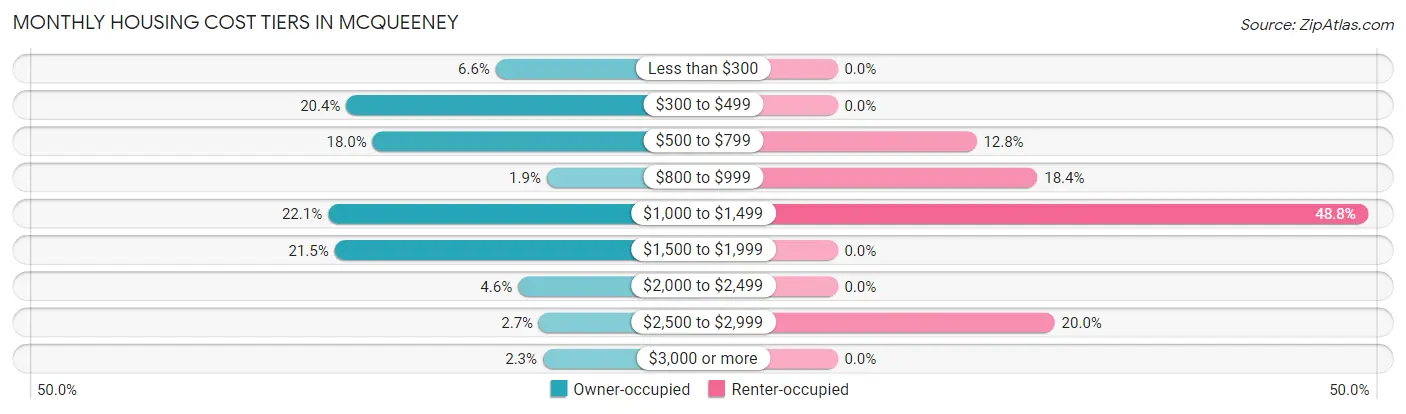
| Monthly Cost | Owner-occupied | Renter-occupied |
| Less than $300 | 55 (6.6%) | 0 (0.0%) |
| $300 to $499 | 169 (20.4%) | 0 (0.0%) |
| $500 to $799 | 149 (18.0%) | 16 (12.8%) |
| $800 to $999 | 16 (1.9%) | 23 (18.4%) |
| $1,000 to $1,499 | 183 (22.1%) | 61 (48.8%) |
| $1,500 to $1,999 | 178 (21.5%) | 0 (0.0%) |
| $2,000 to $2,499 | 38 (4.6%) | 0 (0.0%) |
| $2,500 to $2,999 | 22 (2.6%) | 25 (20.0%) |
| $3,000 or more | 19 (2.3%) | 0 (0.0%) |
| Total | 829 (100.0%) | 125 (100.0%) |
Physical Housing Characteristics in McQueeney
Housing Structures in McQueeney
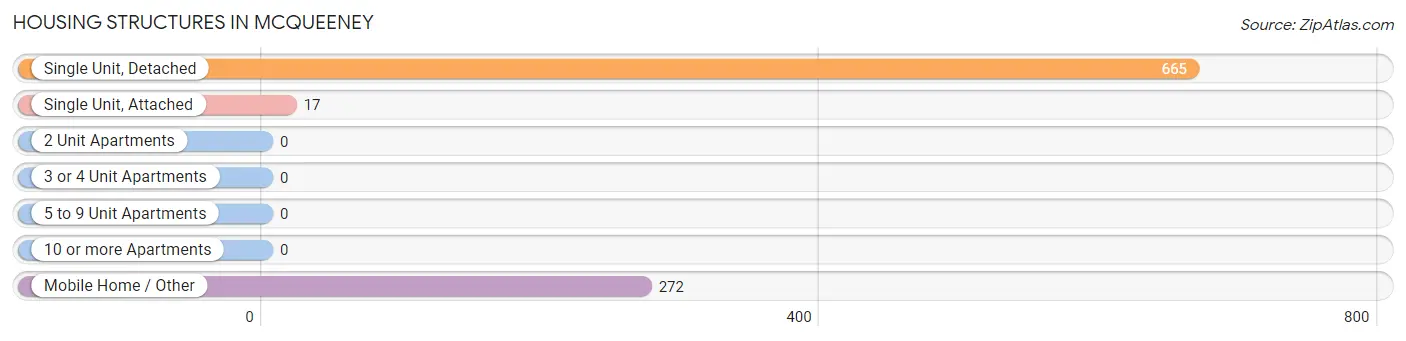
| Structure Type | # Housing Units | % Housing Units |
| Single Unit, Detached | 665 | 69.7% |
| Single Unit, Attached | 17 | 1.8% |
| 2 Unit Apartments | 0 | 0.0% |
| 3 or 4 Unit Apartments | 0 | 0.0% |
| 5 to 9 Unit Apartments | 0 | 0.0% |
| 10 or more Apartments | 0 | 0.0% |
| Mobile Home / Other | 272 | 28.5% |
| Total | 954 | 100.0% |
Housing Structures by Occupancy in McQueeney
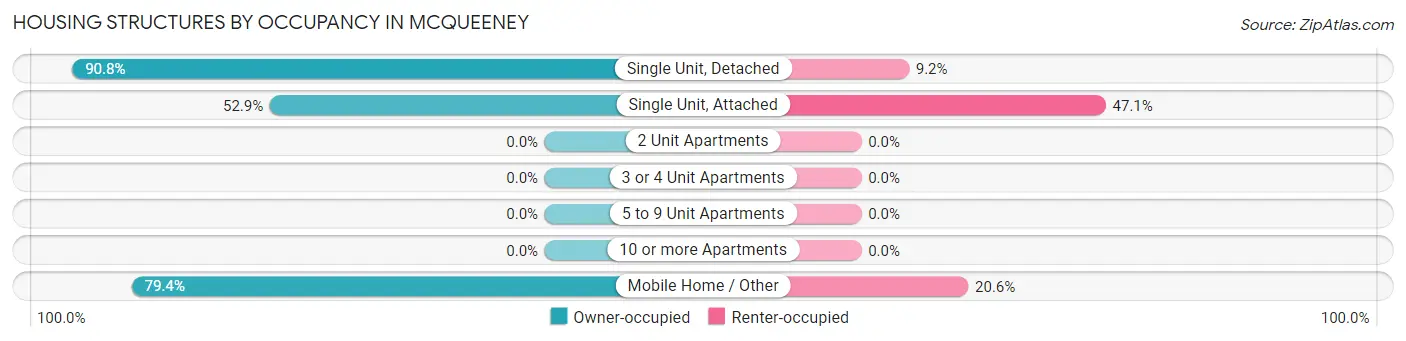
| Structure Type | Owner-occupied | Renter-occupied |
| Single Unit, Detached | 604 (90.8%) | 61 (9.2%) |
| Single Unit, Attached | 9 (52.9%) | 8 (47.1%) |
| 2 Unit Apartments | 0 (0.0%) | 0 (0.0%) |
| 3 or 4 Unit Apartments | 0 (0.0%) | 0 (0.0%) |
| 5 to 9 Unit Apartments | 0 (0.0%) | 0 (0.0%) |
| 10 or more Apartments | 0 (0.0%) | 0 (0.0%) |
| Mobile Home / Other | 216 (79.4%) | 56 (20.6%) |
| Total | 829 (86.9%) | 125 (13.1%) |
Housing Structures by Number of Rooms in McQueeney
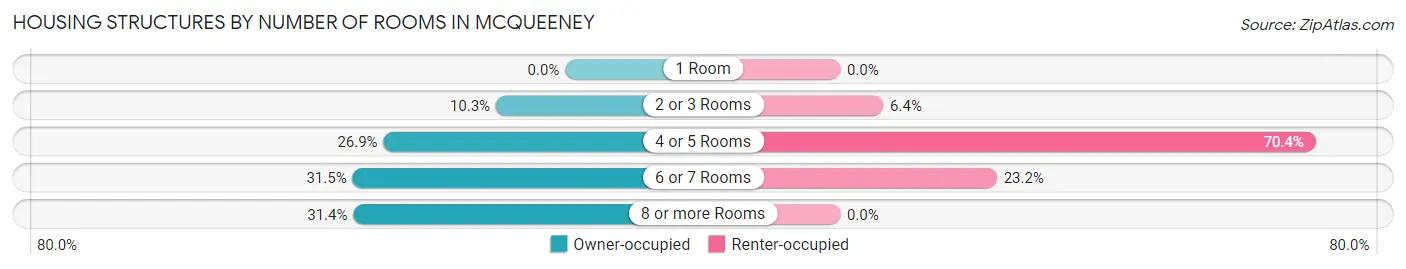
| Number of Rooms | Owner-occupied | Renter-occupied |
| 1 Room | 0 (0.0%) | 0 (0.0%) |
| 2 or 3 Rooms | 85 (10.2%) | 8 (6.4%) |
| 4 or 5 Rooms | 223 (26.9%) | 88 (70.4%) |
| 6 or 7 Rooms | 261 (31.5%) | 29 (23.2%) |
| 8 or more Rooms | 260 (31.4%) | 0 (0.0%) |
| Total | 829 (100.0%) | 125 (100.0%) |
Housing Structure by Heating Type in McQueeney
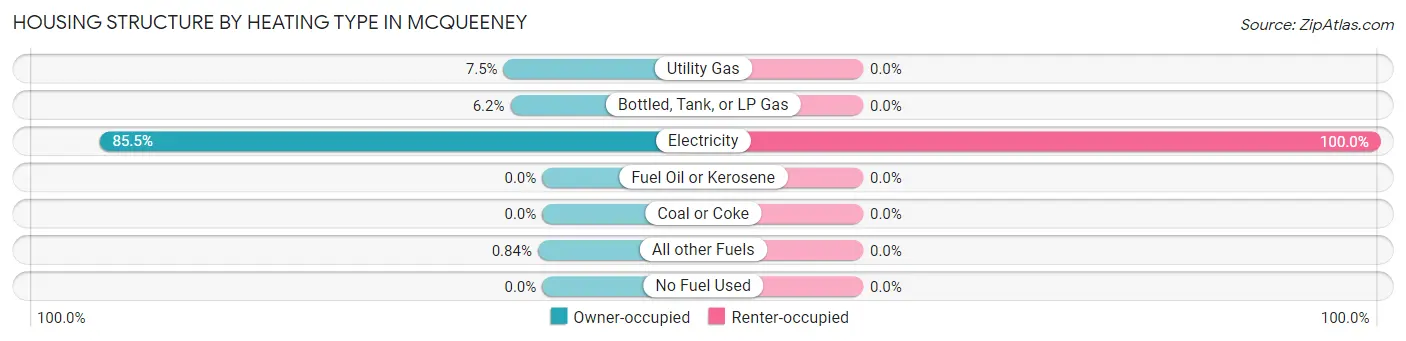
| Heating Type | Owner-occupied | Renter-occupied |
| Utility Gas | 62 (7.5%) | 0 (0.0%) |
| Bottled, Tank, or LP Gas | 51 (6.1%) | 0 (0.0%) |
| Electricity | 709 (85.5%) | 125 (100.0%) |
| Fuel Oil or Kerosene | 0 (0.0%) | 0 (0.0%) |
| Coal or Coke | 0 (0.0%) | 0 (0.0%) |
| All other Fuels | 7 (0.8%) | 0 (0.0%) |
| No Fuel Used | 0 (0.0%) | 0 (0.0%) |
| Total | 829 (100.0%) | 125 (100.0%) |
Household Vehicle Usage in McQueeney
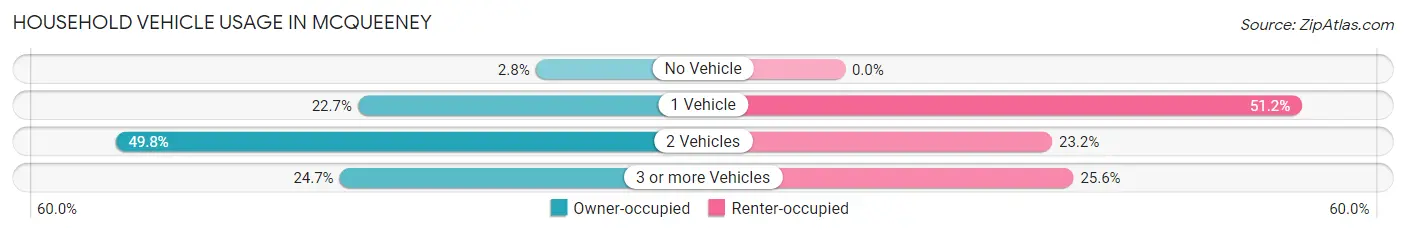
| Vehicles per Household | Owner-occupied | Renter-occupied |
| No Vehicle | 23 (2.8%) | 0 (0.0%) |
| 1 Vehicle | 188 (22.7%) | 64 (51.2%) |
| 2 Vehicles | 413 (49.8%) | 29 (23.2%) |
| 3 or more Vehicles | 205 (24.7%) | 32 (25.6%) |
| Total | 829 (100.0%) | 125 (100.0%) |
Real Estate & Mortgages in McQueeney
Real Estate and Mortgage Overview in McQueeney
| Characteristic | Without Mortgage | With Mortgage |
| Housing Units | 599 | 230 |
| Median Property Value | - | - |
| Median Household Income | $113,906 | $50 |
| Monthly Housing Costs | $644 | $19 |
| Real Estate Taxes | - | - |
Property Value by Mortgage Status in McQueeney
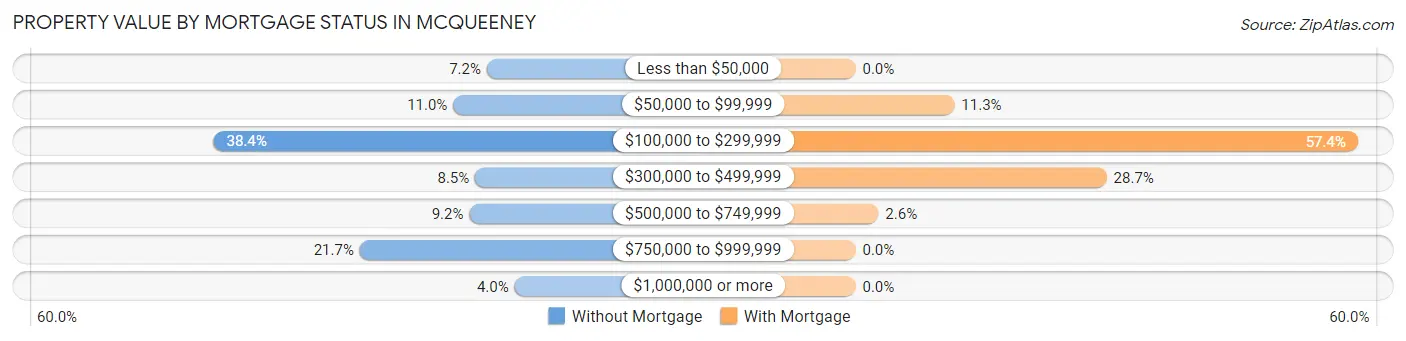
| Property Value | Without Mortgage | With Mortgage |
| Less than $50,000 | 43 (7.2%) | 0 (0.0%) |
| $50,000 to $99,999 | 66 (11.0%) | 26 (11.3%) |
| $100,000 to $299,999 | 230 (38.4%) | 132 (57.4%) |
| $300,000 to $499,999 | 51 (8.5%) | 66 (28.7%) |
| $500,000 to $749,999 | 55 (9.2%) | 6 (2.6%) |
| $750,000 to $999,999 | 130 (21.7%) | 0 (0.0%) |
| $1,000,000 or more | 24 (4.0%) | 0 (0.0%) |
| Total | 599 (100.0%) | 230 (100.0%) |
Household Income by Mortgage Status in McQueeney
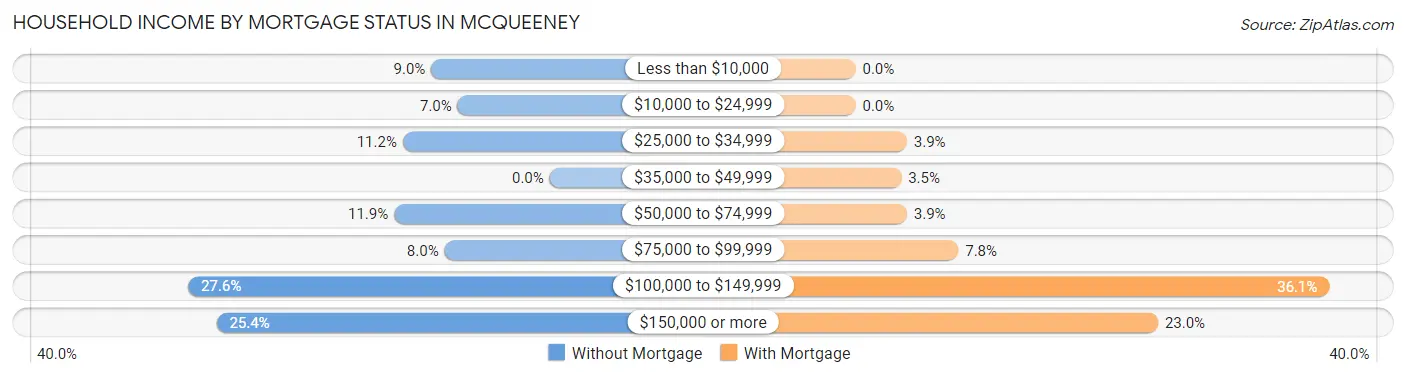
| Household Income | Without Mortgage | With Mortgage |
| Less than $10,000 | 54 (9.0%) | 0 (0.0%) |
| $10,000 to $24,999 | 42 (7.0%) | 0 (0.0%) |
| $25,000 to $34,999 | 67 (11.2%) | 9 (3.9%) |
| $35,000 to $49,999 | 0 (0.0%) | 8 (3.5%) |
| $50,000 to $74,999 | 71 (11.8%) | 9 (3.9%) |
| $75,000 to $99,999 | 48 (8.0%) | 18 (7.8%) |
| $100,000 to $149,999 | 165 (27.6%) | 83 (36.1%) |
| $150,000 or more | 152 (25.4%) | 53 (23.0%) |
| Total | 599 (100.0%) | 230 (100.0%) |
Property Value to Household Income Ratio in McQueeney
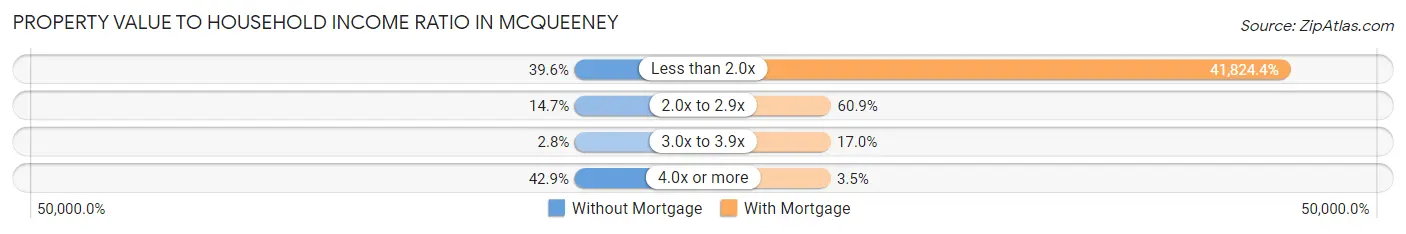
| Value-to-Income Ratio | Without Mortgage | With Mortgage |
| Less than 2.0x | 237 (39.6%) | 96,196 (41,824.3%) |
| 2.0x to 2.9x | 88 (14.7%) | 140 (60.9%) |
| 3.0x to 3.9x | 17 (2.8%) | 39 (17.0%) |
| 4.0x or more | 257 (42.9%) | 8 (3.5%) |
| Total | 599 (100.0%) | 230 (100.0%) |
Real Estate Taxes by Mortgage Status in McQueeney
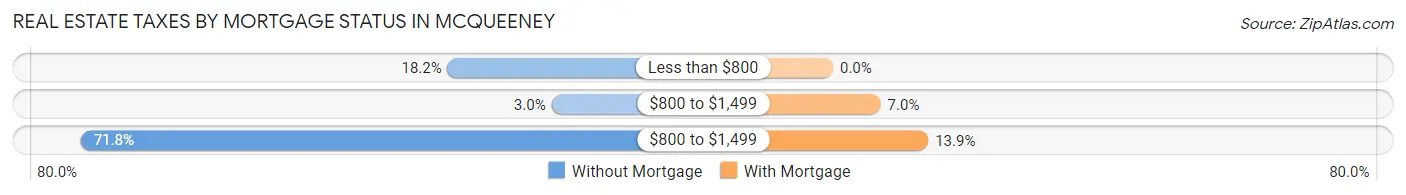
| Property Taxes | Without Mortgage | With Mortgage |
| Less than $800 | 109 (18.2%) | 0 (0.0%) |
| $800 to $1,499 | 18 (3.0%) | 16 (7.0%) |
| $800 to $1,499 | 430 (71.8%) | 32 (13.9%) |
| Total | 599 (100.0%) | 230 (100.0%) |
Health & Disability in McQueeney
Health Insurance Coverage by Age in McQueeney
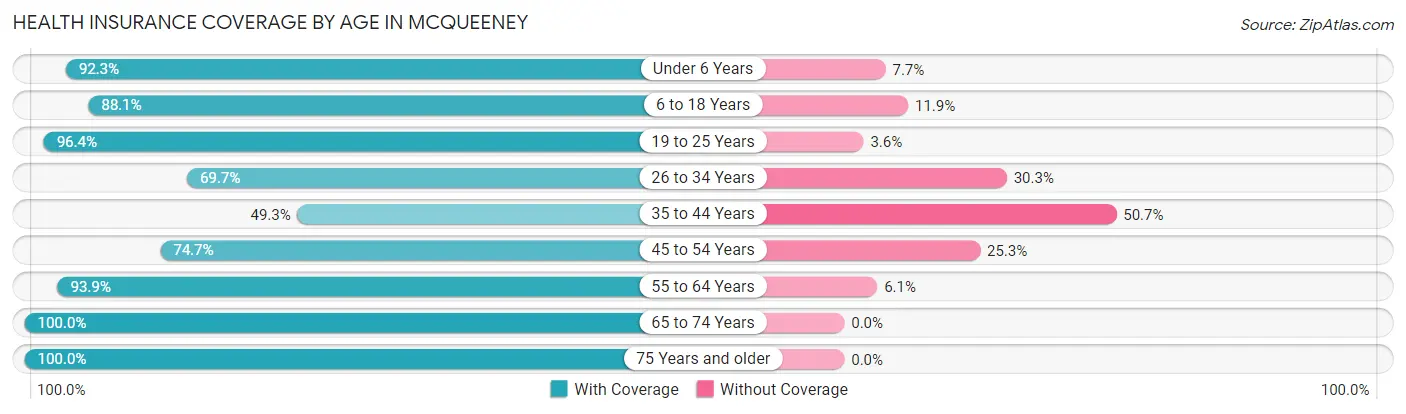
| Age Bracket | With Coverage | Without Coverage |
| Under 6 Years | 144 (92.3%) | 12 (7.7%) |
| 6 to 18 Years | 363 (88.1%) | 49 (11.9%) |
| 19 to 25 Years | 27 (96.4%) | 1 (3.6%) |
| 26 to 34 Years | 145 (69.7%) | 63 (30.3%) |
| 35 to 44 Years | 170 (49.3%) | 175 (50.7%) |
| 45 to 54 Years | 180 (74.7%) | 61 (25.3%) |
| 55 to 64 Years | 443 (93.9%) | 29 (6.1%) |
| 65 to 74 Years | 248 (100.0%) | 0 (0.0%) |
| 75 Years and older | 261 (100.0%) | 0 (0.0%) |
| Total | 1,981 (83.6%) | 390 (16.5%) |
Health Insurance Coverage by Citizenship Status in McQueeney
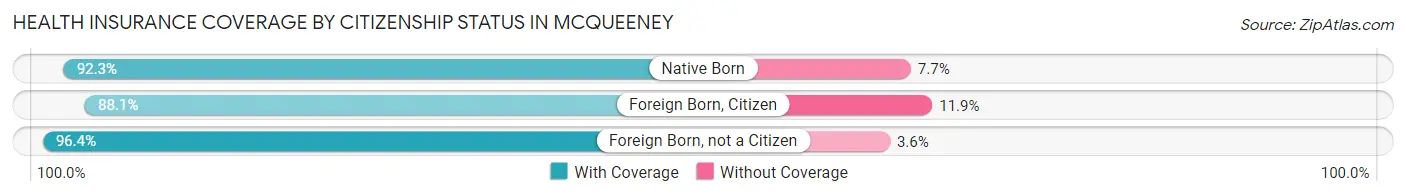
| Citizenship Status | With Coverage | Without Coverage |
| Native Born | 144 (92.3%) | 12 (7.7%) |
| Foreign Born, Citizen | 363 (88.1%) | 49 (11.9%) |
| Foreign Born, not a Citizen | 27 (96.4%) | 1 (3.6%) |
Health Insurance Coverage by Household Income in McQueeney
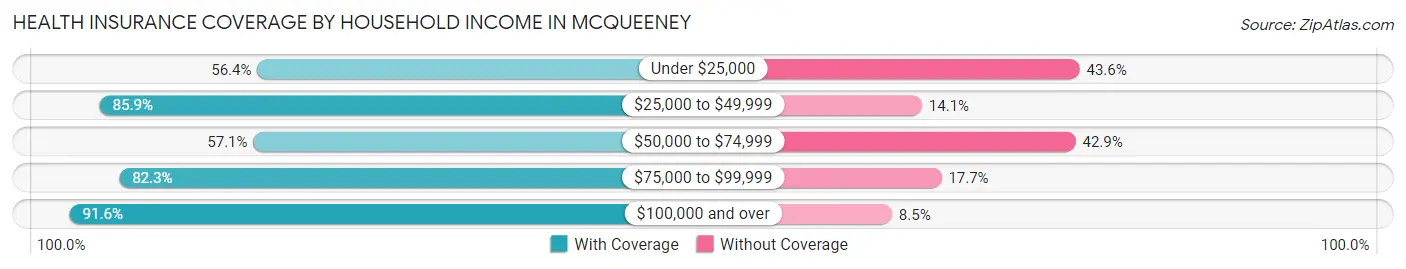
| Household Income | With Coverage | Without Coverage |
| Under $25,000 | 119 (56.4%) | 92 (43.6%) |
| $25,000 to $49,999 | 281 (85.9%) | 46 (14.1%) |
| $50,000 to $74,999 | 100 (57.1%) | 75 (42.9%) |
| $75,000 to $99,999 | 297 (82.3%) | 64 (17.7%) |
| $100,000 and over | 1,181 (91.5%) | 109 (8.5%) |
Public vs Private Health Insurance Coverage by Age in McQueeney
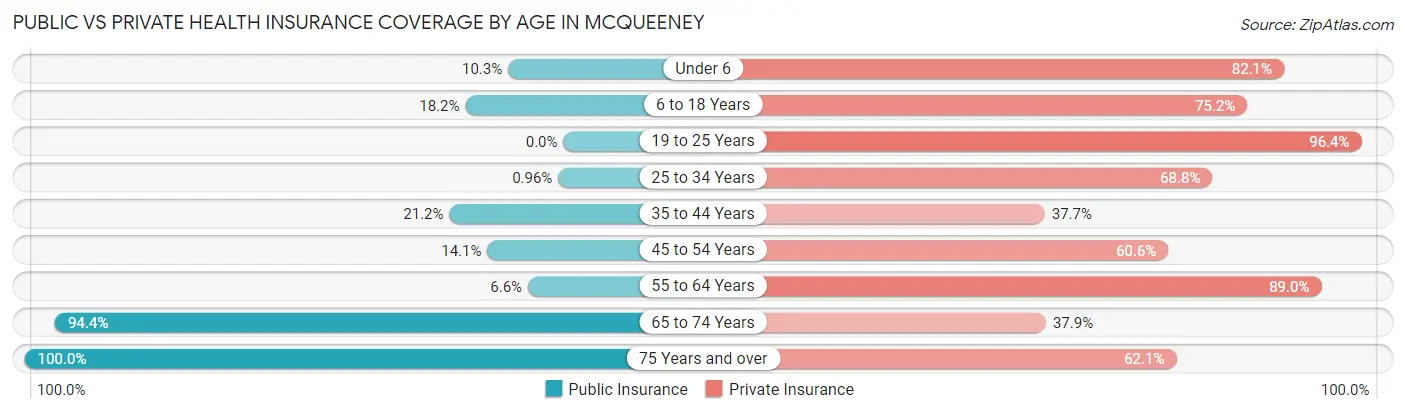
| Age Bracket | Public Insurance | Private Insurance |
| Under 6 | 16 (10.3%) | 128 (82.1%) |
| 6 to 18 Years | 75 (18.2%) | 310 (75.2%) |
| 19 to 25 Years | 0 (0.0%) | 27 (96.4%) |
| 25 to 34 Years | 2 (1.0%) | 143 (68.8%) |
| 35 to 44 Years | 73 (21.2%) | 130 (37.7%) |
| 45 to 54 Years | 34 (14.1%) | 146 (60.6%) |
| 55 to 64 Years | 31 (6.6%) | 420 (89.0%) |
| 65 to 74 Years | 234 (94.4%) | 94 (37.9%) |
| 75 Years and over | 261 (100.0%) | 162 (62.1%) |
| Total | 726 (30.6%) | 1,560 (65.8%) |
Disability Status by Sex by Age in McQueeney
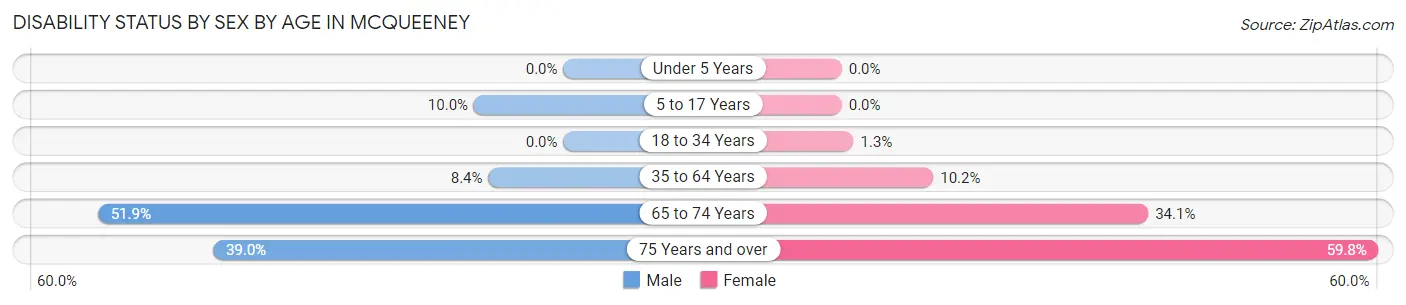
| Age Bracket | Male | Female |
| Under 5 Years | 0 (0.0%) | 0 (0.0%) |
| 5 to 17 Years | 25 (10.0%) | 0 (0.0%) |
| 18 to 34 Years | 0 (0.0%) | 2 (1.3%) |
| 35 to 64 Years | 49 (8.4%) | 48 (10.2%) |
| 65 to 74 Years | 42 (51.8%) | 57 (34.1%) |
| 75 Years and over | 64 (39.0%) | 58 (59.8%) |
Disability Class by Sex by Age in McQueeney
Disability Class: Hearing Difficulty
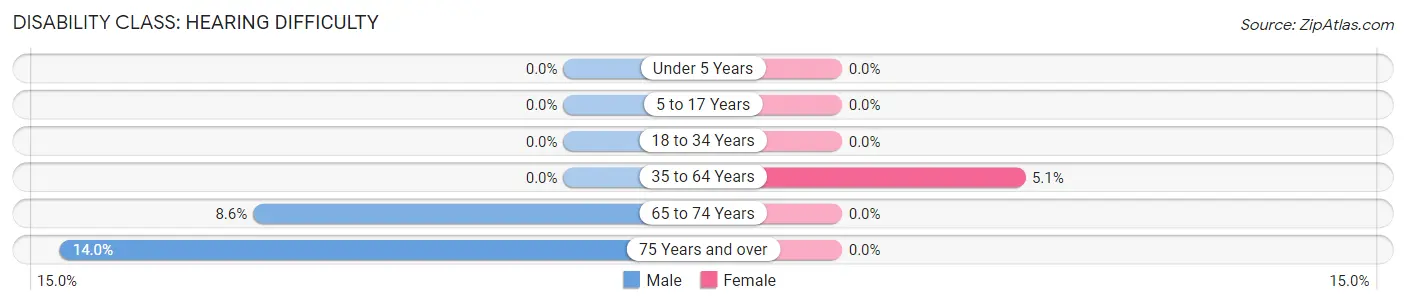
| Age Bracket | Male | Female |
| Under 5 Years | 0 (0.0%) | 0 (0.0%) |
| 5 to 17 Years | 0 (0.0%) | 0 (0.0%) |
| 18 to 34 Years | 0 (0.0%) | 0 (0.0%) |
| 35 to 64 Years | 0 (0.0%) | 24 (5.1%) |
| 65 to 74 Years | 7 (8.6%) | 0 (0.0%) |
| 75 Years and over | 23 (14.0%) | 0 (0.0%) |
Disability Class: Vision Difficulty
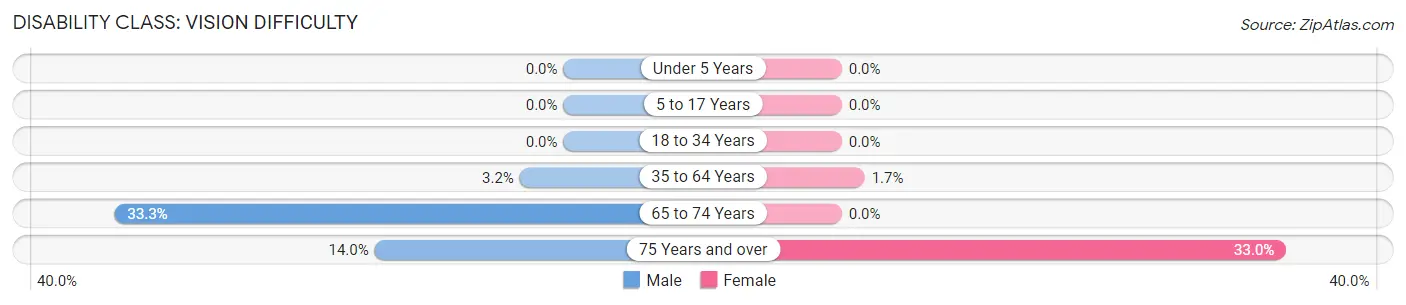
| Age Bracket | Male | Female |
| Under 5 Years | 0 (0.0%) | 0 (0.0%) |
| 5 to 17 Years | 0 (0.0%) | 0 (0.0%) |
| 18 to 34 Years | 0 (0.0%) | 0 (0.0%) |
| 35 to 64 Years | 19 (3.2%) | 8 (1.7%) |
| 65 to 74 Years | 27 (33.3%) | 0 (0.0%) |
| 75 Years and over | 23 (14.0%) | 32 (33.0%) |
Disability Class: Cognitive Difficulty
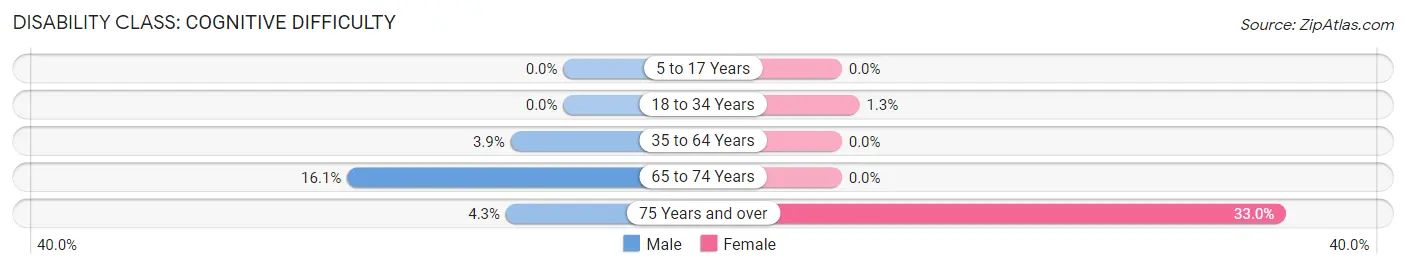
| Age Bracket | Male | Female |
| 5 to 17 Years | 0 (0.0%) | 0 (0.0%) |
| 18 to 34 Years | 0 (0.0%) | 2 (1.3%) |
| 35 to 64 Years | 23 (3.9%) | 0 (0.0%) |
| 65 to 74 Years | 13 (16.1%) | 0 (0.0%) |
| 75 Years and over | 7 (4.3%) | 32 (33.0%) |
Disability Class: Ambulatory Difficulty
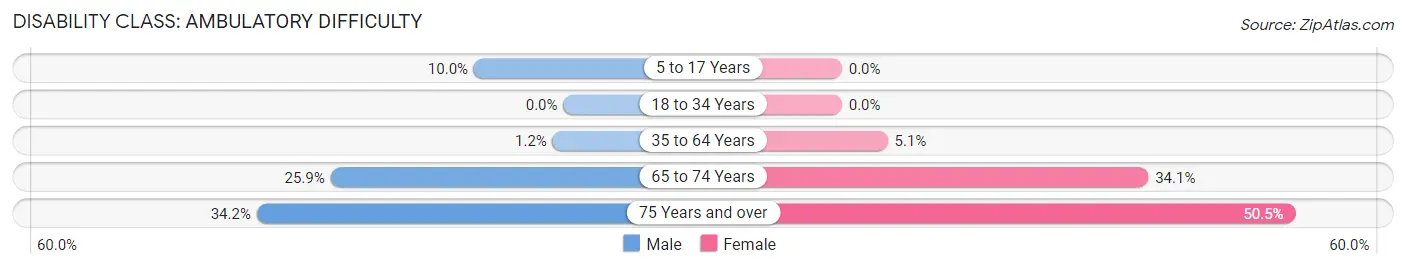
| Age Bracket | Male | Female |
| 5 to 17 Years | 25 (10.0%) | 0 (0.0%) |
| 18 to 34 Years | 0 (0.0%) | 0 (0.0%) |
| 35 to 64 Years | 7 (1.2%) | 24 (5.1%) |
| 65 to 74 Years | 21 (25.9%) | 57 (34.1%) |
| 75 Years and over | 56 (34.2%) | 49 (50.5%) |
Disability Class: Self-Care Difficulty
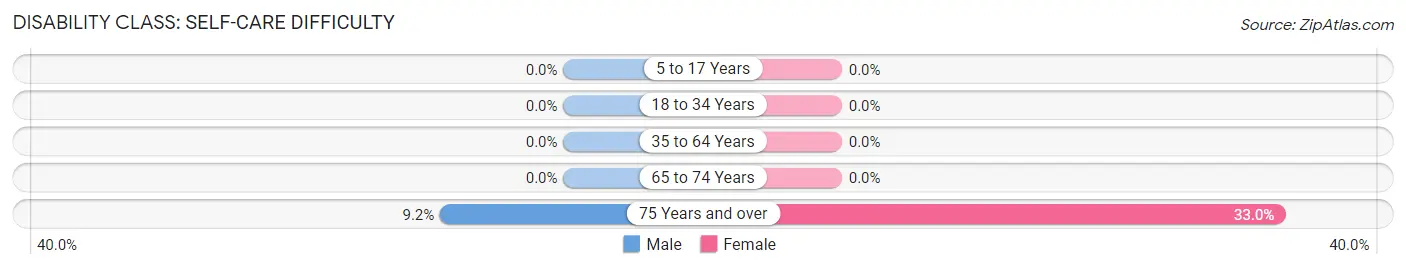
| Age Bracket | Male | Female |
| 5 to 17 Years | 0 (0.0%) | 0 (0.0%) |
| 18 to 34 Years | 0 (0.0%) | 0 (0.0%) |
| 35 to 64 Years | 0 (0.0%) | 0 (0.0%) |
| 65 to 74 Years | 0 (0.0%) | 0 (0.0%) |
| 75 Years and over | 15 (9.1%) | 32 (33.0%) |
Technology Access in McQueeney
Computing Device Access in McQueeney
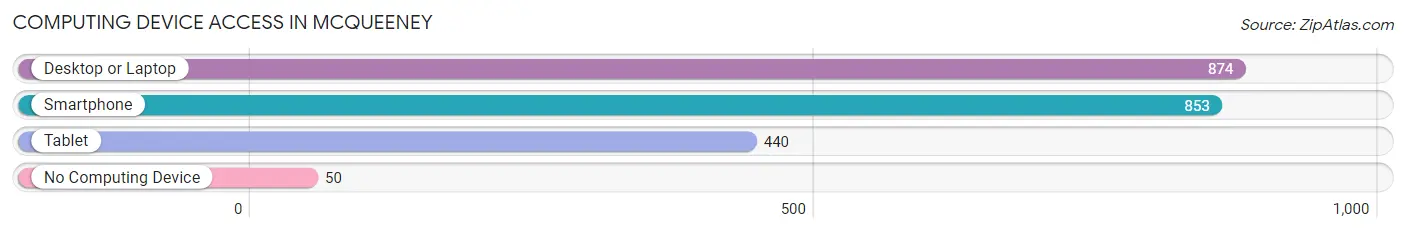
| Device Type | # Households | % Households |
| Desktop or Laptop | 874 | 91.6% |
| Smartphone | 853 | 89.4% |
| Tablet | 440 | 46.1% |
| No Computing Device | 50 | 5.2% |
| Total | 954 | 100.0% |
Internet Access in McQueeney
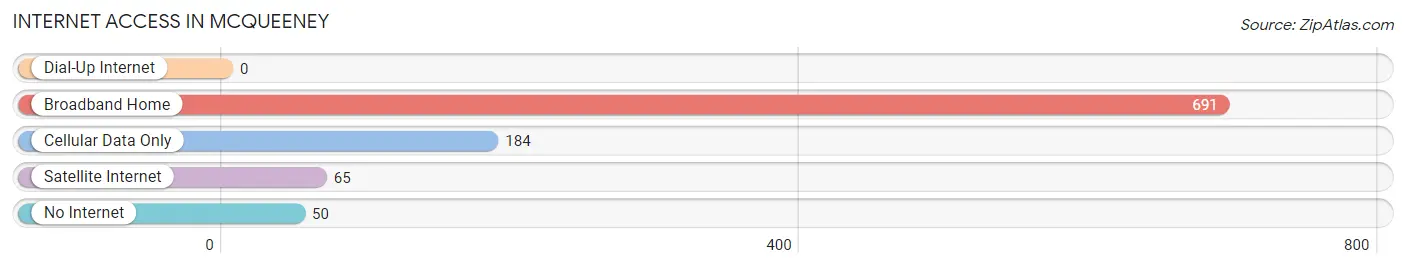
| Internet Type | # Households | % Households |
| Dial-Up Internet | 0 | 0.0% |
| Broadband Home | 691 | 72.4% |
| Cellular Data Only | 184 | 19.3% |
| Satellite Internet | 65 | 6.8% |
| No Internet | 50 | 5.2% |
| Total | 954 | 100.0% |
McQueeney Summary
McQueeney, Texas is a small unincorporated community located in Guadalupe County, Texas. It is situated on the banks of the Guadalupe River, approximately 20 miles east of San Antonio. The population of McQueeney was estimated to be 1,845 in 2019.
History
McQueeney was founded in 1845 by German immigrants who had settled in the area. The town was named after John McQueeney, a local landowner who had donated the land for the town. The town was originally known as “McQueeney’s Settlement” and was later shortened to McQueeney.
In the late 1800s, the town was a thriving agricultural center, with cotton, corn, and other crops being grown in the area. The town also had a number of businesses, including a general store, a blacksmith shop, and a hotel.
In the early 1900s, the town began to decline as the railroad bypassed it and the population began to move away. The town was nearly abandoned by the 1950s, but in the 1970s, the population began to grow again as people moved back to the area.
Geography
McQueeney is located in Guadalupe County, Texas, approximately 20 miles east of San Antonio. The town is situated on the banks of the Guadalupe River, and is surrounded by rolling hills and farmland. The climate in McQueeney is generally mild, with temperatures ranging from the mid-50s in the winter to the mid-90s in the summer.
Economy
The economy of McQueeney is largely based on agriculture and tourism. The town is home to several farms, which produce a variety of crops, including cotton, corn, and hay. The town also has a number of businesses, including restaurants, convenience stores, and a gas station.
In recent years, the town has become a popular tourist destination, with visitors coming to enjoy the area’s natural beauty and outdoor activities. The town is also home to several festivals and events throughout the year, including the McQueeney Music Festival and the McQueeney Rodeo.
Demographics
As of 2019, the population of McQueeney was estimated to be 1,845. The town is predominantly white, with approximately 85% of the population identifying as such. The remaining population is made up of African Americans, Hispanics, and other ethnicities. The median household income in McQueeney is $50,000, and the median home value is $150,000.
Conclusion
McQueeney, Texas is a small unincorporated community located in Guadalupe County, Texas. It is situated on the banks of the Guadalupe River, approximately 20 miles east of San Antonio. The town was founded in 1845 by German immigrants and was once a thriving agricultural center. In recent years, the town has become a popular tourist destination, with visitors coming to enjoy the area’s natural beauty and outdoor activities. The population of McQueeney was estimated to be 1,845 in 2019, and the town is predominantly white. The economy of McQueeney is largely based on agriculture and tourism, and the median household income is $50,000.
Common Questions
What is Per Capita Income in McQueeney?
Per Capita income in McQueeney is $43,930.
What is the Median Family Income in McQueeney?
Median Family Income in McQueeney is $91,795.
What is the Median Household income in McQueeney?
Median Household Income in McQueeney is $93,750.
What is Income or Wage Gap in McQueeney?
Income or Wage Gap in McQueeney is 34.8%.
Women in McQueeney earn 65.2 cents for every dollar earned by a man.
What is Inequality or Gini Index in McQueeney?
Inequality or Gini Index in McQueeney is 0.42.
What is the Total Population of McQueeney?
Total Population of McQueeney is 2,371.
What is the Total Male Population of McQueeney?
Total Male Population of McQueeney is 1,252.
What is the Total Female Population of McQueeney?
Total Female Population of McQueeney is 1,119.
What is the Ratio of Males per 100 Females in McQueeney?
There are 111.89 Males per 100 Females in McQueeney.
What is the Ratio of Females per 100 Males in McQueeney?
There are 89.38 Females per 100 Males in McQueeney.
What is the Median Population Age in McQueeney?
Median Population Age in McQueeney is 46.4 Years.
What is the Average Family Size in McQueeney
Average Family Size in McQueeney is 2.7 People.
What is the Average Household Size in McQueeney
Average Household Size in McQueeney is 2.5 People.
How Large is the Labor Force in McQueeney?
There are 1,288 People in the Labor Forcein in McQueeney.
What is the Percentage of People in the Labor Force in McQueeney?
68.8% of People are in the Labor Force in McQueeney.
What is the Unemployment Rate in McQueeney?
Unemployment Rate in McQueeney is 4.7%.