Zip Codes with the Highest Percentage of Population Employed in Architecture & Engineering in Lufkin, TX
RELATED REPORTS & OPTIONS
Architecture & Engineering
Lufkin
Compare Zip Codes
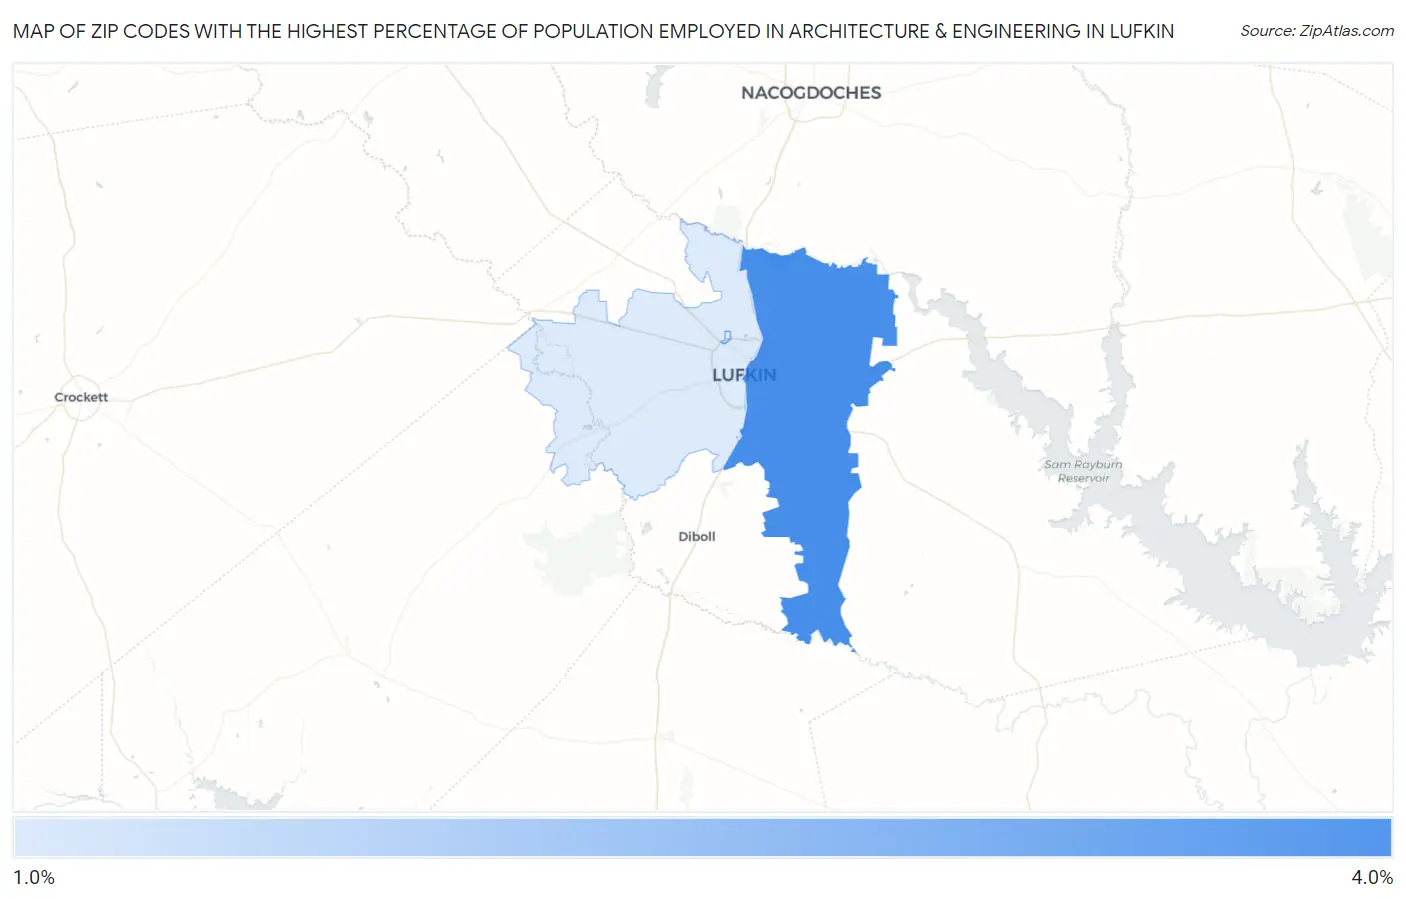
Map of Zip Codes with the Highest Percentage of Population Employed in Architecture & Engineering in Lufkin
1.9%
3.0%
Zip Codes with the Highest Percentage of Population Employed in Architecture & Engineering in Lufkin, TX
| Zip Code | % Employed | vs State | vs National | |
| 1. | 75901 | 3.0% | 2.2%(+0.792)#294 | 2.1%(+0.865)#5,012 |
| 2. | 75904 | 1.9% | 2.2%(-0.294)#549 | 2.1%(-0.221)#10,052 |
1
Common Questions
What are the Top Zip Codes with the Highest Percentage of Population Employed in Architecture & Engineering in Lufkin, TX?
Top Zip Codes with the Highest Percentage of Population Employed in Architecture & Engineering in Lufkin, TX are:
What zip code has the Highest Percentage of Population Employed in Architecture & Engineering in Lufkin, TX?
75901 has the Highest Percentage of Population Employed in Architecture & Engineering in Lufkin, TX with 3.0%.
What is the Percentage of Population Employed in Architecture & Engineering in Lufkin, TX?
Percentage of Population Employed in Architecture & Engineering in Lufkin is 2.7%.
What is the Percentage of Population Employed in Architecture & Engineering in Texas?
Percentage of Population Employed in Architecture & Engineering in Texas is 2.2%.
What is the Percentage of Population Employed in Architecture & Engineering in the United States?
Percentage of Population Employed in Architecture & Engineering in the United States is 2.1%.