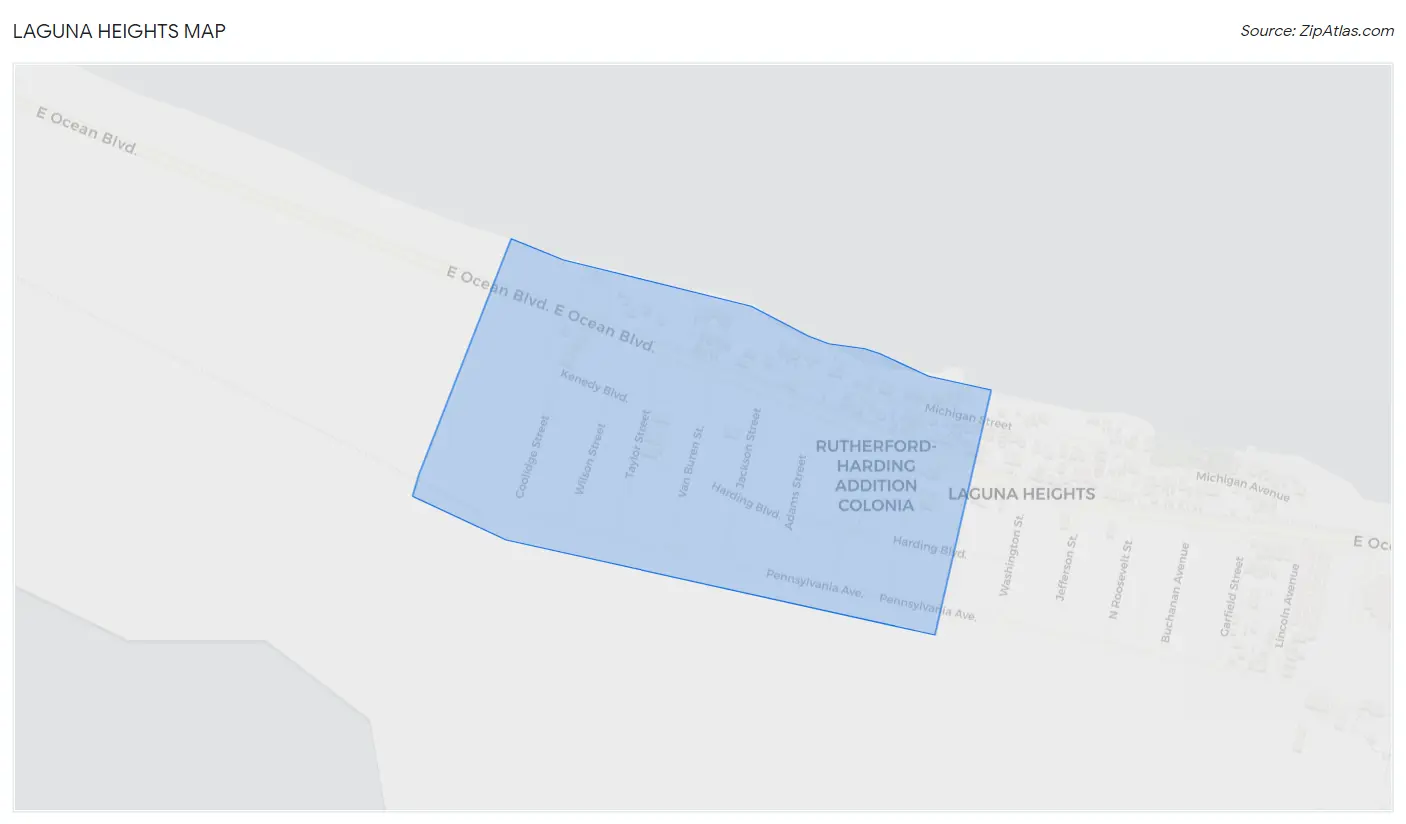
Laguna Heights, TX Map & Demographics
Laguna Heights Map
Laguna Heights Overview
$14,751
PER CAPITA INCOME
$41,707
AVG FAMILY INCOME
$29,178
AVG HOUSEHOLD INCOME
0.49
INEQUALITY / GINI INDEX
1,482
TOTAL POPULATION
509
MALE POPULATION
973
FEMALE POPULATION
52.31
MALES / 100 FEMALES
191.16
FEMALES / 100 MALES
28.1
MEDIAN AGE
4.3
AVG FAMILY SIZE
3.6
AVG HOUSEHOLD SIZE
294
LABOR FORCE [ PEOPLE ]
30.0%
PERCENT IN LABOR FORCE
Laguna Heights Area Codes
Income in Laguna Heights
Income Overview in Laguna Heights
Per Capita Income in Laguna Heights is $14,751, while median incomes of families and households are $41,707 and $29,178 respectively.
| Characteristic | Number | Measure |
| Per Capita Income | 1,482 | $14,751 |
| Median Family Income | 319 | $41,707 |
| Mean Family Income | 319 | $62,144 |
| Median Household Income | 415 | $29,178 |
| Mean Household Income | 415 | $50,558 |
| Income Deficit | 319 | $0 |
| Wage / Income Gap (%) | 1,482 | 0.00% |
| Wage / Income Gap ($) | 1,482 | 100.00¢ per $1 |
| Gini / Inequality Index | 1,482 | 0.49 |
Earnings by Sex in Laguna Heights
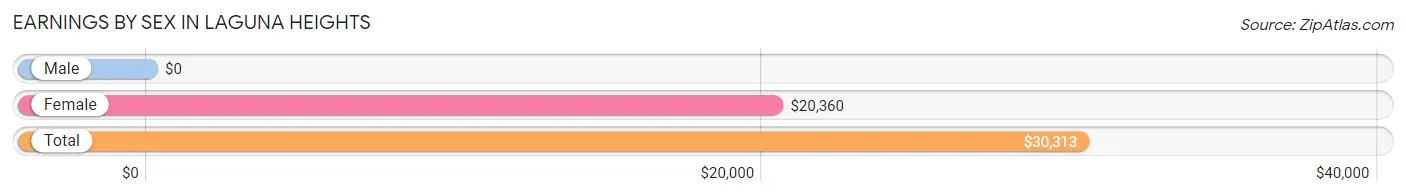
| Sex | Number | Average Earnings |
| Male | 193 (65.6%) | $0 |
| Female | 101 (34.4%) | $20,360 |
| Total | 294 (100.0%) | $30,313 |
Earnings by Sex by Income Bracket in Laguna Heights
The most common earnings brackets in Laguna Heights are $30,000 to $34,999 for men (64 | 33.2%) and $20,000 to $22,499 for women (59 | 58.4%).
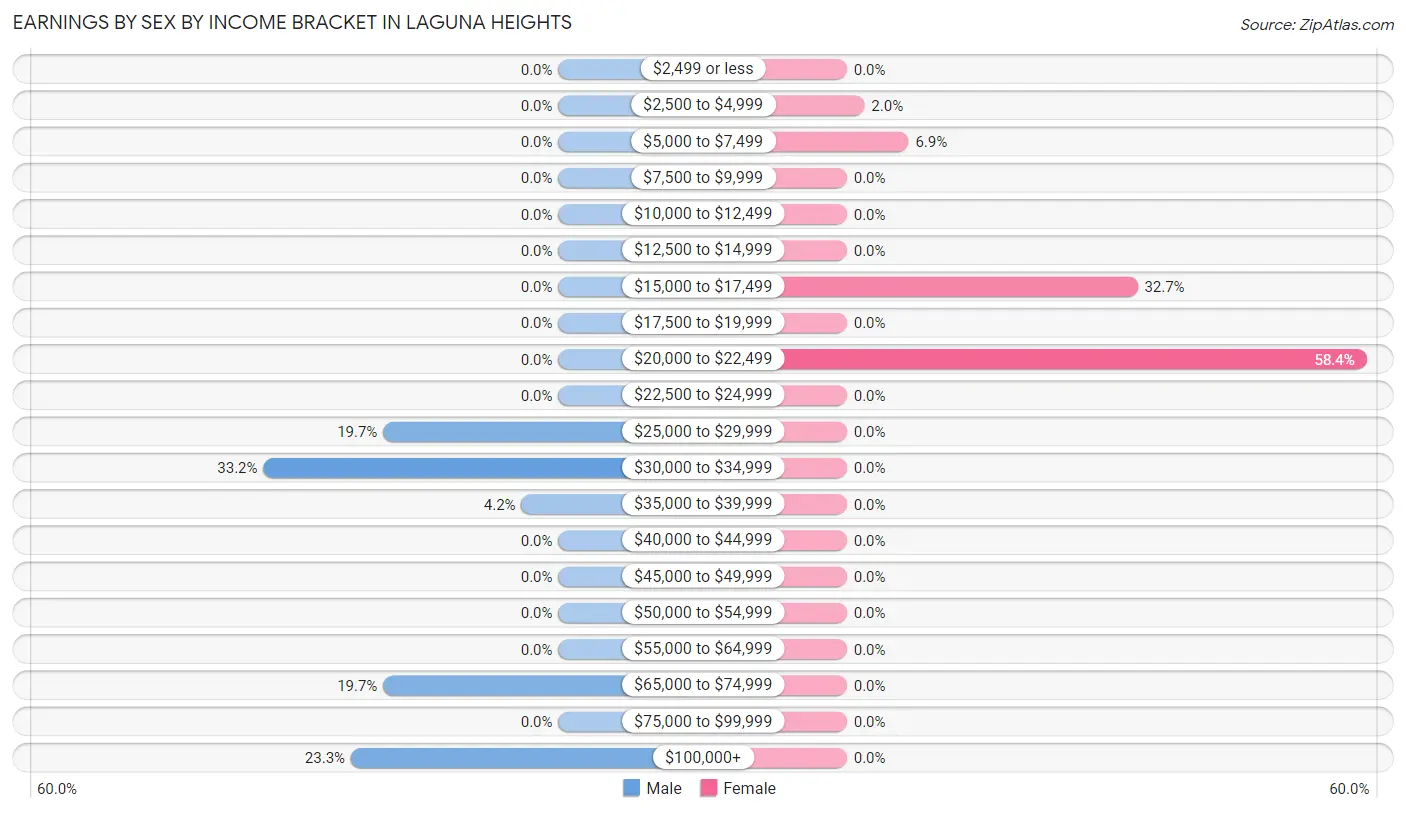
| Income | Male | Female |
| $2,499 or less | 0 (0.0%) | 0 (0.0%) |
| $2,500 to $4,999 | 0 (0.0%) | 2 (2.0%) |
| $5,000 to $7,499 | 0 (0.0%) | 7 (6.9%) |
| $7,500 to $9,999 | 0 (0.0%) | 0 (0.0%) |
| $10,000 to $12,499 | 0 (0.0%) | 0 (0.0%) |
| $12,500 to $14,999 | 0 (0.0%) | 0 (0.0%) |
| $15,000 to $17,499 | 0 (0.0%) | 33 (32.7%) |
| $17,500 to $19,999 | 0 (0.0%) | 0 (0.0%) |
| $20,000 to $22,499 | 0 (0.0%) | 59 (58.4%) |
| $22,500 to $24,999 | 0 (0.0%) | 0 (0.0%) |
| $25,000 to $29,999 | 38 (19.7%) | 0 (0.0%) |
| $30,000 to $34,999 | 64 (33.2%) | 0 (0.0%) |
| $35,000 to $39,999 | 8 (4.2%) | 0 (0.0%) |
| $40,000 to $44,999 | 0 (0.0%) | 0 (0.0%) |
| $45,000 to $49,999 | 0 (0.0%) | 0 (0.0%) |
| $50,000 to $54,999 | 0 (0.0%) | 0 (0.0%) |
| $55,000 to $64,999 | 0 (0.0%) | 0 (0.0%) |
| $65,000 to $74,999 | 38 (19.7%) | 0 (0.0%) |
| $75,000 to $99,999 | 0 (0.0%) | 0 (0.0%) |
| $100,000+ | 45 (23.3%) | 0 (0.0%) |
| Total | 193 (100.0%) | 101 (100.0%) |
Earnings by Sex by Educational Attainment in Laguna Heights
| Educational Attainment | Male Income | Female Income |
| Less than High School | - | - |
| High School Diploma | - | - |
| College or Associate's Degree | - | - |
| Bachelor's Degree | - | - |
| Graduate Degree | - | - |
| Total | - | - |
Family Income in Laguna Heights
Family Income Brackets in Laguna Heights
According to the Laguna Heights family income data, there are 98 families falling into the $50,000 to $74,999 income range, which is the most common income bracket and makes up 30.7% of all families.
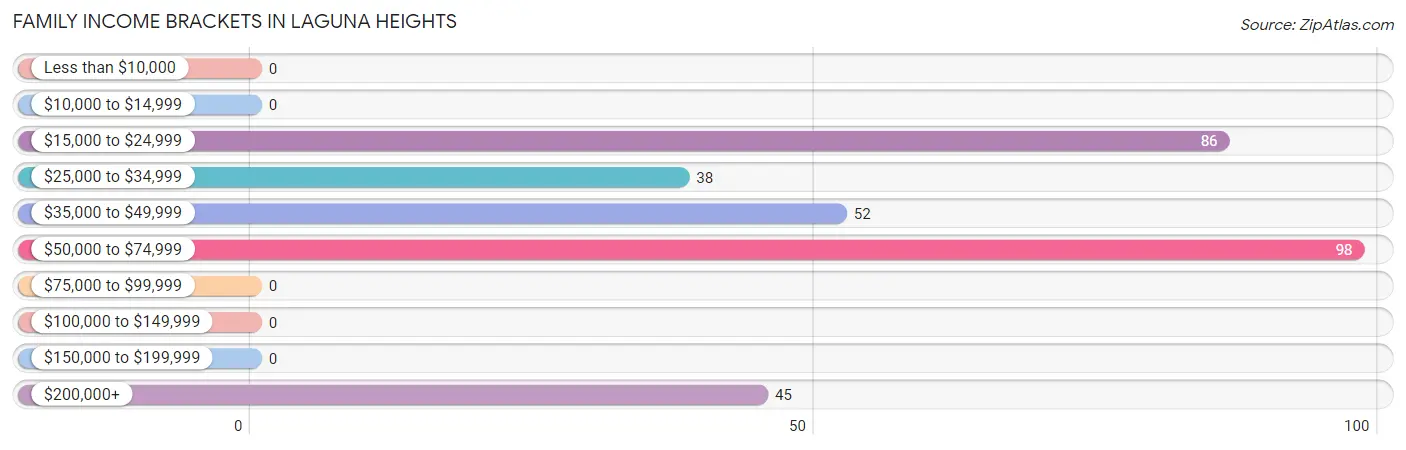
| Income Bracket | # Families | % Families |
| Less than $10,000 | 0 | 0.0% |
| $10,000 to $14,999 | 0 | 0.0% |
| $15,000 to $24,999 | 86 | 27.0% |
| $25,000 to $34,999 | 38 | 11.9% |
| $35,000 to $49,999 | 52 | 16.3% |
| $50,000 to $74,999 | 98 | 30.7% |
| $75,000 to $99,999 | 0 | 0.0% |
| $100,000 to $149,999 | 0 | 0.0% |
| $150,000 to $199,999 | 0 | 0.0% |
| $200,000+ | 45 | 14.1% |
Family Income by Famaliy Size in Laguna Heights
| Income Bracket | # Families | Median Income |
| 2-Person Families | 91 (28.5%) | $0 |
| 3-Person Families | 0 (0.0%) | $0 |
| 4-Person Families | 93 (29.1%) | $0 |
| 5-Person Families | 83 (26.0%) | $0 |
| 6-Person Families | 52 (16.3%) | $0 |
| 7+ Person Families | 0 (0.0%) | $0 |
| Total | 319 (100.0%) | $41,707 |
Family Income by Number of Earners in Laguna Heights
| Number of Earners | # Families | Median Income |
| No Earners | 106 (33.2%) | $0 |
| 1 Earner | 146 (45.8%) | $0 |
| 2 Earners | 67 (21.0%) | $0 |
| 3+ Earners | 0 (0.0%) | $0 |
| Total | 319 (100.0%) | $41,707 |
Household Income in Laguna Heights
Household Income Brackets in Laguna Heights
With 133 households falling in the category, the $15,000 to $24,999 income range is the most frequent in Laguna Heights, accounting for 32.1% of all households.
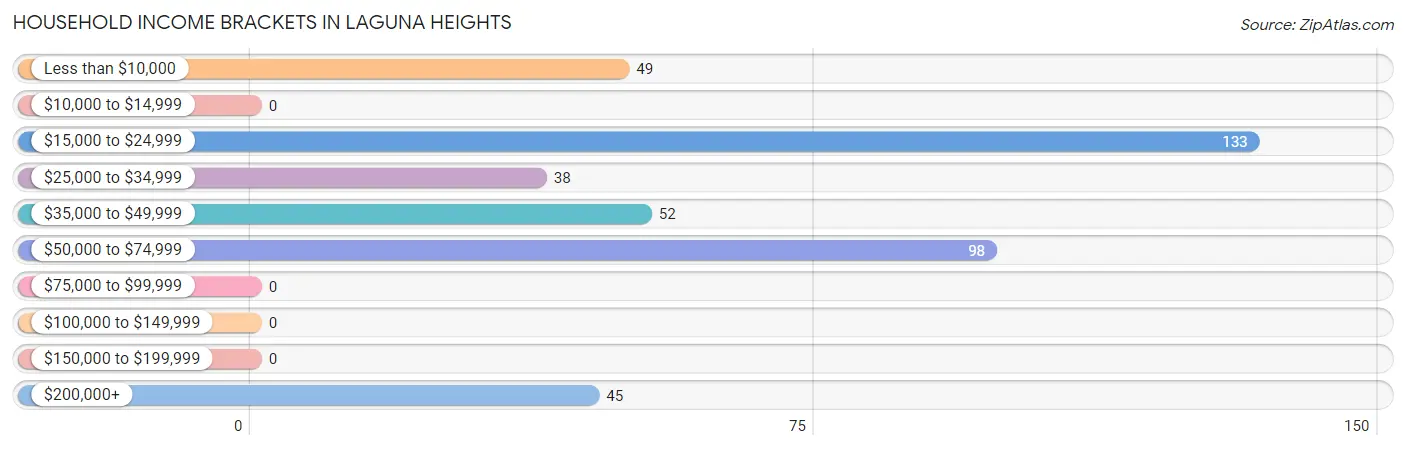
| Income Bracket | # Households | % Households |
| Less than $10,000 | 49 | 11.8% |
| $10,000 to $14,999 | 0 | 0.0% |
| $15,000 to $24,999 | 133 | 32.0% |
| $25,000 to $34,999 | 38 | 9.2% |
| $35,000 to $49,999 | 52 | 12.5% |
| $50,000 to $74,999 | 98 | 23.6% |
| $75,000 to $99,999 | 0 | 0.0% |
| $100,000 to $149,999 | 0 | 0.0% |
| $150,000 to $199,999 | 0 | 0.0% |
| $200,000+ | 45 | 10.8% |
Household Income by Householder Age in Laguna Heights
The median household income in Laguna Heights is $29,178, with the highest median household income of $40,313 found in the 25 to 44 years age bracket for the primary householder. A total of 153 households (36.9%) fall into this category.
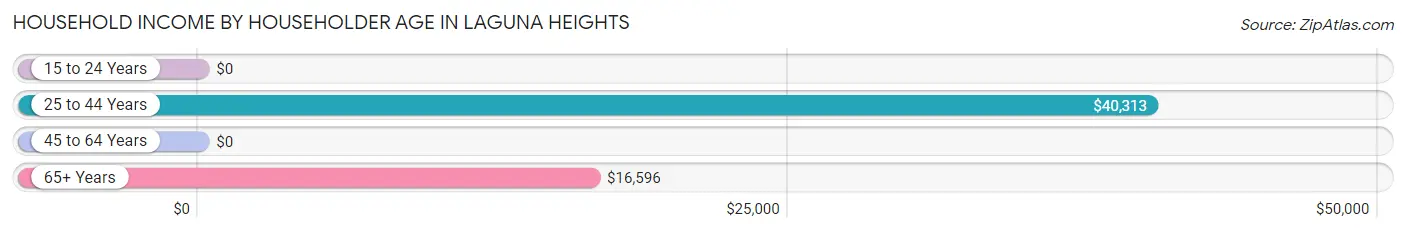
| Income Bracket | # Households | Median Income |
| 15 to 24 Years | 0 (0.0%) | $0 |
| 25 to 44 Years | 153 (36.9%) | $40,313 |
| 45 to 64 Years | 104 (25.1%) | $0 |
| 65+ Years | 158 (38.1%) | $16,596 |
| Total | 415 (100.0%) | $29,178 |
Poverty in Laguna Heights
Income Below Poverty by Sex and Age in Laguna Heights
With 24.6% poverty level for males and 40.3% for females among the residents of Laguna Heights, 12 to 14 year old males and 16 and 17 year old females are the most vulnerable to poverty, with 33 males (100.0%) and 91 females (91.9%) in their respective age groups living below the poverty level.
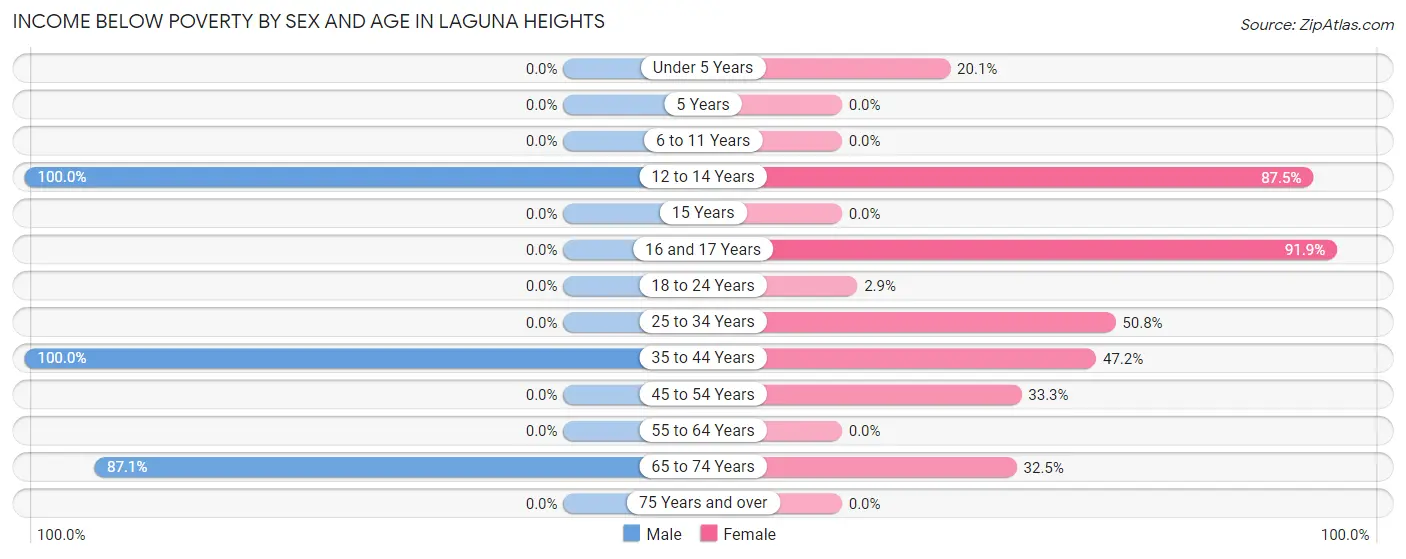
| Age Bracket | Male | Female |
| Under 5 Years | 0 (0.0%) | 38 (20.1%) |
| 5 Years | 0 (0.0%) | 0 (0.0%) |
| 6 to 11 Years | 0 (0.0%) | 0 (0.0%) |
| 12 to 14 Years | 33 (100.0%) | 63 (87.5%) |
| 15 Years | 0 (0.0%) | 0 (0.0%) |
| 16 and 17 Years | 0 (0.0%) | 91 (91.9%) |
| 18 to 24 Years | 0 (0.0%) | 2 (2.9%) |
| 25 to 34 Years | 0 (0.0%) | 32 (50.8%) |
| 35 to 44 Years | 38 (100.0%) | 84 (47.2%) |
| 45 to 54 Years | 0 (0.0%) | 33 (33.3%) |
| 55 to 64 Years | 0 (0.0%) | 0 (0.0%) |
| 65 to 74 Years | 54 (87.1%) | 49 (32.5%) |
| 75 Years and over | 0 (0.0%) | 0 (0.0%) |
| Total | 125 (24.6%) | 392 (40.3%) |
Income Above Poverty by Sex and Age in Laguna Heights
According to the poverty statistics in Laguna Heights, males aged under 5 years and females aged 6 to 11 years are the age groups that are most secure financially, with 100.0% of males and 100.0% of females in these age groups living above the poverty line.
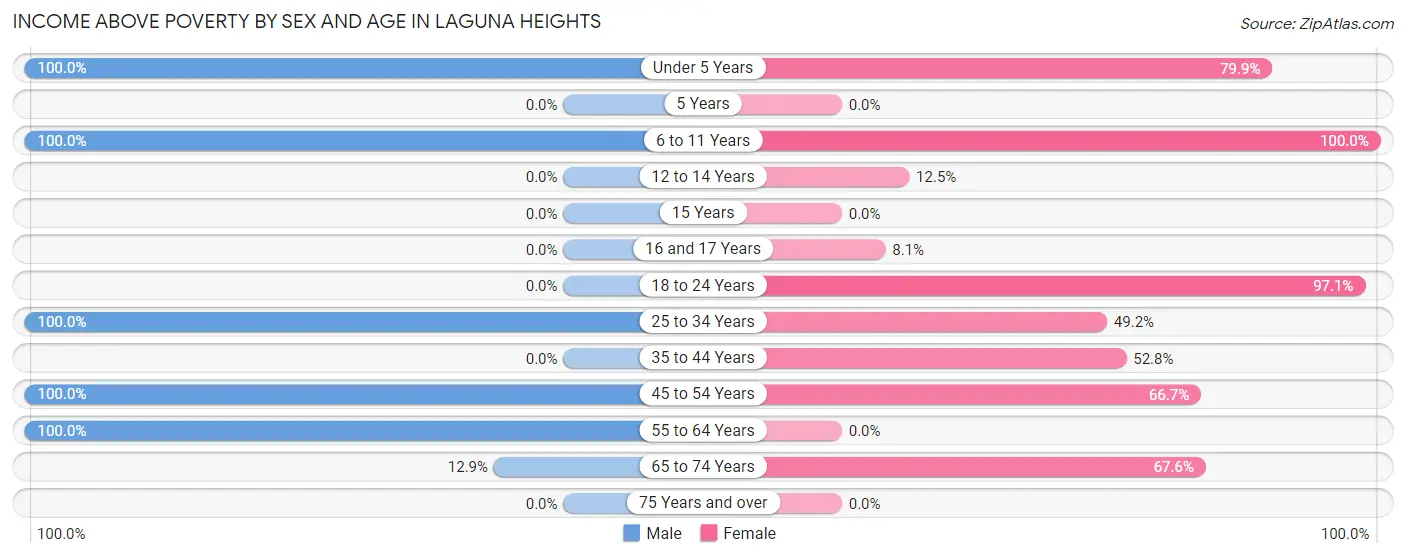
| Age Bracket | Male | Female |
| Under 5 Years | 109 (100.0%) | 151 (79.9%) |
| 5 Years | 0 (0.0%) | 0 (0.0%) |
| 6 to 11 Years | 47 (100.0%) | 52 (100.0%) |
| 12 to 14 Years | 0 (0.0%) | 9 (12.5%) |
| 15 Years | 0 (0.0%) | 0 (0.0%) |
| 16 and 17 Years | 0 (0.0%) | 8 (8.1%) |
| 18 to 24 Years | 0 (0.0%) | 68 (97.1%) |
| 25 to 34 Years | 111 (100.0%) | 31 (49.2%) |
| 35 to 44 Years | 0 (0.0%) | 94 (52.8%) |
| 45 to 54 Years | 64 (100.0%) | 66 (66.7%) |
| 55 to 64 Years | 45 (100.0%) | 0 (0.0%) |
| 65 to 74 Years | 8 (12.9%) | 102 (67.5%) |
| 75 Years and over | 0 (0.0%) | 0 (0.0%) |
| Total | 384 (75.4%) | 581 (59.7%) |
Income Below Poverty Among Married-Couple Families in Laguna Heights
The poverty statistics for married-couple families in Laguna Heights show that 21.0% or 38 of the total 181 families live below the poverty line. Families with 3 or 4 children have the highest poverty rate of 45.8%, comprising of 38 families. On the other hand, families with no children have the lowest poverty rate of 0.0%, which includes 0 families.
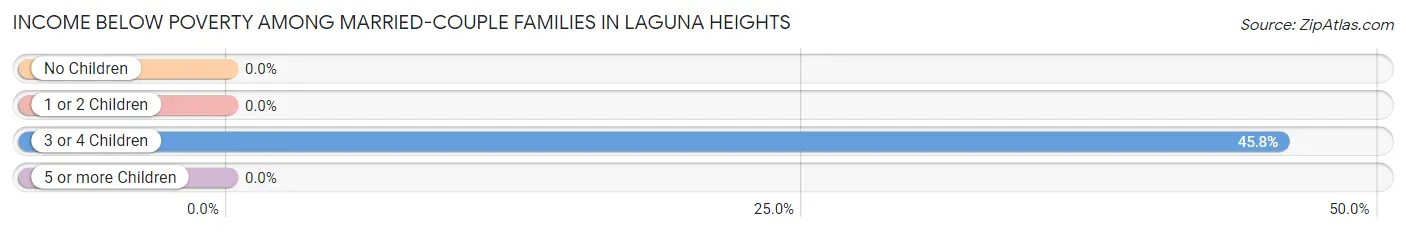
| Children | Above Poverty | Below Poverty |
| No Children | 59 (100.0%) | 0 (0.0%) |
| 1 or 2 Children | 39 (100.0%) | 0 (0.0%) |
| 3 or 4 Children | 45 (54.2%) | 38 (45.8%) |
| 5 or more Children | 0 (0.0%) | 0 (0.0%) |
| Total | 143 (79.0%) | 38 (21.0%) |
Income Below Poverty Among Single-Parent Households in Laguna Heights
According to the poverty data in Laguna Heights, 100.0% or 54 single-father households and 38.1% or 32 single-mother households are living below the poverty line. Among single-father households, those with 1 or 2 children have the highest poverty rate, with 54 households (100.0%) experiencing poverty. Likewise, among single-mother households, those with no children have the highest poverty rate, with 32 households (100.0%) falling below the poverty line.
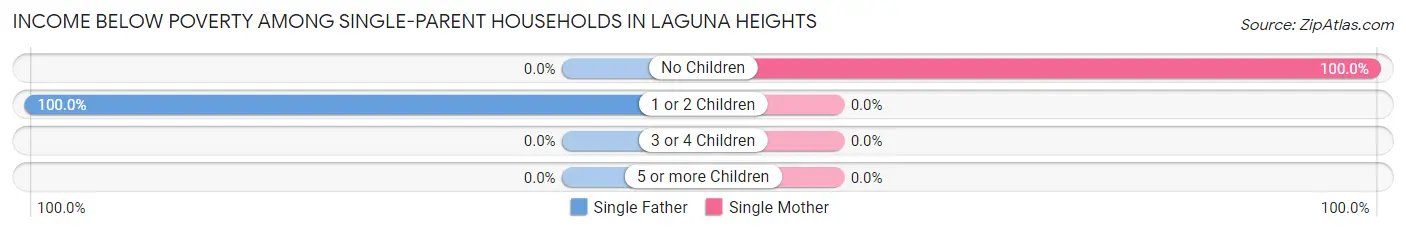
| Children | Single Father | Single Mother |
| No Children | 0 (0.0%) | 32 (100.0%) |
| 1 or 2 Children | 54 (100.0%) | 0 (0.0%) |
| 3 or 4 Children | 0 (0.0%) | 0 (0.0%) |
| 5 or more Children | 0 (0.0%) | 0 (0.0%) |
| Total | 54 (100.0%) | 32 (38.1%) |
Income Below Poverty Among Married-Couple vs Single-Parent Households in Laguna Heights
The poverty data for Laguna Heights shows that 38 of the married-couple family households (21.0%) and 86 of the single-parent households (62.3%) are living below the poverty level. Within the married-couple family households, those with 3 or 4 children have the highest poverty rate, with 38 households (45.8%) falling below the poverty line. Among the single-parent households, those with no children have the highest poverty rate, with 32 household (100.0%) living below poverty.
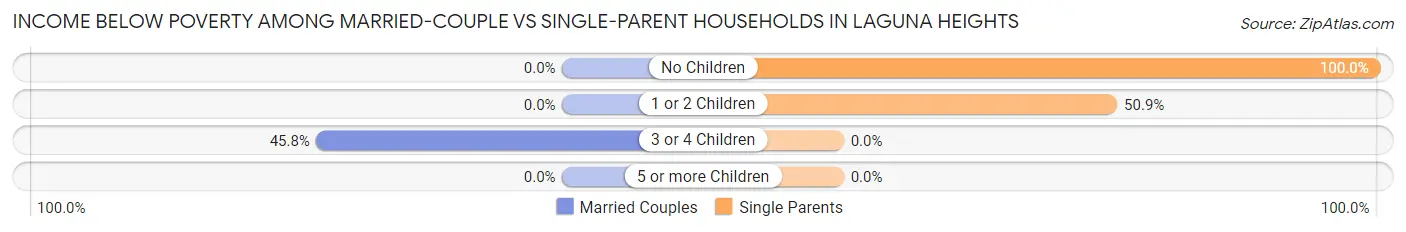
| Children | Married-Couple Families | Single-Parent Households |
| No Children | 0 (0.0%) | 32 (100.0%) |
| 1 or 2 Children | 0 (0.0%) | 54 (50.9%) |
| 3 or 4 Children | 38 (45.8%) | 0 (0.0%) |
| 5 or more Children | 0 (0.0%) | 0 (0.0%) |
| Total | 38 (21.0%) | 86 (62.3%) |
Race in Laguna Heights
The most populous races in Laguna Heights are Hispanic or Latino (1,482 | 100.0%), White / Caucasian (1,448 | 97.7%), and Some other Race (34 | 2.3%).
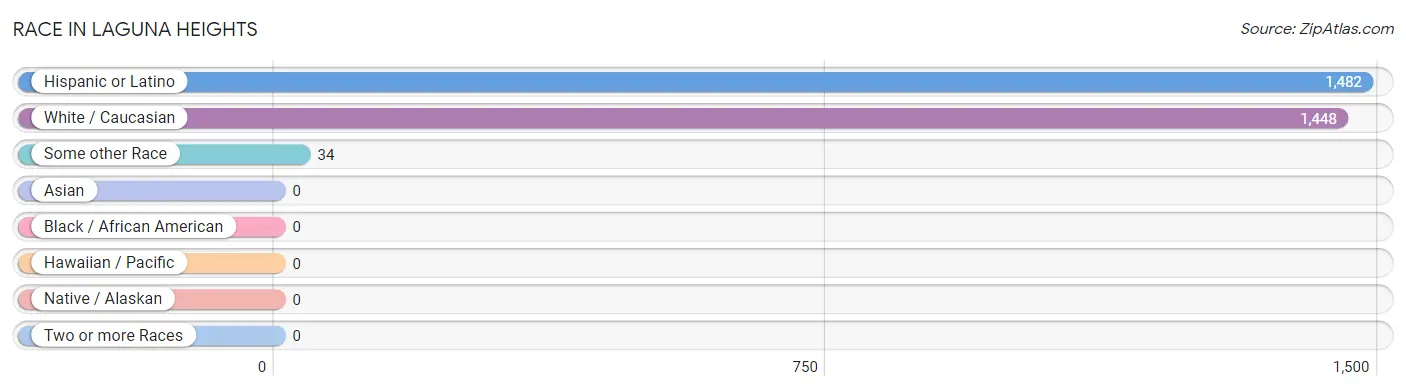
| Race | # Population | % Population |
| Asian | 0 | 0.0% |
| Black / African American | 0 | 0.0% |
| Hawaiian / Pacific | 0 | 0.0% |
| Hispanic or Latino | 1,482 | 100.0% |
| Native / Alaskan | 0 | 0.0% |
| White / Caucasian | 1,448 | 97.7% |
| Two or more Races | 0 | 0.0% |
| Some other Race | 34 | 2.3% |
| Total | 1,482 | 100.0% |
Ancestry in Laguna Heights
The most populous ancestries reported in Laguna Heights are Mexican (1,448 | 97.7%), Peruvian (2 | 0.1%), and South American (2 | 0.1%), together accounting for 98.0% of all Laguna Heights residents.
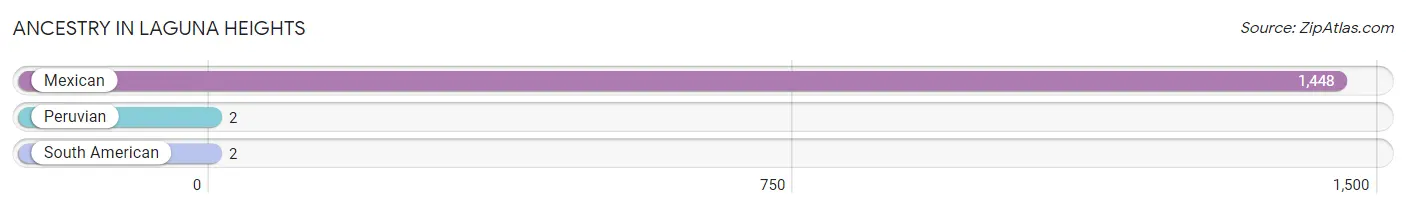
| Ancestry | # Population | % Population |
| Mexican | 1,448 | 97.7% |
| Peruvian | 2 | 0.1% |
| South American | 2 | 0.1% | View All 3 Rows |
Immigrants in Laguna Heights
The most numerous immigrant groups reported in Laguna Heights came from Latin America (406 | 27.4%), Central America (404 | 27.3%), Mexico (404 | 27.3%), Peru (2 | 0.1%), and South America (2 | 0.1%), together accounting for 82.2% of all Laguna Heights residents.
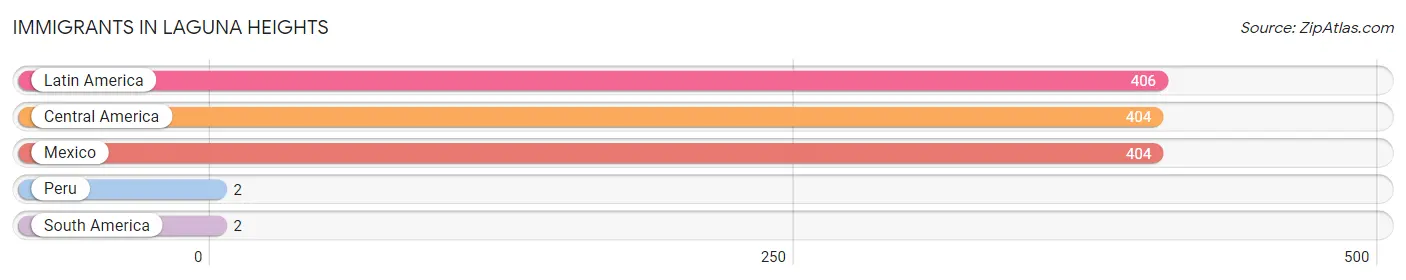
| Immigration Origin | # Population | % Population |
| Central America | 404 | 27.3% |
| Latin America | 406 | 27.4% |
| Mexico | 404 | 27.3% |
| Peru | 2 | 0.1% |
| South America | 2 | 0.1% | View All 5 Rows |
Sex and Age in Laguna Heights
Sex and Age in Laguna Heights
The most populous age groups in Laguna Heights are Under 5 Years (109 | 21.4%) for men and Under 5 Years (189 | 19.4%) for women.
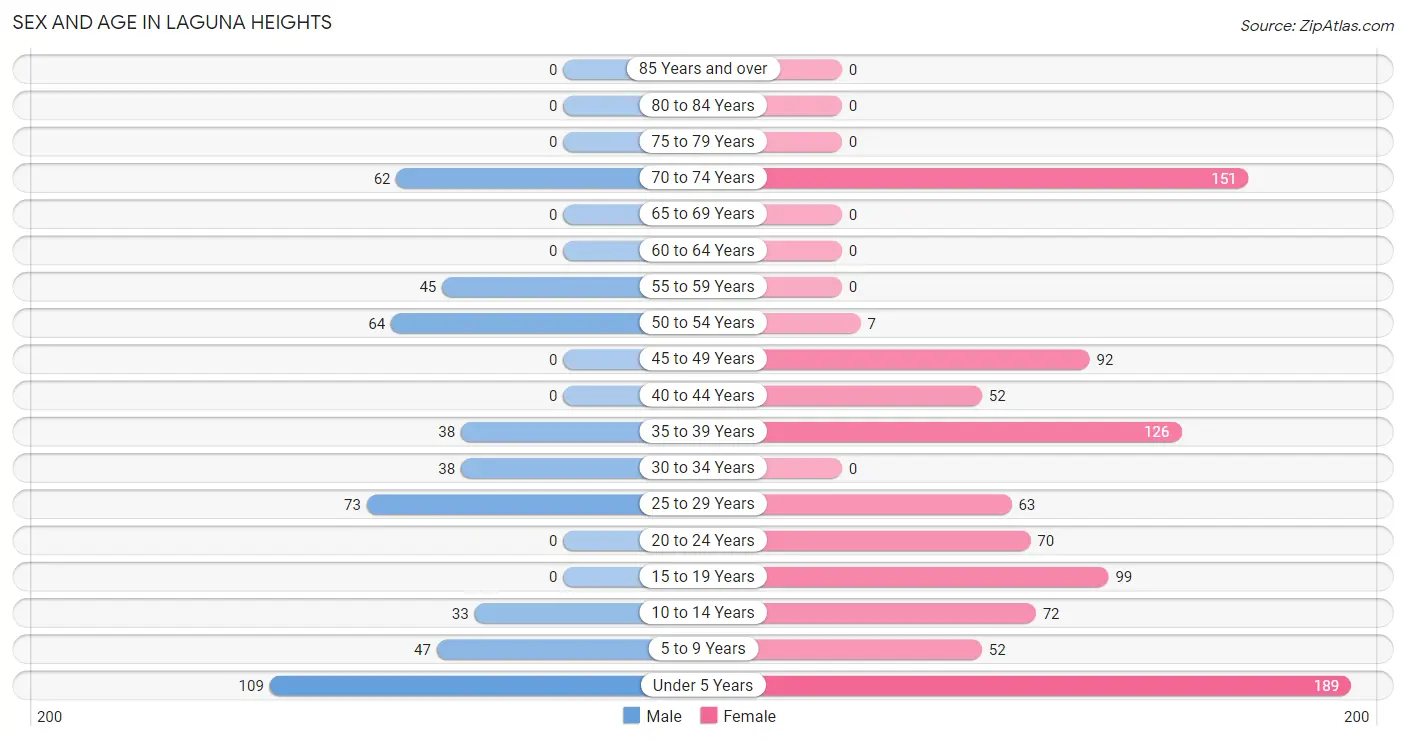
| Age Bracket | Male | Female |
| Under 5 Years | 109 (21.4%) | 189 (19.4%) |
| 5 to 9 Years | 47 (9.2%) | 52 (5.3%) |
| 10 to 14 Years | 33 (6.5%) | 72 (7.4%) |
| 15 to 19 Years | 0 (0.0%) | 99 (10.2%) |
| 20 to 24 Years | 0 (0.0%) | 70 (7.2%) |
| 25 to 29 Years | 73 (14.3%) | 63 (6.5%) |
| 30 to 34 Years | 38 (7.5%) | 0 (0.0%) |
| 35 to 39 Years | 38 (7.5%) | 126 (13.0%) |
| 40 to 44 Years | 0 (0.0%) | 52 (5.3%) |
| 45 to 49 Years | 0 (0.0%) | 92 (9.5%) |
| 50 to 54 Years | 64 (12.6%) | 7 (0.7%) |
| 55 to 59 Years | 45 (8.8%) | 0 (0.0%) |
| 60 to 64 Years | 0 (0.0%) | 0 (0.0%) |
| 65 to 69 Years | 0 (0.0%) | 0 (0.0%) |
| 70 to 74 Years | 62 (12.2%) | 151 (15.5%) |
| 75 to 79 Years | 0 (0.0%) | 0 (0.0%) |
| 80 to 84 Years | 0 (0.0%) | 0 (0.0%) |
| 85 Years and over | 0 (0.0%) | 0 (0.0%) |
| Total | 509 (100.0%) | 973 (100.0%) |
Families and Households in Laguna Heights
Median Family Size in Laguna Heights
The median family size in Laguna Heights is 4.34 persons per family, with single female/mother families (84 | 26.3%) accounting for the largest median family size of 5.32 persons per family. On the other hand, married-couple families (181 | 56.7%) represent the smallest median family size with 3.92 persons per family.
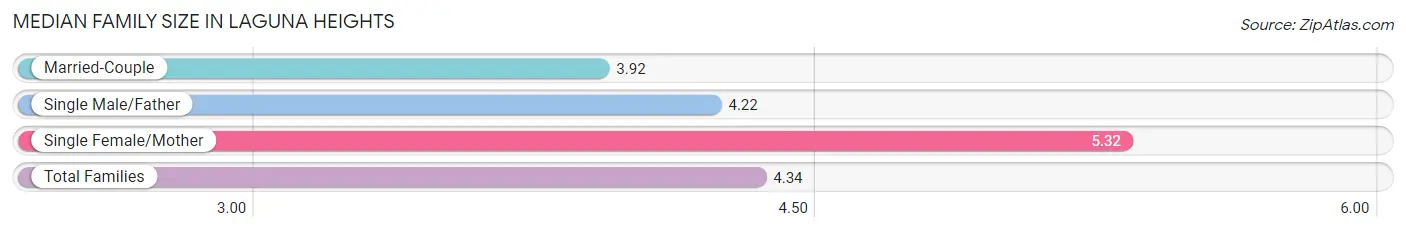
| Family Type | # Families | Family Size |
| Married-Couple | 181 (56.7%) | 3.92 |
| Single Male/Father | 54 (16.9%) | 4.22 |
| Single Female/Mother | 84 (26.3%) | 5.32 |
| Total Families | 319 (100.0%) | 4.34 |
Median Household Size in Laguna Heights
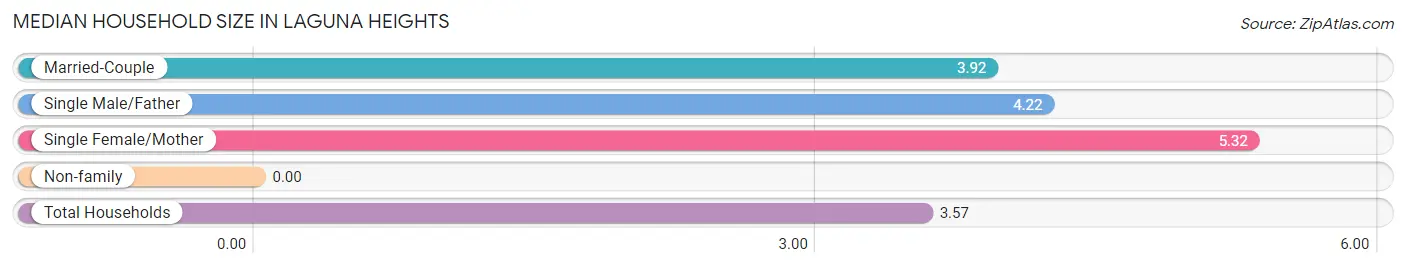
| Household Type | # Households | Household Size |
| Married-Couple | 181 (43.6%) | 3.92 |
| Single Male/Father | 54 (13.0%) | 4.22 |
| Single Female/Mother | 84 (20.2%) | 5.32 |
| Non-family | 96 (23.1%) | - |
| Total Households | 415 (100.0%) | 3.57 |
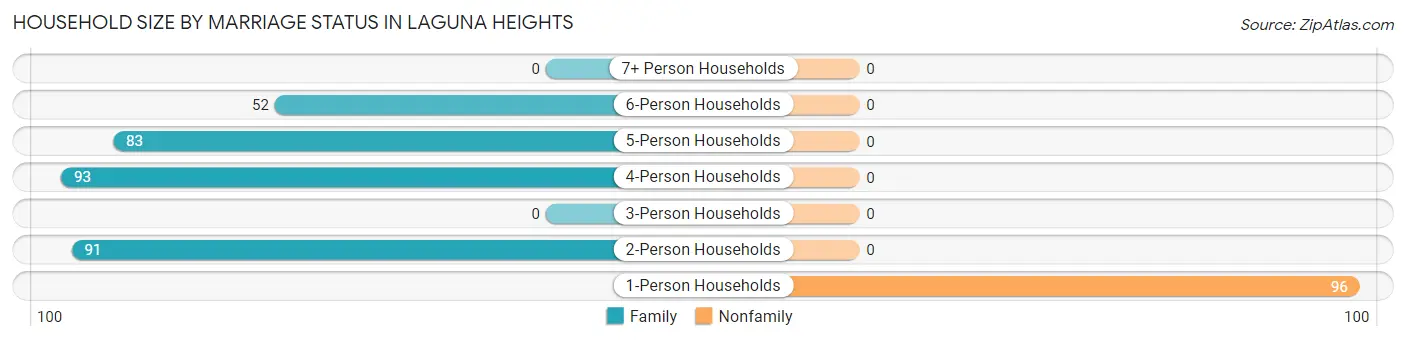
Household Size by Marriage Status in Laguna Heights
Out of a total of 415 households in Laguna Heights, 319 (76.9%) are family households, while 96 (23.1%) are nonfamily households. The most numerous type of family households are 4-person households, comprising 93, and the most common type of nonfamily households are 1-person households, comprising 96.
| Household Size | Family Households | Nonfamily Households |
| 1-Person Households | - | 96 (23.1%) |
| 2-Person Households | 91 (21.9%) | 0 (0.0%) |
| 3-Person Households | 0 (0.0%) | 0 (0.0%) |
| 4-Person Households | 93 (22.4%) | 0 (0.0%) |
| 5-Person Households | 83 (20.0%) | 0 (0.0%) |
| 6-Person Households | 52 (12.5%) | 0 (0.0%) |
| 7+ Person Households | 0 (0.0%) | 0 (0.0%) |
| Total | 319 (76.9%) | 96 (23.1%) |
Female Fertility in Laguna Heights
Fertility by Age in Laguna Heights
Average fertility rate in Laguna Heights is 134.0 births per 1,000 women. Women in the age bracket of 20 to 34 years have the highest fertility rate with 511.0 births per 1,000 women. Women in the age bracket of 20 to 34 years acount for 100.0% of all women with births.
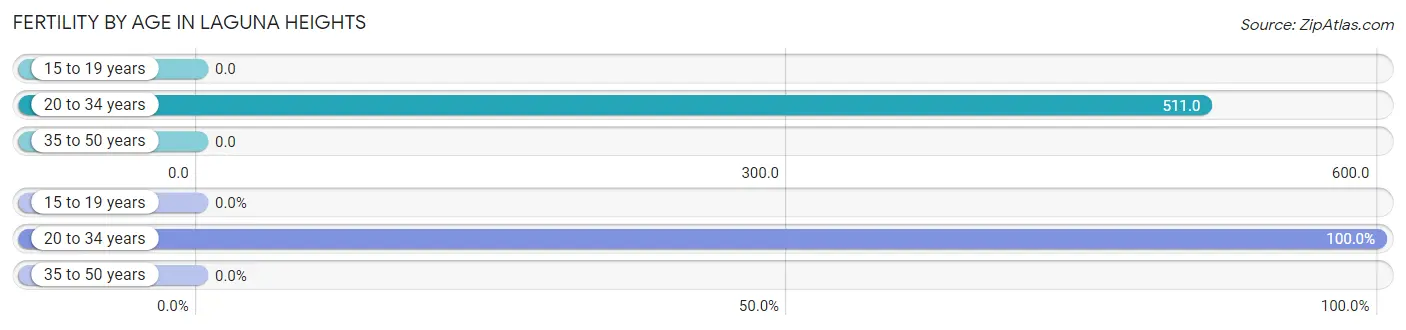
| Age Bracket | Women with Births | Births / 1,000 Women |
| 15 to 19 years | 0 (0.0%) | 0.0 |
| 20 to 34 years | 68 (100.0%) | 511.0 |
| 35 to 50 years | 0 (0.0%) | 0.0 |
| Total | 68 (100.0%) | 134.0 |
Fertility by Age by Marriage Status in Laguna Heights
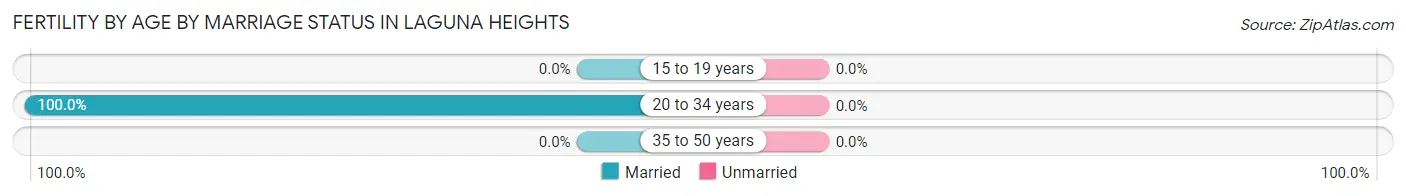
| Age Bracket | Married | Unmarried |
| 15 to 19 years | 0 (0.0%) | 0 (0.0%) |
| 20 to 34 years | 68 (100.0%) | 0 (0.0%) |
| 35 to 50 years | 0 (0.0%) | 0 (0.0%) |
| Total | 68 (100.0%) | 0 (0.0%) |
Fertility by Education in Laguna Heights
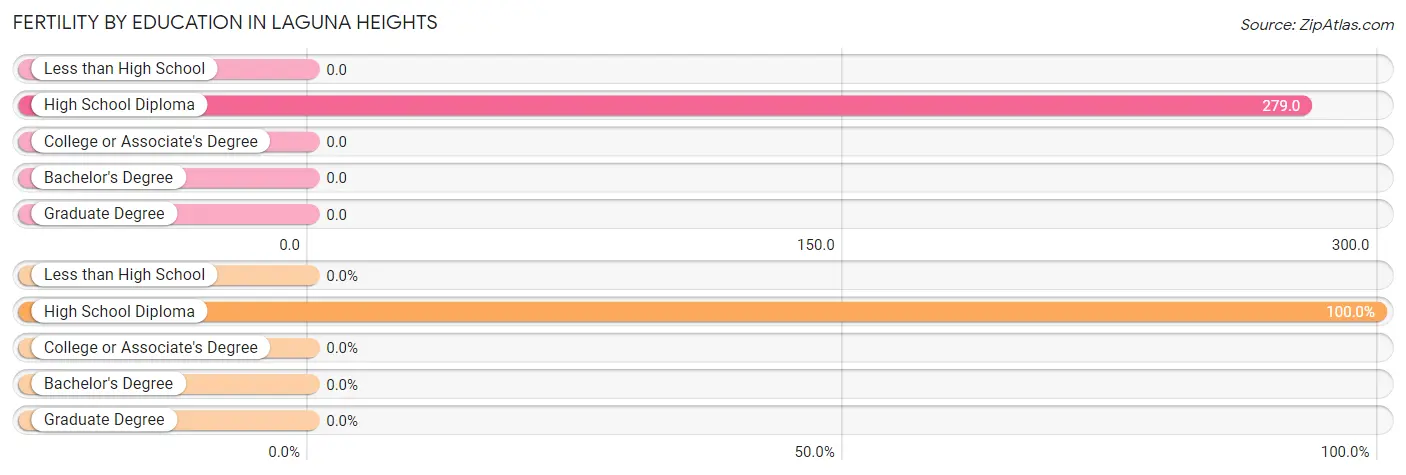
| Educational Attainment | Women with Births | Births / 1,000 Women |
| Less than High School | 0 (0.0%) | 0.0 |
| High School Diploma | 68 (100.0%) | 279.0 |
| College or Associate's Degree | 0 (0.0%) | 0.0 |
| Bachelor's Degree | 0 (0.0%) | 0.0 |
| Graduate Degree | 0 (0.0%) | 0.0 |
| Total | 68 (100.0%) | 134.0 |
Fertility by Education by Marriage Status in Laguna Heights
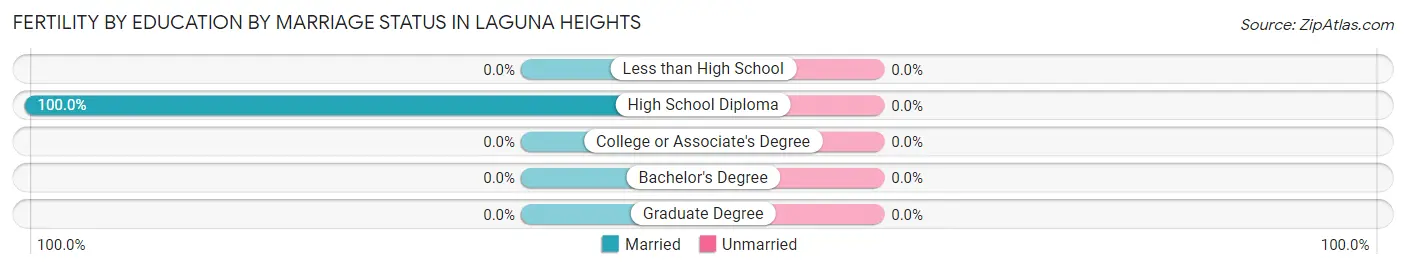
| Educational Attainment | Married | Unmarried |
| Less than High School | 0 (0.0%) | 0 (0.0%) |
| High School Diploma | 68 (100.0%) | 0 (0.0%) |
| College or Associate's Degree | 0 (0.0%) | 0 (0.0%) |
| Bachelor's Degree | 0 (0.0%) | 0 (0.0%) |
| Graduate Degree | 0 (0.0%) | 0 (0.0%) |
| Total | 68 (100.0%) | 0 (0.0%) |
Employment Characteristics in Laguna Heights
Employment by Class of Employer in Laguna Heights
Among the 294 employed individuals in Laguna Heights, private company employees (239 | 81.3%), self-employed (not incorporated) (45 | 15.3%), and local government employees (8 | 2.7%) make up the most common classes of employment.
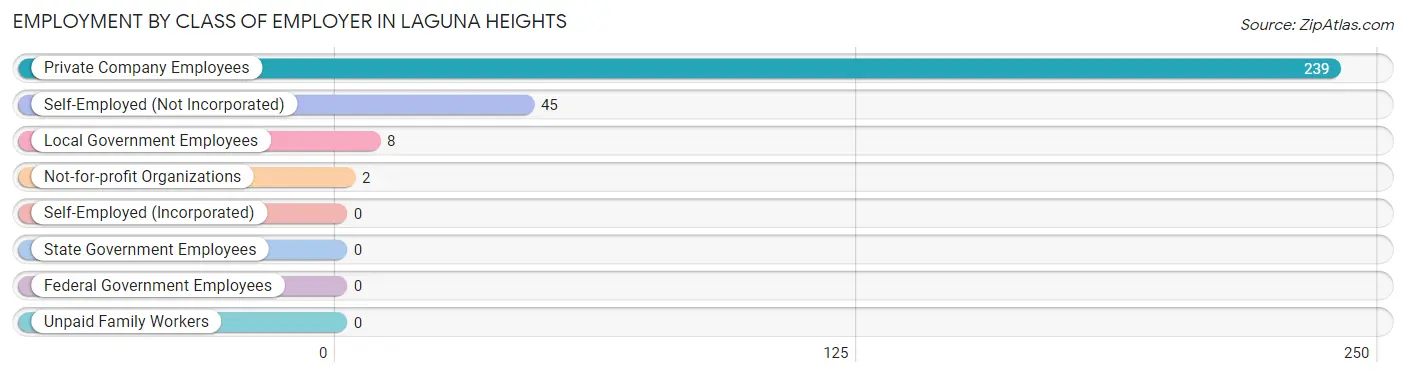
| Employer Class | # Employees | % Employees |
| Private Company Employees | 239 | 81.3% |
| Self-Employed (Incorporated) | 0 | 0.0% |
| Self-Employed (Not Incorporated) | 45 | 15.3% |
| Not-for-profit Organizations | 2 | 0.7% |
| Local Government Employees | 8 | 2.7% |
| State Government Employees | 0 | 0.0% |
| Federal Government Employees | 0 | 0.0% |
| Unpaid Family Workers | 0 | 0.0% |
| Total | 294 | 100.0% |
Employment Status by Age in Laguna Heights
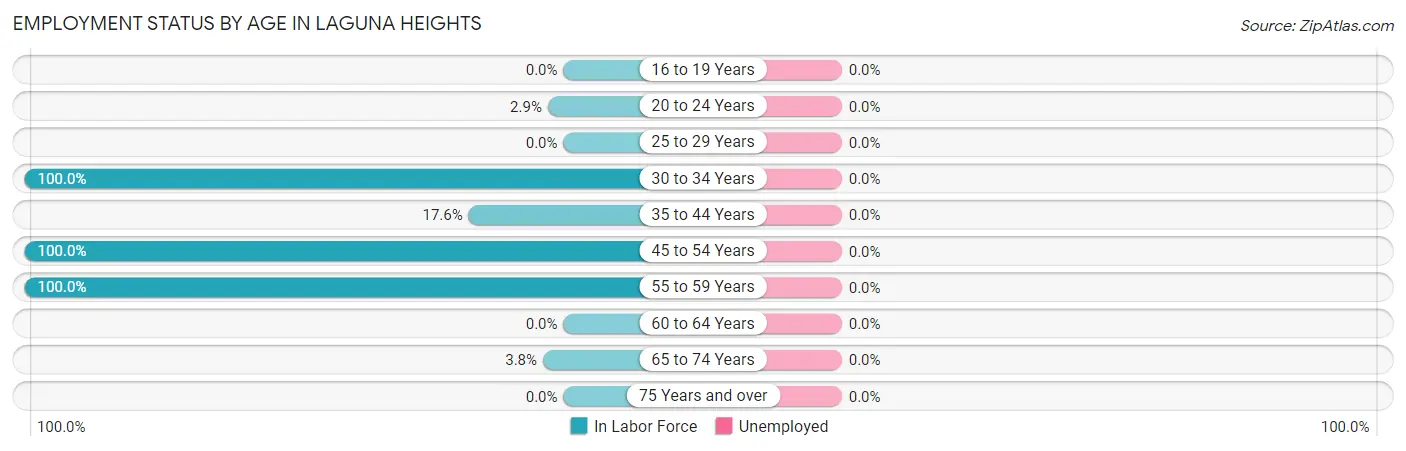
| Age Bracket | In Labor Force | Unemployed |
| 16 to 19 Years | 0 (0.0%) | 0 (0.0%) |
| 20 to 24 Years | 2 (2.9%) | 0 (0.0%) |
| 25 to 29 Years | 0 (0.0%) | 0 (0.0%) |
| 30 to 34 Years | 38 (100.0%) | 0 (0.0%) |
| 35 to 44 Years | 38 (17.6%) | 0 (0.0%) |
| 45 to 54 Years | 163 (100.0%) | 0 (0.0%) |
| 55 to 59 Years | 45 (100.0%) | 0 (0.0%) |
| 60 to 64 Years | 0 (0.0%) | 0 (0.0%) |
| 65 to 74 Years | 8 (3.8%) | 0 (0.0%) |
| 75 Years and over | 0 (0.0%) | 0 (0.0%) |
| Total | 294 (30.0%) | 0 (0.0%) |
Employment Status by Educational Attainment in Laguna Heights
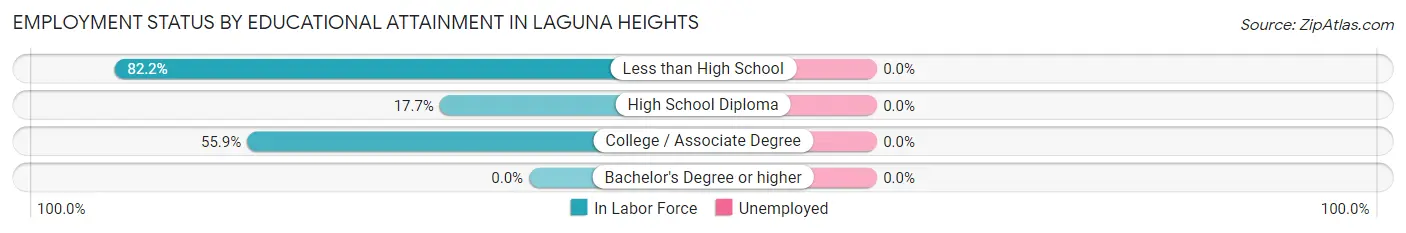
| Educational Attainment | In Labor Force | Unemployed |
| Less than High School | 194 (82.2%) | 0 (0.0%) |
| High School Diploma | 52 (17.7%) | 0 (0.0%) |
| College / Associate Degree | 38 (55.9%) | 0 (0.0%) |
| Bachelor's Degree or higher | 0 (0.0%) | 0 (0.0%) |
| Total | 284 (47.5%) | 0 (0.0%) |
Employment Occupations by Sex in Laguna Heights
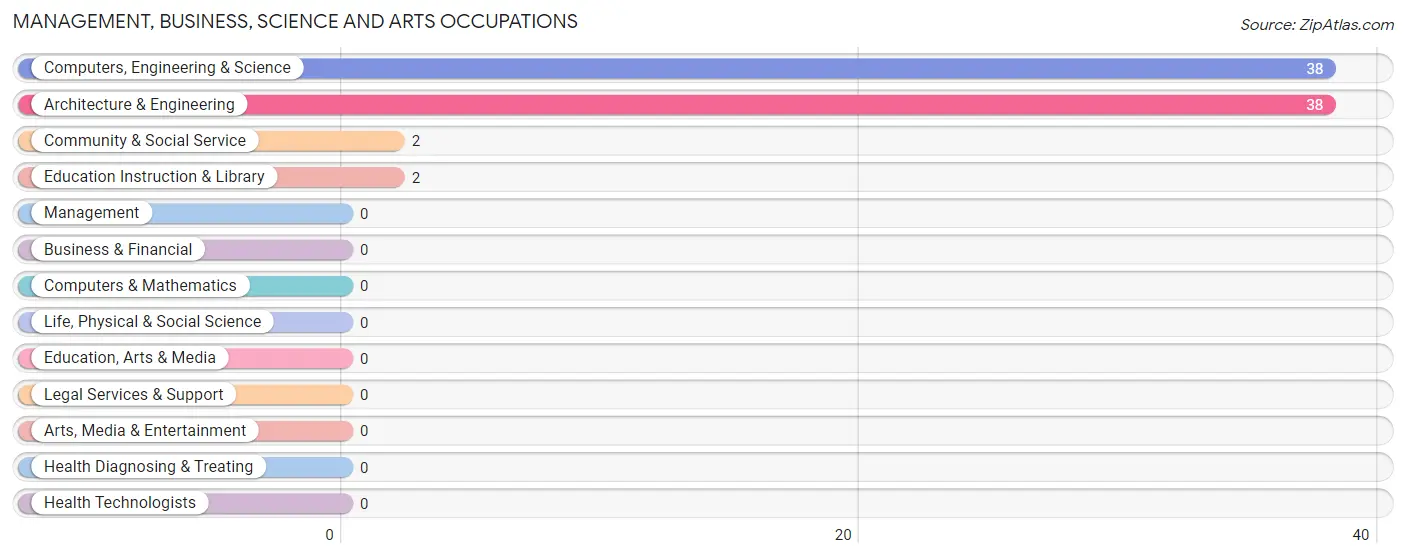
Management, Business, Science and Arts Occupations
The most common Management, Business, Science and Arts occupations in Laguna Heights are Computers, Engineering & Science (38 | 12.9%), Architecture & Engineering (38 | 12.9%), Community & Social Service (2 | 0.7%), and Education Instruction & Library (2 | 0.7%).
Management, Business, Science and Arts Occupations by Sex
Within the Management, Business, Science and Arts occupations in Laguna Heights, the most male-oriented occupations are Computers, Engineering & Science (100.0%), and Architecture & Engineering (100.0%), while the most female-oriented occupations are Community & Social Service (100.0%), and Education Instruction & Library (100.0%).
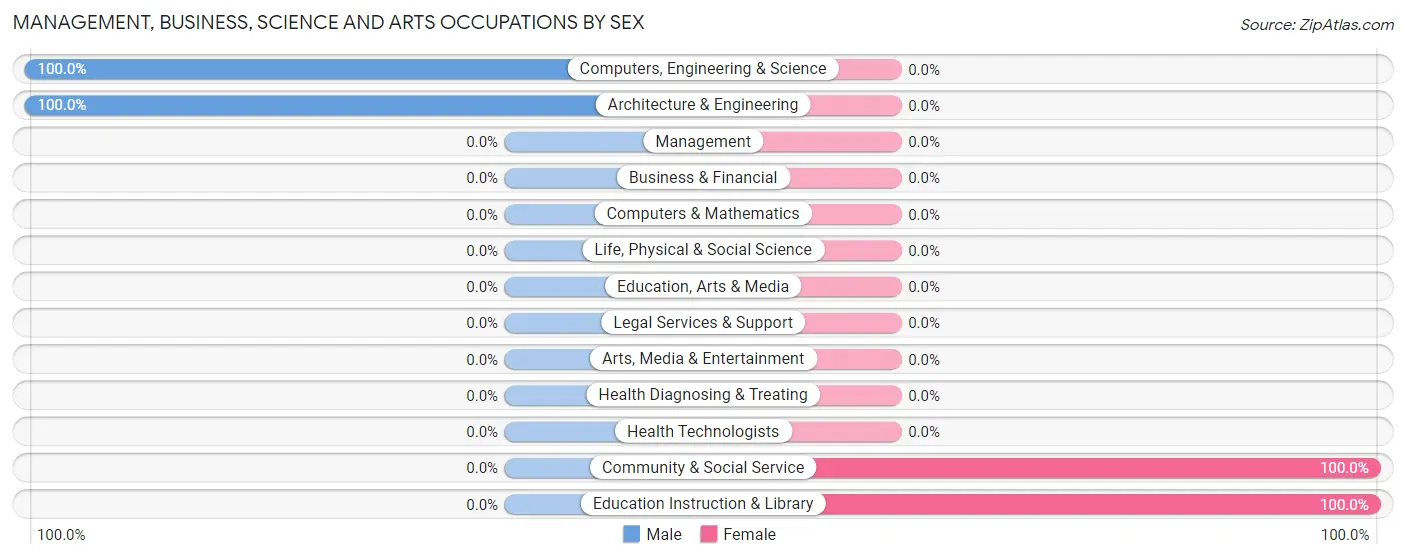
| Occupation | Male | Female |
| Management | 0 (0.0%) | 0 (0.0%) |
| Business & Financial | 0 (0.0%) | 0 (0.0%) |
| Computers, Engineering & Science | 38 (100.0%) | 0 (0.0%) |
| Computers & Mathematics | 0 (0.0%) | 0 (0.0%) |
| Architecture & Engineering | 38 (100.0%) | 0 (0.0%) |
| Life, Physical & Social Science | 0 (0.0%) | 0 (0.0%) |
| Community & Social Service | 0 (0.0%) | 2 (100.0%) |
| Education, Arts & Media | 0 (0.0%) | 0 (0.0%) |
| Legal Services & Support | 0 (0.0%) | 0 (0.0%) |
| Education Instruction & Library | 0 (0.0%) | 2 (100.0%) |
| Arts, Media & Entertainment | 0 (0.0%) | 0 (0.0%) |
| Health Diagnosing & Treating | 0 (0.0%) | 0 (0.0%) |
| Health Technologists | 0 (0.0%) | 0 (0.0%) |
| Total (Category) | 38 (95.0%) | 2 (5.0%) |
| Total (Overall) | 193 (65.6%) | 101 (34.4%) |
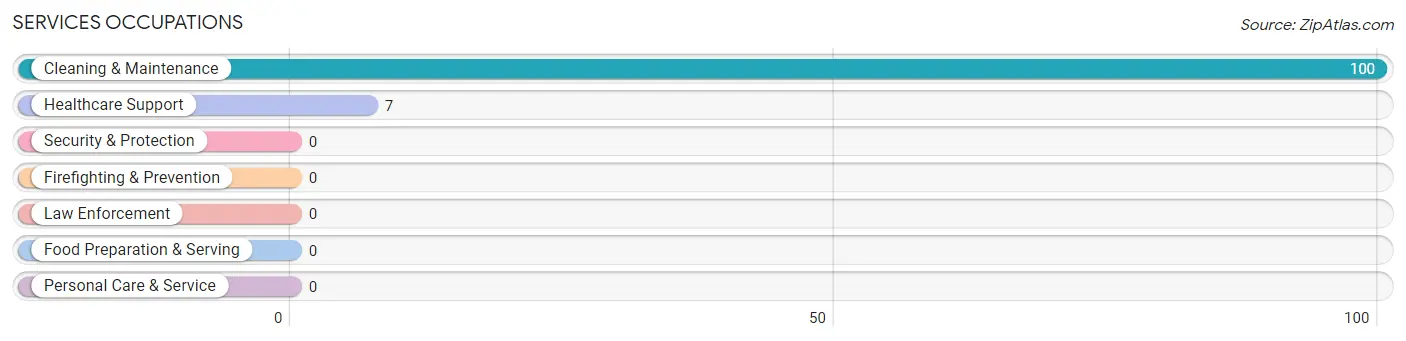
Services Occupations
The most common Services occupations in Laguna Heights are Cleaning & Maintenance (100 | 34.0%), and Healthcare Support (7 | 2.4%).
Services Occupations by Sex
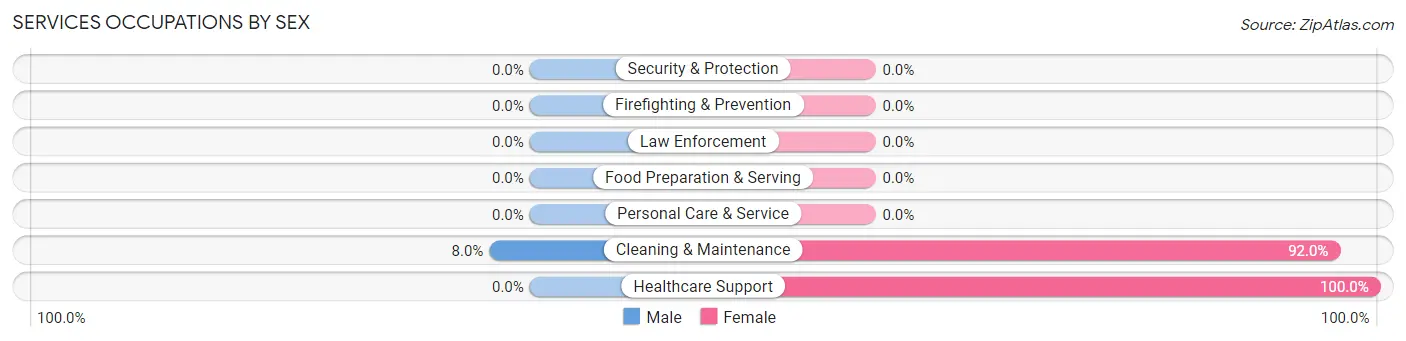
| Occupation | Male | Female |
| Healthcare Support | 0 (0.0%) | 7 (100.0%) |
| Security & Protection | 0 (0.0%) | 0 (0.0%) |
| Firefighting & Prevention | 0 (0.0%) | 0 (0.0%) |
| Law Enforcement | 0 (0.0%) | 0 (0.0%) |
| Food Preparation & Serving | 0 (0.0%) | 0 (0.0%) |
| Cleaning & Maintenance | 8 (8.0%) | 92 (92.0%) |
| Personal Care & Service | 0 (0.0%) | 0 (0.0%) |
| Total (Category) | 8 (7.5%) | 99 (92.5%) |
| Total (Overall) | 193 (65.6%) | 101 (34.4%) |
Sales and Office Occupations
The most common Sales and Office occupations in Laguna Heights are , and Sales & Related (45 | 15.3%).
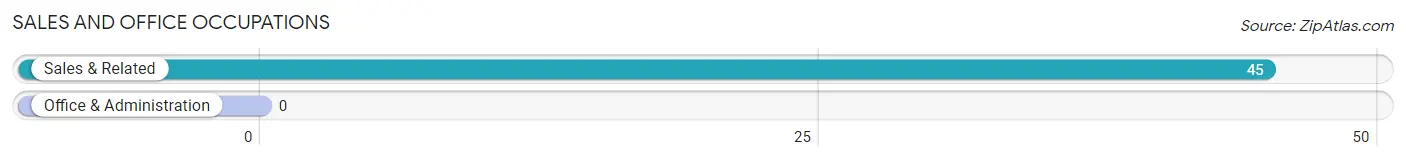
Sales and Office Occupations by Sex

| Occupation | Male | Female |
| Sales & Related | 45 (100.0%) | 0 (0.0%) |
| Office & Administration | 0 (0.0%) | 0 (0.0%) |
| Total (Category) | 45 (100.0%) | 0 (0.0%) |
| Total (Overall) | 193 (65.6%) | 101 (34.4%) |
Natural Resources, Construction and Maintenance Occupations
The most common Natural Resources, Construction and Maintenance occupations in Laguna Heights are , and Construction & Extraction (102 | 34.7%).
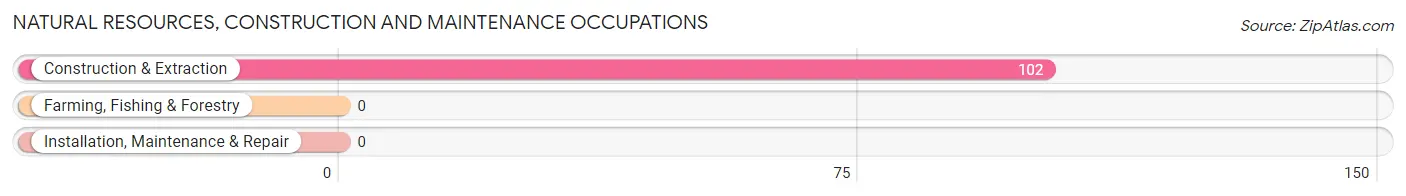
Natural Resources, Construction and Maintenance Occupations by Sex
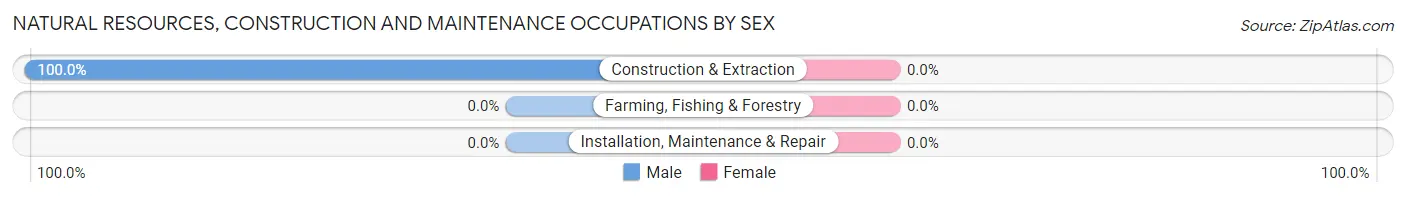
| Occupation | Male | Female |
| Farming, Fishing & Forestry | 0 (0.0%) | 0 (0.0%) |
| Construction & Extraction | 102 (100.0%) | 0 (0.0%) |
| Installation, Maintenance & Repair | 0 (0.0%) | 0 (0.0%) |
| Total (Category) | 102 (100.0%) | 0 (0.0%) |
| Total (Overall) | 193 (65.6%) | 101 (34.4%) |
Production, Transportation and Moving Occupations
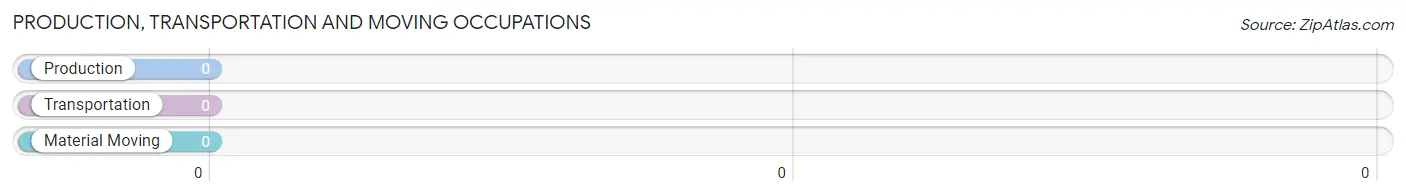
Production, Transportation and Moving Occupations by Sex
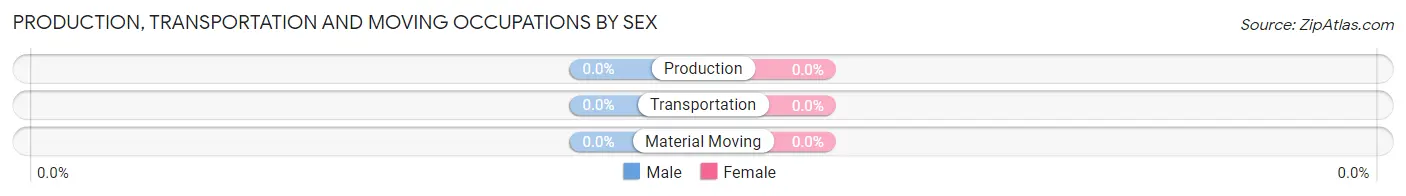
| Occupation | Male | Female |
| Production | 0 (0.0%) | 0 (0.0%) |
| Transportation | 0 (0.0%) | 0 (0.0%) |
| Material Moving | 0 (0.0%) | 0 (0.0%) |
| Total (Category) | 0 (0.0%) | 0 (0.0%) |
| Total (Overall) | 193 (65.6%) | 101 (34.4%) |
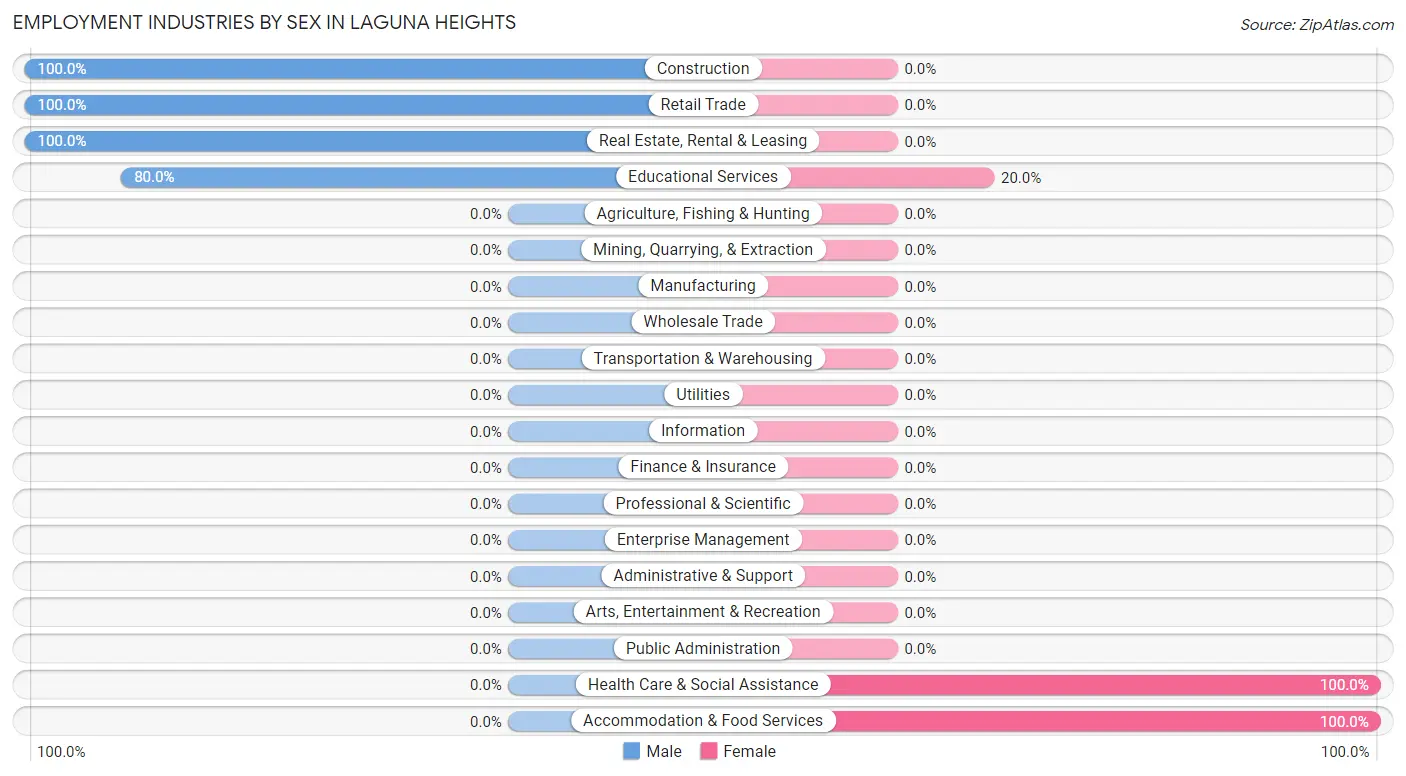
Employment Industries by Sex in Laguna Heights
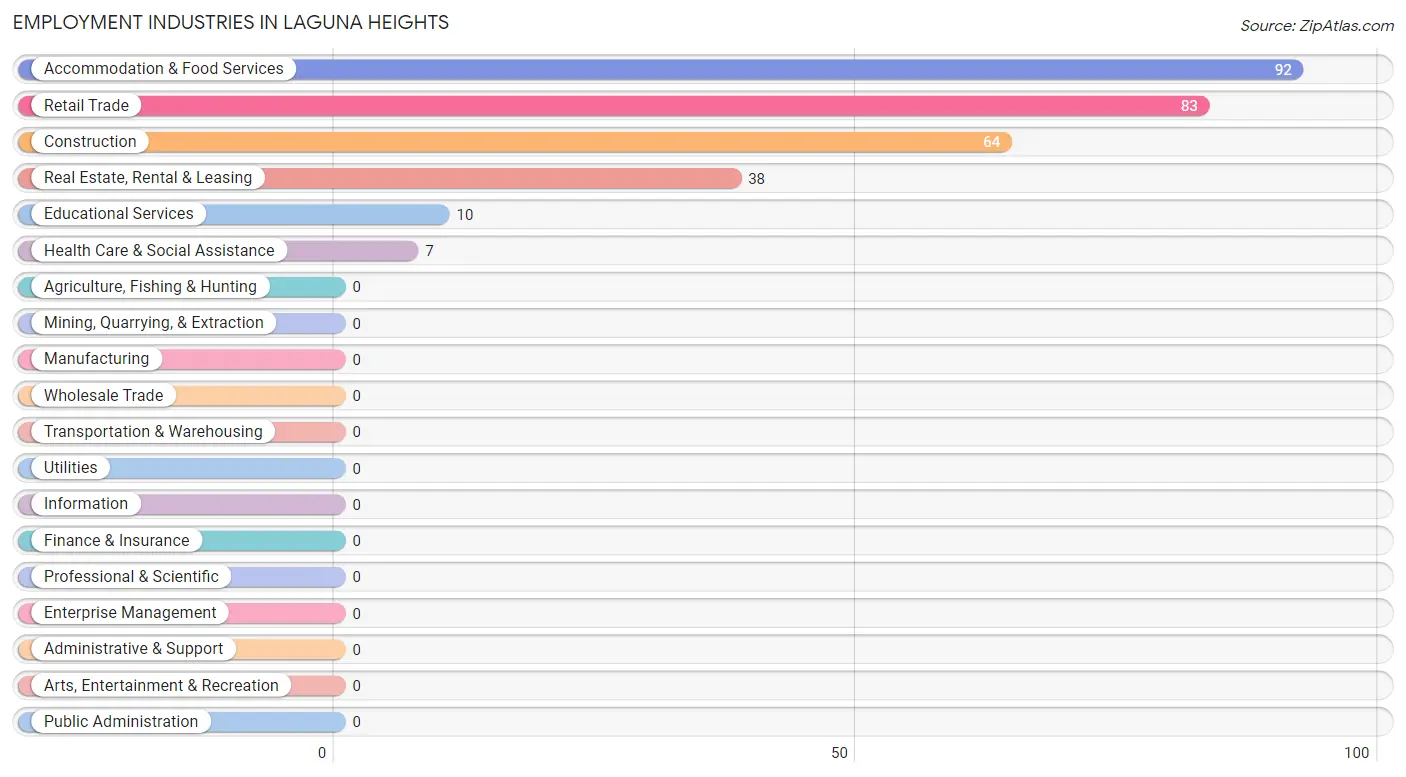
Employment Industries in Laguna Heights
The major employment industries in Laguna Heights include Accommodation & Food Services (92 | 31.3%), Retail Trade (83 | 28.2%), Construction (64 | 21.8%), Real Estate, Rental & Leasing (38 | 12.9%), and Educational Services (10 | 3.4%).
Employment Industries by Sex in Laguna Heights
The Laguna Heights industries that see more men than women are Construction (100.0%), Retail Trade (100.0%), and Real Estate, Rental & Leasing (100.0%), whereas the industries that tend to have a higher number of women are Health Care & Social Assistance (100.0%), Accommodation & Food Services (100.0%), and Educational Services (20.0%).
| Industry | Male | Female |
| Agriculture, Fishing & Hunting | 0 (0.0%) | 0 (0.0%) |
| Mining, Quarrying, & Extraction | 0 (0.0%) | 0 (0.0%) |
| Construction | 64 (100.0%) | 0 (0.0%) |
| Manufacturing | 0 (0.0%) | 0 (0.0%) |
| Wholesale Trade | 0 (0.0%) | 0 (0.0%) |
| Retail Trade | 83 (100.0%) | 0 (0.0%) |
| Transportation & Warehousing | 0 (0.0%) | 0 (0.0%) |
| Utilities | 0 (0.0%) | 0 (0.0%) |
| Information | 0 (0.0%) | 0 (0.0%) |
| Finance & Insurance | 0 (0.0%) | 0 (0.0%) |
| Real Estate, Rental & Leasing | 38 (100.0%) | 0 (0.0%) |
| Professional & Scientific | 0 (0.0%) | 0 (0.0%) |
| Enterprise Management | 0 (0.0%) | 0 (0.0%) |
| Administrative & Support | 0 (0.0%) | 0 (0.0%) |
| Educational Services | 8 (80.0%) | 2 (20.0%) |
| Health Care & Social Assistance | 0 (0.0%) | 7 (100.0%) |
| Arts, Entertainment & Recreation | 0 (0.0%) | 0 (0.0%) |
| Accommodation & Food Services | 0 (0.0%) | 92 (100.0%) |
| Public Administration | 0 (0.0%) | 0 (0.0%) |
| Total | 193 (65.6%) | 101 (34.4%) |
Education in Laguna Heights
School Enrollment in Laguna Heights
The most common levels of schooling among the 394 students in Laguna Heights are high school (132 | 33.5%), elementary school (99 | 25.1%), and middle school (72 | 18.3%).
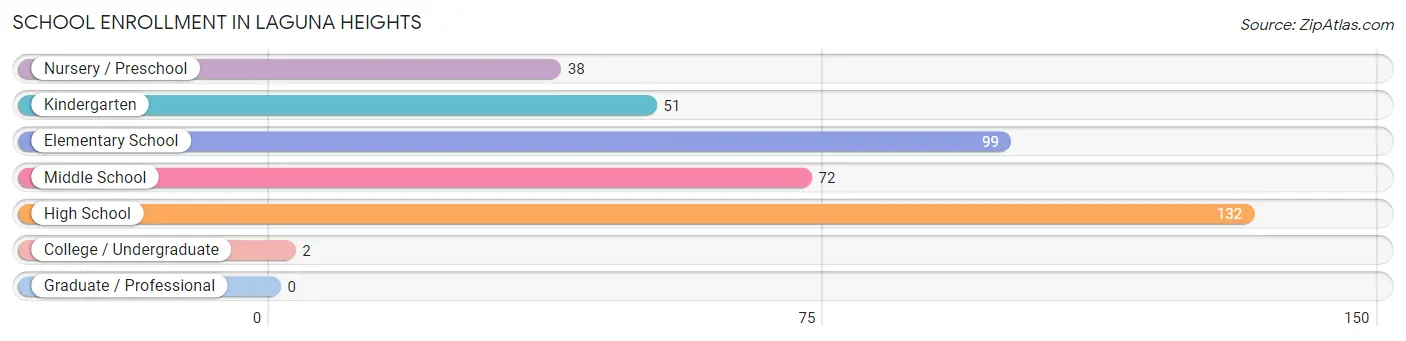
| School Level | # Students | % Students |
| Nursery / Preschool | 38 | 9.6% |
| Kindergarten | 51 | 12.9% |
| Elementary School | 99 | 25.1% |
| Middle School | 72 | 18.3% |
| High School | 132 | 33.5% |
| College / Undergraduate | 2 | 0.5% |
| Graduate / Professional | 0 | 0.0% |
| Total | 394 | 100.0% |
School Enrollment by Age by Funding Source in Laguna Heights
Out of a total of 394 students who are enrolled in schools in Laguna Heights, 2 (0.5%) attend a private institution, while the remaining 392 (99.5%) are enrolled in public schools. The age group of 20 to 24 year olds has the highest likelihood of being enrolled in private schools, with 2 (100.0% in the age bracket) enrolled. Conversely, the age group of 3 to 4 year olds has the lowest likelihood of being enrolled in a private school, with 89 (100.0% in the age bracket) attending a public institution.
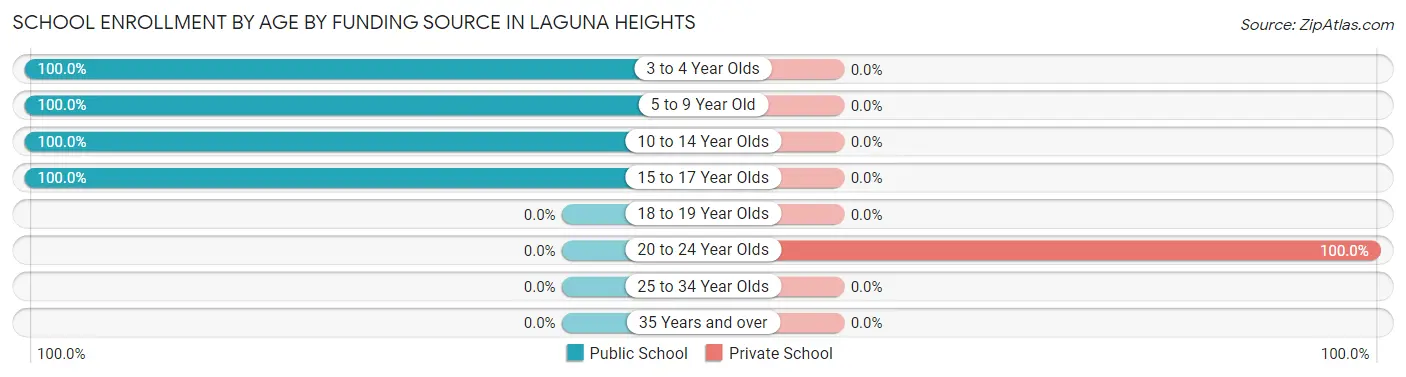
| Age Bracket | Public School | Private School |
| 3 to 4 Year Olds | 89 (100.0%) | 0 (0.0%) |
| 5 to 9 Year Old | 99 (100.0%) | 0 (0.0%) |
| 10 to 14 Year Olds | 105 (100.0%) | 0 (0.0%) |
| 15 to 17 Year Olds | 99 (100.0%) | 0 (0.0%) |
| 18 to 19 Year Olds | 0 (0.0%) | 0 (0.0%) |
| 20 to 24 Year Olds | 0 (0.0%) | 2 (100.0%) |
| 25 to 34 Year Olds | 0 (0.0%) | 0 (0.0%) |
| 35 Years and over | 0 (0.0%) | 0 (0.0%) |
| Total | 392 (99.5%) | 2 (0.5%) |
Educational Attainment by Field of Study in Laguna Heights
| Field of Study | # Graduates | % Graduates |
| Computers & Mathematics | 0 | 0.0% |
| Bio, Nature & Agricultural | 0 | 0.0% |
| Physical & Health Sciences | 0 | 0.0% |
| Psychology | 0 | 0.0% |
| Social Sciences | 0 | 0.0% |
| Engineering | 0 | 0.0% |
| Multidisciplinary Studies | 0 | 0.0% |
| Science & Technology | 0 | 0.0% |
| Business | 0 | 0.0% |
| Education | 0 | 0.0% |
| Literature & Languages | 0 | 0.0% |
| Liberal Arts & History | 0 | 0.0% |
| Visual & Performing Arts | 0 | 0.0% |
| Communications | 0 | 0.0% |
| Arts & Humanities | 0 | 0.0% |
| Total | 0 | 0.0% |
Transportation & Commute in Laguna Heights
Vehicle Availability by Sex in Laguna Heights
The most prevalent vehicle ownership categories in Laguna Heights are males with 1 vehicle (185, accounting for 95.9%) and females with 1 vehicle (92, making up 186.9%).
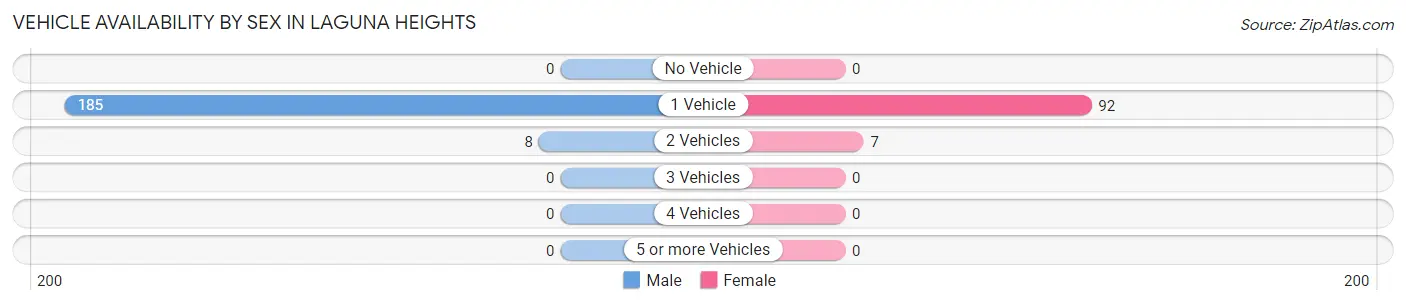
| Vehicles Available | Male | Female |
| No Vehicle | 0 (0.0%) | 0 (0.0%) |
| 1 Vehicle | 185 (95.9%) | 92 (92.9%) |
| 2 Vehicles | 8 (4.2%) | 7 (7.1%) |
| 3 Vehicles | 0 (0.0%) | 0 (0.0%) |
| 4 Vehicles | 0 (0.0%) | 0 (0.0%) |
| 5 or more Vehicles | 0 (0.0%) | 0 (0.0%) |
| Total | 193 (100.0%) | 99 (100.0%) |
Commute Time in Laguna Heights
The most frequently occuring commute durations in Laguna Heights are 15 to 19 minutes (130 commuters, 44.2%), 10 to 14 minutes (102 commuters, 34.7%), and 5 to 9 minutes (55 commuters, 18.7%).
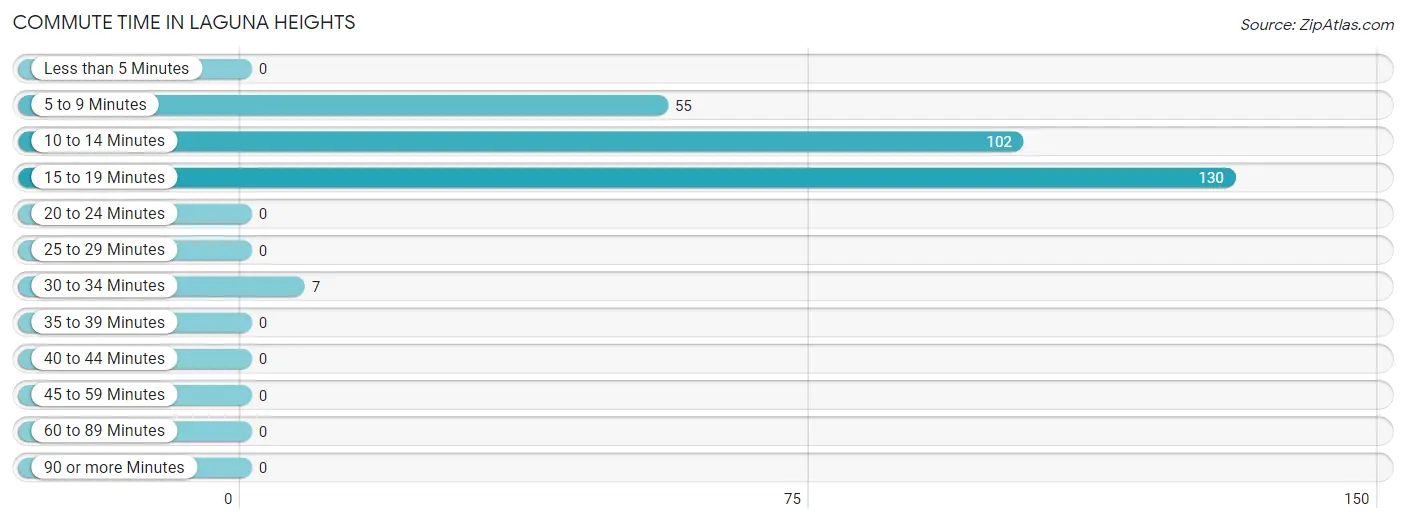
| Commute Time | # Commuters | % Commuters |
| Less than 5 Minutes | 0 | 0.0% |
| 5 to 9 Minutes | 55 | 18.7% |
| 10 to 14 Minutes | 102 | 34.7% |
| 15 to 19 Minutes | 130 | 44.2% |
| 20 to 24 Minutes | 0 | 0.0% |
| 25 to 29 Minutes | 0 | 0.0% |
| 30 to 34 Minutes | 7 | 2.4% |
| 35 to 39 Minutes | 0 | 0.0% |
| 40 to 44 Minutes | 0 | 0.0% |
| 45 to 59 Minutes | 0 | 0.0% |
| 60 to 89 Minutes | 0 | 0.0% |
| 90 or more Minutes | 0 | 0.0% |
Commute Time by Sex in Laguna Heights
The most common commute times in Laguna Heights are 10 to 14 minutes (102 commuters, 52.8%) for males and 15 to 19 minutes (92 commuters, 91.1%) for females.
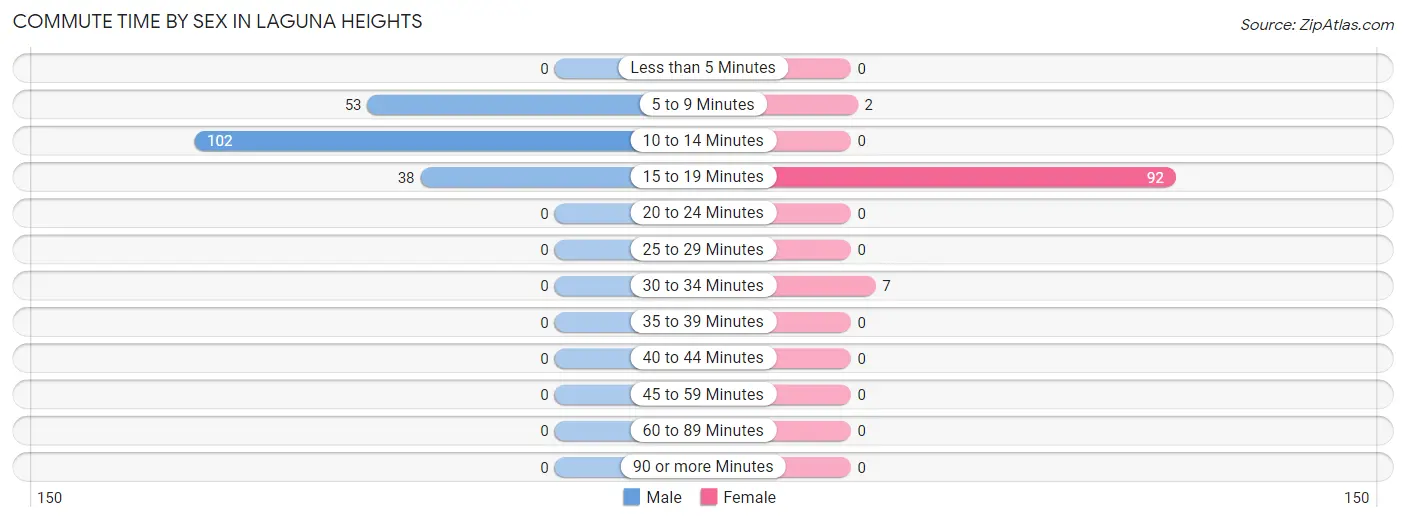
| Commute Time | Male | Female |
| Less than 5 Minutes | 0 (0.0%) | 0 (0.0%) |
| 5 to 9 Minutes | 53 (27.5%) | 2 (2.0%) |
| 10 to 14 Minutes | 102 (52.8%) | 0 (0.0%) |
| 15 to 19 Minutes | 38 (19.7%) | 92 (91.1%) |
| 20 to 24 Minutes | 0 (0.0%) | 0 (0.0%) |
| 25 to 29 Minutes | 0 (0.0%) | 0 (0.0%) |
| 30 to 34 Minutes | 0 (0.0%) | 7 (6.9%) |
| 35 to 39 Minutes | 0 (0.0%) | 0 (0.0%) |
| 40 to 44 Minutes | 0 (0.0%) | 0 (0.0%) |
| 45 to 59 Minutes | 0 (0.0%) | 0 (0.0%) |
| 60 to 89 Minutes | 0 (0.0%) | 0 (0.0%) |
| 90 or more Minutes | 0 (0.0%) | 0 (0.0%) |
Time of Departure to Work by Sex in Laguna Heights
The most frequent times of departure to work in Laguna Heights are 8:00 AM to 8:29 AM (185, 95.9%) for males and 9:00 AM to 9:59 AM (92, 91.1%) for females.
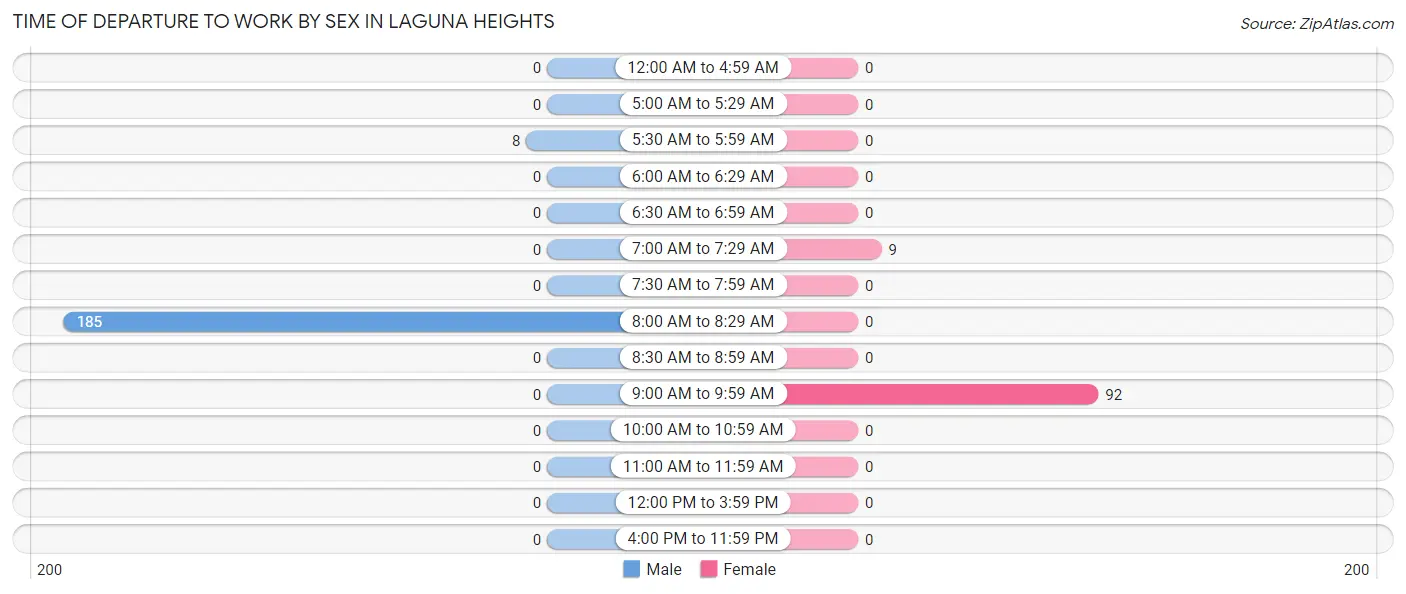
| Time of Departure | Male | Female |
| 12:00 AM to 4:59 AM | 0 (0.0%) | 0 (0.0%) |
| 5:00 AM to 5:29 AM | 0 (0.0%) | 0 (0.0%) |
| 5:30 AM to 5:59 AM | 8 (4.2%) | 0 (0.0%) |
| 6:00 AM to 6:29 AM | 0 (0.0%) | 0 (0.0%) |
| 6:30 AM to 6:59 AM | 0 (0.0%) | 0 (0.0%) |
| 7:00 AM to 7:29 AM | 0 (0.0%) | 9 (8.9%) |
| 7:30 AM to 7:59 AM | 0 (0.0%) | 0 (0.0%) |
| 8:00 AM to 8:29 AM | 185 (95.9%) | 0 (0.0%) |
| 8:30 AM to 8:59 AM | 0 (0.0%) | 0 (0.0%) |
| 9:00 AM to 9:59 AM | 0 (0.0%) | 92 (91.1%) |
| 10:00 AM to 10:59 AM | 0 (0.0%) | 0 (0.0%) |
| 11:00 AM to 11:59 AM | 0 (0.0%) | 0 (0.0%) |
| 12:00 PM to 3:59 PM | 0 (0.0%) | 0 (0.0%) |
| 4:00 PM to 11:59 PM | 0 (0.0%) | 0 (0.0%) |
| Total | 193 (100.0%) | 101 (100.0%) |
Housing Occupancy in Laguna Heights
Occupancy by Ownership in Laguna Heights
Of the total 415 dwellings in Laguna Heights, owner-occupied units account for 154 (37.1%), while renter-occupied units make up 261 (62.9%).
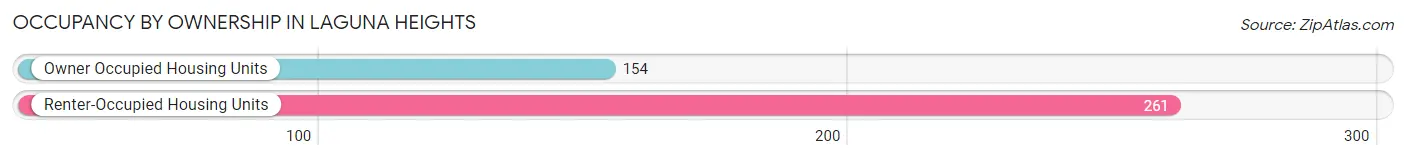
| Occupancy | # Housing Units | % Housing Units |
| Owner Occupied Housing Units | 154 | 37.1% |
| Renter-Occupied Housing Units | 261 | 62.9% |
| Total Occupied Housing Units | 415 | 100.0% |
Occupancy by Household Size in Laguna Heights
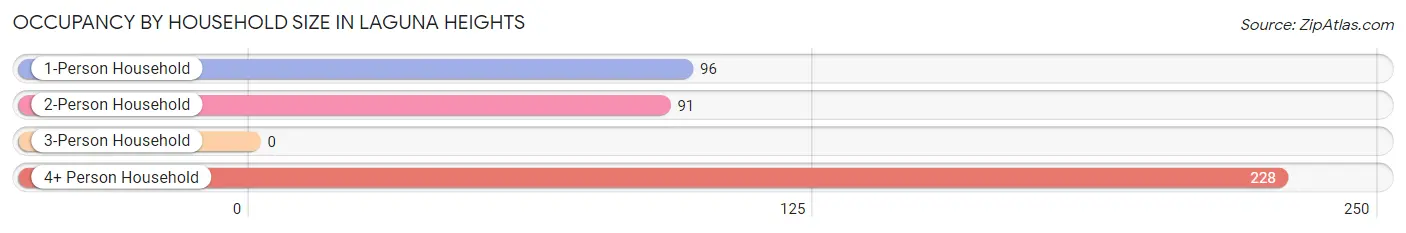
| Household Size | # Housing Units | % Housing Units |
| 1-Person Household | 96 | 23.1% |
| 2-Person Household | 91 | 21.9% |
| 3-Person Household | 0 | 0.0% |
| 4+ Person Household | 228 | 54.9% |
| Total Housing Units | 415 | 100.0% |
Occupancy by Ownership by Household Size in Laguna Heights
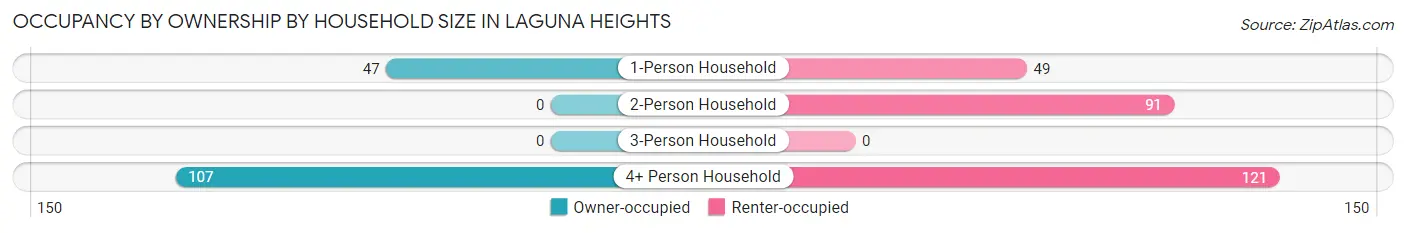
| Household Size | Owner-occupied | Renter-occupied |
| 1-Person Household | 47 (49.0%) | 49 (51.0%) |
| 2-Person Household | 0 (0.0%) | 91 (100.0%) |
| 3-Person Household | 0 (0.0%) | 0 (0.0%) |
| 4+ Person Household | 107 (46.9%) | 121 (53.1%) |
| Total Housing Units | 154 (37.1%) | 261 (62.9%) |
Occupancy by Educational Attainment in Laguna Heights
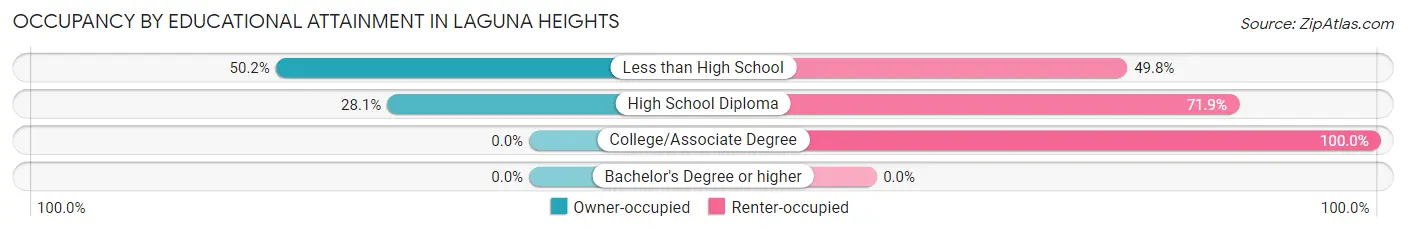
| Household Size | Owner-occupied | Renter-occupied |
| Less than High School | 109 (50.2%) | 108 (49.8%) |
| High School Diploma | 45 (28.1%) | 115 (71.9%) |
| College/Associate Degree | 0 (0.0%) | 38 (100.0%) |
| Bachelor's Degree or higher | 0 (0.0%) | 0 (0.0%) |
Occupancy by Age of Householder in Laguna Heights
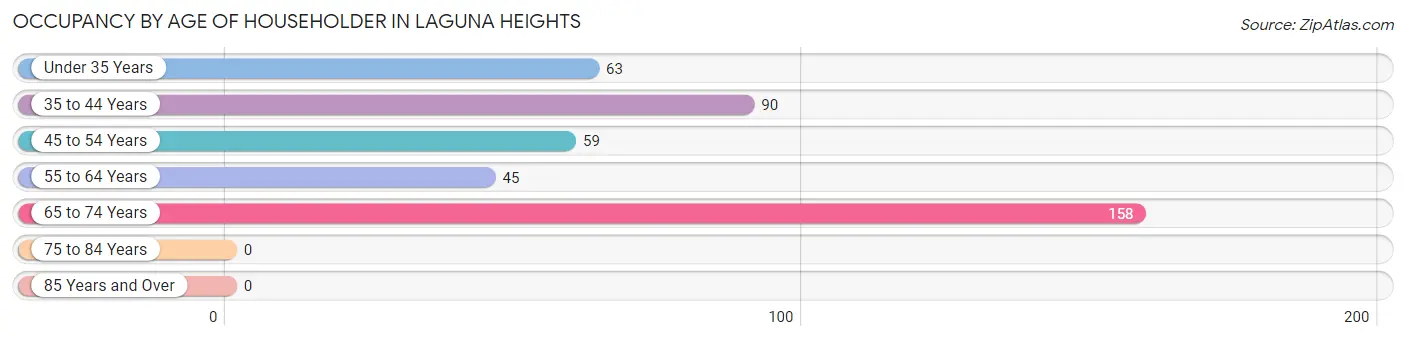
| Age Bracket | # Households | % Households |
| Under 35 Years | 63 | 15.2% |
| 35 to 44 Years | 90 | 21.7% |
| 45 to 54 Years | 59 | 14.2% |
| 55 to 64 Years | 45 | 10.8% |
| 65 to 74 Years | 158 | 38.1% |
| 75 to 84 Years | 0 | 0.0% |
| 85 Years and Over | 0 | 0.0% |
| Total | 415 | 100.0% |
Housing Finances in Laguna Heights
Median Income by Occupancy in Laguna Heights
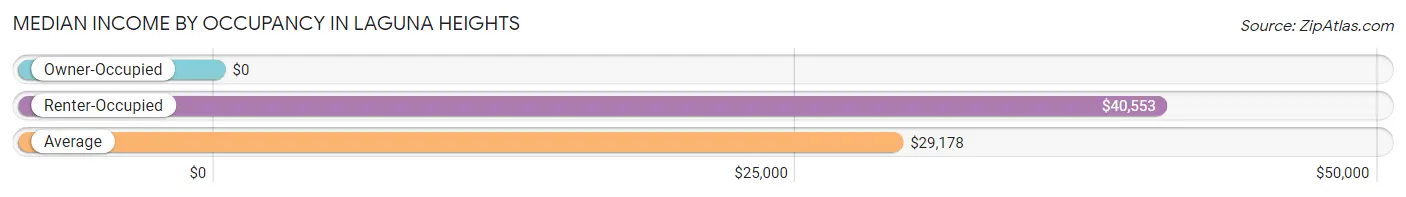
| Occupancy Type | # Households | Median Income |
| Owner-Occupied | 154 (37.1%) | $0 |
| Renter-Occupied | 261 (62.9%) | $40,553 |
| Average | 415 (100.0%) | $29,178 |
Occupancy by Householder Income Bracket in Laguna Heights
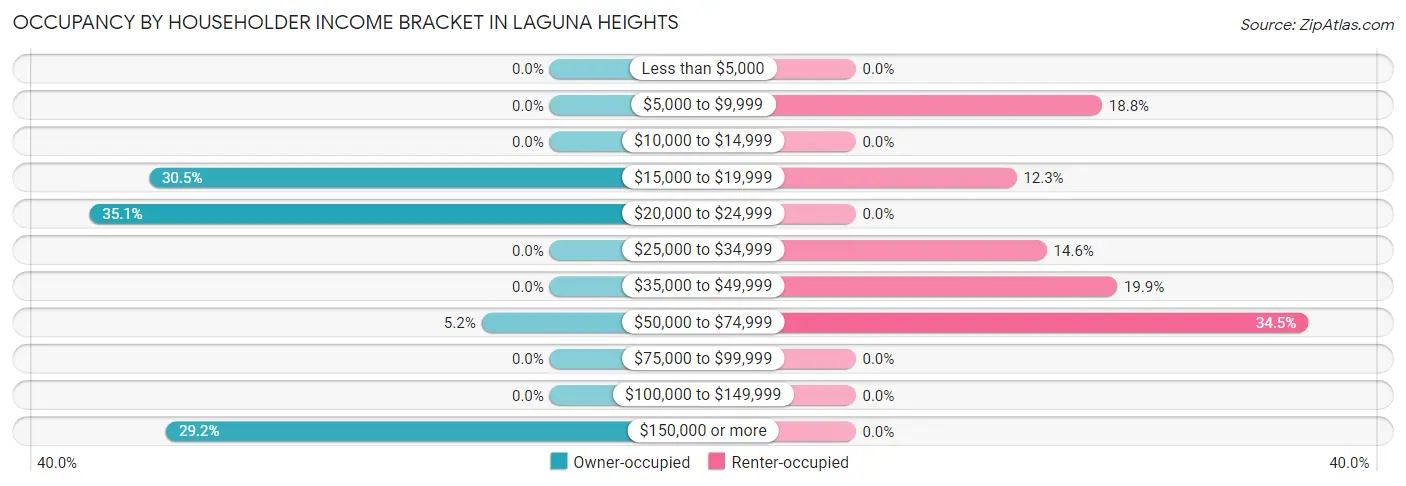
| Income Bracket | Owner-occupied | Renter-occupied |
| Less than $5,000 | 0 (0.0%) | 0 (0.0%) |
| $5,000 to $9,999 | 0 (0.0%) | 49 (18.8%) |
| $10,000 to $14,999 | 0 (0.0%) | 0 (0.0%) |
| $15,000 to $19,999 | 47 (30.5%) | 32 (12.3%) |
| $20,000 to $24,999 | 54 (35.1%) | 0 (0.0%) |
| $25,000 to $34,999 | 0 (0.0%) | 38 (14.6%) |
| $35,000 to $49,999 | 0 (0.0%) | 52 (19.9%) |
| $50,000 to $74,999 | 8 (5.2%) | 90 (34.5%) |
| $75,000 to $99,999 | 0 (0.0%) | 0 (0.0%) |
| $100,000 to $149,999 | 0 (0.0%) | 0 (0.0%) |
| $150,000 or more | 45 (29.2%) | 0 (0.0%) |
| Total | 154 (100.0%) | 261 (100.0%) |
Monthly Housing Cost Tiers in Laguna Heights
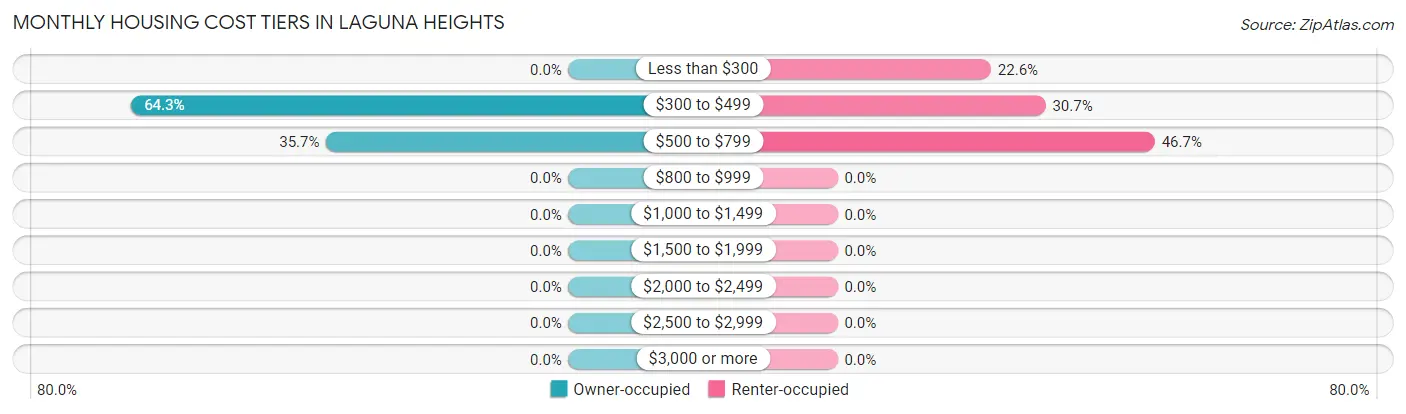
| Monthly Cost | Owner-occupied | Renter-occupied |
| Less than $300 | 0 (0.0%) | 59 (22.6%) |
| $300 to $499 | 99 (64.3%) | 80 (30.6%) |
| $500 to $799 | 55 (35.7%) | 122 (46.7%) |
| $800 to $999 | 0 (0.0%) | 0 (0.0%) |
| $1,000 to $1,499 | 0 (0.0%) | 0 (0.0%) |
| $1,500 to $1,999 | 0 (0.0%) | 0 (0.0%) |
| $2,000 to $2,499 | 0 (0.0%) | 0 (0.0%) |
| $2,500 to $2,999 | 0 (0.0%) | 0 (0.0%) |
| $3,000 or more | 0 (0.0%) | 0 (0.0%) |
| Total | 154 (100.0%) | 261 (100.0%) |
Physical Housing Characteristics in Laguna Heights
Housing Structures in Laguna Heights
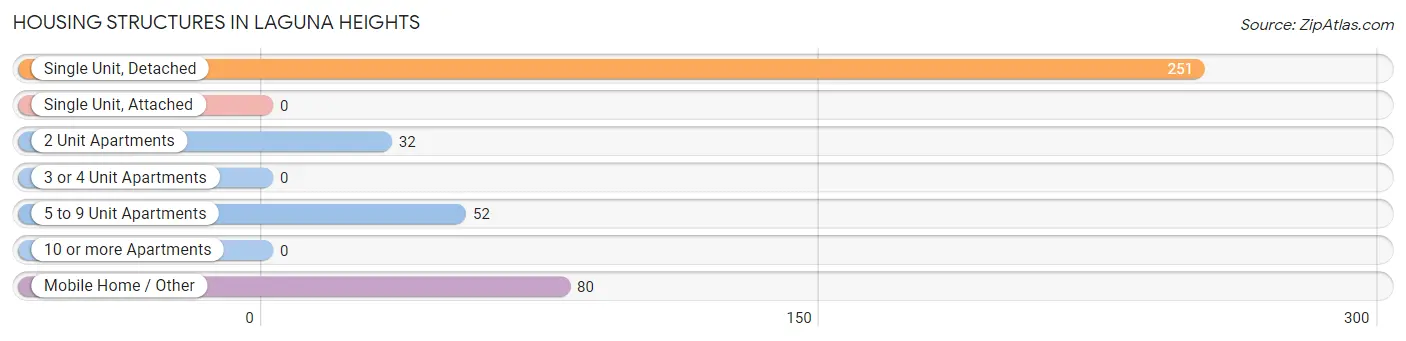
| Structure Type | # Housing Units | % Housing Units |
| Single Unit, Detached | 251 | 60.5% |
| Single Unit, Attached | 0 | 0.0% |
| 2 Unit Apartments | 32 | 7.7% |
| 3 or 4 Unit Apartments | 0 | 0.0% |
| 5 to 9 Unit Apartments | 52 | 12.5% |
| 10 or more Apartments | 0 | 0.0% |
| Mobile Home / Other | 80 | 19.3% |
| Total | 415 | 100.0% |
Housing Structures by Occupancy in Laguna Heights
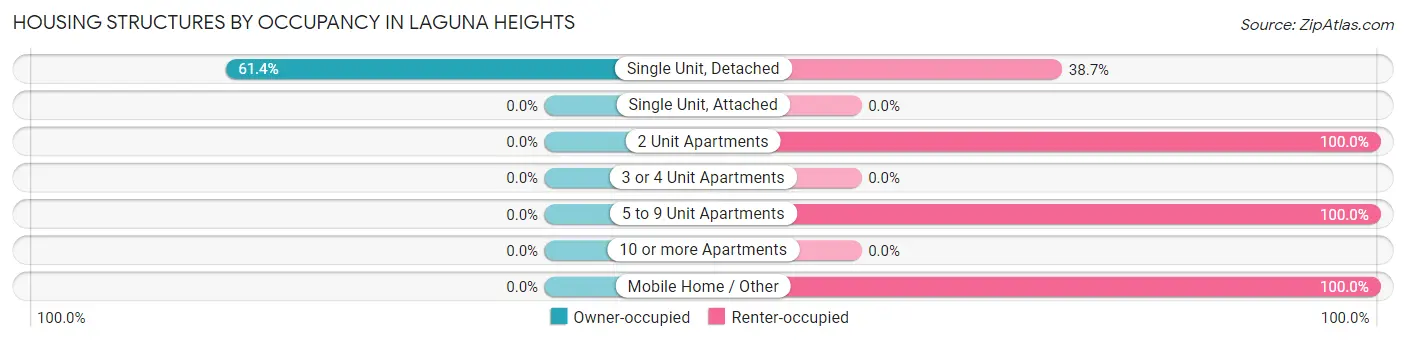
| Structure Type | Owner-occupied | Renter-occupied |
| Single Unit, Detached | 154 (61.4%) | 97 (38.7%) |
| Single Unit, Attached | 0 (0.0%) | 0 (0.0%) |
| 2 Unit Apartments | 0 (0.0%) | 32 (100.0%) |
| 3 or 4 Unit Apartments | 0 (0.0%) | 0 (0.0%) |
| 5 to 9 Unit Apartments | 0 (0.0%) | 52 (100.0%) |
| 10 or more Apartments | 0 (0.0%) | 0 (0.0%) |
| Mobile Home / Other | 0 (0.0%) | 80 (100.0%) |
| Total | 154 (37.1%) | 261 (62.9%) |
Housing Structures by Number of Rooms in Laguna Heights
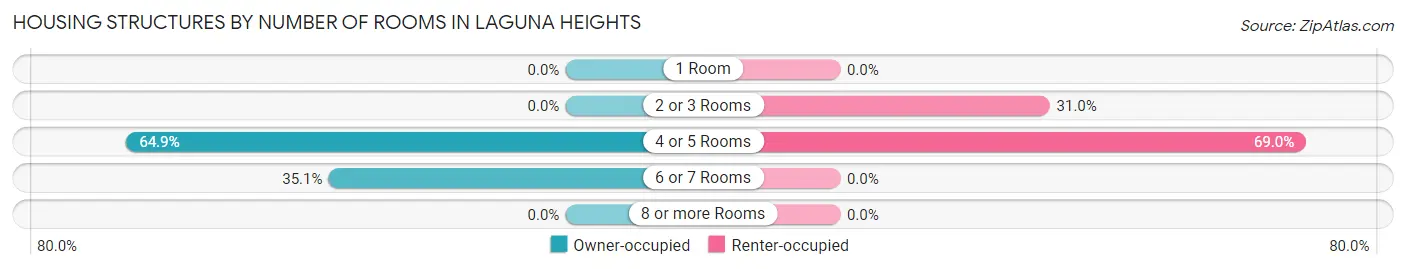
| Number of Rooms | Owner-occupied | Renter-occupied |
| 1 Room | 0 (0.0%) | 0 (0.0%) |
| 2 or 3 Rooms | 0 (0.0%) | 81 (31.0%) |
| 4 or 5 Rooms | 100 (64.9%) | 180 (69.0%) |
| 6 or 7 Rooms | 54 (35.1%) | 0 (0.0%) |
| 8 or more Rooms | 0 (0.0%) | 0 (0.0%) |
| Total | 154 (100.0%) | 261 (100.0%) |
Housing Structure by Heating Type in Laguna Heights
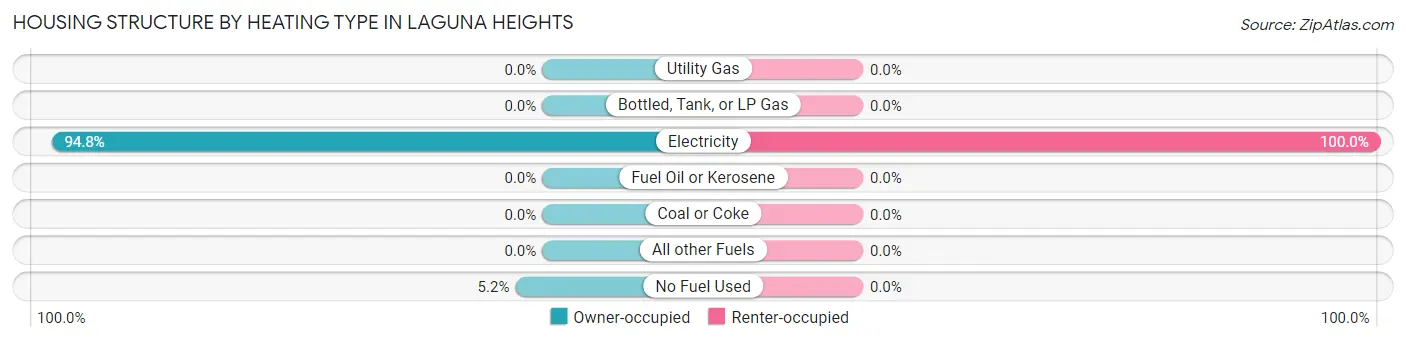
| Heating Type | Owner-occupied | Renter-occupied |
| Utility Gas | 0 (0.0%) | 0 (0.0%) |
| Bottled, Tank, or LP Gas | 0 (0.0%) | 0 (0.0%) |
| Electricity | 146 (94.8%) | 261 (100.0%) |
| Fuel Oil or Kerosene | 0 (0.0%) | 0 (0.0%) |
| Coal or Coke | 0 (0.0%) | 0 (0.0%) |
| All other Fuels | 0 (0.0%) | 0 (0.0%) |
| No Fuel Used | 8 (5.2%) | 0 (0.0%) |
| Total | 154 (100.0%) | 261 (100.0%) |
Household Vehicle Usage in Laguna Heights
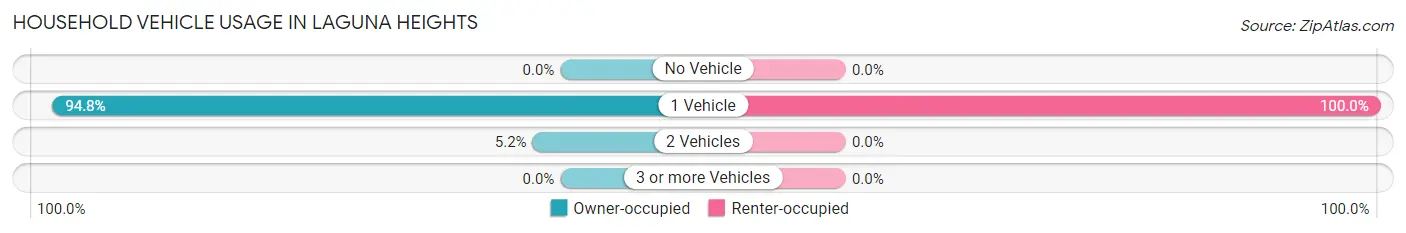
| Vehicles per Household | Owner-occupied | Renter-occupied |
| No Vehicle | 0 (0.0%) | 0 (0.0%) |
| 1 Vehicle | 146 (94.8%) | 261 (100.0%) |
| 2 Vehicles | 8 (5.2%) | 0 (0.0%) |
| 3 or more Vehicles | 0 (0.0%) | 0 (0.0%) |
| Total | 154 (100.0%) | 261 (100.0%) |
Real Estate & Mortgages in Laguna Heights
Real Estate and Mortgage Overview in Laguna Heights
| Characteristic | Without Mortgage | With Mortgage |
| Housing Units | 107 | 47 |
| Median Property Value | $98,400 | $0 |
| Median Household Income | - | - |
| Monthly Housing Costs | $416 | $0 |
| Real Estate Taxes | $2,009 | $0 |
Property Value by Mortgage Status in Laguna Heights
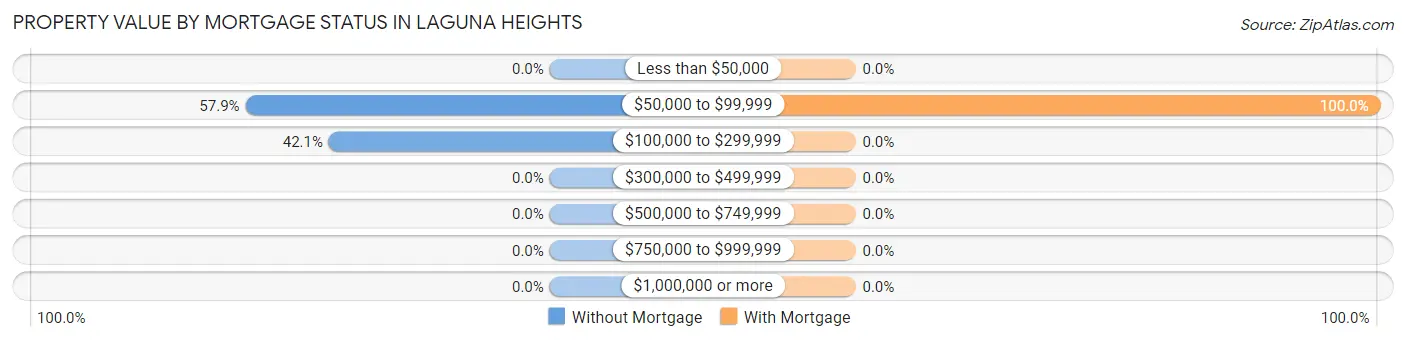
| Property Value | Without Mortgage | With Mortgage |
| Less than $50,000 | 0 (0.0%) | 0 (0.0%) |
| $50,000 to $99,999 | 62 (57.9%) | 47 (100.0%) |
| $100,000 to $299,999 | 45 (42.1%) | 0 (0.0%) |
| $300,000 to $499,999 | 0 (0.0%) | 0 (0.0%) |
| $500,000 to $749,999 | 0 (0.0%) | 0 (0.0%) |
| $750,000 to $999,999 | 0 (0.0%) | 0 (0.0%) |
| $1,000,000 or more | 0 (0.0%) | 0 (0.0%) |
| Total | 107 (100.0%) | 47 (100.0%) |
Household Income by Mortgage Status in Laguna Heights
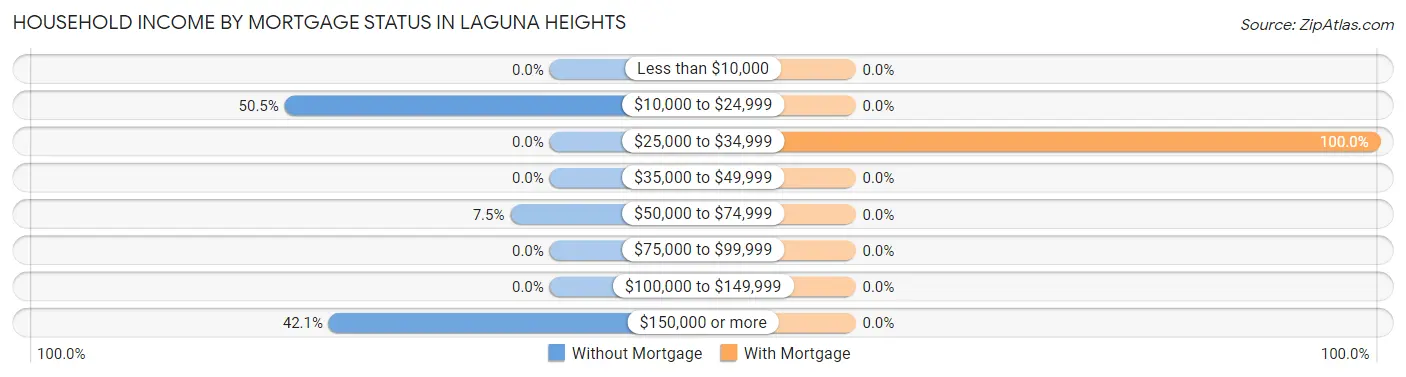
| Household Income | Without Mortgage | With Mortgage |
| Less than $10,000 | 0 (0.0%) | 0 (0.0%) |
| $10,000 to $24,999 | 54 (50.5%) | 0 (0.0%) |
| $25,000 to $34,999 | 0 (0.0%) | 47 (100.0%) |
| $35,000 to $49,999 | 0 (0.0%) | 0 (0.0%) |
| $50,000 to $74,999 | 8 (7.5%) | 0 (0.0%) |
| $75,000 to $99,999 | 0 (0.0%) | 0 (0.0%) |
| $100,000 to $149,999 | 0 (0.0%) | 0 (0.0%) |
| $150,000 or more | 45 (42.1%) | 0 (0.0%) |
| Total | 107 (100.0%) | 47 (100.0%) |
Property Value to Household Income Ratio in Laguna Heights
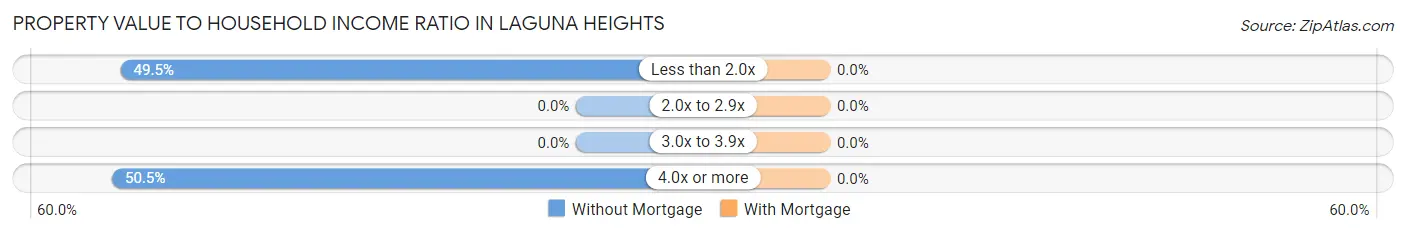
| Value-to-Income Ratio | Without Mortgage | With Mortgage |
| Less than 2.0x | 53 (49.5%) | 0 (0.0%) |
| 2.0x to 2.9x | 0 (0.0%) | 0 (0.0%) |
| 3.0x to 3.9x | 0 (0.0%) | 0 (0.0%) |
| 4.0x or more | 54 (50.5%) | 0 (0.0%) |
| Total | 107 (100.0%) | 47 (100.0%) |
Real Estate Taxes by Mortgage Status in Laguna Heights
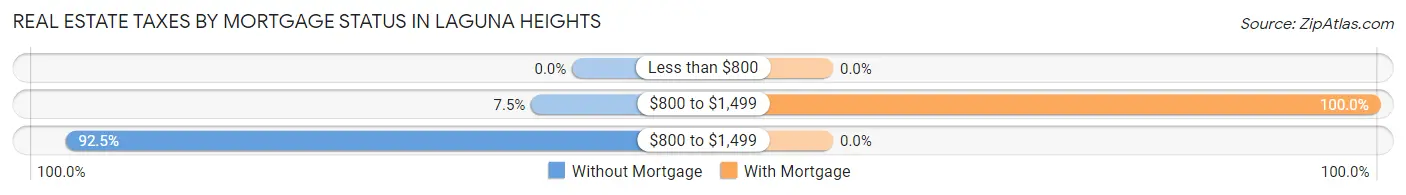
| Property Taxes | Without Mortgage | With Mortgage |
| Less than $800 | 0 (0.0%) | 0 (0.0%) |
| $800 to $1,499 | 8 (7.5%) | 47 (100.0%) |
| $800 to $1,499 | 99 (92.5%) | 0 (0.0%) |
| Total | 107 (100.0%) | 47 (100.0%) |
Health & Disability in Laguna Heights
Health Insurance Coverage by Age in Laguna Heights
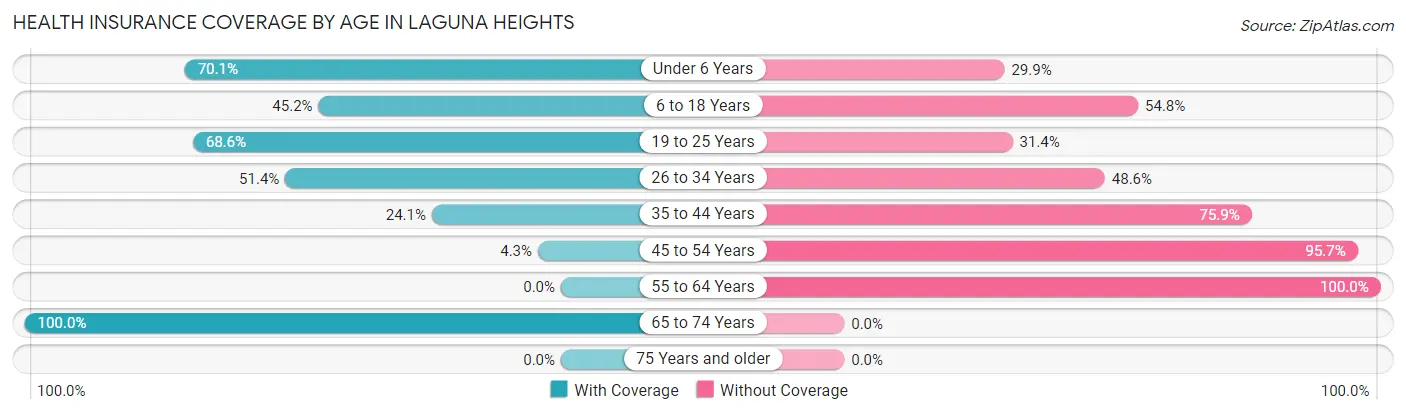
| Age Bracket | With Coverage | Without Coverage |
| Under 6 Years | 209 (70.1%) | 89 (29.9%) |
| 6 to 18 Years | 137 (45.2%) | 166 (54.8%) |
| 19 to 25 Years | 70 (68.6%) | 32 (31.4%) |
| 26 to 34 Years | 73 (51.4%) | 69 (48.6%) |
| 35 to 44 Years | 52 (24.1%) | 164 (75.9%) |
| 45 to 54 Years | 7 (4.3%) | 156 (95.7%) |
| 55 to 64 Years | 0 (0.0%) | 45 (100.0%) |
| 65 to 74 Years | 213 (100.0%) | 0 (0.0%) |
| 75 Years and older | 0 (0.0%) | 0 (0.0%) |
| Total | 761 (51.3%) | 721 (48.6%) |
Health Insurance Coverage by Citizenship Status in Laguna Heights
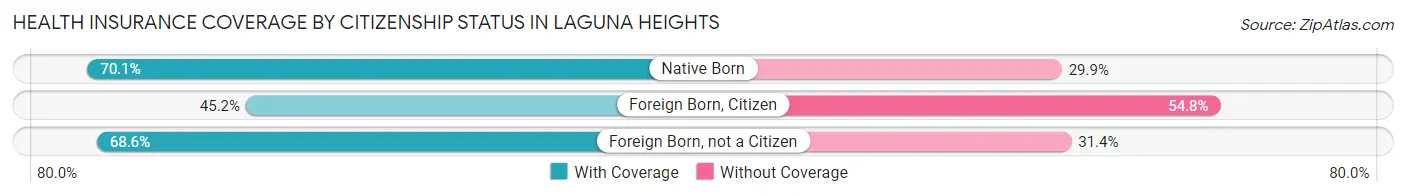
| Citizenship Status | With Coverage | Without Coverage |
| Native Born | 209 (70.1%) | 89 (29.9%) |
| Foreign Born, Citizen | 137 (45.2%) | 166 (54.8%) |
| Foreign Born, not a Citizen | 70 (68.6%) | 32 (31.4%) |
Health Insurance Coverage by Household Income in Laguna Heights
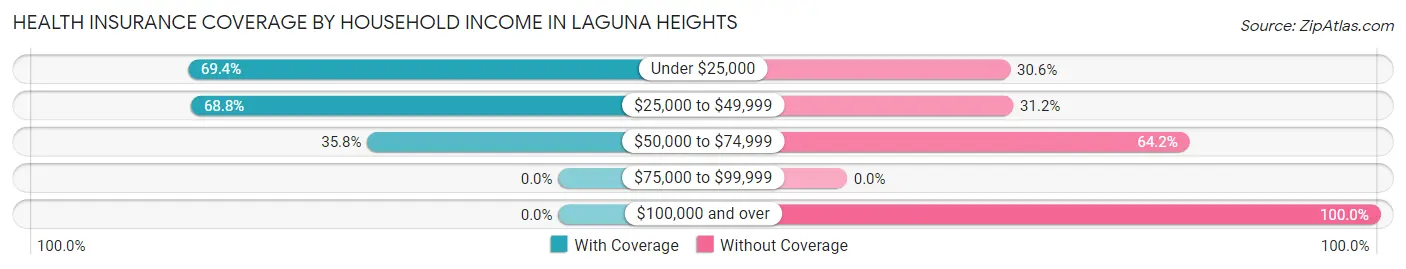
| Household Income | With Coverage | Without Coverage |
| Under $25,000 | 270 (69.4%) | 119 (30.6%) |
| $25,000 to $49,999 | 382 (68.8%) | 173 (31.2%) |
| $50,000 to $74,999 | 107 (35.8%) | 192 (64.2%) |
| $75,000 to $99,999 | 0 (0.0%) | 0 (0.0%) |
| $100,000 and over | 0 (0.0%) | 237 (100.0%) |
Public vs Private Health Insurance Coverage by Age in Laguna Heights
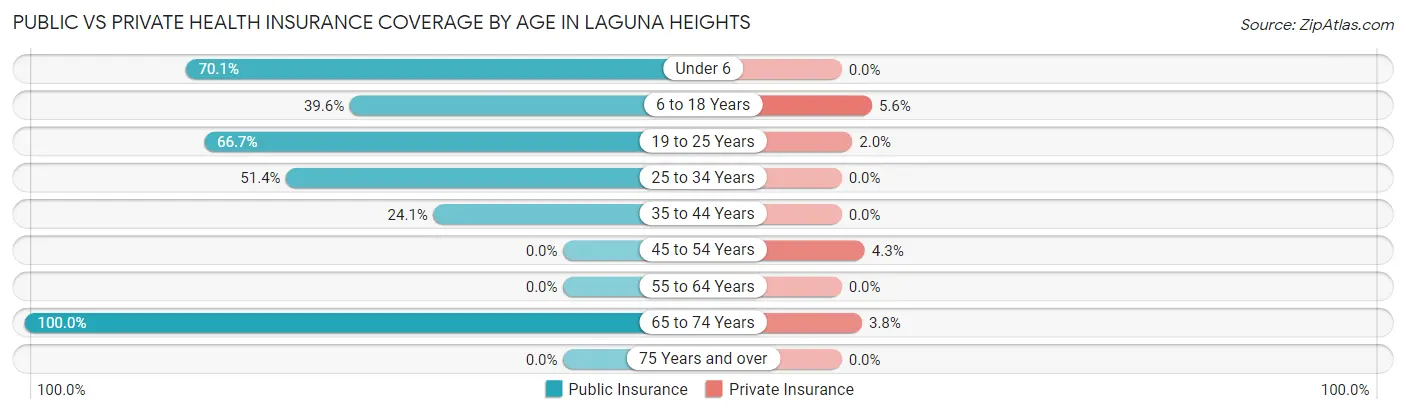
| Age Bracket | Public Insurance | Private Insurance |
| Under 6 | 209 (70.1%) | 0 (0.0%) |
| 6 to 18 Years | 120 (39.6%) | 17 (5.6%) |
| 19 to 25 Years | 68 (66.7%) | 2 (2.0%) |
| 25 to 34 Years | 73 (51.4%) | 0 (0.0%) |
| 35 to 44 Years | 52 (24.1%) | 0 (0.0%) |
| 45 to 54 Years | 0 (0.0%) | 7 (4.3%) |
| 55 to 64 Years | 0 (0.0%) | 0 (0.0%) |
| 65 to 74 Years | 213 (100.0%) | 8 (3.8%) |
| 75 Years and over | 0 (0.0%) | 0 (0.0%) |
| Total | 735 (49.6%) | 34 (2.3%) |
Disability Status by Sex by Age in Laguna Heights
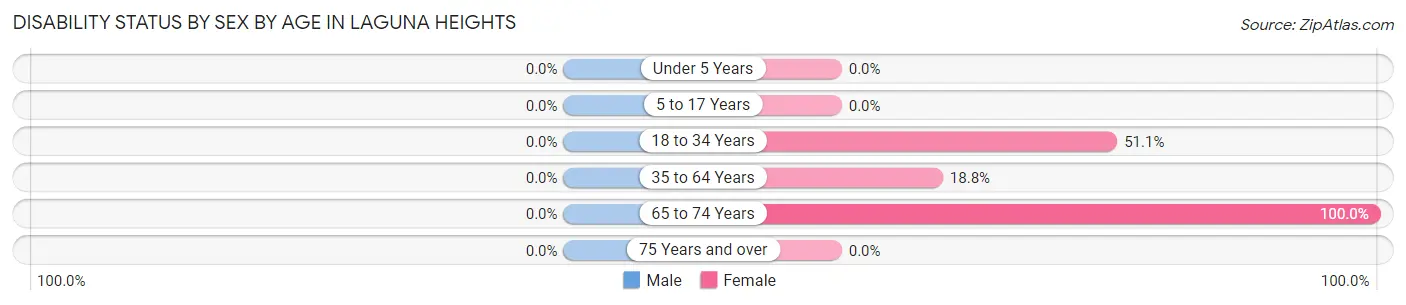
| Age Bracket | Male | Female |
| Under 5 Years | 0 (0.0%) | 0 (0.0%) |
| 5 to 17 Years | 0 (0.0%) | 0 (0.0%) |
| 18 to 34 Years | 0 (0.0%) | 68 (51.1%) |
| 35 to 64 Years | 0 (0.0%) | 52 (18.8%) |
| 65 to 74 Years | 0 (0.0%) | 151 (100.0%) |
| 75 Years and over | 0 (0.0%) | 0 (0.0%) |
Disability Class by Sex by Age in Laguna Heights
Disability Class: Hearing Difficulty
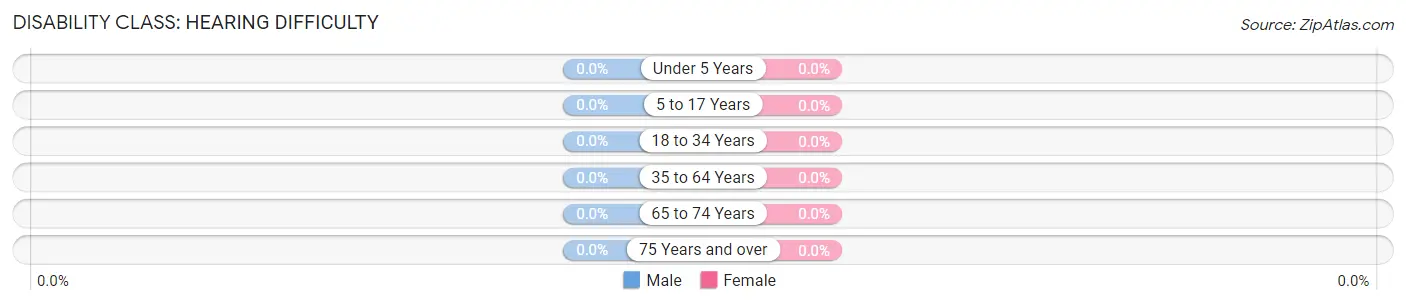
| Age Bracket | Male | Female |
| Under 5 Years | 0 (0.0%) | 0 (0.0%) |
| 5 to 17 Years | 0 (0.0%) | 0 (0.0%) |
| 18 to 34 Years | 0 (0.0%) | 0 (0.0%) |
| 35 to 64 Years | 0 (0.0%) | 0 (0.0%) |
| 65 to 74 Years | 0 (0.0%) | 0 (0.0%) |
| 75 Years and over | 0 (0.0%) | 0 (0.0%) |
Disability Class: Vision Difficulty
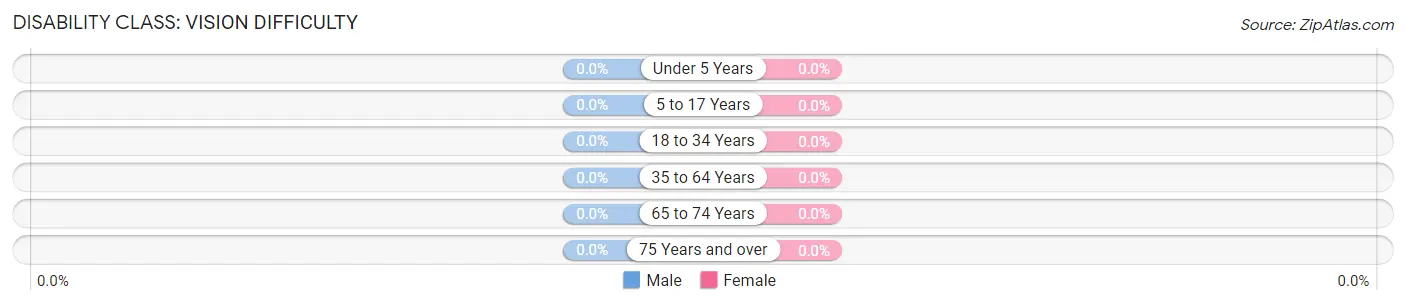
| Age Bracket | Male | Female |
| Under 5 Years | 0 (0.0%) | 0 (0.0%) |
| 5 to 17 Years | 0 (0.0%) | 0 (0.0%) |
| 18 to 34 Years | 0 (0.0%) | 0 (0.0%) |
| 35 to 64 Years | 0 (0.0%) | 0 (0.0%) |
| 65 to 74 Years | 0 (0.0%) | 0 (0.0%) |
| 75 Years and over | 0 (0.0%) | 0 (0.0%) |
Disability Class: Cognitive Difficulty
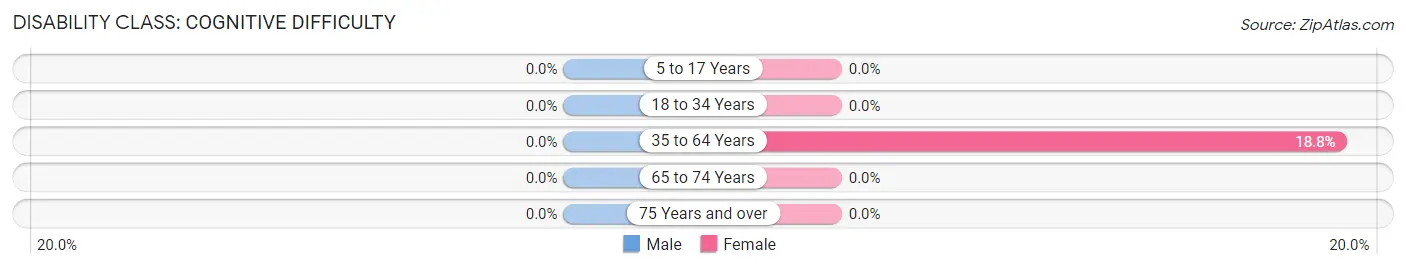
| Age Bracket | Male | Female |
| 5 to 17 Years | 0 (0.0%) | 0 (0.0%) |
| 18 to 34 Years | 0 (0.0%) | 0 (0.0%) |
| 35 to 64 Years | 0 (0.0%) | 52 (18.8%) |
| 65 to 74 Years | 0 (0.0%) | 0 (0.0%) |
| 75 Years and over | 0 (0.0%) | 0 (0.0%) |
Disability Class: Ambulatory Difficulty
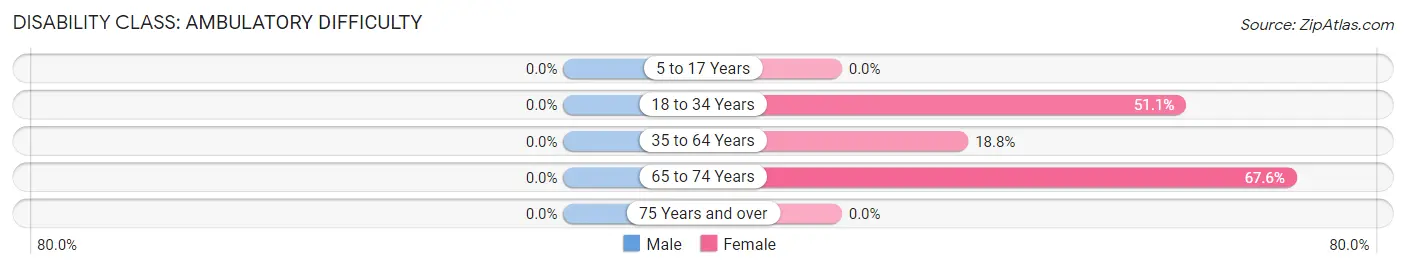
| Age Bracket | Male | Female |
| 5 to 17 Years | 0 (0.0%) | 0 (0.0%) |
| 18 to 34 Years | 0 (0.0%) | 68 (51.1%) |
| 35 to 64 Years | 0 (0.0%) | 52 (18.8%) |
| 65 to 74 Years | 0 (0.0%) | 102 (67.5%) |
| 75 Years and over | 0 (0.0%) | 0 (0.0%) |
Disability Class: Self-Care Difficulty
| Age Bracket | Male | Female |
| 5 to 17 Years | 0 (0.0%) | 0 (0.0%) |
| 18 to 34 Years | 0 (0.0%) | 0 (0.0%) |
| 35 to 64 Years | 0 (0.0%) | 0 (0.0%) |
| 65 to 74 Years | 0 (0.0%) | 0 (0.0%) |
| 75 Years and over | 0 (0.0%) | 0 (0.0%) |
Technology Access in Laguna Heights
Computing Device Access in Laguna Heights
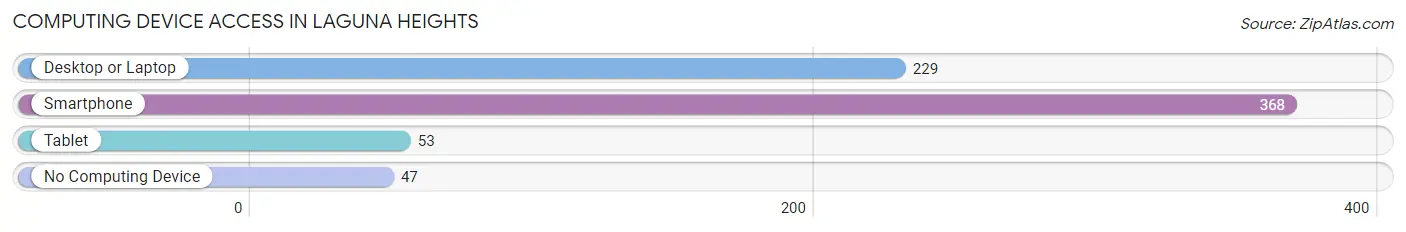
| Device Type | # Households | % Households |
| Desktop or Laptop | 229 | 55.2% |
| Smartphone | 368 | 88.7% |
| Tablet | 53 | 12.8% |
| No Computing Device | 47 | 11.3% |
| Total | 415 | 100.0% |
Internet Access in Laguna Heights
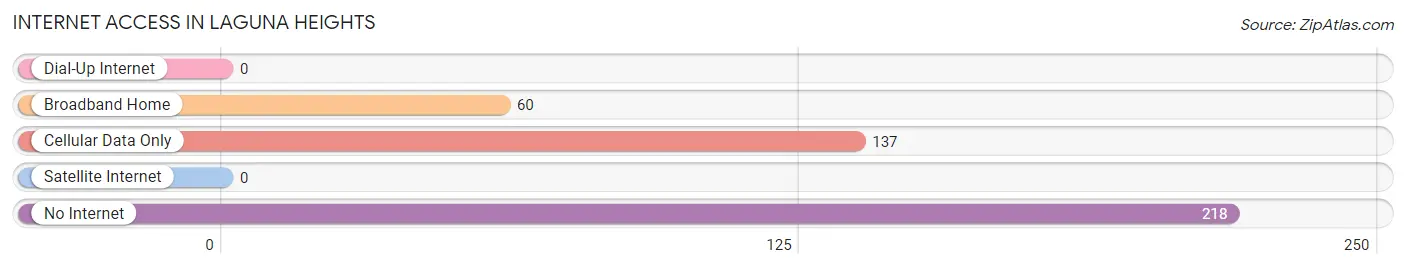
| Internet Type | # Households | % Households |
| Dial-Up Internet | 0 | 0.0% |
| Broadband Home | 60 | 14.5% |
| Cellular Data Only | 137 | 33.0% |
| Satellite Internet | 0 | 0.0% |
| No Internet | 218 | 52.5% |
| Total | 415 | 100.0% |
Laguna Heights Summary
Laguna Heights is a small unincorporated community located in Cameron County, Texas, United States. It is situated on the south shore of the Laguna Madre, a shallow lagoon that separates South Padre Island from the mainland. The community is part of the Brownsville–Harlingen Metropolitan Statistical Area.
History
The area that is now Laguna Heights was originally inhabited by the Karankawa Indians. The first European settlers arrived in the area in the late 19th century. The community was established in the early 20th century as a fishing village. It was named after the nearby Laguna Madre, which was named by Spanish explorers in the 16th century.
In the early 20th century, the area was a popular destination for sport fishing. In the 1950s, the community began to develop as a residential area. In the 1960s, the area was annexed by the City of South Padre Island.
Geography
Laguna Heights is located in Cameron County, Texas, United States. It is situated on the south shore of the Laguna Madre, a shallow lagoon that separates South Padre Island from the mainland. The community is part of the Brownsville–Harlingen Metropolitan Statistical Area.
The community is located at the intersection of State Highway 100 and County Road 101. It is bordered by the City of South Padre Island to the east and the City of Port Isabel to the west.
The climate in Laguna Heights is subtropical, with hot summers and mild winters. The average annual temperature is 75°F (24°C). The average annual precipitation is 22 inches (56 cm).
Economy
The economy of Laguna Heights is largely based on tourism and fishing. The area is a popular destination for sport fishing, and there are several marinas and boat ramps in the area.
The community is also home to several restaurants, bars, and shops. There are also several hotels and resorts in the area.
Demographics
As of the 2010 census, the population of Laguna Heights was 1,845. The racial makeup of the community was 79.3% White, 0.7% African American, 0.2% Native American, 0.2% Asian, 0.1% Pacific Islander, 17.7% from other races, and 1.9% from two or more races. Hispanic or Latino of any race were 95.2% of the population.
The median household income in Laguna Heights was $30,938, and the median family income was $35,938. The per capita income was $14,938. About 24.3% of families and 28.2% of the population were below the poverty line, including 37.3% of those under age 18 and 16.2% of those age 65 or over.
Common Questions
What is Per Capita Income in Laguna Heights?
Per Capita income in Laguna Heights is $14,751.
What is the Median Family Income in Laguna Heights?
Median Family Income in Laguna Heights is $41,707.
What is the Median Household income in Laguna Heights?
Median Household Income in Laguna Heights is $29,178.
What is Inequality or Gini Index in Laguna Heights?
Inequality or Gini Index in Laguna Heights is 0.49.
What is the Total Population of Laguna Heights?
Total Population of Laguna Heights is 1,482.
What is the Total Male Population of Laguna Heights?
Total Male Population of Laguna Heights is 509.
What is the Total Female Population of Laguna Heights?
Total Female Population of Laguna Heights is 973.
What is the Ratio of Males per 100 Females in Laguna Heights?
There are 52.31 Males per 100 Females in Laguna Heights.
What is the Ratio of Females per 100 Males in Laguna Heights?
There are 191.16 Females per 100 Males in Laguna Heights.
What is the Median Population Age in Laguna Heights?
Median Population Age in Laguna Heights is 28.1 Years.
What is the Average Family Size in Laguna Heights
Average Family Size in Laguna Heights is 4.3 People.
What is the Average Household Size in Laguna Heights
Average Household Size in Laguna Heights is 3.6 People.
How Large is the Labor Force in Laguna Heights?
There are 294 People in the Labor Forcein in Laguna Heights.
What is the Percentage of People in the Labor Force in Laguna Heights?
30.0% of People are in the Labor Force in Laguna Heights.