Zip Codes with the Highest Percentage of Population Employed in Architecture & Engineering in Edinburg, TX
RELATED REPORTS & OPTIONS
Architecture & Engineering
Edinburg
Compare Zip Codes
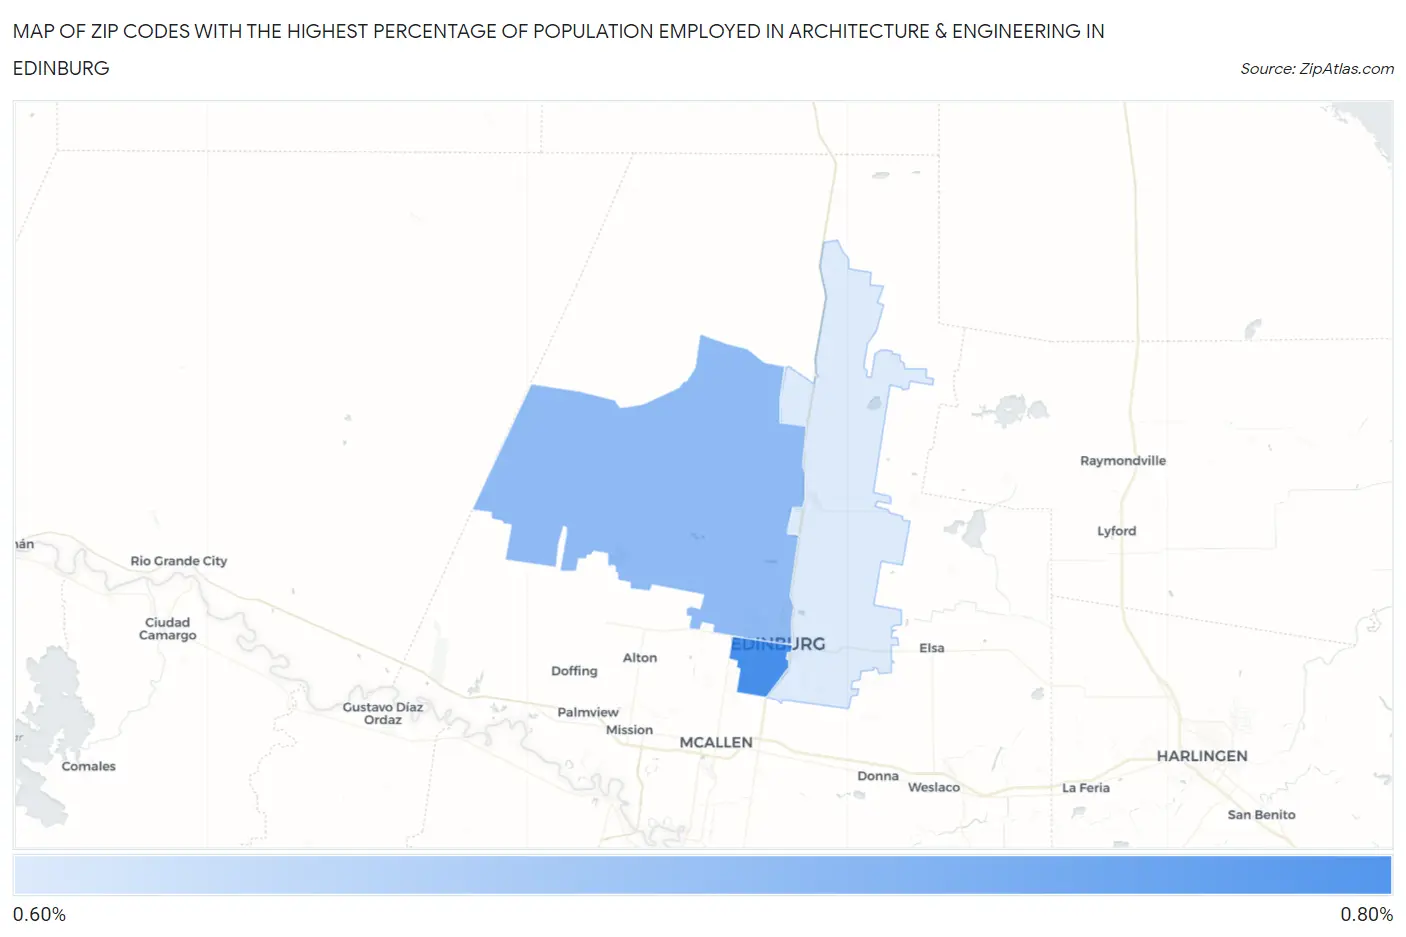
Map of Zip Codes with the Highest Percentage of Population Employed in Architecture & Engineering in Edinburg
0.66%
0.77%
Zip Codes with the Highest Percentage of Population Employed in Architecture & Engineering in Edinburg, TX
| Zip Code | % Employed | vs State | vs National | |
| 1. | 78539 | 0.77% | 2.2%(-1.45)#993 | 2.1%(-1.38)#18,334 |
| 2. | 78541 | 0.72% | 2.2%(-1.50)#1,021 | 2.1%(-1.43)#18,774 |
| 3. | 78542 | 0.66% | 2.2%(-1.57)#1,059 | 2.1%(-1.49)#19,202 |
1
Common Questions
What are the Top Zip Codes with the Highest Percentage of Population Employed in Architecture & Engineering in Edinburg, TX?
Top Zip Codes with the Highest Percentage of Population Employed in Architecture & Engineering in Edinburg, TX are:
What zip code has the Highest Percentage of Population Employed in Architecture & Engineering in Edinburg, TX?
78539 has the Highest Percentage of Population Employed in Architecture & Engineering in Edinburg, TX with 0.77%.
What is the Percentage of Population Employed in Architecture & Engineering in Edinburg, TX?
Percentage of Population Employed in Architecture & Engineering in Edinburg is 0.39%.
What is the Percentage of Population Employed in Architecture & Engineering in Texas?
Percentage of Population Employed in Architecture & Engineering in Texas is 2.2%.
What is the Percentage of Population Employed in Architecture & Engineering in the United States?
Percentage of Population Employed in Architecture & Engineering in the United States is 2.1%.