Bayview, TX Map & Demographics
Bayview Map
Bayview Overview
$50,124
PER CAPITA INCOME
$129,073
AVG FAMILY INCOME
$128,911
AVG HOUSEHOLD INCOME
0.32
INEQUALITY / GINI INDEX
784
TOTAL POPULATION
474
MALE POPULATION
310
FEMALE POPULATION
152.90
MALES / 100 FEMALES
65.40
FEMALES / 100 MALES
47.5
MEDIAN AGE
3.0
AVG FAMILY SIZE
3.0
AVG HOUSEHOLD SIZE
530
LABOR FORCE [ PEOPLE ]
74.1%
PERCENT IN LABOR FORCE
14.0%
UNEMPLOYMENT RATE
Bayview Area Codes
Income in Bayview
Income Overview in Bayview
Per Capita Income in Bayview is $50,124, while median incomes of families and households are $129,073 and $128,911 respectively.
| Characteristic | Number | Measure |
| Per Capita Income | 784 | $50,124 |
| Median Family Income | 235 | $129,073 |
| Mean Family Income | 235 | $139,031 |
| Median Household Income | 265 | $128,911 |
| Mean Household Income | 265 | $144,217 |
| Income Deficit | 235 | $0 |
| Wage / Income Gap (%) | 784 | 0.00% |
| Wage / Income Gap ($) | 784 | 100.00¢ per $1 |
| Gini / Inequality Index | 784 | 0.32 |
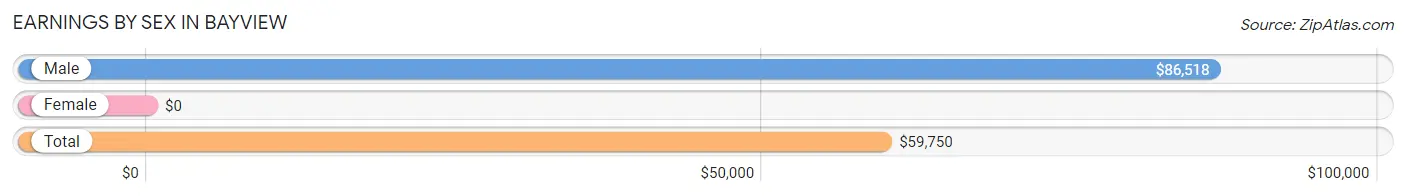
Earnings by Sex in Bayview
| Sex | Number | Average Earnings |
| Male | 279 (57.9%) | $86,518 |
| Female | 203 (42.1%) | $0 |
| Total | 482 (100.0%) | $59,750 |
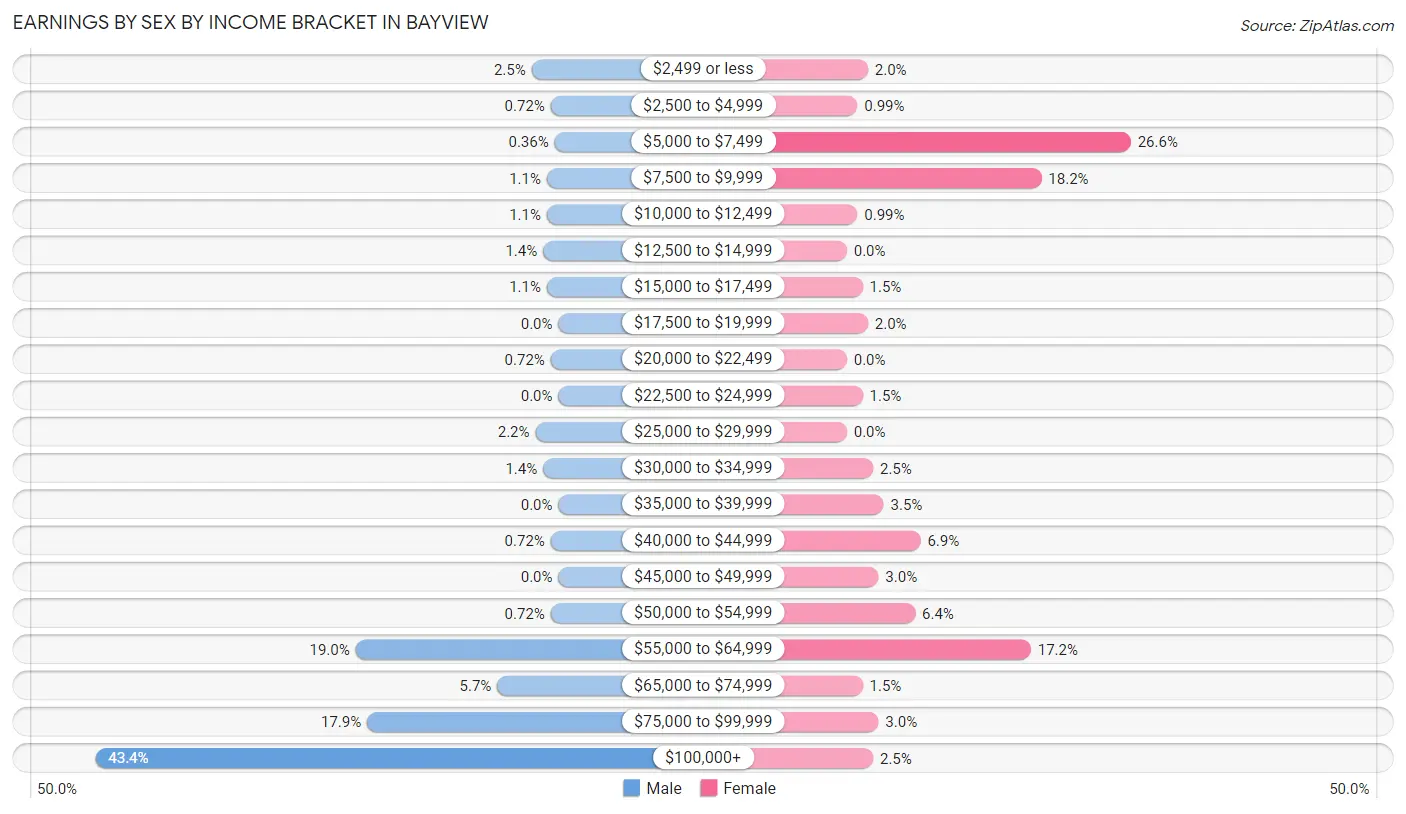
Earnings by Sex by Income Bracket in Bayview
The most common earnings brackets in Bayview are $100,000+ for men (121 | 43.4%) and $5,000 to $7,499 for women (54 | 26.6%).
| Income | Male | Female |
| $2,499 or less | 7 (2.5%) | 4 (2.0%) |
| $2,500 to $4,999 | 2 (0.7%) | 2 (1.0%) |
| $5,000 to $7,499 | 1 (0.4%) | 54 (26.6%) |
| $7,500 to $9,999 | 3 (1.1%) | 37 (18.2%) |
| $10,000 to $12,499 | 3 (1.1%) | 2 (1.0%) |
| $12,500 to $14,999 | 4 (1.4%) | 0 (0.0%) |
| $15,000 to $17,499 | 3 (1.1%) | 3 (1.5%) |
| $17,500 to $19,999 | 0 (0.0%) | 4 (2.0%) |
| $20,000 to $22,499 | 2 (0.7%) | 0 (0.0%) |
| $22,500 to $24,999 | 0 (0.0%) | 3 (1.5%) |
| $25,000 to $29,999 | 6 (2.1%) | 0 (0.0%) |
| $30,000 to $34,999 | 4 (1.4%) | 5 (2.5%) |
| $35,000 to $39,999 | 0 (0.0%) | 7 (3.5%) |
| $40,000 to $44,999 | 2 (0.7%) | 14 (6.9%) |
| $45,000 to $49,999 | 0 (0.0%) | 6 (3.0%) |
| $50,000 to $54,999 | 2 (0.7%) | 13 (6.4%) |
| $55,000 to $64,999 | 53 (19.0%) | 35 (17.2%) |
| $65,000 to $74,999 | 16 (5.7%) | 3 (1.5%) |
| $75,000 to $99,999 | 50 (17.9%) | 6 (3.0%) |
| $100,000+ | 121 (43.4%) | 5 (2.5%) |
| Total | 279 (100.0%) | 203 (100.0%) |
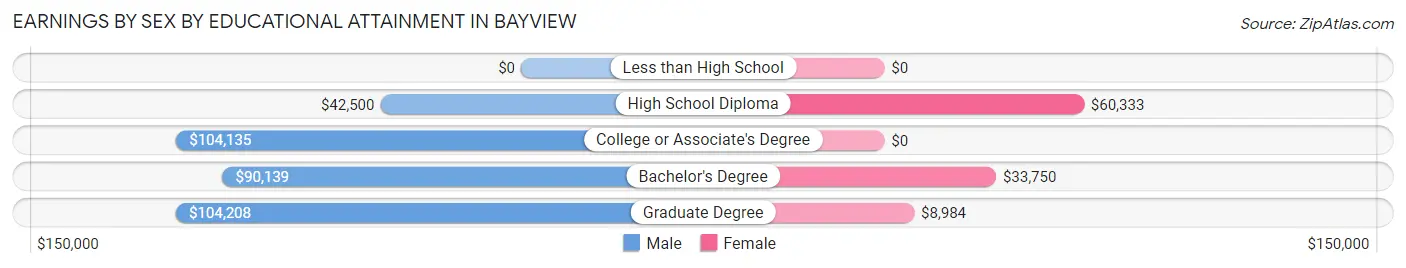
Earnings by Sex by Educational Attainment in Bayview
| Educational Attainment | Male Income | Female Income |
| Less than High School | - | - |
| High School Diploma | $42,500 | $60,333 |
| College or Associate's Degree | $104,135 | $0 |
| Bachelor's Degree | $90,139 | $33,750 |
| Graduate Degree | $104,208 | $8,984 |
| Total | $103,023 | $0 |
Family Income in Bayview
Family Income Brackets in Bayview
According to the Bayview family income data, there are 73 families falling into the $100,000 to $149,999 income range, which is the most common income bracket and makes up 31.1% of all families.
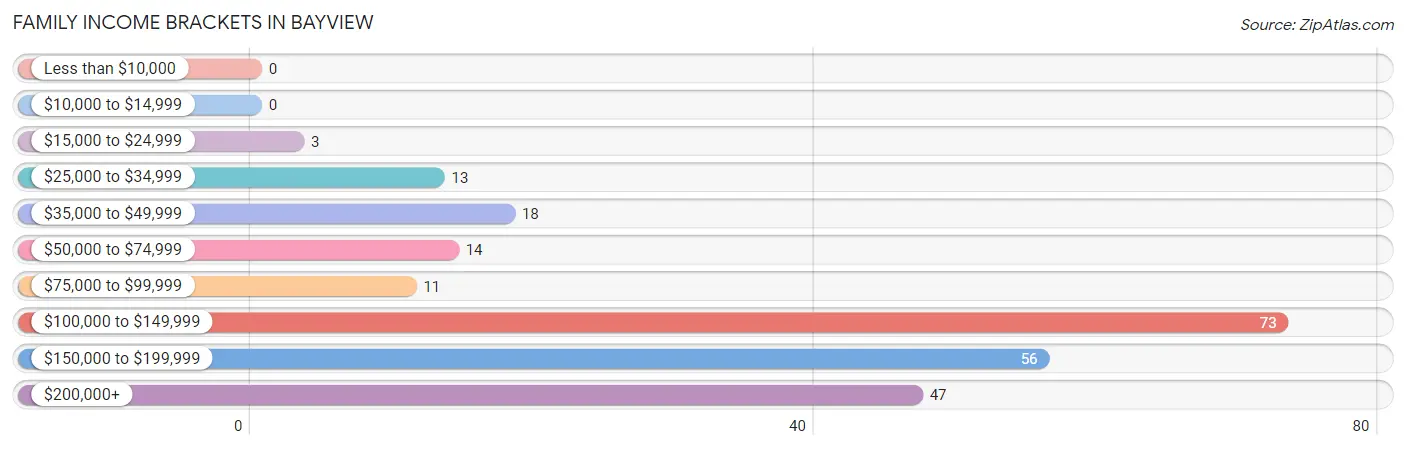
| Income Bracket | # Families | % Families |
| Less than $10,000 | 0 | 0.0% |
| $10,000 to $14,999 | 0 | 0.0% |
| $15,000 to $24,999 | 3 | 1.3% |
| $25,000 to $34,999 | 13 | 5.5% |
| $35,000 to $49,999 | 18 | 7.7% |
| $50,000 to $74,999 | 14 | 6.0% |
| $75,000 to $99,999 | 11 | 4.7% |
| $100,000 to $149,999 | 73 | 31.1% |
| $150,000 to $199,999 | 56 | 23.8% |
| $200,000+ | 47 | 20.0% |
Family Income by Famaliy Size in Bayview
3-person families (101 | 43.0%) account for the highest median family income in Bayview with $168,711 per family, while 2-person families (92 | 39.2%) have the highest median income of $60,625 per family member.
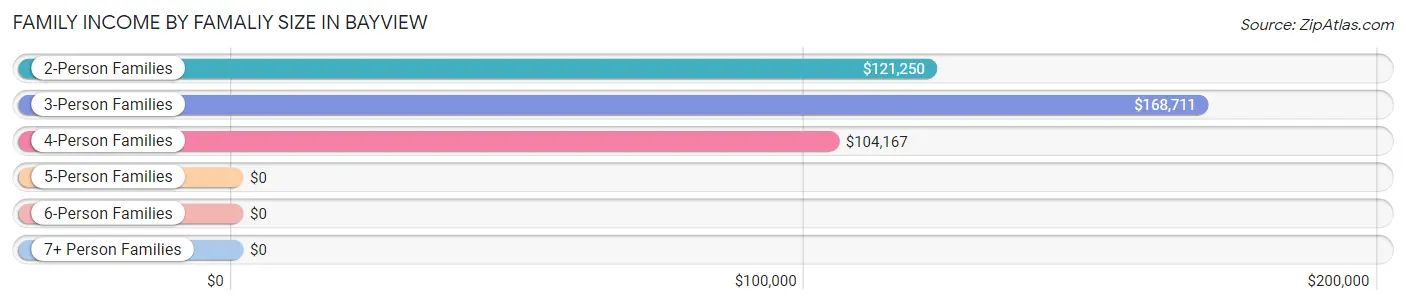
| Income Bracket | # Families | Median Income |
| 2-Person Families | 92 (39.2%) | $121,250 |
| 3-Person Families | 101 (43.0%) | $168,711 |
| 4-Person Families | 34 (14.5%) | $104,167 |
| 5-Person Families | 5 (2.1%) | $0 |
| 6-Person Families | 0 (0.0%) | $0 |
| 7+ Person Families | 3 (1.3%) | $0 |
| Total | 235 (100.0%) | $129,073 |
Family Income by Number of Earners in Bayview
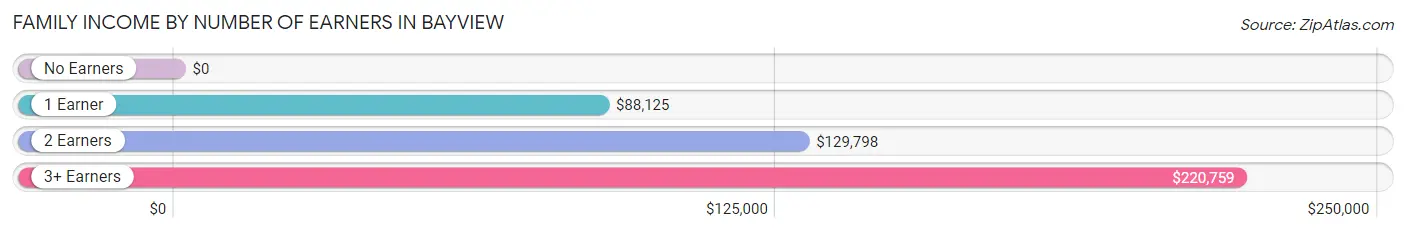
| Number of Earners | # Families | Median Income |
| No Earners | 20 (8.5%) | $0 |
| 1 Earner | 45 (19.2%) | $88,125 |
| 2 Earners | 131 (55.7%) | $129,798 |
| 3+ Earners | 39 (16.6%) | $220,759 |
| Total | 235 (100.0%) | $129,073 |
Household Income in Bayview
Household Income Brackets in Bayview
With 76 households falling in the category, the $100,000 to $149,999 income range is the most frequent in Bayview, accounting for 28.7% of all households.
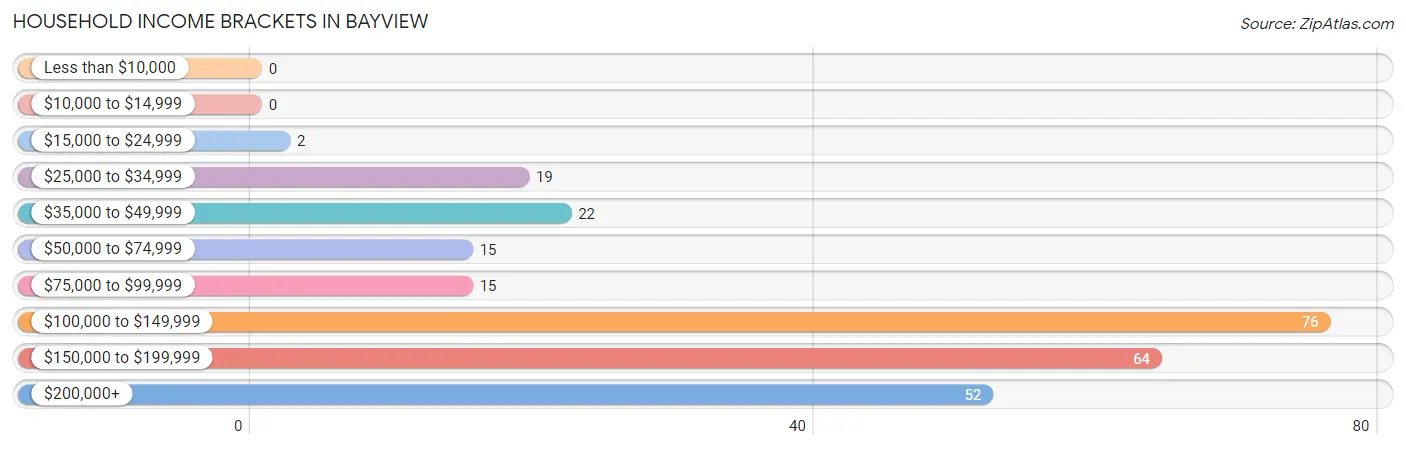
| Income Bracket | # Households | % Households |
| Less than $10,000 | 0 | 0.0% |
| $10,000 to $14,999 | 0 | 0.0% |
| $15,000 to $24,999 | 2 | 0.8% |
| $25,000 to $34,999 | 19 | 7.2% |
| $35,000 to $49,999 | 22 | 8.3% |
| $50,000 to $74,999 | 15 | 5.7% |
| $75,000 to $99,999 | 15 | 5.7% |
| $100,000 to $149,999 | 76 | 28.7% |
| $150,000 to $199,999 | 64 | 24.2% |
| $200,000+ | 52 | 19.6% |
Household Income by Householder Age in Bayview
The median household income in Bayview is $128,911, with the highest median household income of $165,833 found in the 45 to 64 years age bracket for the primary householder. A total of 170 households (64.1%) fall into this category. Meanwhile, the 15 to 24 years age bracket for the primary householder has the lowest median household income of $0, with 2 households (0.7%) in this group.
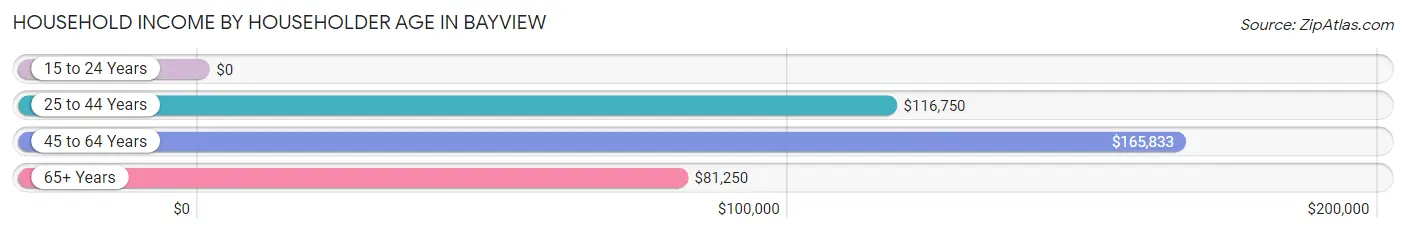
| Income Bracket | # Households | Median Income |
| 15 to 24 Years | 2 (0.7%) | $0 |
| 25 to 44 Years | 29 (10.9%) | $116,750 |
| 45 to 64 Years | 170 (64.1%) | $165,833 |
| 65+ Years | 64 (24.1%) | $81,250 |
| Total | 265 (100.0%) | $128,911 |
Poverty in Bayview
Income Below Poverty by Sex and Age in Bayview
With 4.0% poverty level for males and 1.0% for females among the residents of Bayview, 25 to 34 year old males and 55 to 64 year old females are the most vulnerable to poverty, with 8 males (15.1%) and 2 females (2.2%) in their respective age groups living below the poverty level.
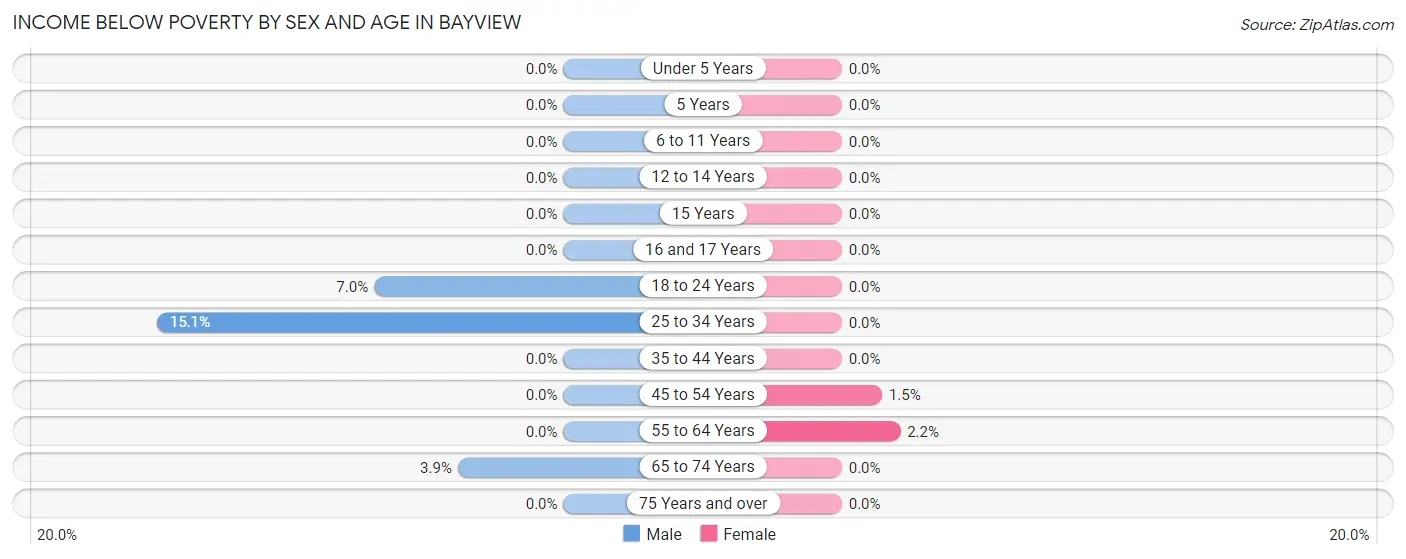
| Age Bracket | Male | Female |
| Under 5 Years | 0 (0.0%) | 0 (0.0%) |
| 5 Years | 0 (0.0%) | 0 (0.0%) |
| 6 to 11 Years | 0 (0.0%) | 0 (0.0%) |
| 12 to 14 Years | 0 (0.0%) | 0 (0.0%) |
| 15 Years | 0 (0.0%) | 0 (0.0%) |
| 16 and 17 Years | 0 (0.0%) | 0 (0.0%) |
| 18 to 24 Years | 9 (7.0%) | 0 (0.0%) |
| 25 to 34 Years | 8 (15.1%) | 0 (0.0%) |
| 35 to 44 Years | 0 (0.0%) | 0 (0.0%) |
| 45 to 54 Years | 0 (0.0%) | 1 (1.5%) |
| 55 to 64 Years | 0 (0.0%) | 2 (2.2%) |
| 65 to 74 Years | 2 (3.9%) | 0 (0.0%) |
| 75 Years and over | 0 (0.0%) | 0 (0.0%) |
| Total | 19 (4.0%) | 3 (1.0%) |
Income Above Poverty by Sex and Age in Bayview
According to the poverty statistics in Bayview, males aged under 5 years and females aged 6 to 11 years are the age groups that are most secure financially, with 100.0% of males and 100.0% of females in these age groups living above the poverty line.
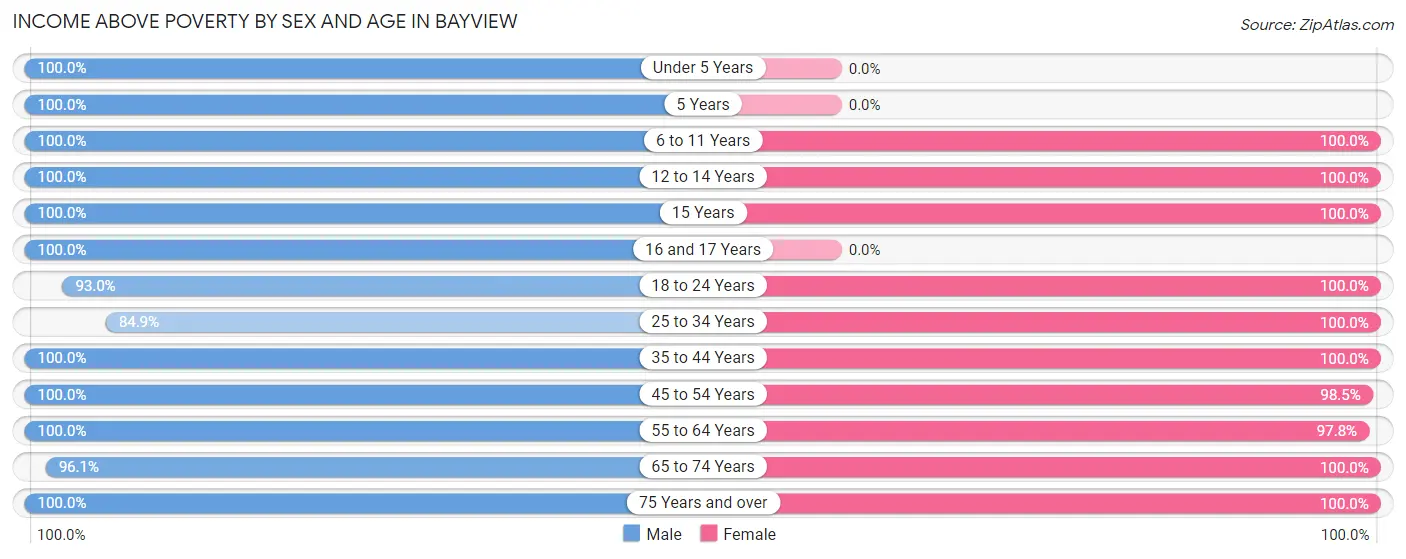
| Age Bracket | Male | Female |
| Under 5 Years | 20 (100.0%) | 0 (0.0%) |
| 5 Years | 2 (100.0%) | 0 (0.0%) |
| 6 to 11 Years | 11 (100.0%) | 10 (100.0%) |
| 12 to 14 Years | 11 (100.0%) | 8 (100.0%) |
| 15 Years | 4 (100.0%) | 3 (100.0%) |
| 16 and 17 Years | 7 (100.0%) | 0 (0.0%) |
| 18 to 24 Years | 119 (93.0%) | 44 (100.0%) |
| 25 to 34 Years | 45 (84.9%) | 11 (100.0%) |
| 35 to 44 Years | 17 (100.0%) | 19 (100.0%) |
| 45 to 54 Years | 109 (100.0%) | 66 (98.5%) |
| 55 to 64 Years | 39 (100.0%) | 90 (97.8%) |
| 65 to 74 Years | 49 (96.1%) | 34 (100.0%) |
| 75 Years and over | 22 (100.0%) | 22 (100.0%) |
| Total | 455 (96.0%) | 307 (99.0%) |
Income Below Poverty Among Married-Couple Families in Bayview
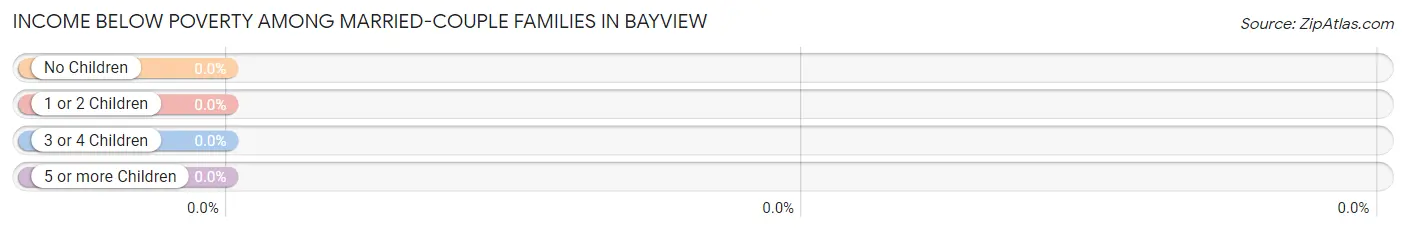
| Children | Above Poverty | Below Poverty |
| No Children | 171 (100.0%) | 0 (0.0%) |
| 1 or 2 Children | 42 (100.0%) | 0 (0.0%) |
| 3 or 4 Children | 0 (0.0%) | 0 (0.0%) |
| 5 or more Children | 0 (0.0%) | 0 (0.0%) |
| Total | 213 (100.0%) | 0 (0.0%) |
Income Below Poverty Among Single-Parent Households in Bayview
| Children | Single Father | Single Mother |
| No Children | 0 (0.0%) | 0 (0.0%) |
| 1 or 2 Children | 0 (0.0%) | 0 (0.0%) |
| 3 or 4 Children | 0 (0.0%) | 0 (0.0%) |
| 5 or more Children | 0 (0.0%) | 0 (0.0%) |
| Total | 0 (0.0%) | 0 (0.0%) |
Income Below Poverty Among Married-Couple vs Single-Parent Households in Bayview
| Children | Married-Couple Families | Single-Parent Households |
| No Children | 0 (0.0%) | 0 (0.0%) |
| 1 or 2 Children | 0 (0.0%) | 0 (0.0%) |
| 3 or 4 Children | 0 (0.0%) | 0 (0.0%) |
| 5 or more Children | 0 (0.0%) | 0 (0.0%) |
| Total | 0 (0.0%) | 0 (0.0%) |
Race in Bayview
The most populous races in Bayview are Hispanic or Latino (454 | 57.9%), White / Caucasian (406 | 51.8%), and Two or more Races (315 | 40.2%).
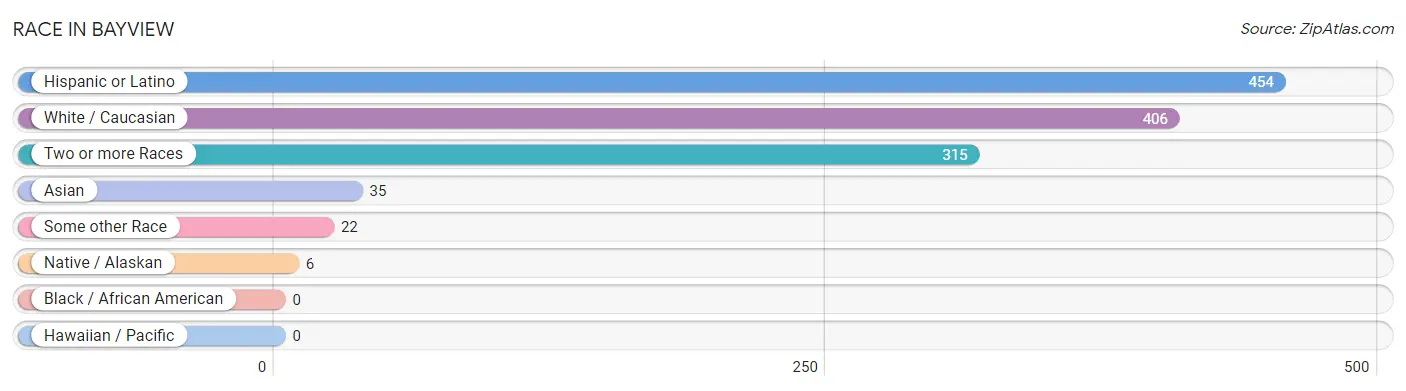
| Race | # Population | % Population |
| Asian | 35 | 4.5% |
| Black / African American | 0 | 0.0% |
| Hawaiian / Pacific | 0 | 0.0% |
| Hispanic or Latino | 454 | 57.9% |
| Native / Alaskan | 6 | 0.8% |
| White / Caucasian | 406 | 51.8% |
| Two or more Races | 315 | 40.2% |
| Some other Race | 22 | 2.8% |
| Total | 784 | 100.0% |
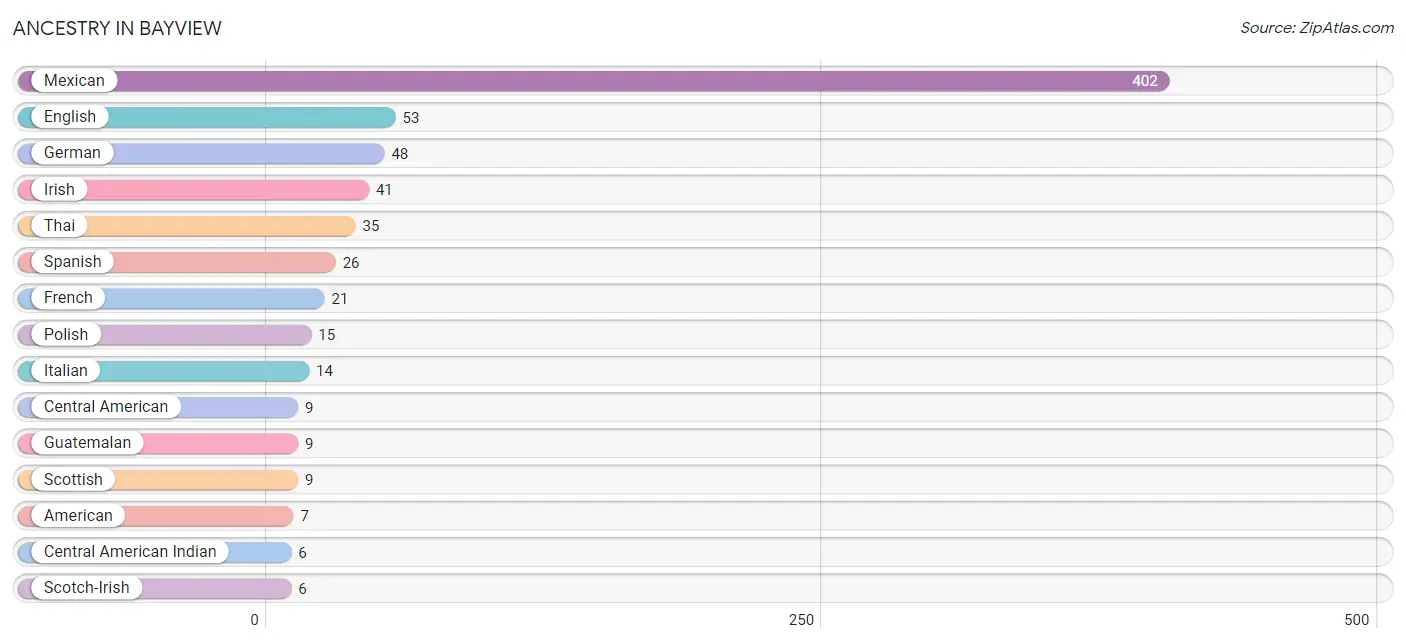
Ancestry in Bayview
The most populous ancestries reported in Bayview are Mexican (402 | 51.3%), English (53 | 6.8%), German (48 | 6.1%), Irish (41 | 5.2%), and Thai (35 | 4.5%), together accounting for 73.9% of all Bayview residents.
| Ancestry | # Population | % Population |
| American | 7 | 0.9% |
| Apache | 2 | 0.3% |
| Assyrian / Chaldean / Syriac | 2 | 0.3% |
| Austrian | 3 | 0.4% |
| Central American | 9 | 1.1% |
| Central American Indian | 6 | 0.8% |
| Cherokee | 3 | 0.4% |
| Colombian | 1 | 0.1% |
| Czech | 2 | 0.3% |
| Dutch | 1 | 0.1% |
| English | 53 | 6.8% |
| Finnish | 3 | 0.4% |
| French | 21 | 2.7% |
| German | 48 | 6.1% |
| Guatemalan | 9 | 1.1% |
| Irish | 41 | 5.2% |
| Italian | 14 | 1.8% |
| Lithuanian | 3 | 0.4% |
| Mexican | 402 | 51.3% |
| Native Hawaiian | 4 | 0.5% |
| Polish | 15 | 1.9% |
| Scandinavian | 1 | 0.1% |
| Scotch-Irish | 6 | 0.8% |
| Scottish | 9 | 1.1% |
| Slovene | 1 | 0.1% |
| South American | 1 | 0.1% |
| Spaniard | 2 | 0.3% |
| Spanish | 26 | 3.3% |
| Swedish | 5 | 0.6% |
| Swiss | 5 | 0.6% |
| Thai | 35 | 4.5% |
| Welsh | 6 | 0.8% | View All 32 Rows |
Immigrants in Bayview
The most numerous immigrant groups reported in Bayview came from Latin America (98 | 12.5%), Central America (97 | 12.4%), Mexico (88 | 11.2%), Asia (37 | 4.7%), and India (35 | 4.5%), together accounting for 45.3% of all Bayview residents.
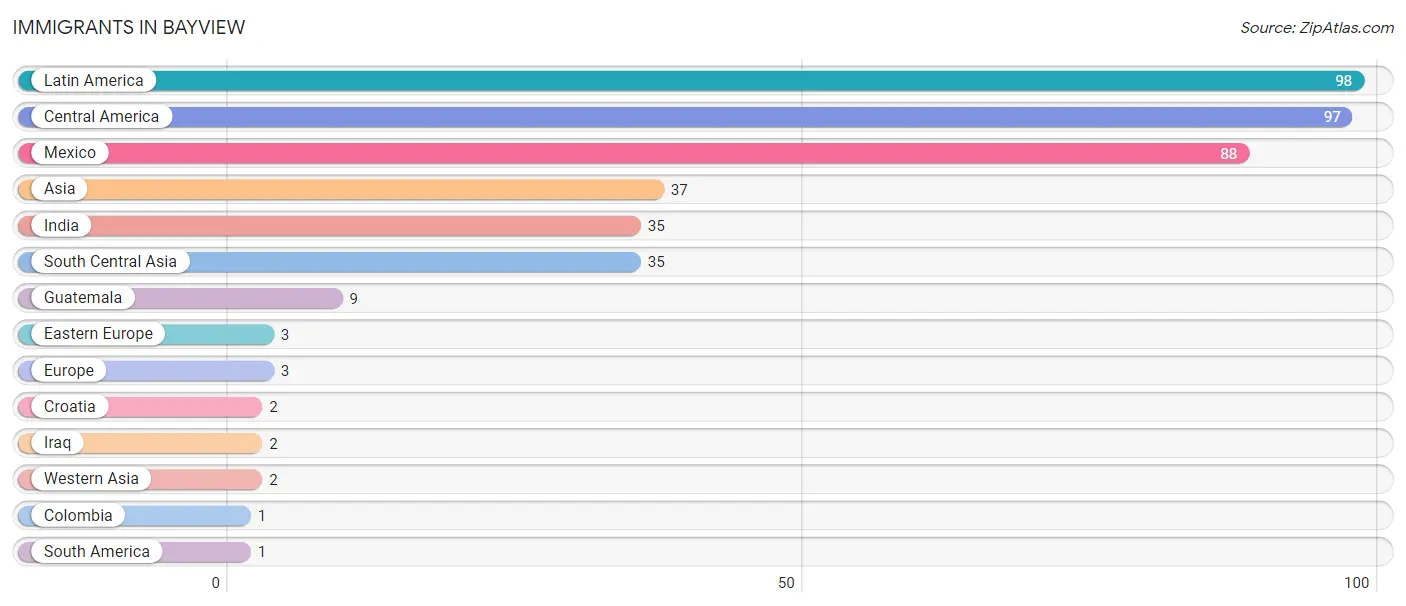
| Immigration Origin | # Population | % Population |
| Asia | 37 | 4.7% |
| Central America | 97 | 12.4% |
| Colombia | 1 | 0.1% |
| Croatia | 2 | 0.3% |
| Eastern Europe | 3 | 0.4% |
| Europe | 3 | 0.4% |
| Guatemala | 9 | 1.1% |
| India | 35 | 4.5% |
| Iraq | 2 | 0.3% |
| Latin America | 98 | 12.5% |
| Mexico | 88 | 11.2% |
| South America | 1 | 0.1% |
| South Central Asia | 35 | 4.5% |
| Western Asia | 2 | 0.3% | View All 14 Rows |
Sex and Age in Bayview
Sex and Age in Bayview
The most populous age groups in Bayview are 20 to 24 Years (126 | 26.6%) for men and 55 to 59 Years (58 | 18.7%) for women.
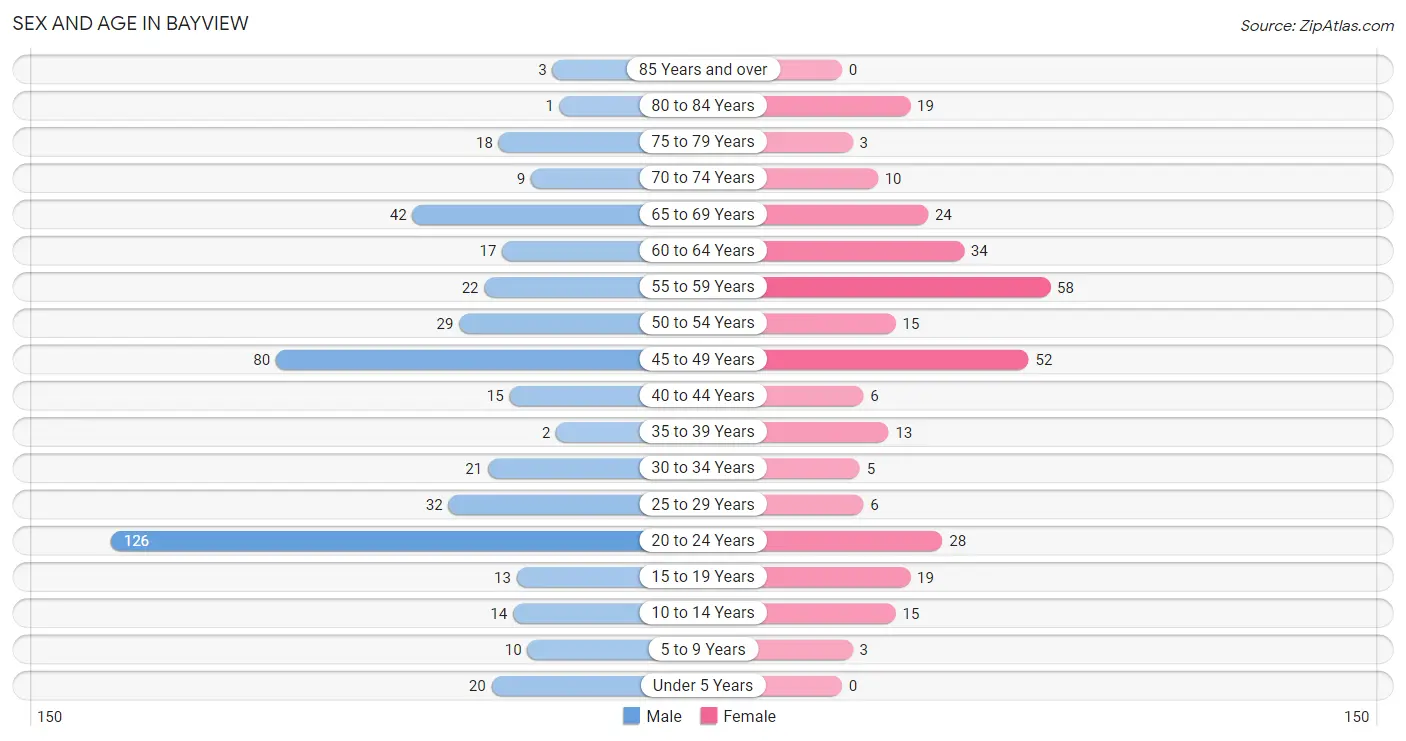
| Age Bracket | Male | Female |
| Under 5 Years | 20 (4.2%) | 0 (0.0%) |
| 5 to 9 Years | 10 (2.1%) | 3 (1.0%) |
| 10 to 14 Years | 14 (2.9%) | 15 (4.8%) |
| 15 to 19 Years | 13 (2.7%) | 19 (6.1%) |
| 20 to 24 Years | 126 (26.6%) | 28 (9.0%) |
| 25 to 29 Years | 32 (6.8%) | 6 (1.9%) |
| 30 to 34 Years | 21 (4.4%) | 5 (1.6%) |
| 35 to 39 Years | 2 (0.4%) | 13 (4.2%) |
| 40 to 44 Years | 15 (3.2%) | 6 (1.9%) |
| 45 to 49 Years | 80 (16.9%) | 52 (16.8%) |
| 50 to 54 Years | 29 (6.1%) | 15 (4.8%) |
| 55 to 59 Years | 22 (4.6%) | 58 (18.7%) |
| 60 to 64 Years | 17 (3.6%) | 34 (11.0%) |
| 65 to 69 Years | 42 (8.9%) | 24 (7.7%) |
| 70 to 74 Years | 9 (1.9%) | 10 (3.2%) |
| 75 to 79 Years | 18 (3.8%) | 3 (1.0%) |
| 80 to 84 Years | 1 (0.2%) | 19 (6.1%) |
| 85 Years and over | 3 (0.6%) | 0 (0.0%) |
| Total | 474 (100.0%) | 310 (100.0%) |
Families and Households in Bayview
Median Family Size in Bayview
The median family size in Bayview is 3.04 persons per family, with single male/father families (12 | 5.1%) accounting for the largest median family size of 3.83 persons per family. On the other hand, single female/mother families (10 | 4.3%) represent the smallest median family size with 2.90 persons per family.
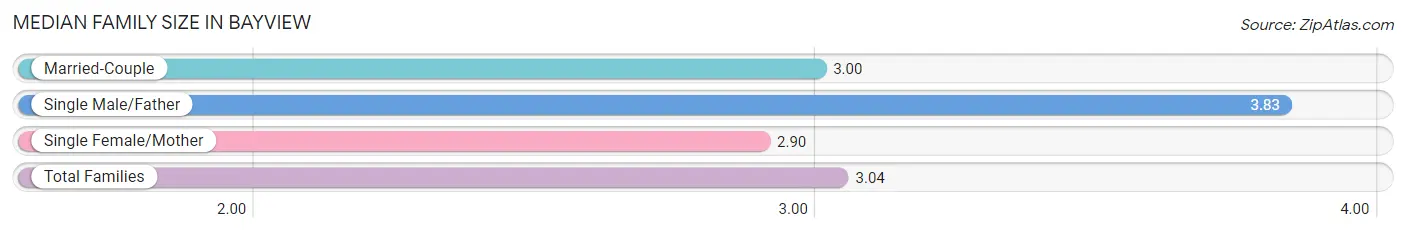
| Family Type | # Families | Family Size |
| Married-Couple | 213 (90.6%) | 3.00 |
| Single Male/Father | 12 (5.1%) | 3.83 |
| Single Female/Mother | 10 (4.3%) | 2.90 |
| Total Families | 235 (100.0%) | 3.04 |
Median Household Size in Bayview
The median household size in Bayview is 2.96 persons per household, with single male/father households (12 | 4.5%) accounting for the largest median household size of 3.83 persons per household. non-family households (30 | 11.3%) represent the smallest median household size with 2.13 persons per household.
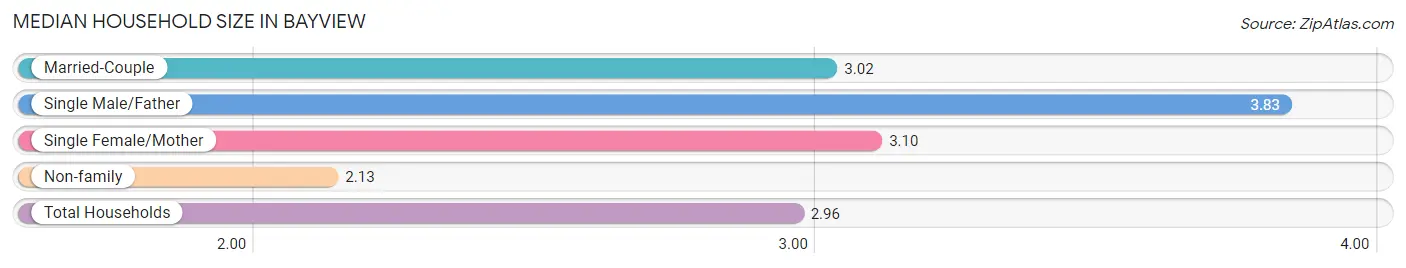
| Household Type | # Households | Household Size |
| Married-Couple | 213 (80.4%) | 3.02 |
| Single Male/Father | 12 (4.5%) | 3.83 |
| Single Female/Mother | 10 (3.8%) | 3.10 |
| Non-family | 30 (11.3%) | 2.13 |
| Total Households | 265 (100.0%) | 2.96 |
Household Size by Marriage Status in Bayview
Out of a total of 265 households in Bayview, 235 (88.7%) are family households, while 30 (11.3%) are nonfamily households. The most numerous type of family households are 3-person households, comprising 106, and the most common type of nonfamily households are 1-person households, comprising 17.
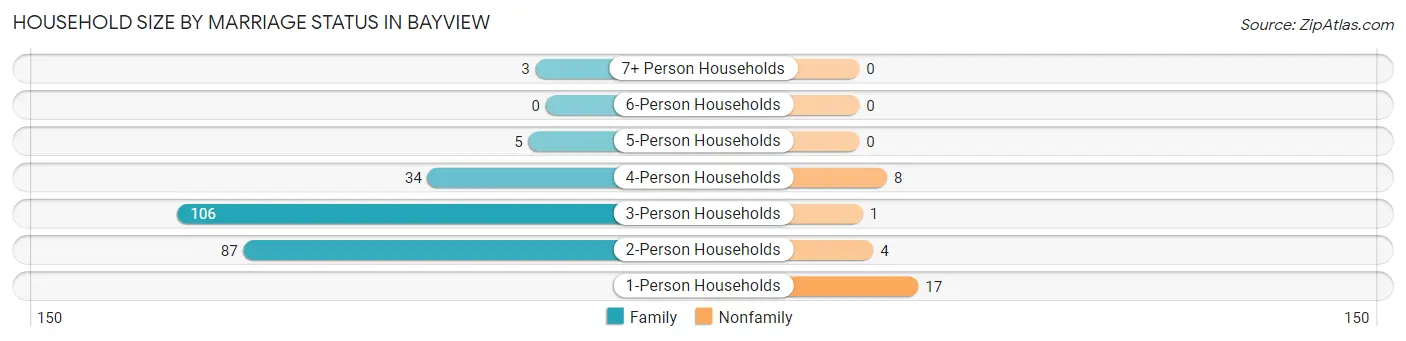
| Household Size | Family Households | Nonfamily Households |
| 1-Person Households | - | 17 (6.4%) |
| 2-Person Households | 87 (32.8%) | 4 (1.5%) |
| 3-Person Households | 106 (40.0%) | 1 (0.4%) |
| 4-Person Households | 34 (12.8%) | 8 (3.0%) |
| 5-Person Households | 5 (1.9%) | 0 (0.0%) |
| 6-Person Households | 0 (0.0%) | 0 (0.0%) |
| 7+ Person Households | 3 (1.1%) | 0 (0.0%) |
| Total | 235 (88.7%) | 30 (11.3%) |
Female Fertility in Bayview
Fertility by Age in Bayview
| Age Bracket | Women with Births | Births / 1,000 Women |
| 15 to 19 years | 0 (0.0%) | 0.0 |
| 20 to 34 years | 0 (0.0%) | 0.0 |
| 35 to 50 years | 0 (0.0%) | 0.0 |
| Total | 0 (0.0%) | 0.0 |
Fertility by Age by Marriage Status in Bayview
| Age Bracket | Married | Unmarried |
| 15 to 19 years | 0 (0.0%) | 0 (0.0%) |
| 20 to 34 years | 0 (0.0%) | 0 (0.0%) |
| 35 to 50 years | 0 (0.0%) | 0 (0.0%) |
| Total | 0 (0.0%) | 0 (0.0%) |
Fertility by Education in Bayview
| Educational Attainment | Women with Births | Births / 1,000 Women |
| Less than High School | 0 (0.0%) | 0.0 |
| High School Diploma | 0 (0.0%) | 0.0 |
| College or Associate's Degree | 0 (0.0%) | 0.0 |
| Bachelor's Degree | 0 (0.0%) | 0.0 |
| Graduate Degree | 0 (0.0%) | 0.0 |
| Total | 0 (0.0%) | 0.0 |
Fertility by Education by Marriage Status in Bayview
| Educational Attainment | Married | Unmarried |
| Less than High School | 0 (0.0%) | 0 (0.0%) |
| High School Diploma | 0 (0.0%) | 0 (0.0%) |
| College or Associate's Degree | 0 (0.0%) | 0 (0.0%) |
| Bachelor's Degree | 0 (0.0%) | 0 (0.0%) |
| Graduate Degree | 0 (0.0%) | 0 (0.0%) |
| Total | 0 (0.0%) | 0 (0.0%) |
Employment Characteristics in Bayview
Employment by Class of Employer in Bayview
Among the 454 employed individuals in Bayview, local government employees (169 | 37.2%), private company employees (160 | 35.2%), and state government employees (40 | 8.8%) make up the most common classes of employment.
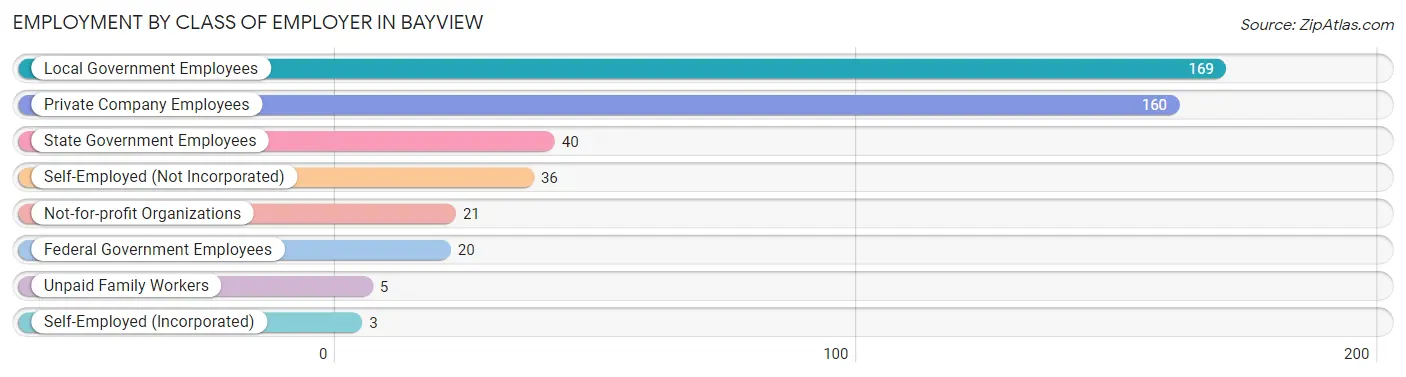
| Employer Class | # Employees | % Employees |
| Private Company Employees | 160 | 35.2% |
| Self-Employed (Incorporated) | 3 | 0.7% |
| Self-Employed (Not Incorporated) | 36 | 7.9% |
| Not-for-profit Organizations | 21 | 4.6% |
| Local Government Employees | 169 | 37.2% |
| State Government Employees | 40 | 8.8% |
| Federal Government Employees | 20 | 4.4% |
| Unpaid Family Workers | 5 | 1.1% |
| Total | 454 | 100.0% |
Employment Status by Age in Bayview
According to the labor force statistics for Bayview, out of the total population over 16 years of age (715), 74.1% or 530 individuals are in the labor force, with 14.0% or 74 of them unemployed. The age group with the highest labor force participation rate is 25 to 29 years, with 100.0% or 38 individuals in the labor force. Within the labor force, the 20 to 24 years age range has the highest percentage of unemployed individuals, with 40.3% or 48 of them being unemployed.
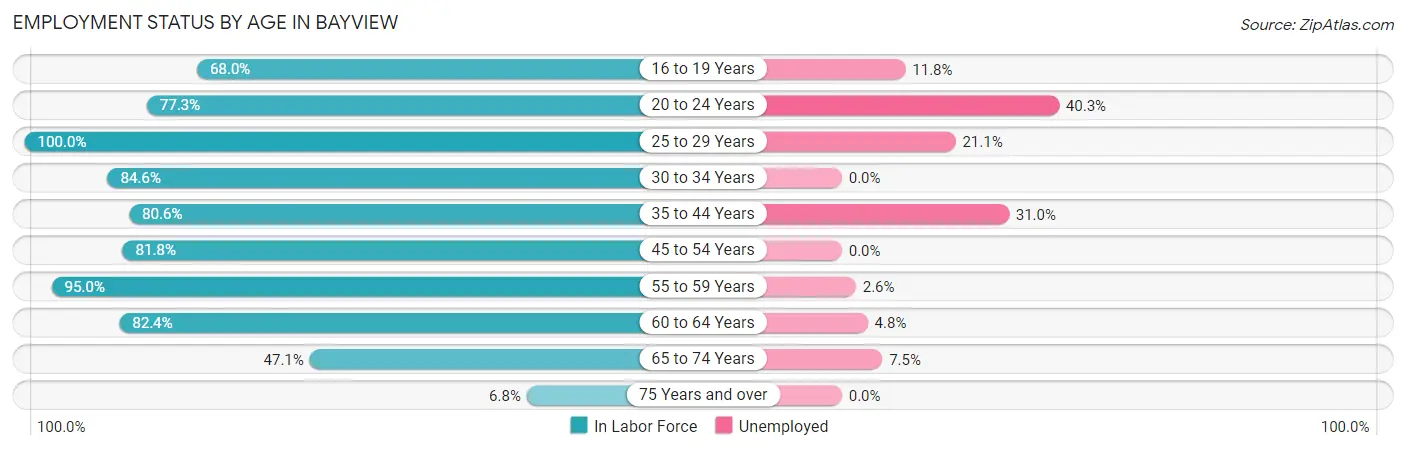
| Age Bracket | In Labor Force | Unemployed |
| 16 to 19 Years | 17 (68.0%) | 2 (11.8%) |
| 20 to 24 Years | 119 (77.3%) | 48 (40.3%) |
| 25 to 29 Years | 38 (100.0%) | 8 (21.1%) |
| 30 to 34 Years | 22 (84.6%) | 0 (0.0%) |
| 35 to 44 Years | 29 (80.6%) | 9 (31.0%) |
| 45 to 54 Years | 144 (81.8%) | 0 (0.0%) |
| 55 to 59 Years | 76 (95.0%) | 2 (2.6%) |
| 60 to 64 Years | 42 (82.4%) | 2 (4.8%) |
| 65 to 74 Years | 40 (47.1%) | 3 (7.5%) |
| 75 Years and over | 3 (6.8%) | 0 (0.0%) |
| Total | 530 (74.1%) | 74 (14.0%) |
Employment Status by Educational Attainment in Bayview
According to labor force statistics for Bayview, 86.2% of individuals (351) out of the total population between 25 and 64 years of age (407) are in the labor force, with 6.0% or 21 of them being unemployed. The group with the highest labor force participation rate are those with the educational attainment of bachelor's degree or higher, with 96.8% or 183 individuals in the labor force. Within the labor force, individuals with college / associate degree education have the highest percentage of unemployment, with 9.8% or 9 of them being unemployed.
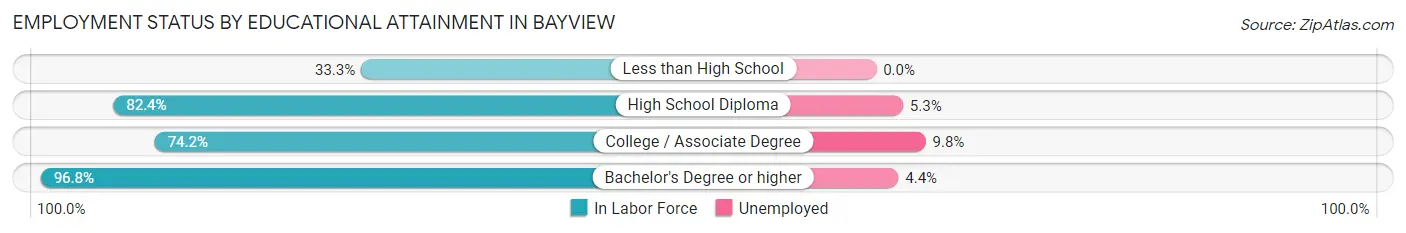
| Educational Attainment | In Labor Force | Unemployed |
| Less than High School | 1 (33.3%) | 0 (0.0%) |
| High School Diploma | 75 (82.4%) | 5 (5.3%) |
| College / Associate Degree | 92 (74.2%) | 12 (9.8%) |
| Bachelor's Degree or higher | 183 (96.8%) | 8 (4.4%) |
| Total | 351 (86.2%) | 24 (6.0%) |
Employment Occupations by Sex in Bayview
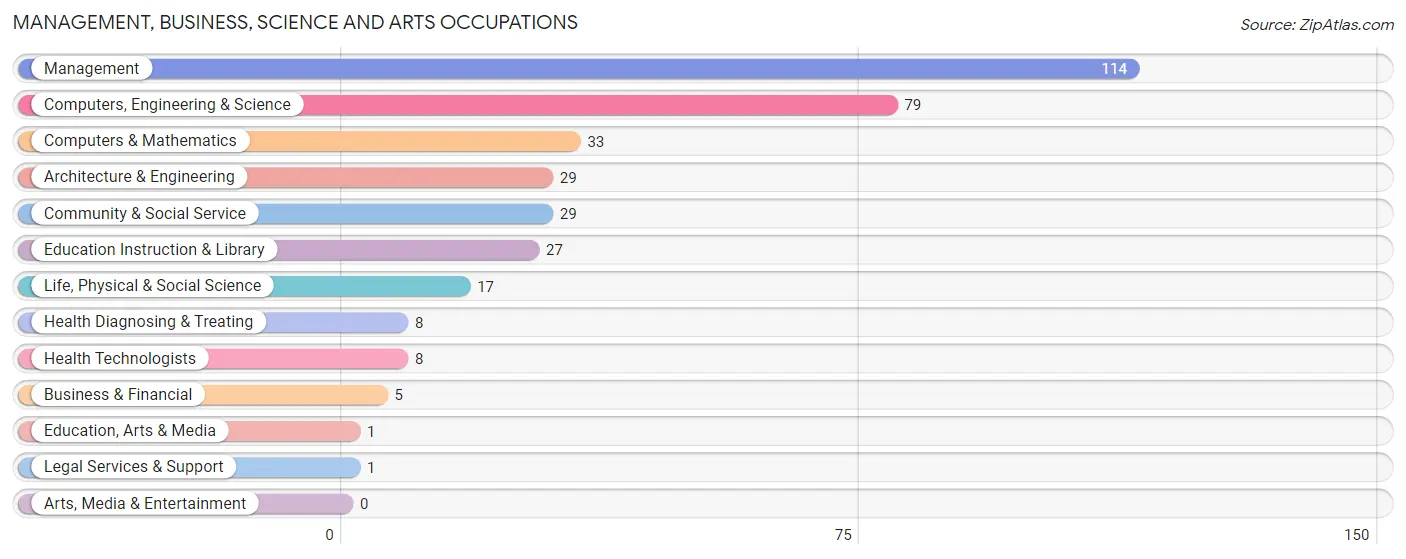
Management, Business, Science and Arts Occupations
The most common Management, Business, Science and Arts occupations in Bayview are Management (114 | 25.0%), Computers, Engineering & Science (79 | 17.3%), Computers & Mathematics (33 | 7.2%), Architecture & Engineering (29 | 6.4%), and Community & Social Service (29 | 6.4%).
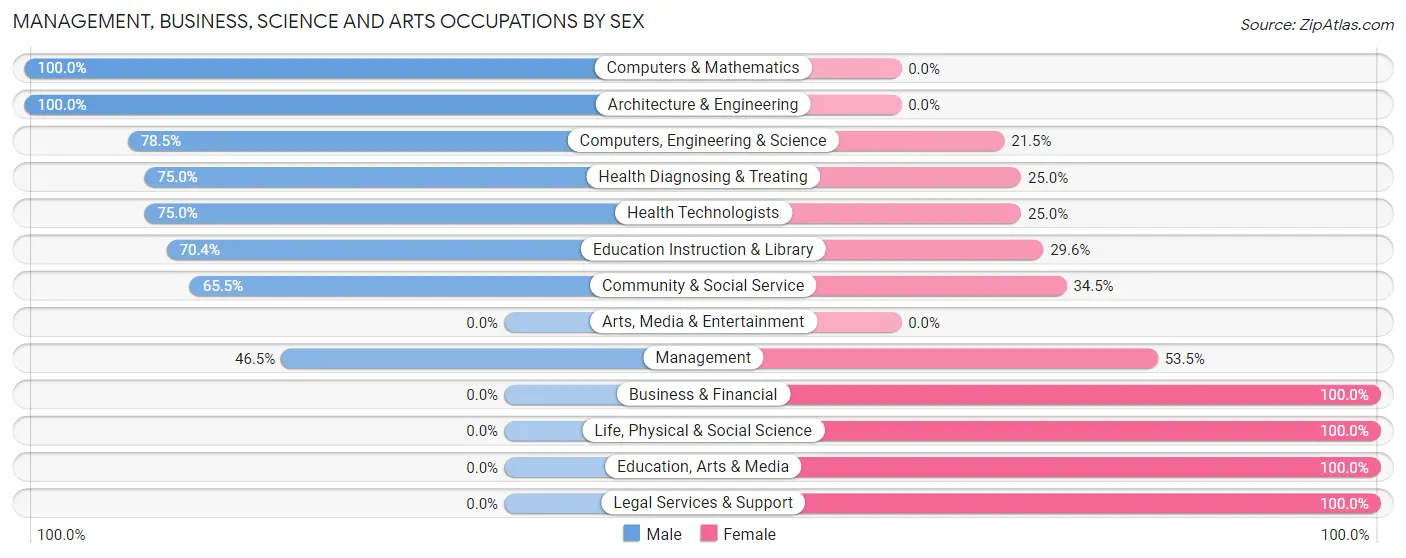
Management, Business, Science and Arts Occupations by Sex
Within the Management, Business, Science and Arts occupations in Bayview, the most male-oriented occupations are Computers & Mathematics (100.0%), Architecture & Engineering (100.0%), and Computers, Engineering & Science (78.5%), while the most female-oriented occupations are Business & Financial (100.0%), Life, Physical & Social Science (100.0%), and Education, Arts & Media (100.0%).
| Occupation | Male | Female |
| Management | 53 (46.5%) | 61 (53.5%) |
| Business & Financial | 0 (0.0%) | 5 (100.0%) |
| Computers, Engineering & Science | 62 (78.5%) | 17 (21.5%) |
| Computers & Mathematics | 33 (100.0%) | 0 (0.0%) |
| Architecture & Engineering | 29 (100.0%) | 0 (0.0%) |
| Life, Physical & Social Science | 0 (0.0%) | 17 (100.0%) |
| Community & Social Service | 19 (65.5%) | 10 (34.5%) |
| Education, Arts & Media | 0 (0.0%) | 1 (100.0%) |
| Legal Services & Support | 0 (0.0%) | 1 (100.0%) |
| Education Instruction & Library | 19 (70.4%) | 8 (29.6%) |
| Arts, Media & Entertainment | 0 (0.0%) | 0 (0.0%) |
| Health Diagnosing & Treating | 6 (75.0%) | 2 (25.0%) |
| Health Technologists | 6 (75.0%) | 2 (25.0%) |
| Total (Category) | 140 (59.6%) | 95 (40.4%) |
| Total (Overall) | 265 (58.1%) | 191 (41.9%) |
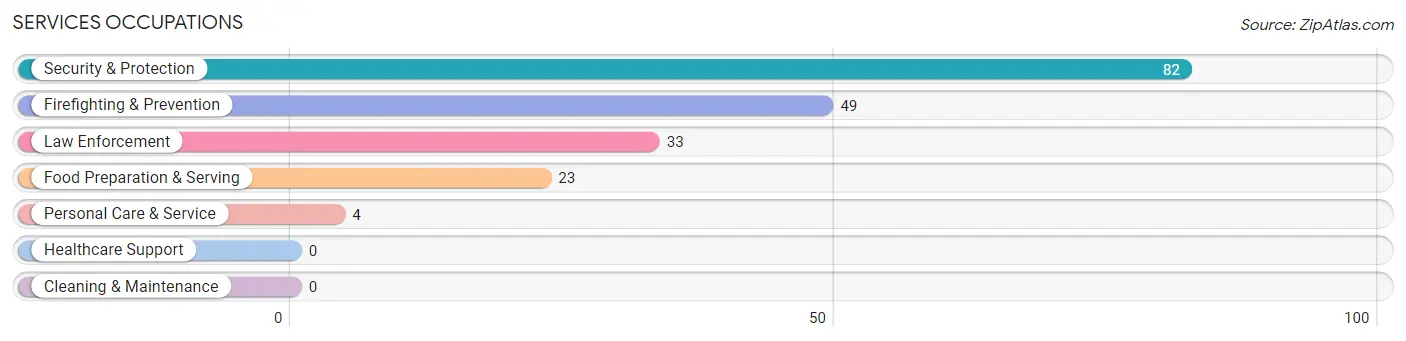
Services Occupations
The most common Services occupations in Bayview are Security & Protection (82 | 18.0%), Firefighting & Prevention (49 | 10.7%), Law Enforcement (33 | 7.2%), Food Preparation & Serving (23 | 5.0%), and Personal Care & Service (4 | 0.9%).
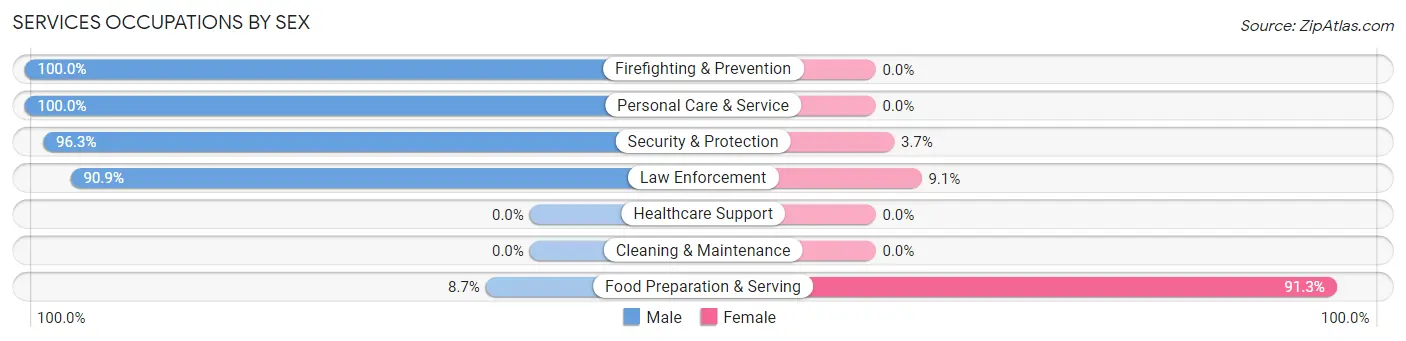
Services Occupations by Sex
Within the Services occupations in Bayview, the most male-oriented occupations are Firefighting & Prevention (100.0%), Personal Care & Service (100.0%), and Security & Protection (96.3%), while the most female-oriented occupations are Food Preparation & Serving (91.3%), Law Enforcement (9.1%), and Security & Protection (3.7%).
| Occupation | Male | Female |
| Healthcare Support | 0 (0.0%) | 0 (0.0%) |
| Security & Protection | 79 (96.3%) | 3 (3.7%) |
| Firefighting & Prevention | 49 (100.0%) | 0 (0.0%) |
| Law Enforcement | 30 (90.9%) | 3 (9.1%) |
| Food Preparation & Serving | 2 (8.7%) | 21 (91.3%) |
| Cleaning & Maintenance | 0 (0.0%) | 0 (0.0%) |
| Personal Care & Service | 4 (100.0%) | 0 (0.0%) |
| Total (Category) | 85 (78.0%) | 24 (22.0%) |
| Total (Overall) | 265 (58.1%) | 191 (41.9%) |
Sales and Office Occupations
The most common Sales and Office occupations in Bayview are Office & Administration (64 | 14.0%), and Sales & Related (29 | 6.4%).

Sales and Office Occupations by Sex

| Occupation | Male | Female |
| Sales & Related | 17 (58.6%) | 12 (41.4%) |
| Office & Administration | 8 (12.5%) | 56 (87.5%) |
| Total (Category) | 25 (26.9%) | 68 (73.1%) |
| Total (Overall) | 265 (58.1%) | 191 (41.9%) |
Natural Resources, Construction and Maintenance Occupations
The most common Natural Resources, Construction and Maintenance occupations in Bayview are Installation, Maintenance & Repair (6 | 1.3%), and Construction & Extraction (5 | 1.1%).
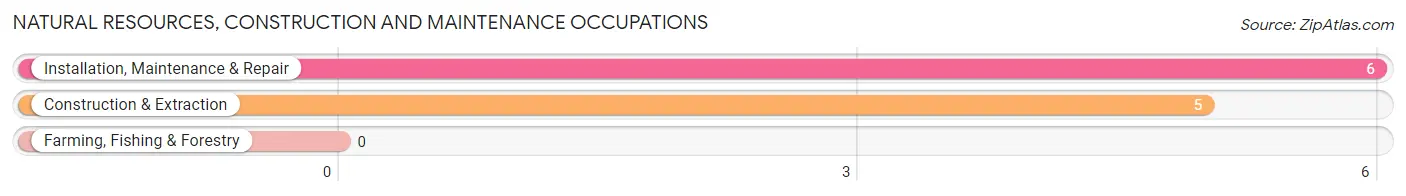
Natural Resources, Construction and Maintenance Occupations by Sex

| Occupation | Male | Female |
| Farming, Fishing & Forestry | 0 (0.0%) | 0 (0.0%) |
| Construction & Extraction | 5 (100.0%) | 0 (0.0%) |
| Installation, Maintenance & Repair | 6 (100.0%) | 0 (0.0%) |
| Total (Category) | 11 (100.0%) | 0 (0.0%) |
| Total (Overall) | 265 (58.1%) | 191 (41.9%) |
Production, Transportation and Moving Occupations
The most common Production, Transportation and Moving occupations in Bayview are Production (6 | 1.3%), and Transportation (2 | 0.4%).
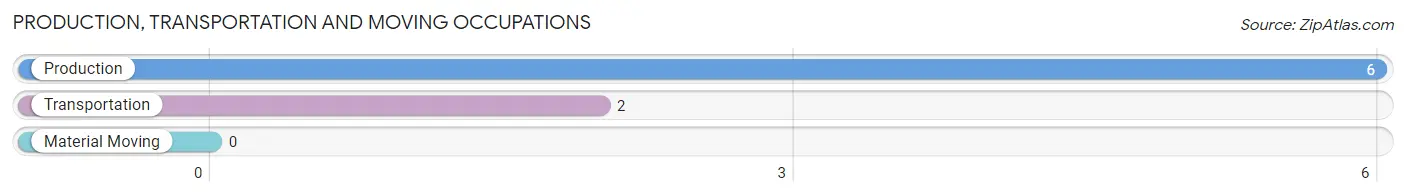
Production, Transportation and Moving Occupations by Sex
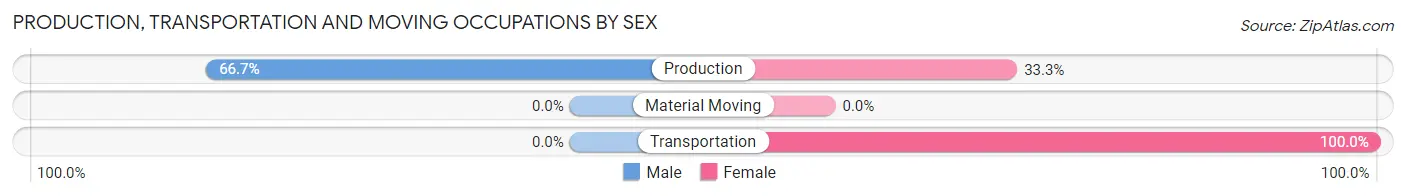
| Occupation | Male | Female |
| Production | 4 (66.7%) | 2 (33.3%) |
| Transportation | 0 (0.0%) | 2 (100.0%) |
| Material Moving | 0 (0.0%) | 0 (0.0%) |
| Total (Category) | 4 (50.0%) | 4 (50.0%) |
| Total (Overall) | 265 (58.1%) | 191 (41.9%) |
Employment Industries by Sex in Bayview
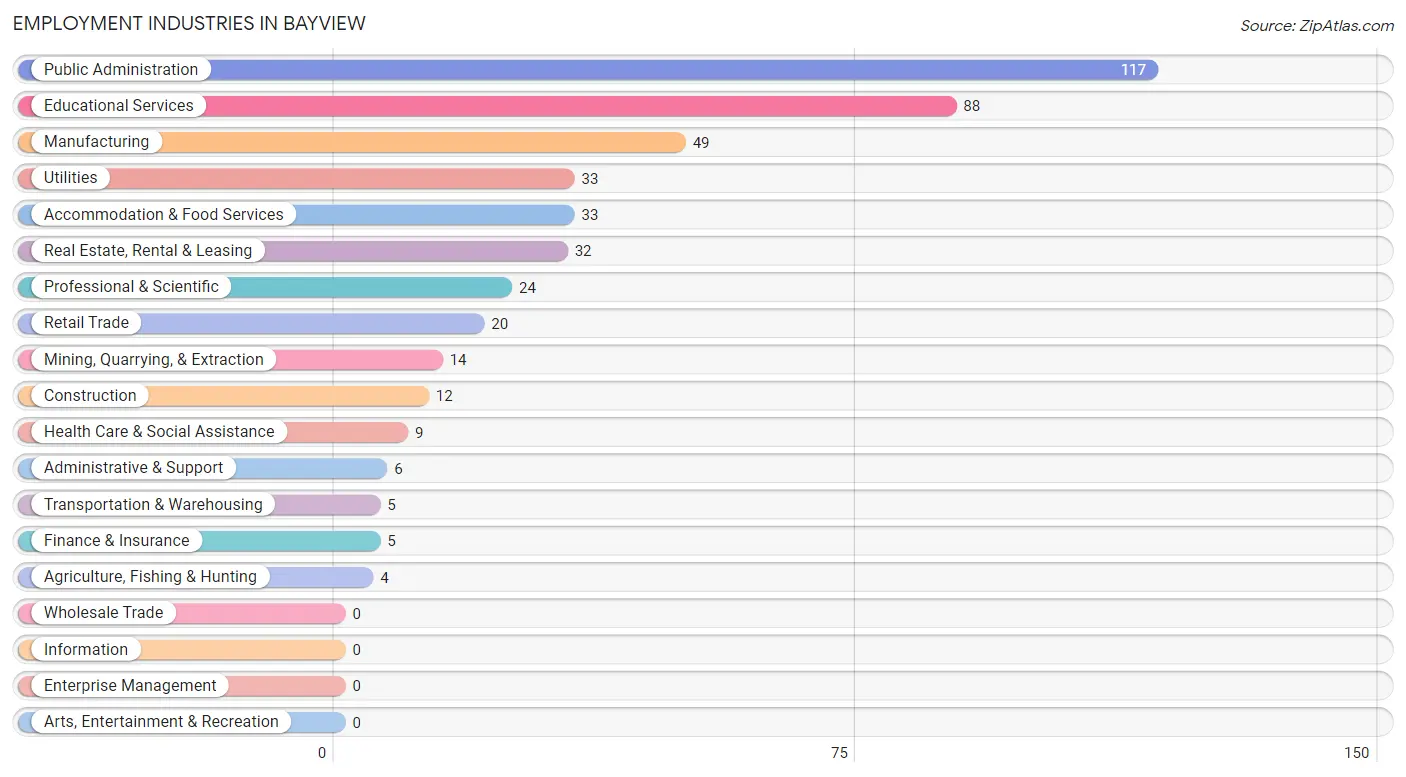
Employment Industries in Bayview
The major employment industries in Bayview include Public Administration (117 | 25.7%), Educational Services (88 | 19.3%), Manufacturing (49 | 10.7%), Utilities (33 | 7.2%), and Accommodation & Food Services (33 | 7.2%).
Employment Industries by Sex in Bayview
The Bayview industries that see more men than women are Mining, Quarrying, & Extraction (100.0%), Administrative & Support (100.0%), and Utilities (97.0%), whereas the industries that tend to have a higher number of women are Real Estate, Rental & Leasing (93.8%), Finance & Insurance (80.0%), and Accommodation & Food Services (72.7%).
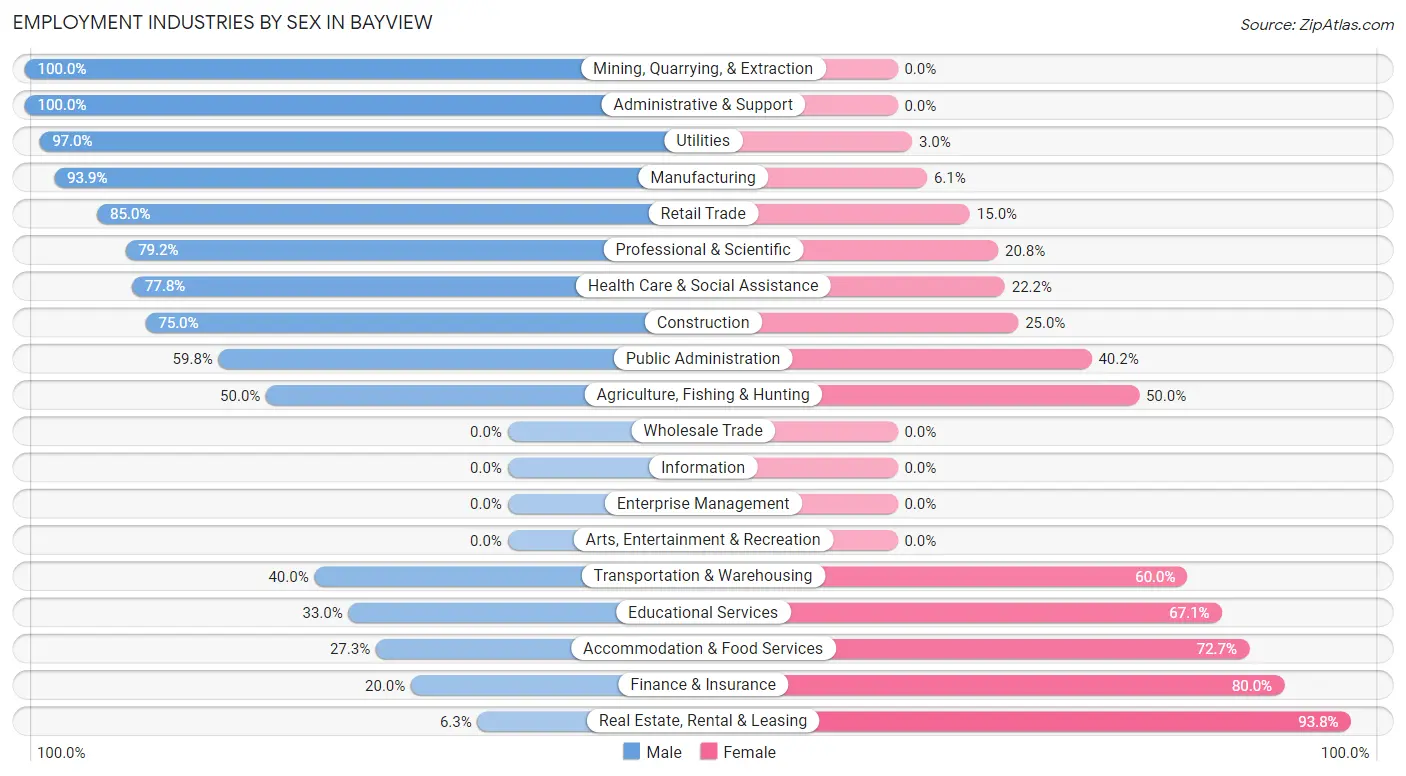
| Industry | Male | Female |
| Agriculture, Fishing & Hunting | 2 (50.0%) | 2 (50.0%) |
| Mining, Quarrying, & Extraction | 14 (100.0%) | 0 (0.0%) |
| Construction | 9 (75.0%) | 3 (25.0%) |
| Manufacturing | 46 (93.9%) | 3 (6.1%) |
| Wholesale Trade | 0 (0.0%) | 0 (0.0%) |
| Retail Trade | 17 (85.0%) | 3 (15.0%) |
| Transportation & Warehousing | 2 (40.0%) | 3 (60.0%) |
| Utilities | 32 (97.0%) | 1 (3.0%) |
| Information | 0 (0.0%) | 0 (0.0%) |
| Finance & Insurance | 1 (20.0%) | 4 (80.0%) |
| Real Estate, Rental & Leasing | 2 (6.2%) | 30 (93.8%) |
| Professional & Scientific | 19 (79.2%) | 5 (20.8%) |
| Enterprise Management | 0 (0.0%) | 0 (0.0%) |
| Administrative & Support | 6 (100.0%) | 0 (0.0%) |
| Educational Services | 29 (33.0%) | 59 (67.0%) |
| Health Care & Social Assistance | 7 (77.8%) | 2 (22.2%) |
| Arts, Entertainment & Recreation | 0 (0.0%) | 0 (0.0%) |
| Accommodation & Food Services | 9 (27.3%) | 24 (72.7%) |
| Public Administration | 70 (59.8%) | 47 (40.2%) |
| Total | 265 (58.1%) | 191 (41.9%) |
Education in Bayview
School Enrollment in Bayview
The most common levels of schooling among the 227 students in Bayview are college / undergraduate (99 | 43.6%), high school (43 | 18.9%), and graduate / professional (35 | 15.4%).
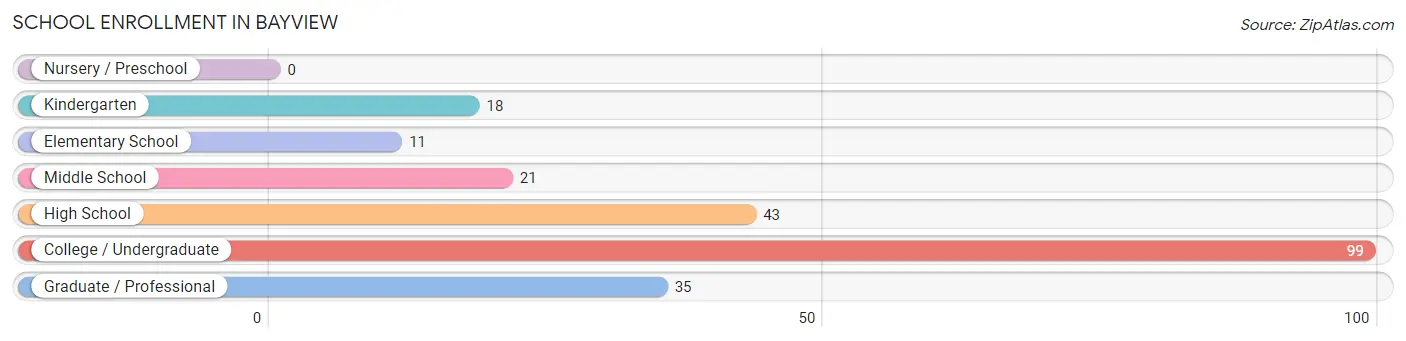
| School Level | # Students | % Students |
| Nursery / Preschool | 0 | 0.0% |
| Kindergarten | 18 | 7.9% |
| Elementary School | 11 | 4.9% |
| Middle School | 21 | 9.2% |
| High School | 43 | 18.9% |
| College / Undergraduate | 99 | 43.6% |
| Graduate / Professional | 35 | 15.4% |
| Total | 227 | 100.0% |
School Enrollment by Age by Funding Source in Bayview
Out of a total of 227 students who are enrolled in schools in Bayview, 8 (3.5%) attend a private institution, while the remaining 219 (96.5%) are enrolled in public schools. The age group of 5 to 9 year old has the highest likelihood of being enrolled in private schools, with 5 (38.5% in the age bracket) enrolled. Conversely, the age group of 3 to 4 year olds has the lowest likelihood of being enrolled in a private school, with 16 (100.0% in the age bracket) attending a public institution.
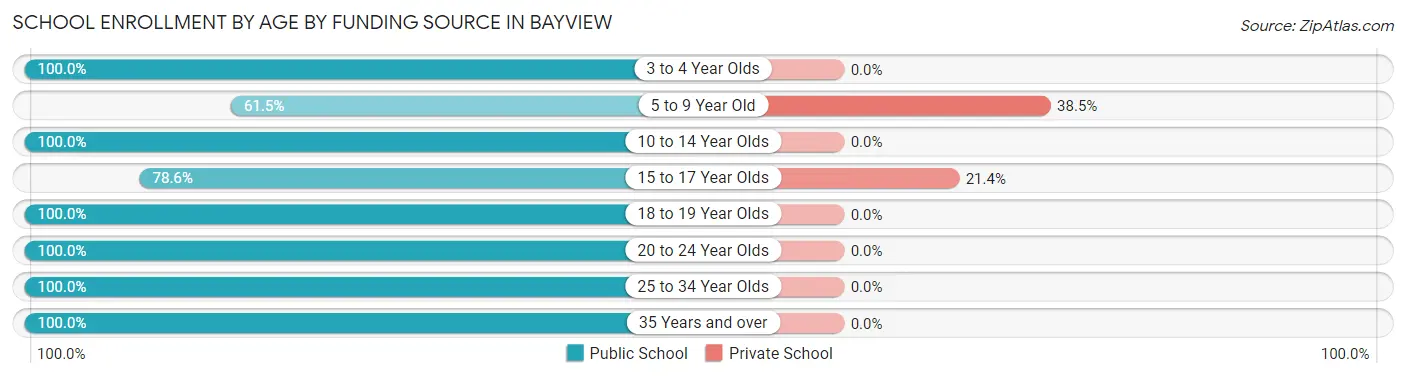
| Age Bracket | Public School | Private School |
| 3 to 4 Year Olds | 16 (100.0%) | 0 (0.0%) |
| 5 to 9 Year Old | 8 (61.5%) | 5 (38.5%) |
| 10 to 14 Year Olds | 29 (100.0%) | 0 (0.0%) |
| 15 to 17 Year Olds | 11 (78.6%) | 3 (21.4%) |
| 18 to 19 Year Olds | 16 (100.0%) | 0 (0.0%) |
| 20 to 24 Year Olds | 101 (100.0%) | 0 (0.0%) |
| 25 to 34 Year Olds | 29 (100.0%) | 0 (0.0%) |
| 35 Years and over | 9 (100.0%) | 0 (0.0%) |
| Total | 219 (96.5%) | 8 (3.5%) |
Educational Attainment by Field of Study in Bayview
Education (88 | 34.4%), computers & mathematics (56 | 21.9%), science & technology (27 | 10.5%), business (18 | 7.0%), and arts & humanities (18 | 7.0%) are the most common fields of study among 256 individuals in Bayview who have obtained a bachelor's degree or higher.
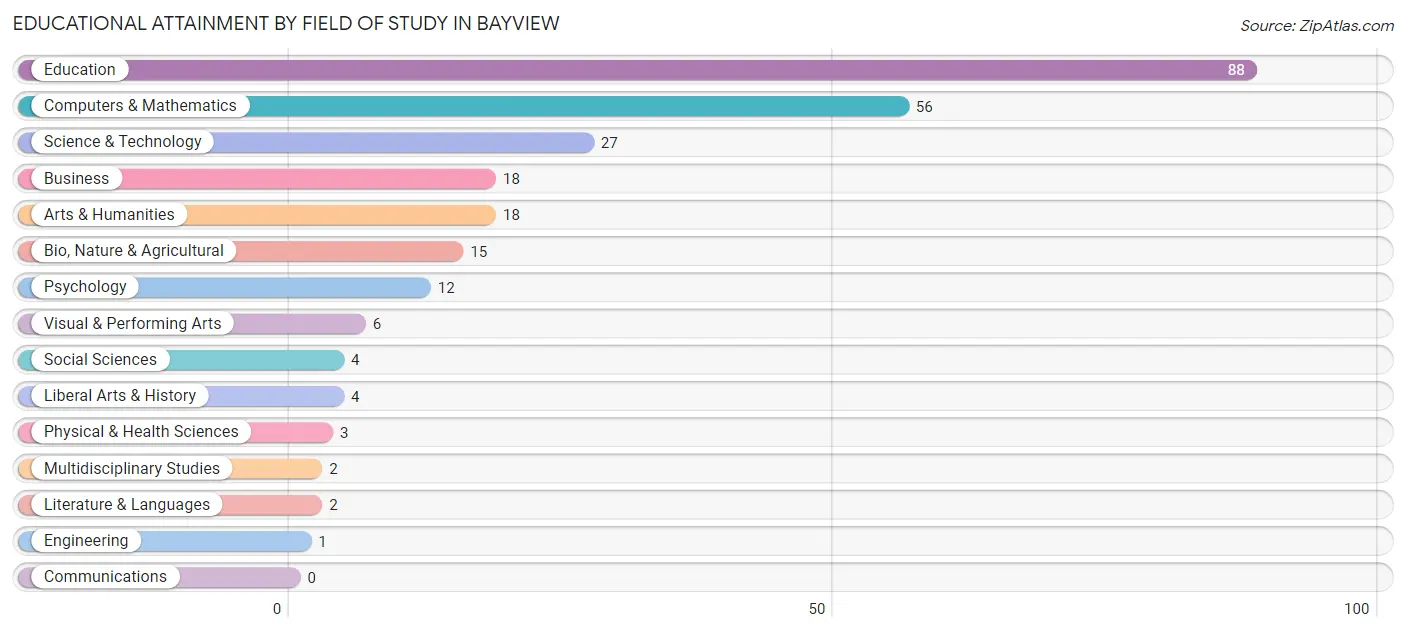
| Field of Study | # Graduates | % Graduates |
| Computers & Mathematics | 56 | 21.9% |
| Bio, Nature & Agricultural | 15 | 5.9% |
| Physical & Health Sciences | 3 | 1.2% |
| Psychology | 12 | 4.7% |
| Social Sciences | 4 | 1.6% |
| Engineering | 1 | 0.4% |
| Multidisciplinary Studies | 2 | 0.8% |
| Science & Technology | 27 | 10.5% |
| Business | 18 | 7.0% |
| Education | 88 | 34.4% |
| Literature & Languages | 2 | 0.8% |
| Liberal Arts & History | 4 | 1.6% |
| Visual & Performing Arts | 6 | 2.3% |
| Communications | 0 | 0.0% |
| Arts & Humanities | 18 | 7.0% |
| Total | 256 | 100.0% |
Transportation & Commute in Bayview
Vehicle Availability by Sex in Bayview
The most prevalent vehicle ownership categories in Bayview are males with 4 vehicles (108, accounting for 41.1%) and females with 4 vehicles (54, making up 56.5%).
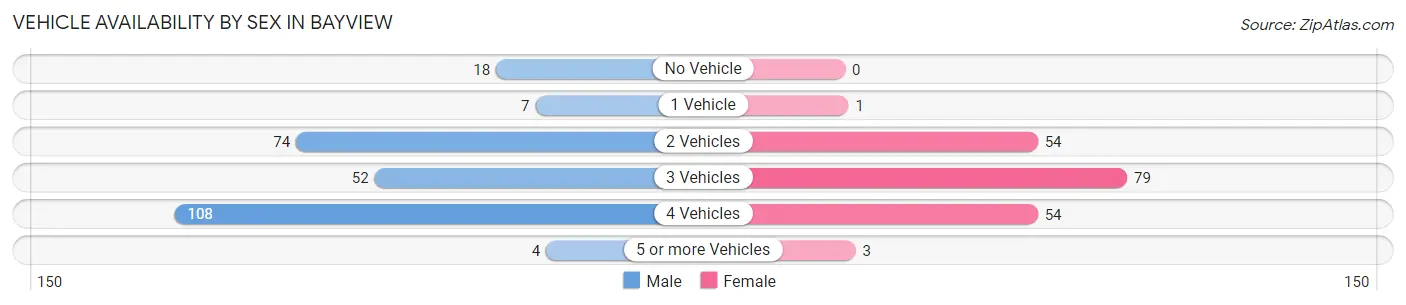
| Vehicles Available | Male | Female |
| No Vehicle | 18 (6.8%) | 0 (0.0%) |
| 1 Vehicle | 7 (2.7%) | 1 (0.5%) |
| 2 Vehicles | 74 (28.1%) | 54 (28.3%) |
| 3 Vehicles | 52 (19.8%) | 79 (41.4%) |
| 4 Vehicles | 108 (41.1%) | 54 (28.3%) |
| 5 or more Vehicles | 4 (1.5%) | 3 (1.6%) |
| Total | 263 (100.0%) | 191 (100.0%) |
Commute Time in Bayview
The most frequently occuring commute durations in Bayview are 30 to 34 minutes (109 commuters, 27.2%), 20 to 24 minutes (88 commuters, 22.0%), and 15 to 19 minutes (41 commuters, 10.2%).
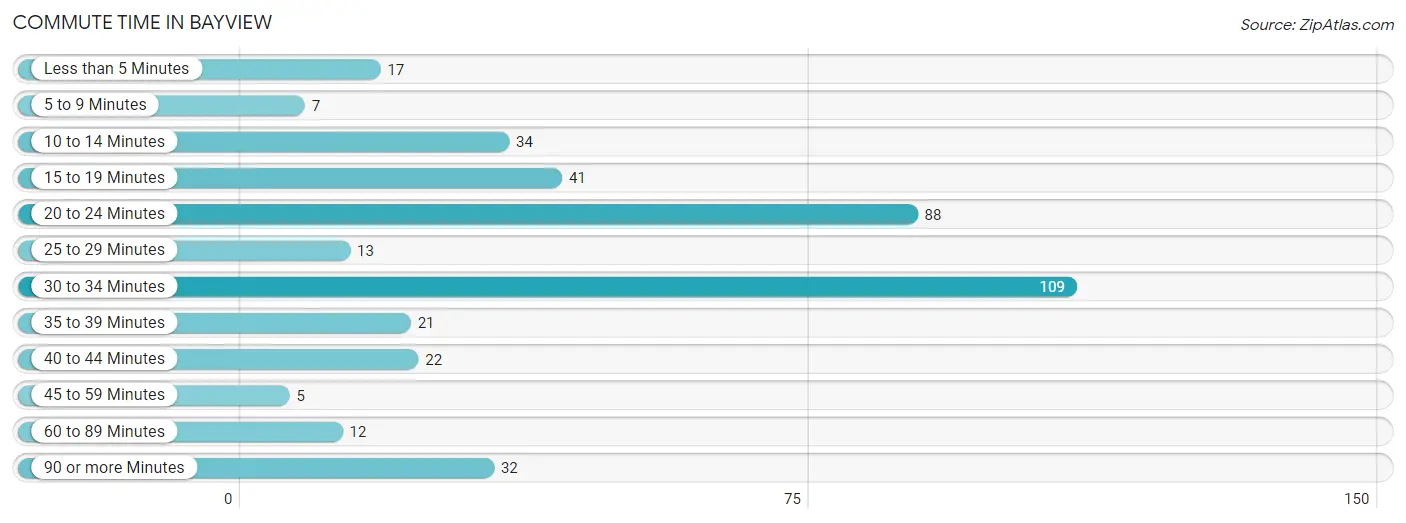
| Commute Time | # Commuters | % Commuters |
| Less than 5 Minutes | 17 | 4.2% |
| 5 to 9 Minutes | 7 | 1.8% |
| 10 to 14 Minutes | 34 | 8.5% |
| 15 to 19 Minutes | 41 | 10.2% |
| 20 to 24 Minutes | 88 | 22.0% |
| 25 to 29 Minutes | 13 | 3.2% |
| 30 to 34 Minutes | 109 | 27.2% |
| 35 to 39 Minutes | 21 | 5.2% |
| 40 to 44 Minutes | 22 | 5.5% |
| 45 to 59 Minutes | 5 | 1.3% |
| 60 to 89 Minutes | 12 | 3.0% |
| 90 or more Minutes | 32 | 8.0% |
Commute Time by Sex in Bayview
The most common commute times in Bayview are 20 to 24 minutes (85 commuters, 38.3%) for males and 30 to 34 minutes (45 commuters, 25.1%) for females.
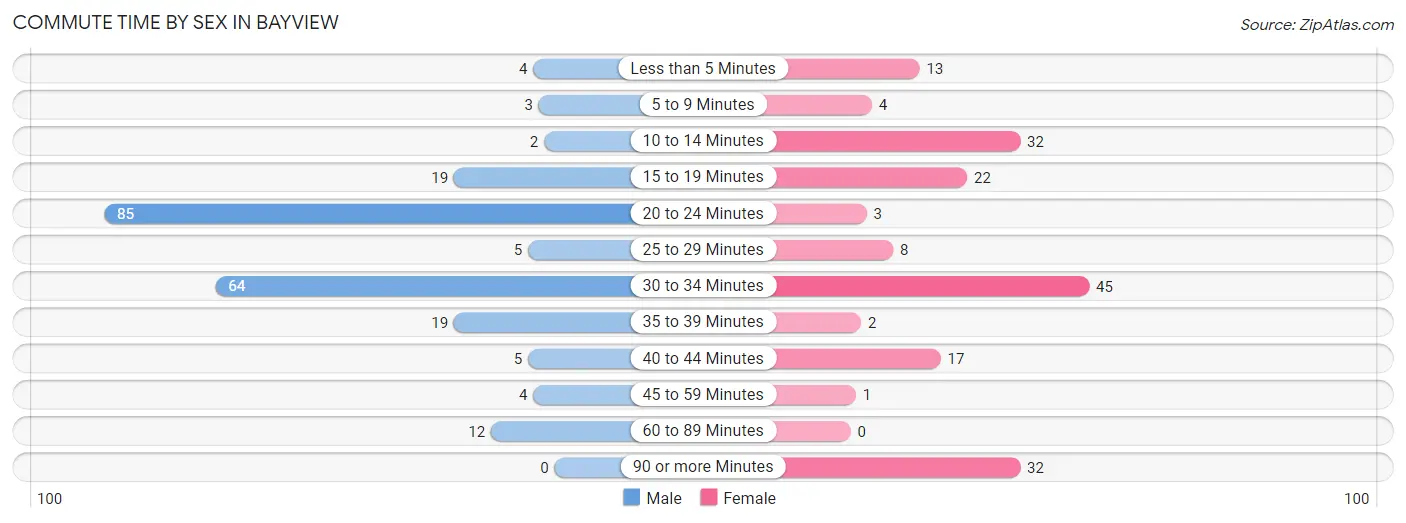
| Commute Time | Male | Female |
| Less than 5 Minutes | 4 (1.8%) | 13 (7.3%) |
| 5 to 9 Minutes | 3 (1.3%) | 4 (2.2%) |
| 10 to 14 Minutes | 2 (0.9%) | 32 (17.9%) |
| 15 to 19 Minutes | 19 (8.6%) | 22 (12.3%) |
| 20 to 24 Minutes | 85 (38.3%) | 3 (1.7%) |
| 25 to 29 Minutes | 5 (2.2%) | 8 (4.5%) |
| 30 to 34 Minutes | 64 (28.8%) | 45 (25.1%) |
| 35 to 39 Minutes | 19 (8.6%) | 2 (1.1%) |
| 40 to 44 Minutes | 5 (2.2%) | 17 (9.5%) |
| 45 to 59 Minutes | 4 (1.8%) | 1 (0.6%) |
| 60 to 89 Minutes | 12 (5.4%) | 0 (0.0%) |
| 90 or more Minutes | 0 (0.0%) | 32 (17.9%) |
Time of Departure to Work by Sex in Bayview
The most frequent times of departure to work in Bayview are 7:30 AM to 7:59 AM (94, 42.3%) for males and 7:30 AM to 7:59 AM (54, 30.2%) for females.
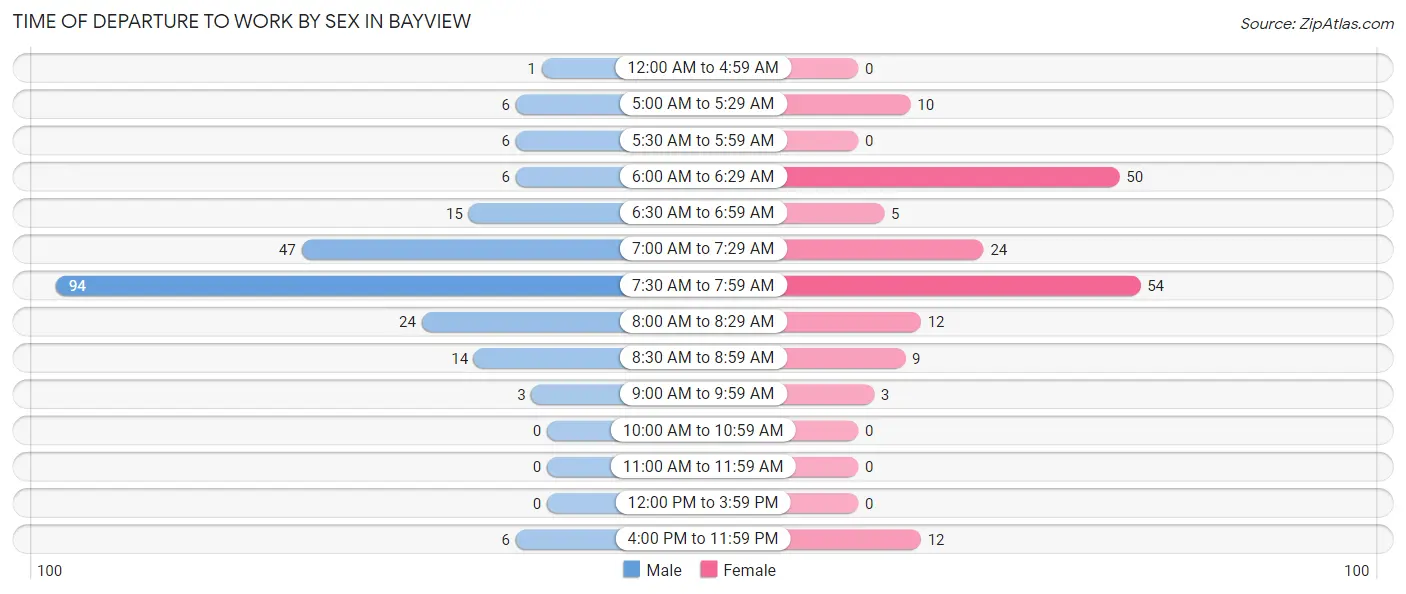
| Time of Departure | Male | Female |
| 12:00 AM to 4:59 AM | 1 (0.4%) | 0 (0.0%) |
| 5:00 AM to 5:29 AM | 6 (2.7%) | 10 (5.6%) |
| 5:30 AM to 5:59 AM | 6 (2.7%) | 0 (0.0%) |
| 6:00 AM to 6:29 AM | 6 (2.7%) | 50 (27.9%) |
| 6:30 AM to 6:59 AM | 15 (6.8%) | 5 (2.8%) |
| 7:00 AM to 7:29 AM | 47 (21.2%) | 24 (13.4%) |
| 7:30 AM to 7:59 AM | 94 (42.3%) | 54 (30.2%) |
| 8:00 AM to 8:29 AM | 24 (10.8%) | 12 (6.7%) |
| 8:30 AM to 8:59 AM | 14 (6.3%) | 9 (5.0%) |
| 9:00 AM to 9:59 AM | 3 (1.3%) | 3 (1.7%) |
| 10:00 AM to 10:59 AM | 0 (0.0%) | 0 (0.0%) |
| 11:00 AM to 11:59 AM | 0 (0.0%) | 0 (0.0%) |
| 12:00 PM to 3:59 PM | 0 (0.0%) | 0 (0.0%) |
| 4:00 PM to 11:59 PM | 6 (2.7%) | 12 (6.7%) |
| Total | 222 (100.0%) | 179 (100.0%) |
Housing Occupancy in Bayview
Occupancy by Ownership in Bayview
Of the total 265 dwellings in Bayview, owner-occupied units account for 251 (94.7%), while renter-occupied units make up 14 (5.3%).
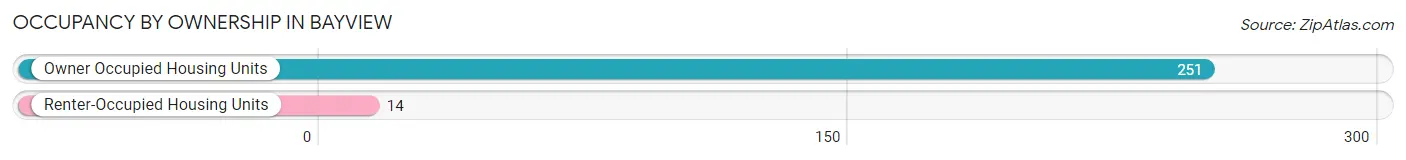
| Occupancy | # Housing Units | % Housing Units |
| Owner Occupied Housing Units | 251 | 94.7% |
| Renter-Occupied Housing Units | 14 | 5.3% |
| Total Occupied Housing Units | 265 | 100.0% |
Occupancy by Household Size in Bayview
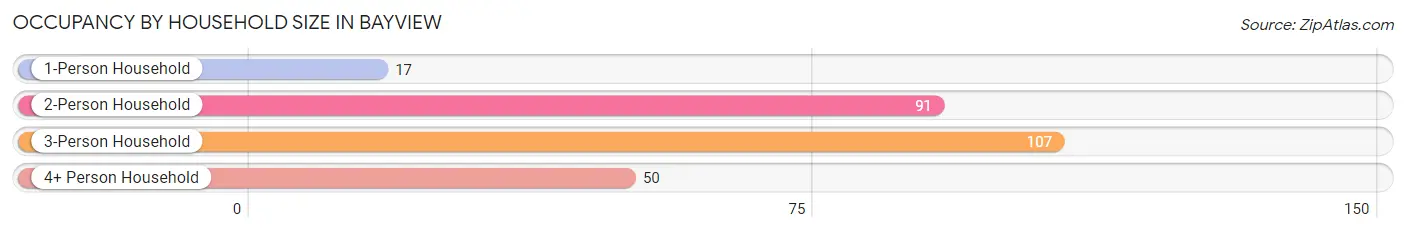
| Household Size | # Housing Units | % Housing Units |
| 1-Person Household | 17 | 6.4% |
| 2-Person Household | 91 | 34.3% |
| 3-Person Household | 107 | 40.4% |
| 4+ Person Household | 50 | 18.9% |
| Total Housing Units | 265 | 100.0% |
Occupancy by Ownership by Household Size in Bayview
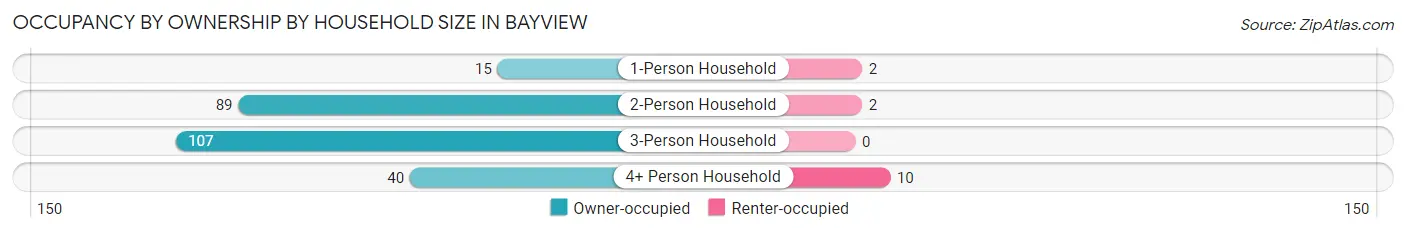
| Household Size | Owner-occupied | Renter-occupied |
| 1-Person Household | 15 (88.2%) | 2 (11.8%) |
| 2-Person Household | 89 (97.8%) | 2 (2.2%) |
| 3-Person Household | 107 (100.0%) | 0 (0.0%) |
| 4+ Person Household | 40 (80.0%) | 10 (20.0%) |
| Total Housing Units | 251 (94.7%) | 14 (5.3%) |
Occupancy by Educational Attainment in Bayview
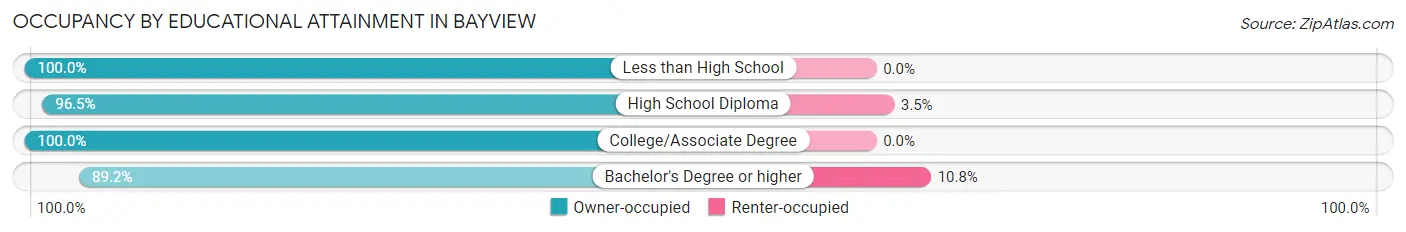
| Household Size | Owner-occupied | Renter-occupied |
| Less than High School | 5 (100.0%) | 0 (0.0%) |
| High School Diploma | 55 (96.5%) | 2 (3.5%) |
| College/Associate Degree | 92 (100.0%) | 0 (0.0%) |
| Bachelor's Degree or higher | 99 (89.2%) | 12 (10.8%) |
Occupancy by Age of Householder in Bayview
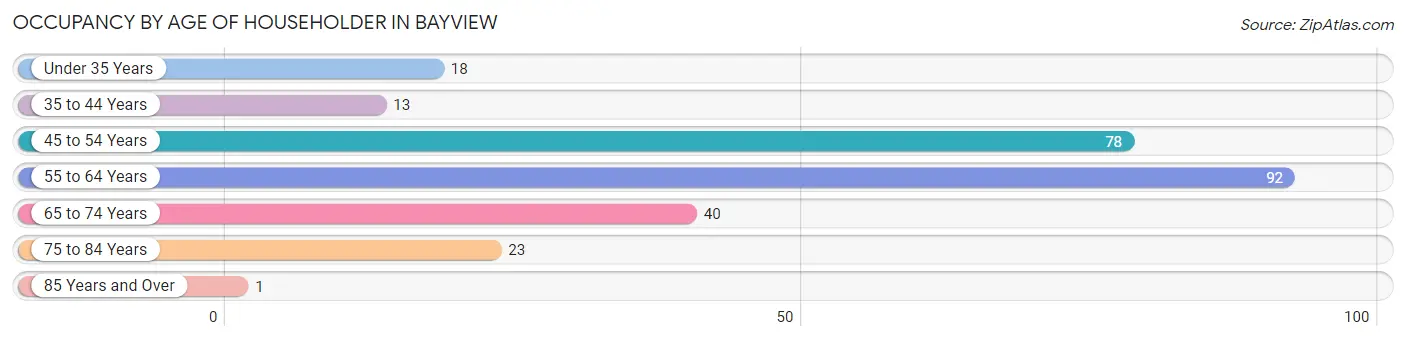
| Age Bracket | # Households | % Households |
| Under 35 Years | 18 | 6.8% |
| 35 to 44 Years | 13 | 4.9% |
| 45 to 54 Years | 78 | 29.4% |
| 55 to 64 Years | 92 | 34.7% |
| 65 to 74 Years | 40 | 15.1% |
| 75 to 84 Years | 23 | 8.7% |
| 85 Years and Over | 1 | 0.4% |
| Total | 265 | 100.0% |
Housing Finances in Bayview
Median Income by Occupancy in Bayview
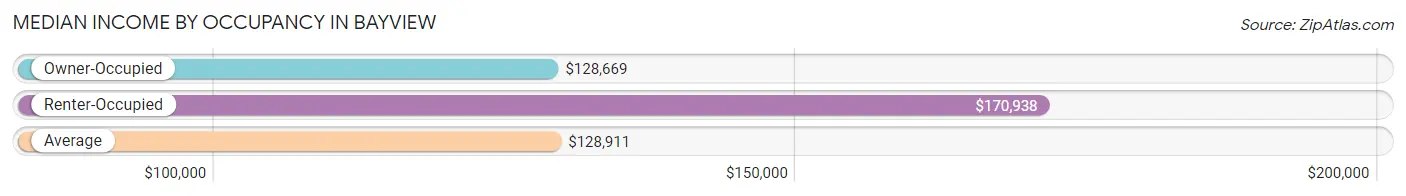
| Occupancy Type | # Households | Median Income |
| Owner-Occupied | 251 (94.7%) | $128,669 |
| Renter-Occupied | 14 (5.3%) | $170,938 |
| Average | 265 (100.0%) | $128,911 |
Occupancy by Householder Income Bracket in Bayview
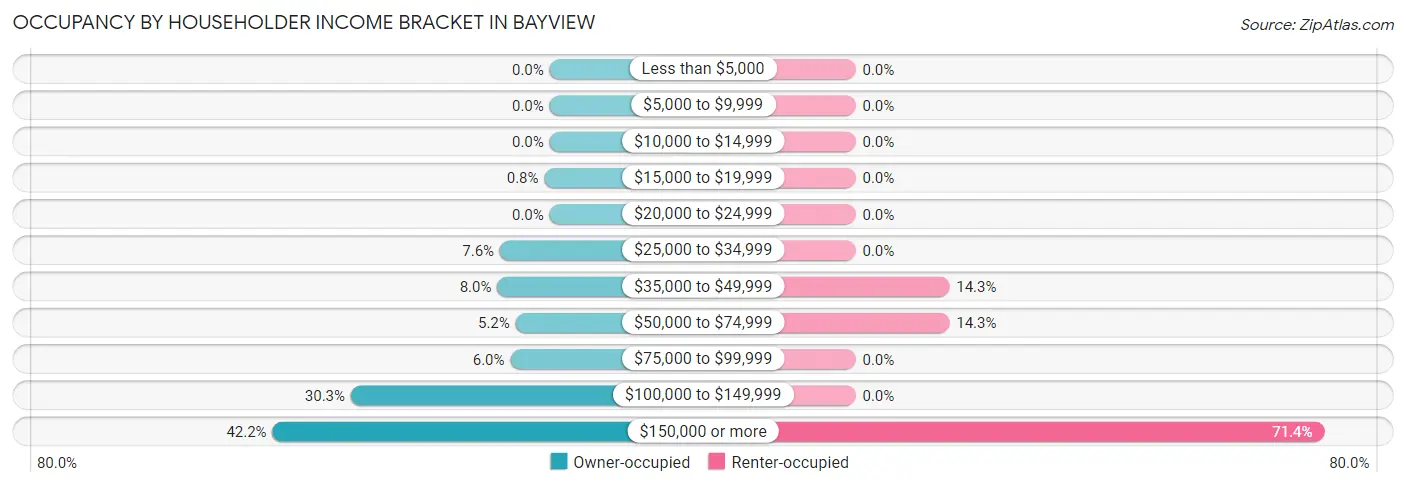
| Income Bracket | Owner-occupied | Renter-occupied |
| Less than $5,000 | 0 (0.0%) | 0 (0.0%) |
| $5,000 to $9,999 | 0 (0.0%) | 0 (0.0%) |
| $10,000 to $14,999 | 0 (0.0%) | 0 (0.0%) |
| $15,000 to $19,999 | 2 (0.8%) | 0 (0.0%) |
| $20,000 to $24,999 | 0 (0.0%) | 0 (0.0%) |
| $25,000 to $34,999 | 19 (7.6%) | 0 (0.0%) |
| $35,000 to $49,999 | 20 (8.0%) | 2 (14.3%) |
| $50,000 to $74,999 | 13 (5.2%) | 2 (14.3%) |
| $75,000 to $99,999 | 15 (6.0%) | 0 (0.0%) |
| $100,000 to $149,999 | 76 (30.3%) | 0 (0.0%) |
| $150,000 or more | 106 (42.2%) | 10 (71.4%) |
| Total | 251 (100.0%) | 14 (100.0%) |
Monthly Housing Cost Tiers in Bayview
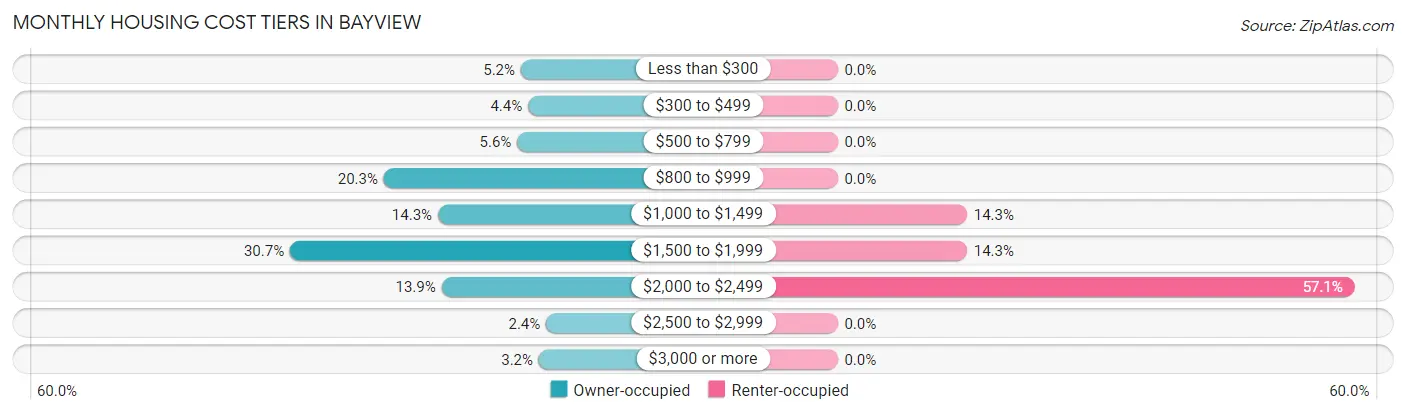
| Monthly Cost | Owner-occupied | Renter-occupied |
| Less than $300 | 13 (5.2%) | 0 (0.0%) |
| $300 to $499 | 11 (4.4%) | 0 (0.0%) |
| $500 to $799 | 14 (5.6%) | 0 (0.0%) |
| $800 to $999 | 51 (20.3%) | 0 (0.0%) |
| $1,000 to $1,499 | 36 (14.3%) | 2 (14.3%) |
| $1,500 to $1,999 | 77 (30.7%) | 2 (14.3%) |
| $2,000 to $2,499 | 35 (13.9%) | 8 (57.1%) |
| $2,500 to $2,999 | 6 (2.4%) | 0 (0.0%) |
| $3,000 or more | 8 (3.2%) | 0 (0.0%) |
| Total | 251 (100.0%) | 14 (100.0%) |
Physical Housing Characteristics in Bayview
Housing Structures in Bayview
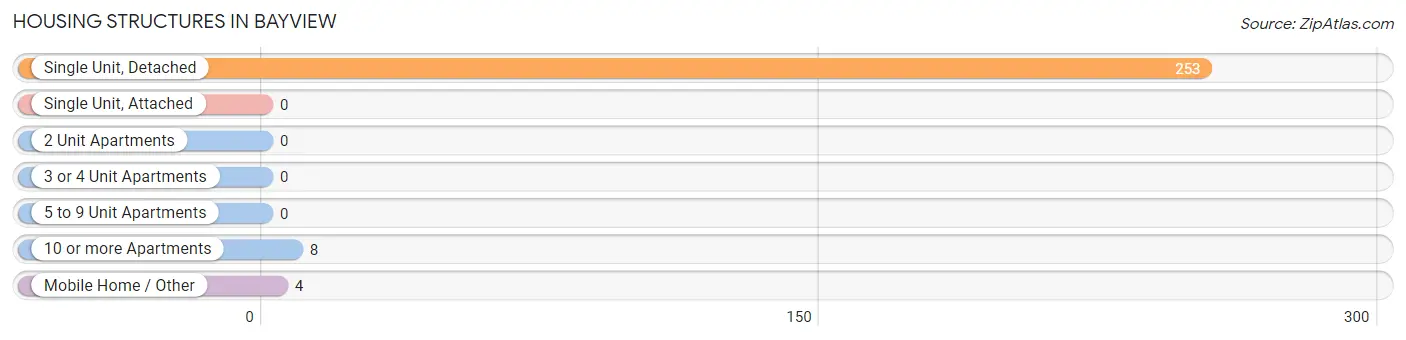
| Structure Type | # Housing Units | % Housing Units |
| Single Unit, Detached | 253 | 95.5% |
| Single Unit, Attached | 0 | 0.0% |
| 2 Unit Apartments | 0 | 0.0% |
| 3 or 4 Unit Apartments | 0 | 0.0% |
| 5 to 9 Unit Apartments | 0 | 0.0% |
| 10 or more Apartments | 8 | 3.0% |
| Mobile Home / Other | 4 | 1.5% |
| Total | 265 | 100.0% |
Housing Structures by Occupancy in Bayview
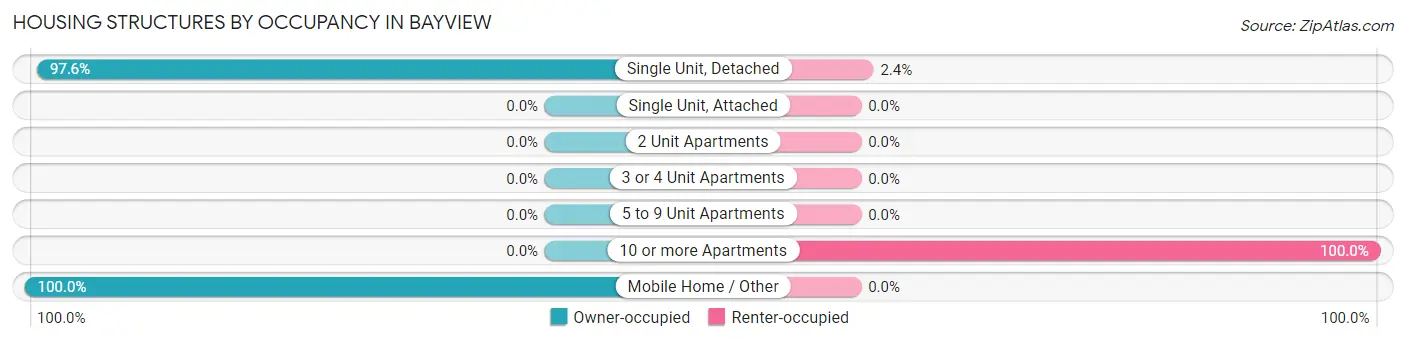
| Structure Type | Owner-occupied | Renter-occupied |
| Single Unit, Detached | 247 (97.6%) | 6 (2.4%) |
| Single Unit, Attached | 0 (0.0%) | 0 (0.0%) |
| 2 Unit Apartments | 0 (0.0%) | 0 (0.0%) |
| 3 or 4 Unit Apartments | 0 (0.0%) | 0 (0.0%) |
| 5 to 9 Unit Apartments | 0 (0.0%) | 0 (0.0%) |
| 10 or more Apartments | 0 (0.0%) | 8 (100.0%) |
| Mobile Home / Other | 4 (100.0%) | 0 (0.0%) |
| Total | 251 (94.7%) | 14 (5.3%) |
Housing Structures by Number of Rooms in Bayview
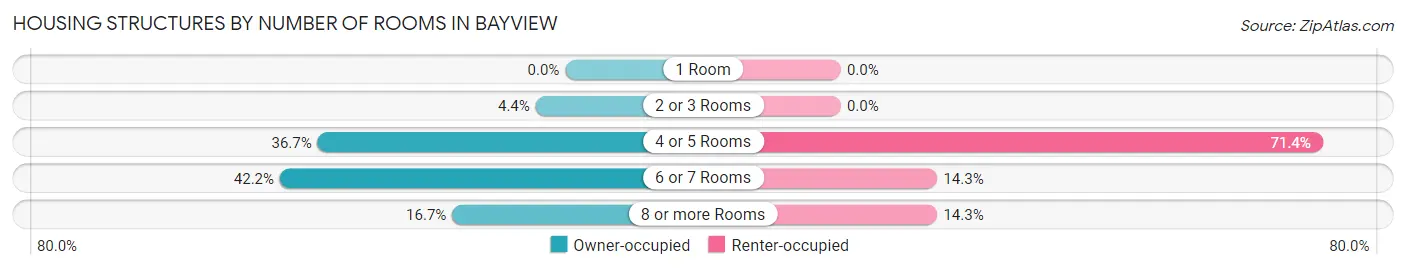
| Number of Rooms | Owner-occupied | Renter-occupied |
| 1 Room | 0 (0.0%) | 0 (0.0%) |
| 2 or 3 Rooms | 11 (4.4%) | 0 (0.0%) |
| 4 or 5 Rooms | 92 (36.6%) | 10 (71.4%) |
| 6 or 7 Rooms | 106 (42.2%) | 2 (14.3%) |
| 8 or more Rooms | 42 (16.7%) | 2 (14.3%) |
| Total | 251 (100.0%) | 14 (100.0%) |
Housing Structure by Heating Type in Bayview
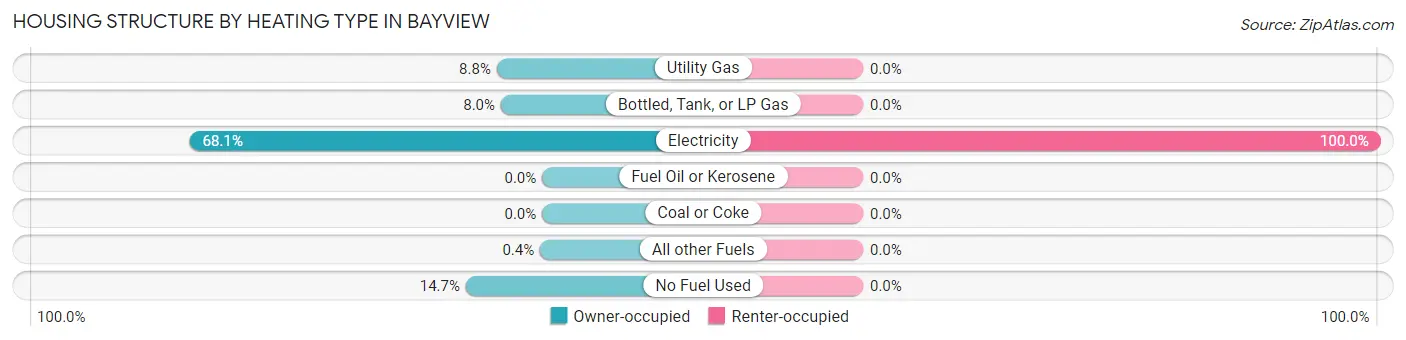
| Heating Type | Owner-occupied | Renter-occupied |
| Utility Gas | 22 (8.8%) | 0 (0.0%) |
| Bottled, Tank, or LP Gas | 20 (8.0%) | 0 (0.0%) |
| Electricity | 171 (68.1%) | 14 (100.0%) |
| Fuel Oil or Kerosene | 0 (0.0%) | 0 (0.0%) |
| Coal or Coke | 0 (0.0%) | 0 (0.0%) |
| All other Fuels | 1 (0.4%) | 0 (0.0%) |
| No Fuel Used | 37 (14.7%) | 0 (0.0%) |
| Total | 251 (100.0%) | 14 (100.0%) |
Household Vehicle Usage in Bayview
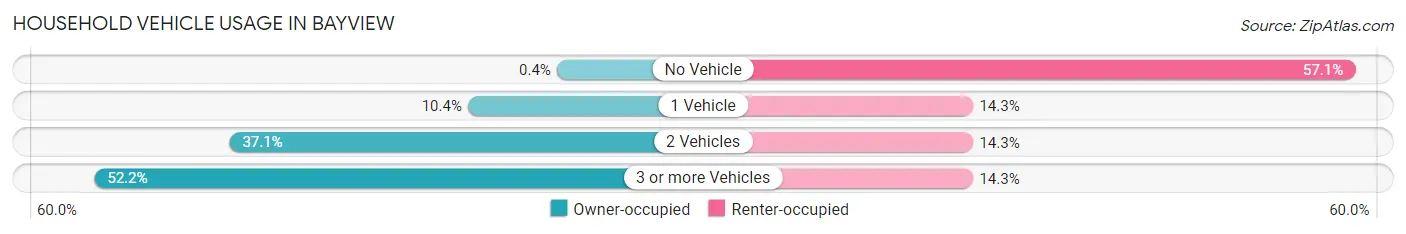
| Vehicles per Household | Owner-occupied | Renter-occupied |
| No Vehicle | 1 (0.4%) | 8 (57.1%) |
| 1 Vehicle | 26 (10.4%) | 2 (14.3%) |
| 2 Vehicles | 93 (37.0%) | 2 (14.3%) |
| 3 or more Vehicles | 131 (52.2%) | 2 (14.3%) |
| Total | 251 (100.0%) | 14 (100.0%) |
Real Estate & Mortgages in Bayview
Real Estate and Mortgage Overview in Bayview
| Characteristic | Without Mortgage | With Mortgage |
| Housing Units | 114 | 137 |
| Median Property Value | $354,900 | $230,100 |
| Median Household Income | $120,833 | $52 |
| Monthly Housing Costs | $853 | $8 |
| Real Estate Taxes | $4,489 | $1 |
Property Value by Mortgage Status in Bayview
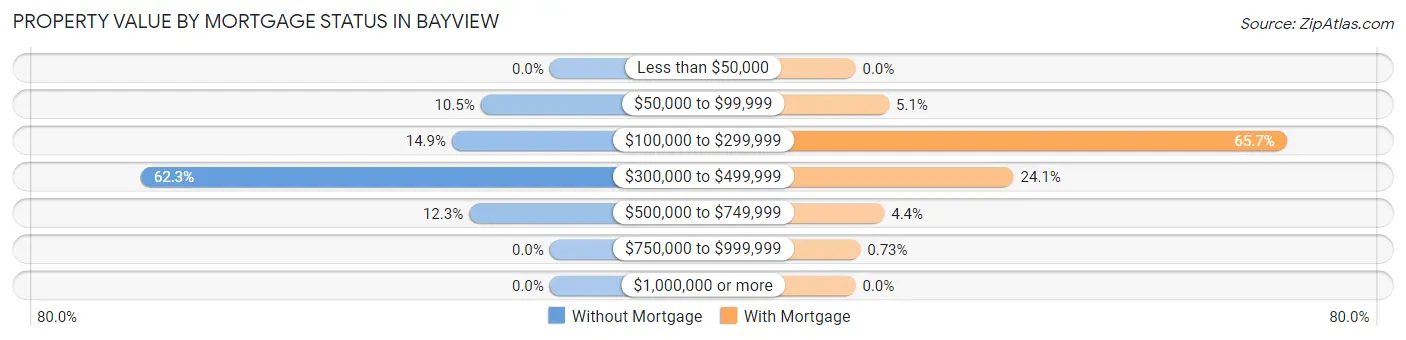
| Property Value | Without Mortgage | With Mortgage |
| Less than $50,000 | 0 (0.0%) | 0 (0.0%) |
| $50,000 to $99,999 | 12 (10.5%) | 7 (5.1%) |
| $100,000 to $299,999 | 17 (14.9%) | 90 (65.7%) |
| $300,000 to $499,999 | 71 (62.3%) | 33 (24.1%) |
| $500,000 to $749,999 | 14 (12.3%) | 6 (4.4%) |
| $750,000 to $999,999 | 0 (0.0%) | 1 (0.7%) |
| $1,000,000 or more | 0 (0.0%) | 0 (0.0%) |
| Total | 114 (100.0%) | 137 (100.0%) |
Household Income by Mortgage Status in Bayview
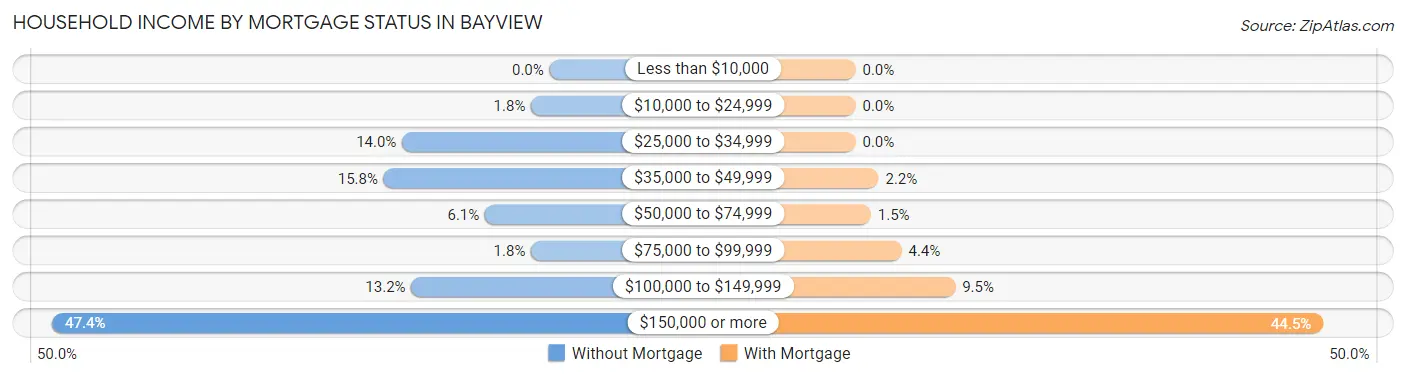
| Household Income | Without Mortgage | With Mortgage |
| Less than $10,000 | 0 (0.0%) | 0 (0.0%) |
| $10,000 to $24,999 | 2 (1.8%) | 0 (0.0%) |
| $25,000 to $34,999 | 16 (14.0%) | 0 (0.0%) |
| $35,000 to $49,999 | 18 (15.8%) | 3 (2.2%) |
| $50,000 to $74,999 | 7 (6.1%) | 2 (1.5%) |
| $75,000 to $99,999 | 2 (1.8%) | 6 (4.4%) |
| $100,000 to $149,999 | 15 (13.2%) | 13 (9.5%) |
| $150,000 or more | 54 (47.4%) | 61 (44.5%) |
| Total | 114 (100.0%) | 137 (100.0%) |
Property Value to Household Income Ratio in Bayview
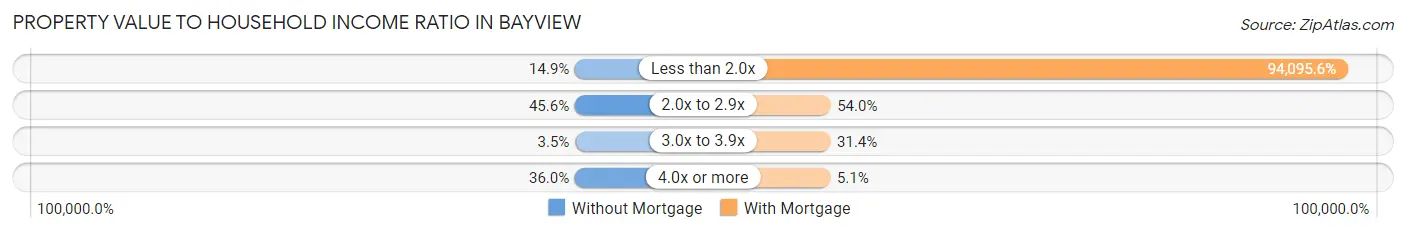
| Value-to-Income Ratio | Without Mortgage | With Mortgage |
| Less than 2.0x | 17 (14.9%) | 128,911 (94,095.6%) |
| 2.0x to 2.9x | 52 (45.6%) | 74 (54.0%) |
| 3.0x to 3.9x | 4 (3.5%) | 43 (31.4%) |
| 4.0x or more | 41 (36.0%) | 7 (5.1%) |
| Total | 114 (100.0%) | 137 (100.0%) |
Real Estate Taxes by Mortgage Status in Bayview
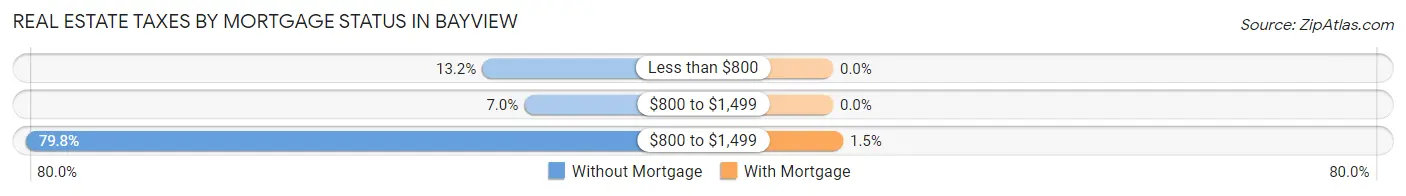
| Property Taxes | Without Mortgage | With Mortgage |
| Less than $800 | 15 (13.2%) | 0 (0.0%) |
| $800 to $1,499 | 8 (7.0%) | 0 (0.0%) |
| $800 to $1,499 | 91 (79.8%) | 2 (1.5%) |
| Total | 114 (100.0%) | 137 (100.0%) |
Health & Disability in Bayview
Health Insurance Coverage by Age in Bayview
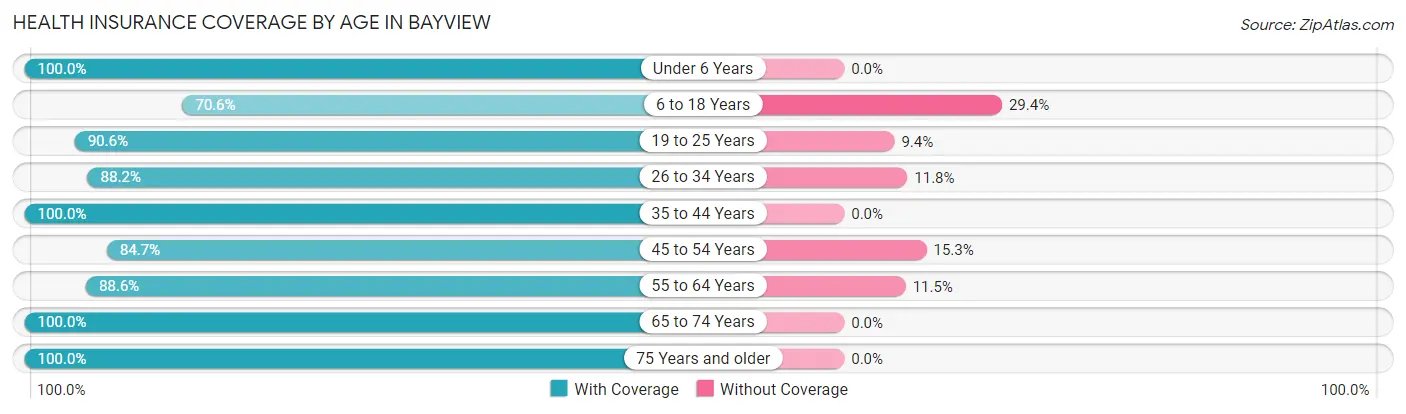
| Age Bracket | With Coverage | Without Coverage |
| Under 6 Years | 22 (100.0%) | 0 (0.0%) |
| 6 to 18 Years | 48 (70.6%) | 20 (29.4%) |
| 19 to 25 Years | 155 (90.6%) | 16 (9.4%) |
| 26 to 34 Years | 45 (88.2%) | 6 (11.8%) |
| 35 to 44 Years | 36 (100.0%) | 0 (0.0%) |
| 45 to 54 Years | 149 (84.7%) | 27 (15.3%) |
| 55 to 64 Years | 116 (88.5%) | 15 (11.5%) |
| 65 to 74 Years | 85 (100.0%) | 0 (0.0%) |
| 75 Years and older | 44 (100.0%) | 0 (0.0%) |
| Total | 700 (89.3%) | 84 (10.7%) |
Health Insurance Coverage by Citizenship Status in Bayview

| Citizenship Status | With Coverage | Without Coverage |
| Native Born | 22 (100.0%) | 0 (0.0%) |
| Foreign Born, Citizen | 48 (70.6%) | 20 (29.4%) |
| Foreign Born, not a Citizen | 155 (90.6%) | 16 (9.4%) |
Health Insurance Coverage by Household Income in Bayview
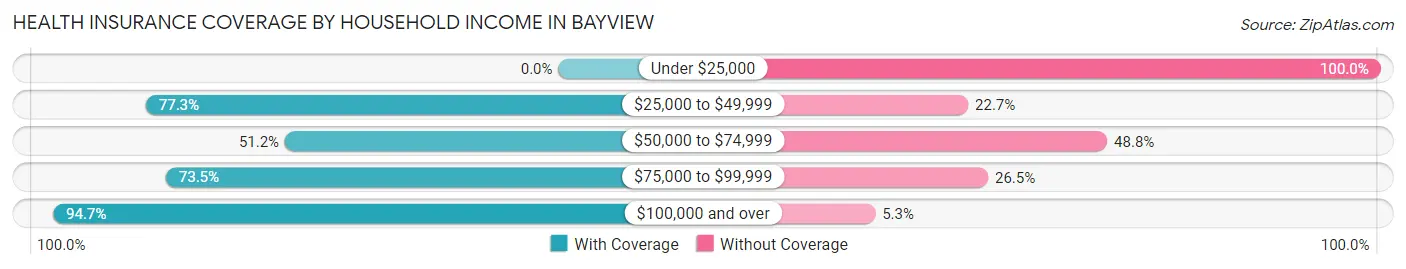
| Household Income | With Coverage | Without Coverage |
| Under $25,000 | 0 (0.0%) | 2 (100.0%) |
| $25,000 to $49,999 | 68 (77.3%) | 20 (22.7%) |
| $50,000 to $74,999 | 21 (51.2%) | 20 (48.8%) |
| $75,000 to $99,999 | 25 (73.5%) | 9 (26.5%) |
| $100,000 and over | 586 (94.7%) | 33 (5.3%) |
Public vs Private Health Insurance Coverage by Age in Bayview
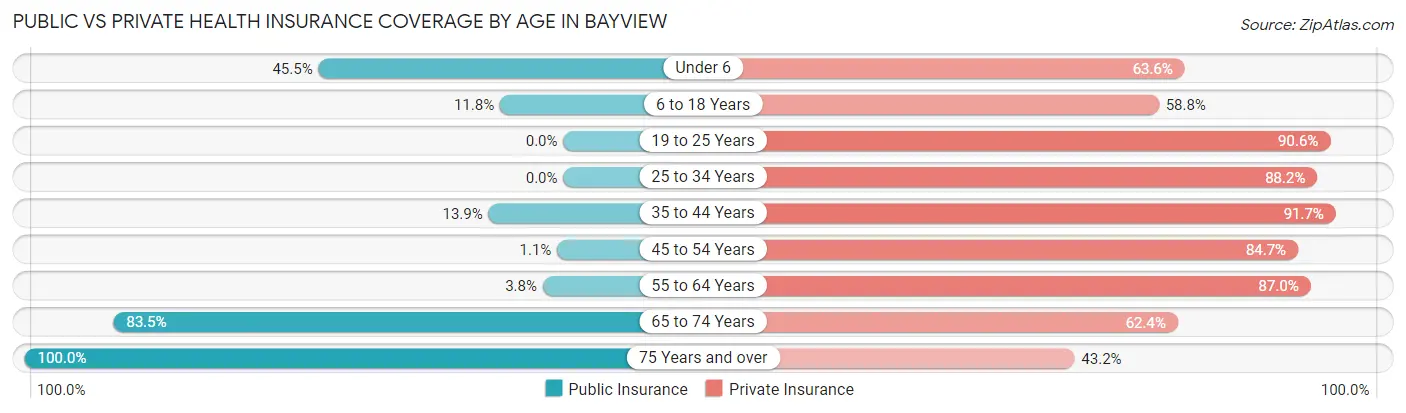
| Age Bracket | Public Insurance | Private Insurance |
| Under 6 | 10 (45.5%) | 14 (63.6%) |
| 6 to 18 Years | 8 (11.8%) | 40 (58.8%) |
| 19 to 25 Years | 0 (0.0%) | 155 (90.6%) |
| 25 to 34 Years | 0 (0.0%) | 45 (88.2%) |
| 35 to 44 Years | 5 (13.9%) | 33 (91.7%) |
| 45 to 54 Years | 2 (1.1%) | 149 (84.7%) |
| 55 to 64 Years | 5 (3.8%) | 114 (87.0%) |
| 65 to 74 Years | 71 (83.5%) | 53 (62.4%) |
| 75 Years and over | 44 (100.0%) | 19 (43.2%) |
| Total | 145 (18.5%) | 622 (79.3%) |
Disability Status by Sex by Age in Bayview
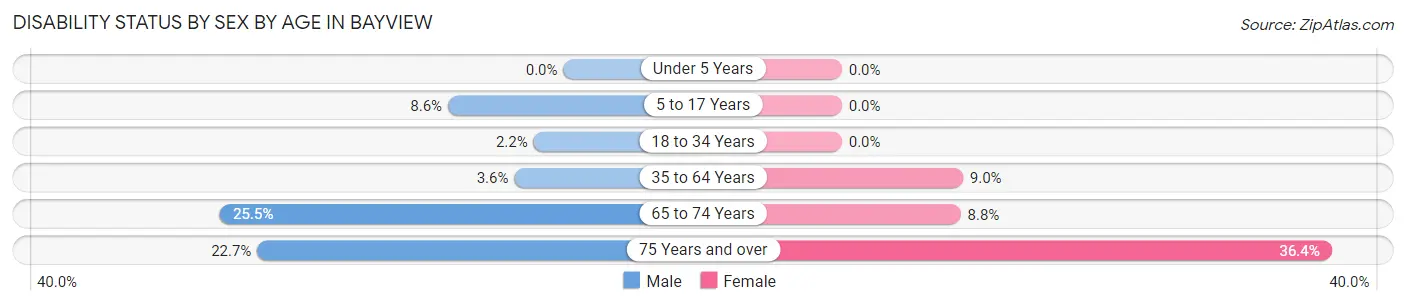
| Age Bracket | Male | Female |
| Under 5 Years | 0 (0.0%) | 0 (0.0%) |
| 5 to 17 Years | 3 (8.6%) | 0 (0.0%) |
| 18 to 34 Years | 4 (2.2%) | 0 (0.0%) |
| 35 to 64 Years | 6 (3.6%) | 16 (9.0%) |
| 65 to 74 Years | 13 (25.5%) | 3 (8.8%) |
| 75 Years and over | 5 (22.7%) | 8 (36.4%) |
Disability Class by Sex by Age in Bayview
Disability Class: Hearing Difficulty
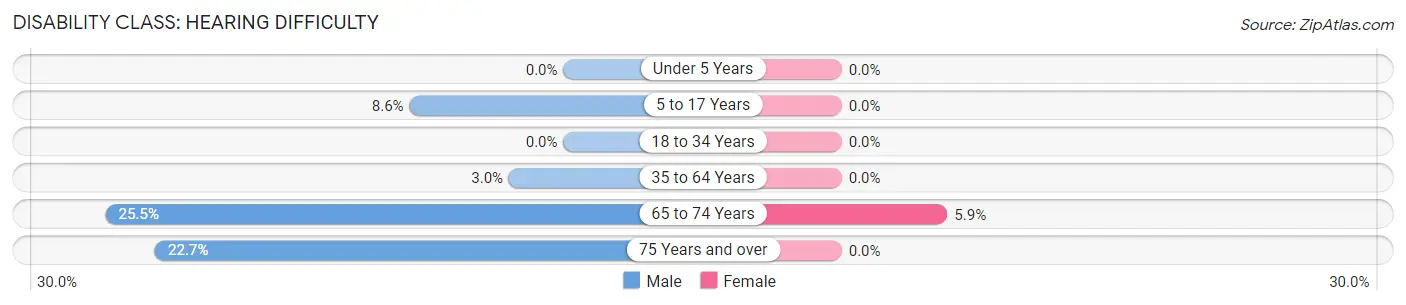
| Age Bracket | Male | Female |
| Under 5 Years | 0 (0.0%) | 0 (0.0%) |
| 5 to 17 Years | 3 (8.6%) | 0 (0.0%) |
| 18 to 34 Years | 0 (0.0%) | 0 (0.0%) |
| 35 to 64 Years | 5 (3.0%) | 0 (0.0%) |
| 65 to 74 Years | 13 (25.5%) | 2 (5.9%) |
| 75 Years and over | 5 (22.7%) | 0 (0.0%) |
Disability Class: Vision Difficulty
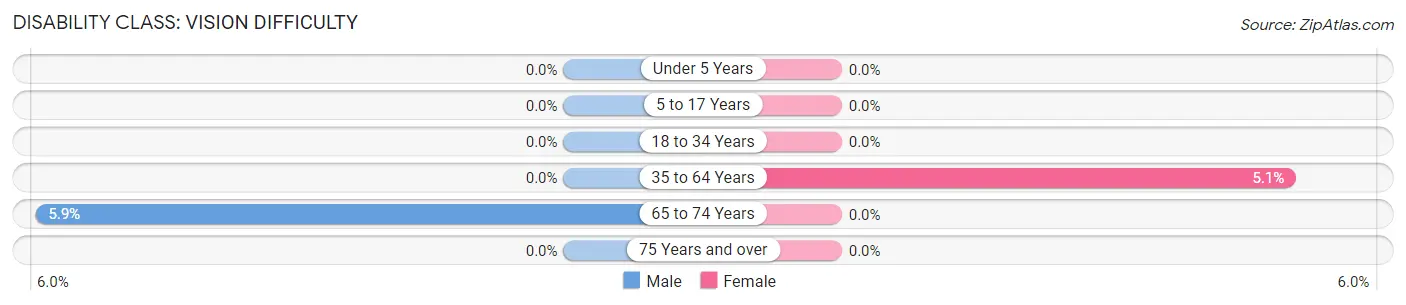
| Age Bracket | Male | Female |
| Under 5 Years | 0 (0.0%) | 0 (0.0%) |
| 5 to 17 Years | 0 (0.0%) | 0 (0.0%) |
| 18 to 34 Years | 0 (0.0%) | 0 (0.0%) |
| 35 to 64 Years | 0 (0.0%) | 9 (5.1%) |
| 65 to 74 Years | 3 (5.9%) | 0 (0.0%) |
| 75 Years and over | 0 (0.0%) | 0 (0.0%) |
Disability Class: Cognitive Difficulty
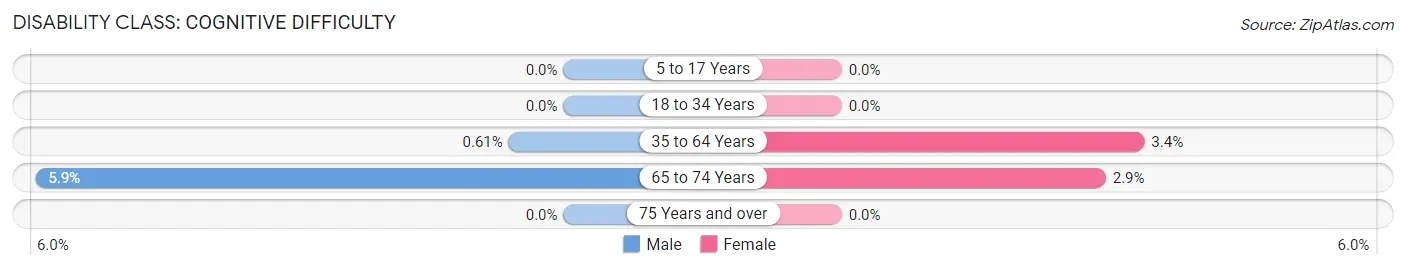
| Age Bracket | Male | Female |
| 5 to 17 Years | 0 (0.0%) | 0 (0.0%) |
| 18 to 34 Years | 0 (0.0%) | 0 (0.0%) |
| 35 to 64 Years | 1 (0.6%) | 6 (3.4%) |
| 65 to 74 Years | 3 (5.9%) | 1 (2.9%) |
| 75 Years and over | 0 (0.0%) | 0 (0.0%) |
Disability Class: Ambulatory Difficulty
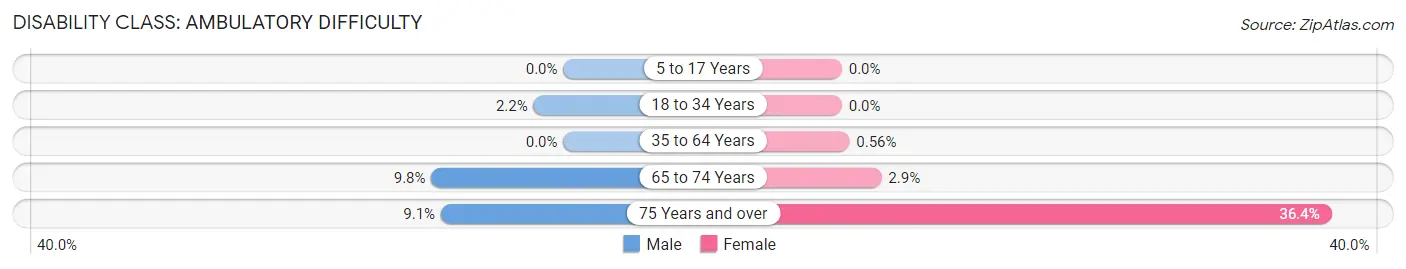
| Age Bracket | Male | Female |
| 5 to 17 Years | 0 (0.0%) | 0 (0.0%) |
| 18 to 34 Years | 4 (2.2%) | 0 (0.0%) |
| 35 to 64 Years | 0 (0.0%) | 1 (0.6%) |
| 65 to 74 Years | 5 (9.8%) | 1 (2.9%) |
| 75 Years and over | 2 (9.1%) | 8 (36.4%) |
Disability Class: Self-Care Difficulty
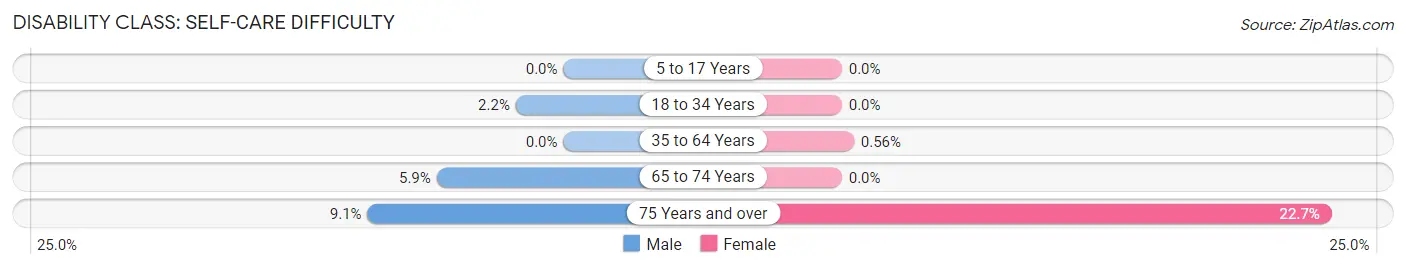
| Age Bracket | Male | Female |
| 5 to 17 Years | 0 (0.0%) | 0 (0.0%) |
| 18 to 34 Years | 4 (2.2%) | 0 (0.0%) |
| 35 to 64 Years | 0 (0.0%) | 1 (0.6%) |
| 65 to 74 Years | 3 (5.9%) | 0 (0.0%) |
| 75 Years and over | 2 (9.1%) | 5 (22.7%) |
Technology Access in Bayview
Computing Device Access in Bayview
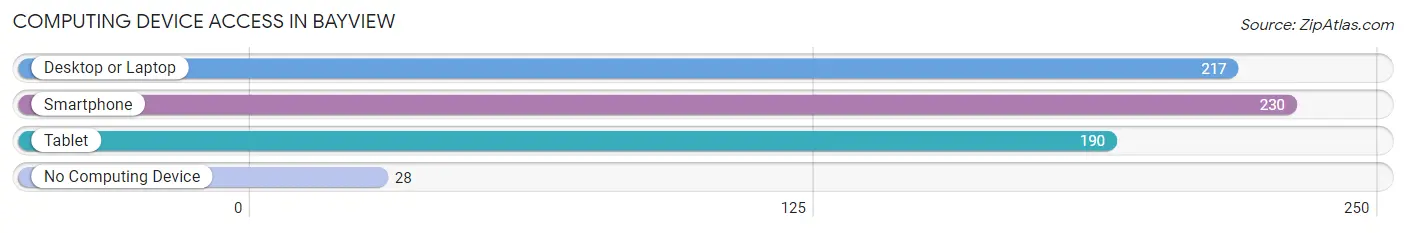
| Device Type | # Households | % Households |
| Desktop or Laptop | 217 | 81.9% |
| Smartphone | 230 | 86.8% |
| Tablet | 190 | 71.7% |
| No Computing Device | 28 | 10.6% |
| Total | 265 | 100.0% |
Internet Access in Bayview
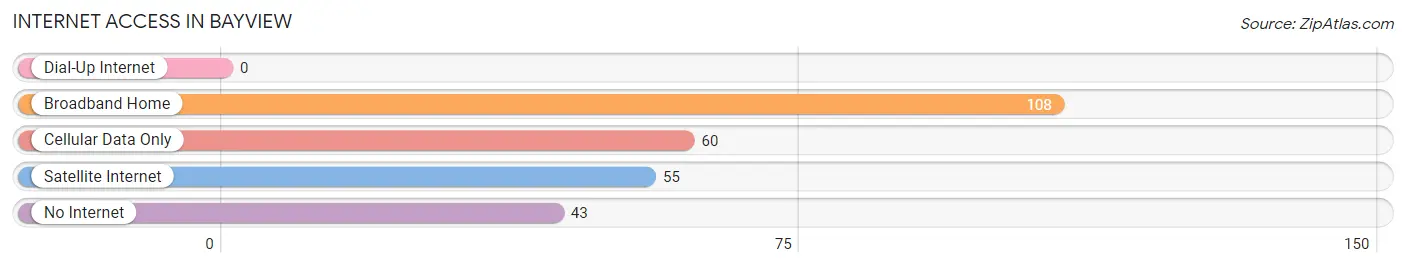
| Internet Type | # Households | % Households |
| Dial-Up Internet | 0 | 0.0% |
| Broadband Home | 108 | 40.7% |
| Cellular Data Only | 60 | 22.6% |
| Satellite Internet | 55 | 20.7% |
| No Internet | 43 | 16.2% |
| Total | 265 | 100.0% |
Bayview Summary
Bayview is a small town located in the southeastern corner of Texas, in the United States. It is situated in the county of Cameron, and is part of the Brownsville–Harlingen Metropolitan Statistical Area. The town has a population of approximately 1,000 people, and is known for its rural atmosphere and its proximity to the Gulf of Mexico.
History
The area that is now Bayview was originally inhabited by the Karankawa Indians, who were hunter-gatherers. The first European settlers arrived in the area in the late 1700s, and the town was officially founded in 1845. The town was originally called “Cameron’s Point”, after the county it was located in. In 1848, the name was changed to “Bayview”, due to its location on the bay.
In the late 1800s, Bayview was a thriving port town, with a population of over 1,000 people. The town was home to a number of businesses, including a hotel, a general store, and a post office. The town was also home to a number of fishing boats, which were used to catch shrimp, oysters, and other seafood.
In the early 1900s, Bayview began to decline in population, as many of its residents moved away to larger cities. By the 1950s, the population had dropped to just over 500 people. In the late 1970s, the town began to experience a resurgence, as new businesses and residents moved to the area.
Geography
Bayview is located in the southeastern corner of Texas, in the county of Cameron. The town is situated on the Gulf of Mexico, and is bordered by the cities of Port Isabel and South Padre Island. The town is located approximately 30 miles from the Mexican border.
The town is situated on a flat coastal plain, and is surrounded by wetlands and marshlands. The climate in Bayview is subtropical, with hot, humid summers and mild winters. The average temperature in the summer is around 90 degrees Fahrenheit, and the average temperature in the winter is around 60 degrees Fahrenheit.
Economy
The economy of Bayview is largely based on tourism and fishing. The town is home to a number of hotels, restaurants, and other businesses that cater to tourists. The town is also home to a number of fishing boats, which are used to catch shrimp, oysters, and other seafood.
In addition to tourism and fishing, Bayview is also home to a number of small businesses, including a general store, a post office, and a hardware store. The town is also home to a number of agricultural businesses, including a dairy farm and a vegetable farm.
Demographics
As of the 2010 census, the population of Bayview was 1,000 people. The racial makeup of the town was 94.2% White, 0.7% African American, 0.2% Native American, 0.2% Asian, 0.1% Pacific Islander, and 4.7% from other races. The median household income in Bayview was $30,000, and the median age was 37 years.
Conclusion
Bayview is a small town located in the southeastern corner of Texas, in the United States. It is situated in the county of Cameron, and is part of the Brownsville–Harlingen Metropolitan Statistical Area. The town has a population of approximately 1,000 people, and is known for its rural atmosphere and its proximity to the Gulf of Mexico. The economy of Bayview is largely based on tourism and fishing, and the town is home to a number of small businesses. The racial makeup of the town is predominantly White, with a small percentage of African American, Native American, Asian, and Pacific Islander residents.
Common Questions
What is Per Capita Income in Bayview?
Per Capita income in Bayview is $50,124.
What is the Median Family Income in Bayview?
Median Family Income in Bayview is $129,073.
What is the Median Household income in Bayview?
Median Household Income in Bayview is $128,911.
What is Inequality or Gini Index in Bayview?
Inequality or Gini Index in Bayview is 0.32.
What is the Total Population of Bayview?
Total Population of Bayview is 784.
What is the Total Male Population of Bayview?
Total Male Population of Bayview is 474.
What is the Total Female Population of Bayview?
Total Female Population of Bayview is 310.
What is the Ratio of Males per 100 Females in Bayview?
There are 152.90 Males per 100 Females in Bayview.
What is the Ratio of Females per 100 Males in Bayview?
There are 65.40 Females per 100 Males in Bayview.
What is the Median Population Age in Bayview?
Median Population Age in Bayview is 47.5 Years.
What is the Average Family Size in Bayview
Average Family Size in Bayview is 3.0 People.
What is the Average Household Size in Bayview
Average Household Size in Bayview is 3.0 People.
How Large is the Labor Force in Bayview?
There are 530 People in the Labor Forcein in Bayview.
What is the Percentage of People in the Labor Force in Bayview?
74.1% of People are in the Labor Force in Bayview.
What is the Unemployment Rate in Bayview?
Unemployment Rate in Bayview is 14.0%.