Union County, OH Map & Demographics
Union County Map
Union County Overview
$48,025
PER CAPITA INCOME
$120,130
AVG FAMILY INCOME
$104,496
AVG HOUSEHOLD INCOME
35.0%
WAGE / INCOME GAP [ % ]
65.0¢/ $1
WAGE / INCOME GAP [ $ ]
$9,378
FAMILY INCOME DEFICIT
0.41
INEQUALITY / GINI INDEX
63,411
TOTAL POPULATION
30,672
MALE POPULATION
32,739
FEMALE POPULATION
93.69
MALES / 100 FEMALES
106.74
FEMALES / 100 MALES
38.4
MEDIAN AGE
3.1
AVG FAMILY SIZE
2.7
AVG HOUSEHOLD SIZE
33,774
LABOR FORCE [ PEOPLE ]
67.8%
PERCENT IN LABOR FORCE
2.9%
UNEMPLOYMENT RATE
Income in Union County
Income Overview in Union County
Per Capita Income in Union County is $48,025, while median incomes of families and households are $120,130 and $104,496 respectively.
| Characteristic | Number | Measure |
| Per Capita Income | 63,411 | $48,025 |
| Median Family Income | 16,985 | $120,130 |
| Mean Family Income | 16,985 | $148,707 |
| Median Household Income | 22,644 | $104,496 |
| Mean Household Income | 22,644 | $129,983 |
| Income Deficit | 16,985 | $9,378 |
| Wage / Income Gap (%) | 63,411 | 35.01% |
| Wage / Income Gap ($) | 63,411 | 64.99¢ per $1 |
| Gini / Inequality Index | 63,411 | 0.41 |
Earnings by Sex in Union County
Average Earnings in Union County are $53,067, $64,306 for men and $41,794 for women, a difference of 35.0%.
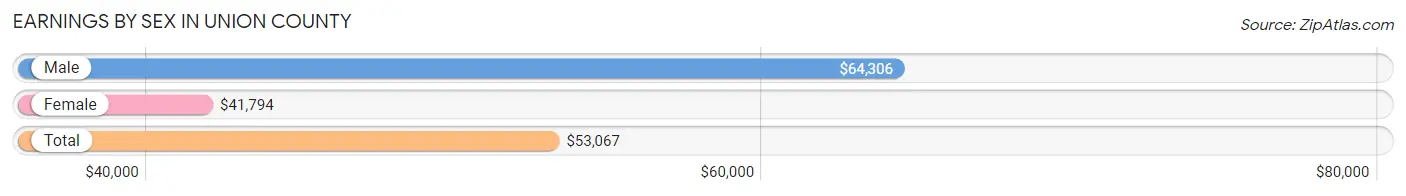
| Sex | Number | Average Earnings |
| Male | 19,003 (53.1%) | $64,306 |
| Female | 16,799 (46.9%) | $41,794 |
| Total | 35,802 (100.0%) | $53,067 |
Earnings by Sex by Income Bracket in Union County
The most common earnings brackets in Union County are $100,000+ for men (5,239 | 27.6%) and $100,000+ for women (2,053 | 12.2%).
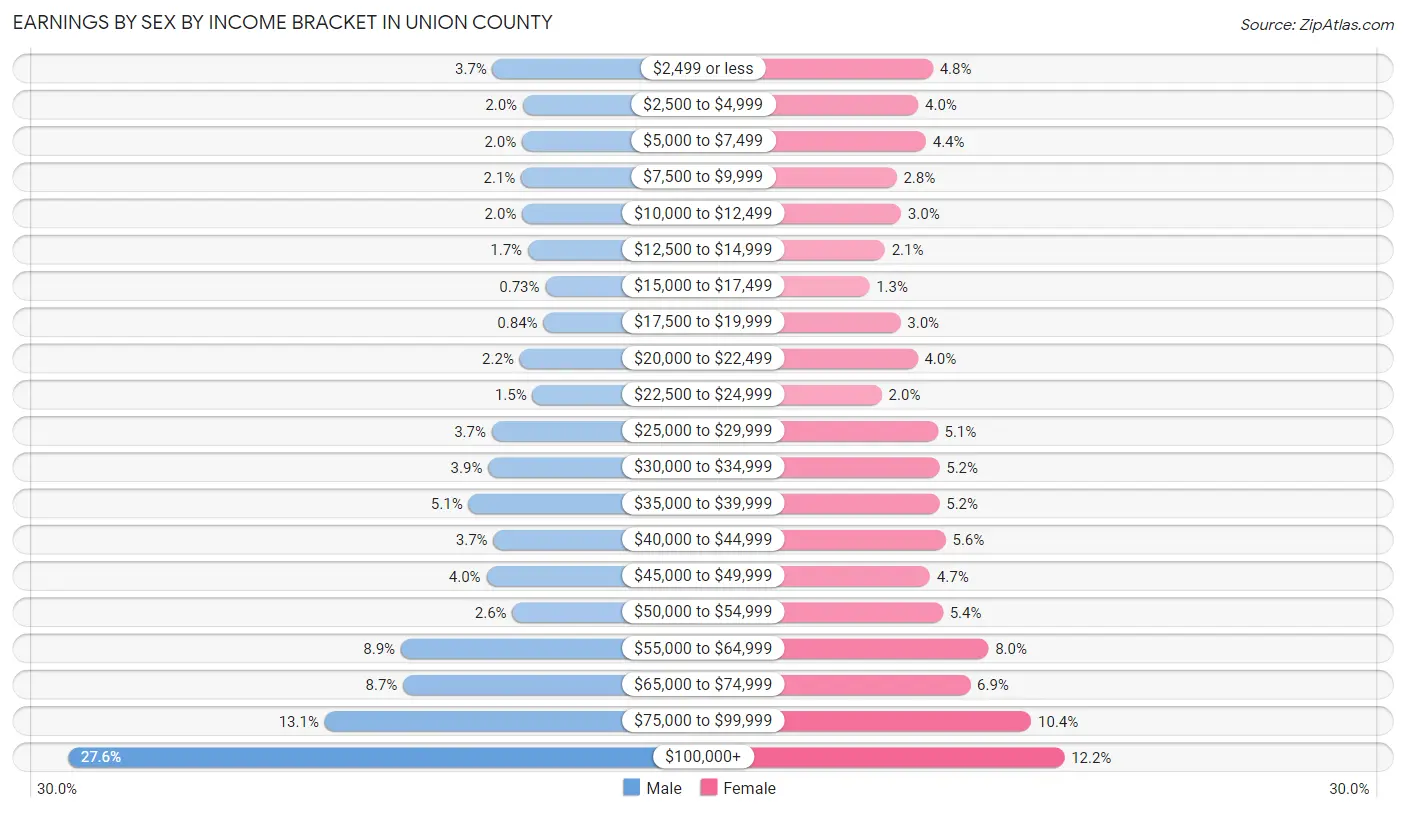
| Income | Male | Female |
| $2,499 or less | 702 (3.7%) | 811 (4.8%) |
| $2,500 to $4,999 | 379 (2.0%) | 673 (4.0%) |
| $5,000 to $7,499 | 387 (2.0%) | 746 (4.4%) |
| $7,500 to $9,999 | 397 (2.1%) | 468 (2.8%) |
| $10,000 to $12,499 | 385 (2.0%) | 510 (3.0%) |
| $12,500 to $14,999 | 325 (1.7%) | 358 (2.1%) |
| $15,000 to $17,499 | 138 (0.7%) | 211 (1.3%) |
| $17,500 to $19,999 | 160 (0.8%) | 505 (3.0%) |
| $20,000 to $22,499 | 412 (2.2%) | 667 (4.0%) |
| $22,500 to $24,999 | 275 (1.5%) | 329 (2.0%) |
| $25,000 to $29,999 | 711 (3.7%) | 856 (5.1%) |
| $30,000 to $34,999 | 748 (3.9%) | 874 (5.2%) |
| $35,000 to $39,999 | 960 (5.1%) | 874 (5.2%) |
| $40,000 to $44,999 | 693 (3.6%) | 933 (5.6%) |
| $45,000 to $49,999 | 768 (4.0%) | 785 (4.7%) |
| $50,000 to $54,999 | 491 (2.6%) | 905 (5.4%) |
| $55,000 to $64,999 | 1,681 (8.8%) | 1,335 (8.0%) |
| $65,000 to $74,999 | 1,657 (8.7%) | 1,165 (6.9%) |
| $75,000 to $99,999 | 2,495 (13.1%) | 1,741 (10.4%) |
| $100,000+ | 5,239 (27.6%) | 2,053 (12.2%) |
| Total | 19,003 (100.0%) | 16,799 (100.0%) |
Earnings by Sex by Educational Attainment in Union County
Average earnings in Union County are $71,320 for men and $48,315 for women, a difference of 32.3%. Men with an educational attainment of graduate degree enjoy the highest average annual earnings of $134,557, while those with less than high school education earn the least with $30,481. Women with an educational attainment of graduate degree earn the most with the average annual earnings of $78,058, while those with less than high school education have the smallest earnings of $11,447.
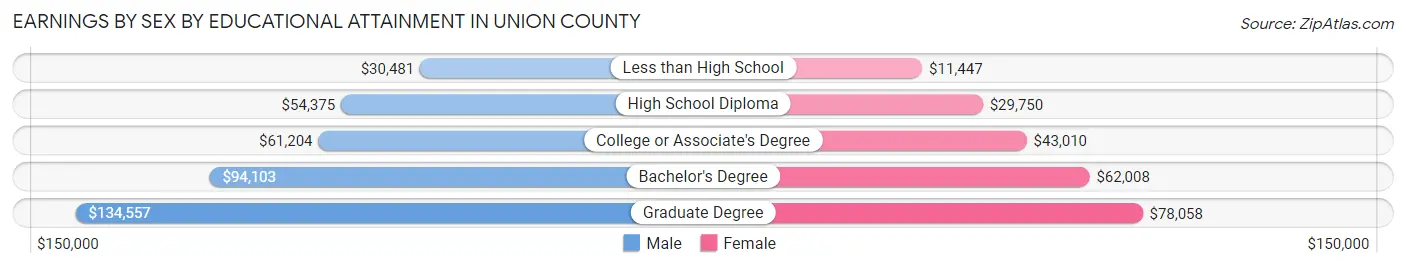
| Educational Attainment | Male Income | Female Income |
| Less than High School | $30,481 | $11,447 |
| High School Diploma | $54,375 | $29,750 |
| College or Associate's Degree | $61,204 | $43,010 |
| Bachelor's Degree | $94,103 | $62,008 |
| Graduate Degree | $134,557 | $78,058 |
| Total | $71,320 | $48,315 |
Family Income in Union County
Family Income Brackets in Union County
According to the Union County family income data, there are 4,552 families falling into the $100,000 to $149,999 income range, which is the most common income bracket and makes up 26.8% of all families. Conversely, the $10,000 to $14,999 income bracket is the least frequent group with only 68 families (0.4%) belonging to this category.
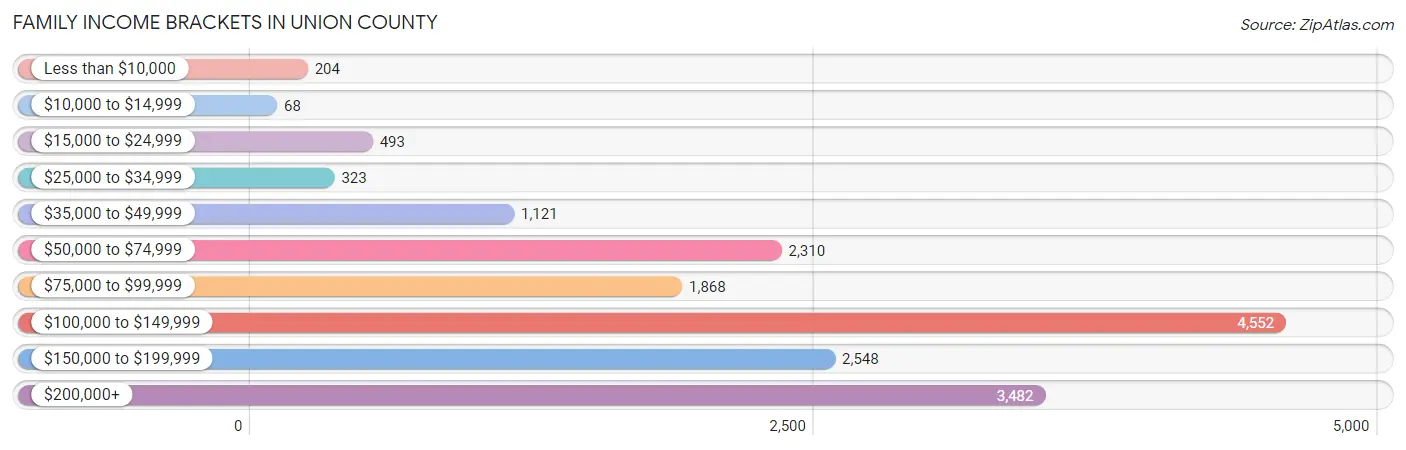
| Income Bracket | # Families | % Families |
| Less than $10,000 | 204 | 1.2% |
| $10,000 to $14,999 | 68 | 0.4% |
| $15,000 to $24,999 | 493 | 2.9% |
| $25,000 to $34,999 | 323 | 1.9% |
| $35,000 to $49,999 | 1,121 | 6.6% |
| $50,000 to $74,999 | 2,310 | 13.6% |
| $75,000 to $99,999 | 1,868 | 11.0% |
| $100,000 to $149,999 | 4,552 | 26.8% |
| $150,000 to $199,999 | 2,548 | 15.0% |
| $200,000+ | 3,482 | 20.5% |
Family Income by Famaliy Size in Union County
6-person families (734 | 4.3%) account for the highest median family income in Union County with $155,769 per family, while 2-person families (7,530 | 44.3%) have the highest median income of $48,038 per family member.
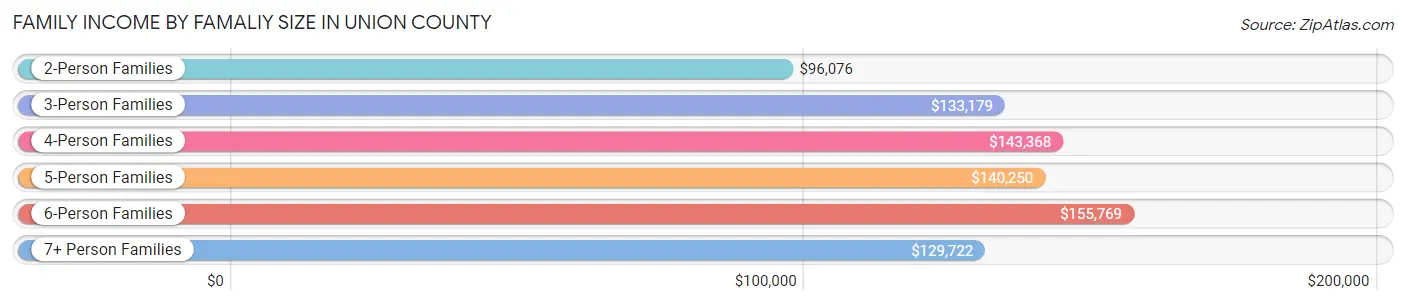
| Income Bracket | # Families | Median Income |
| 2-Person Families | 7,530 (44.3%) | $96,076 |
| 3-Person Families | 3,438 (20.2%) | $133,179 |
| 4-Person Families | 3,768 (22.2%) | $143,368 |
| 5-Person Families | 1,407 (8.3%) | $140,250 |
| 6-Person Families | 734 (4.3%) | $155,769 |
| 7+ Person Families | 108 (0.6%) | $129,722 |
| Total | 16,985 (100.0%) | $120,130 |
Family Income by Number of Earners in Union County
The median family income in Union County is $120,130, with families comprising 3+ earners (2,295) having the highest median family income of $166,331, while families with no earners (1,734) have the lowest median family income of $52,163, accounting for 13.5% and 10.2% of families, respectively.
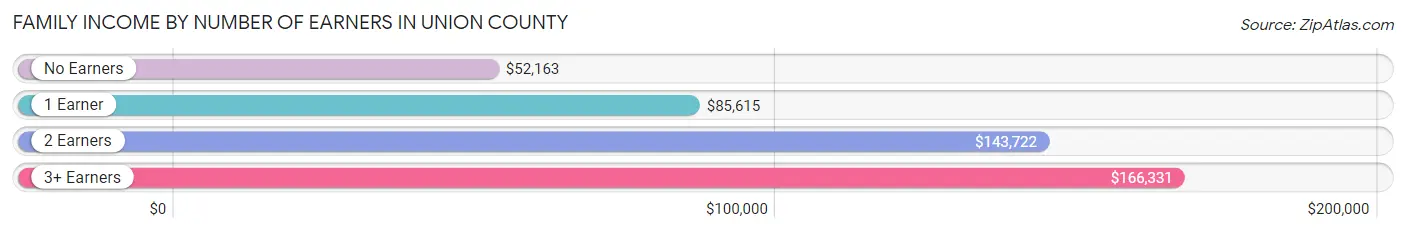
| Number of Earners | # Families | Median Income |
| No Earners | 1,734 (10.2%) | $52,163 |
| 1 Earner | 4,844 (28.5%) | $85,615 |
| 2 Earners | 8,112 (47.8%) | $143,722 |
| 3+ Earners | 2,295 (13.5%) | $166,331 |
| Total | 16,985 (100.0%) | $120,130 |
Household Income in Union County
Household Income Brackets in Union County
With 5,525 households falling in the category, the $100,000 to $149,999 income range is the most frequent in Union County, accounting for 24.4% of all households. In contrast, only 226 households (1.0%) fall into the $10,000 to $14,999 income bracket, making it the least populous group.
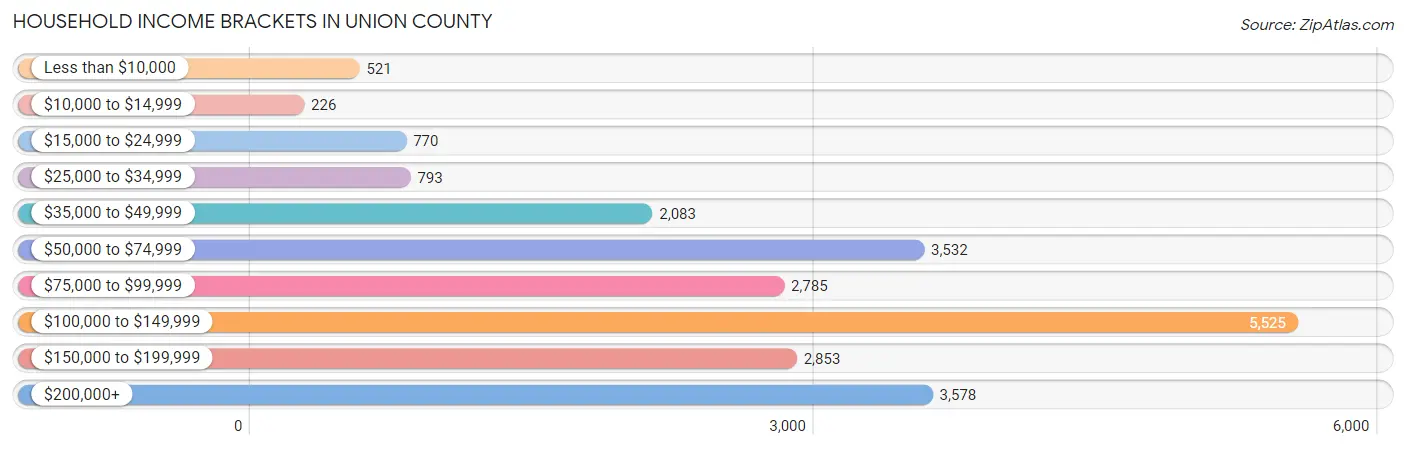
| Income Bracket | # Households | % Households |
| Less than $10,000 | 521 | 2.3% |
| $10,000 to $14,999 | 226 | 1.0% |
| $15,000 to $24,999 | 770 | 3.4% |
| $25,000 to $34,999 | 793 | 3.5% |
| $35,000 to $49,999 | 2,083 | 9.2% |
| $50,000 to $74,999 | 3,532 | 15.6% |
| $75,000 to $99,999 | 2,785 | 12.3% |
| $100,000 to $149,999 | 5,525 | 24.4% |
| $150,000 to $199,999 | 2,853 | 12.6% |
| $200,000+ | 3,578 | 15.8% |
Household Income by Householder Age in Union County
The median household income in Union County is $104,496, with the highest median household income of $119,189 found in the 25 to 44 years age bracket for the primary householder. A total of 7,857 households (34.7%) fall into this category. Meanwhile, the 65+ years age bracket for the primary householder has the lowest median household income of $64,917, with 4,512 households (19.9%) in this group.
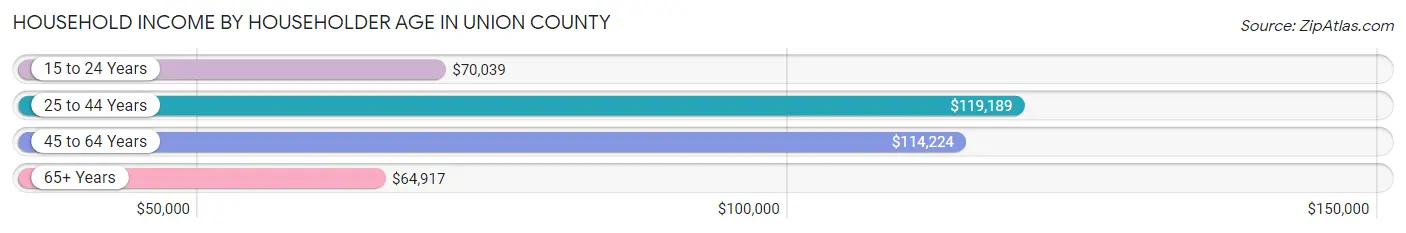
| Income Bracket | # Households | Median Income |
| 15 to 24 Years | 798 (3.5%) | $70,039 |
| 25 to 44 Years | 7,857 (34.7%) | $119,189 |
| 45 to 64 Years | 9,477 (41.8%) | $114,224 |
| 65+ Years | 4,512 (19.9%) | $64,917 |
| Total | 22,644 (100.0%) | $104,496 |
Poverty in Union County
Income Below Poverty by Sex and Age in Union County
With 4.3% poverty level for males and 6.1% for females among the residents of Union County, 15 year old males and 18 to 24 year old females are the most vulnerable to poverty, with 64 males (14.8%) and 431 females (18.4%) in their respective age groups living below the poverty level.
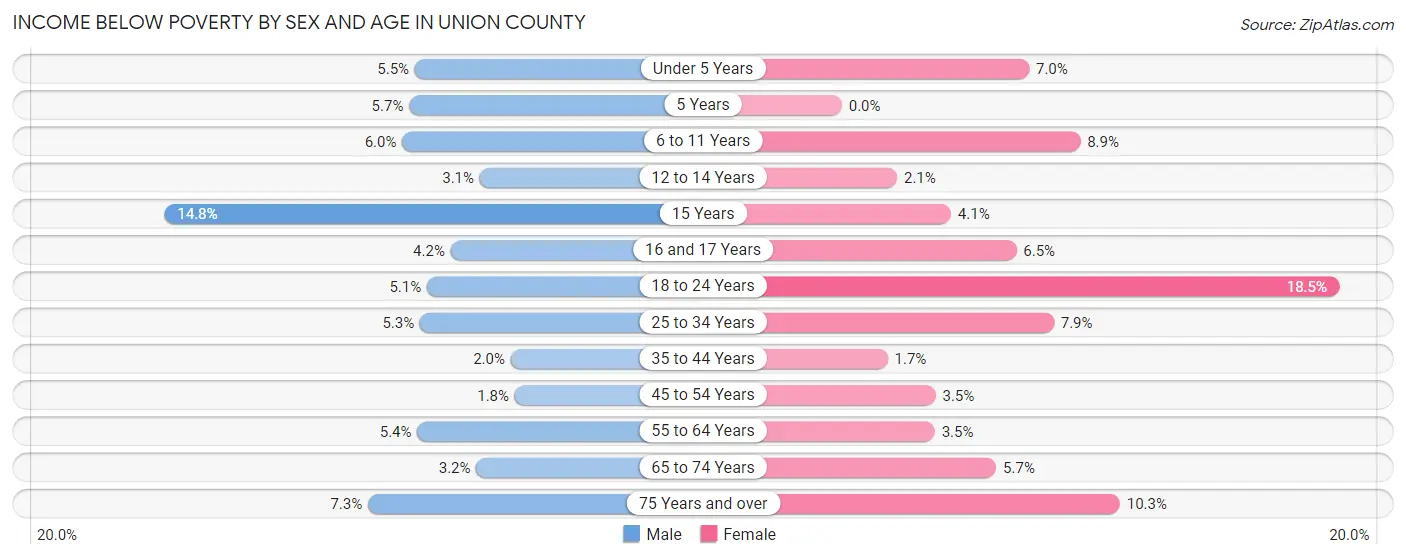
| Age Bracket | Male | Female |
| Under 5 Years | 104 (5.5%) | 135 (7.0%) |
| 5 Years | 17 (5.7%) | 0 (0.0%) |
| 6 to 11 Years | 153 (6.0%) | 211 (8.8%) |
| 12 to 14 Years | 46 (3.1%) | 30 (2.1%) |
| 15 Years | 64 (14.8%) | 25 (4.1%) |
| 16 and 17 Years | 44 (4.2%) | 44 (6.5%) |
| 18 to 24 Years | 124 (5.1%) | 431 (18.4%) |
| 25 to 34 Years | 195 (5.3%) | 290 (7.9%) |
| 35 to 44 Years | 90 (1.9%) | 76 (1.7%) |
| 45 to 54 Years | 80 (1.8%) | 139 (3.5%) |
| 55 to 64 Years | 213 (5.4%) | 135 (3.5%) |
| 65 to 74 Years | 79 (3.2%) | 146 (5.7%) |
| 75 Years and over | 93 (7.2%) | 167 (10.3%) |
| Total | 1,302 (4.3%) | 1,829 (6.1%) |
Income Above Poverty by Sex and Age in Union County
According to the poverty statistics in Union County, males aged 45 to 54 years and females aged 5 years are the age groups that are most secure financially, with 98.2% of males and 100.0% of females in these age groups living above the poverty line.
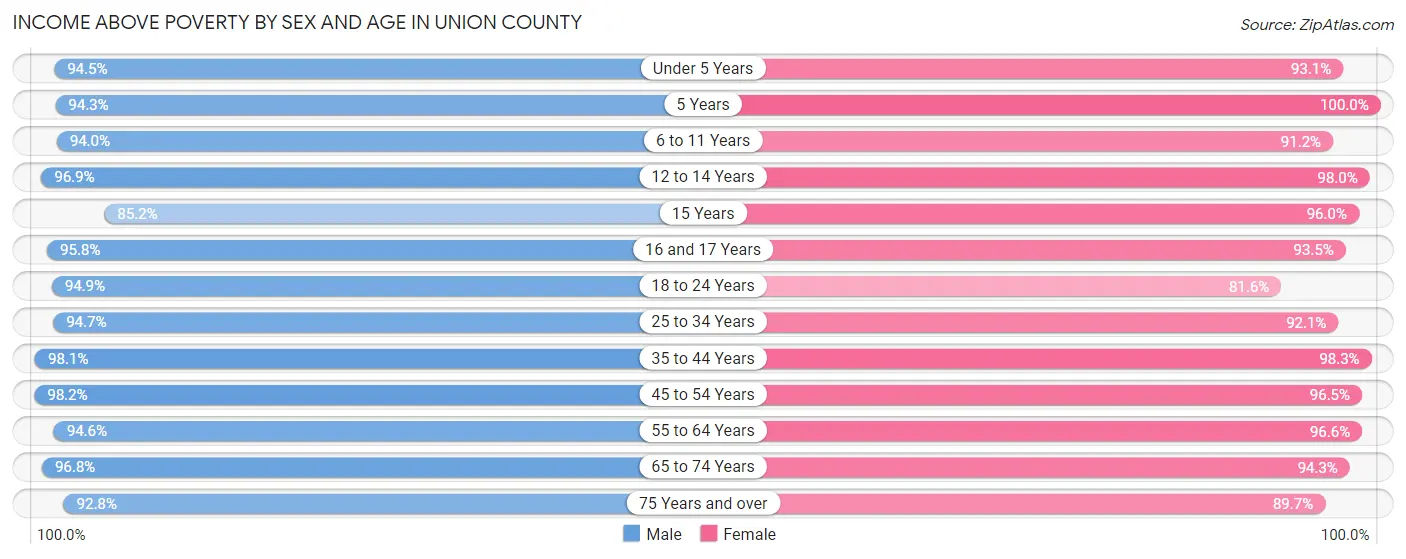
| Age Bracket | Male | Female |
| Under 5 Years | 1,782 (94.5%) | 1,807 (93.0%) |
| 5 Years | 280 (94.3%) | 339 (100.0%) |
| 6 to 11 Years | 2,405 (94.0%) | 2,172 (91.1%) |
| 12 to 14 Years | 1,436 (96.9%) | 1,430 (98.0%) |
| 15 Years | 368 (85.2%) | 592 (96.0%) |
| 16 and 17 Years | 1,008 (95.8%) | 635 (93.5%) |
| 18 to 24 Years | 2,327 (94.9%) | 1,905 (81.6%) |
| 25 to 34 Years | 3,473 (94.7%) | 3,397 (92.1%) |
| 35 to 44 Years | 4,534 (98.1%) | 4,385 (98.3%) |
| 45 to 54 Years | 4,372 (98.2%) | 3,859 (96.5%) |
| 55 to 64 Years | 3,715 (94.6%) | 3,777 (96.6%) |
| 65 to 74 Years | 2,369 (96.8%) | 2,403 (94.3%) |
| 75 Years and over | 1,190 (92.7%) | 1,452 (89.7%) |
| Total | 29,259 (95.7%) | 28,153 (93.9%) |
Income Below Poverty Among Married-Couple Families in Union County
The poverty statistics for married-couple families in Union County show that 1.8% or 255 of the total 13,892 families live below the poverty line. Families with 5 or more children have the highest poverty rate of 18.5%, comprising of 5 families. On the other hand, families with 1 or 2 children have the lowest poverty rate of 0.9%, which includes 49 families.
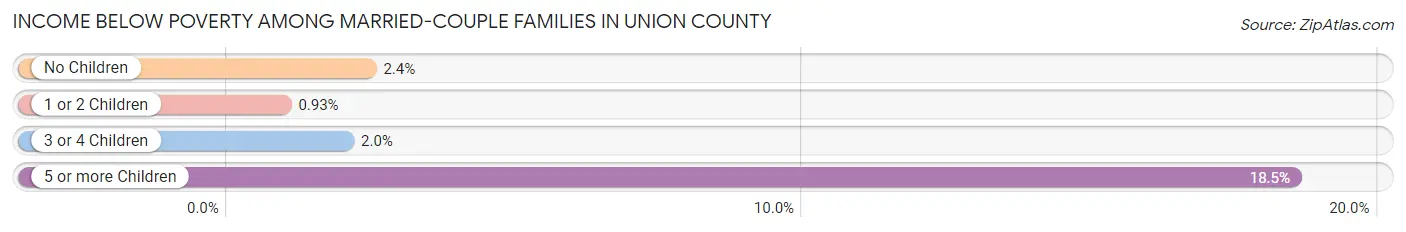
| Children | Above Poverty | Below Poverty |
| No Children | 6,890 (97.6%) | 170 (2.4%) |
| 1 or 2 Children | 5,225 (99.1%) | 49 (0.9%) |
| 3 or 4 Children | 1,500 (98.0%) | 31 (2.0%) |
| 5 or more Children | 22 (81.5%) | 5 (18.5%) |
| Total | 13,637 (98.2%) | 255 (1.8%) |
Income Below Poverty Among Single-Parent Households in Union County
According to the poverty data in Union County, 9.9% or 131 single-father households and 12.4% or 220 single-mother households are living below the poverty line. Among single-father households, those with 3 or 4 children have the highest poverty rate, with 105 households (78.9%) experiencing poverty. Likewise, among single-mother households, those with 3 or 4 children have the highest poverty rate, with 25 households (27.8%) falling below the poverty line.
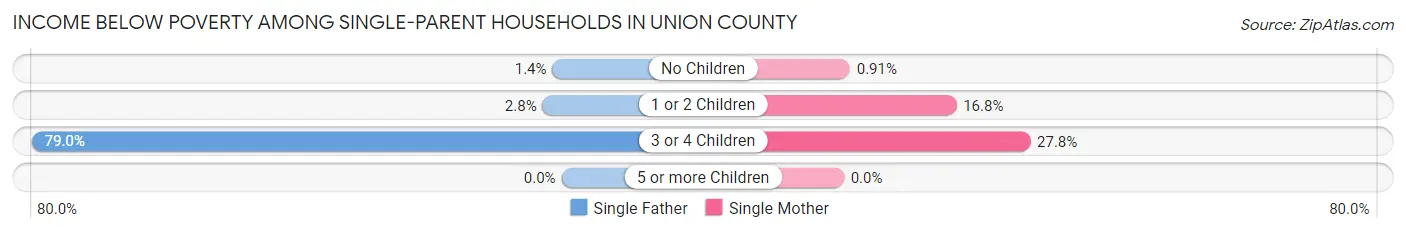
| Children | Single Father | Single Mother |
| No Children | 7 (1.4%) | 5 (0.9%) |
| 1 or 2 Children | 19 (2.8%) | 190 (16.8%) |
| 3 or 4 Children | 105 (78.9%) | 25 (27.8%) |
| 5 or more Children | 0 (0.0%) | 0 (0.0%) |
| Total | 131 (9.9%) | 220 (12.4%) |
Income Below Poverty Among Married-Couple vs Single-Parent Households in Union County
The poverty data for Union County shows that 255 of the married-couple family households (1.8%) and 351 of the single-parent households (11.4%) are living below the poverty level. Within the married-couple family households, those with 5 or more children have the highest poverty rate, with 5 households (18.5%) falling below the poverty line. Among the single-parent households, those with 3 or 4 children have the highest poverty rate, with 130 household (58.3%) living below poverty.
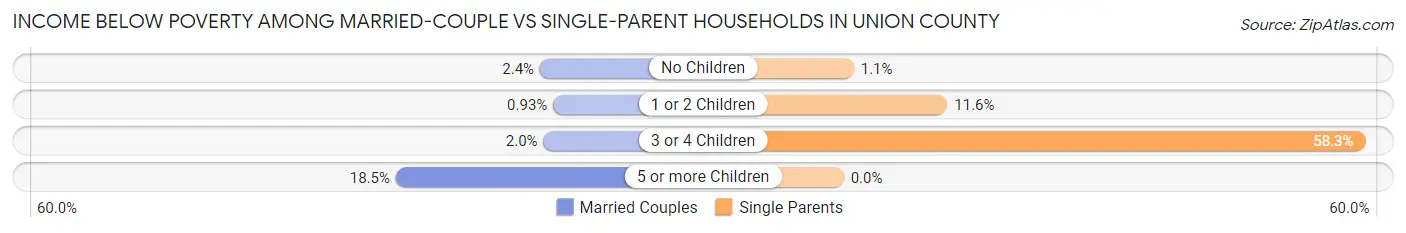
| Children | Married-Couple Families | Single-Parent Households |
| No Children | 170 (2.4%) | 12 (1.1%) |
| 1 or 2 Children | 49 (0.9%) | 209 (11.6%) |
| 3 or 4 Children | 31 (2.0%) | 130 (58.3%) |
| 5 or more Children | 5 (18.5%) | 0 (0.0%) |
| Total | 255 (1.8%) | 351 (11.4%) |
Race in Union County
The most populous races in Union County are White / Caucasian (55,745 | 87.9%), Asian (2,975 | 4.7%), and Two or more Races (2,560 | 4.0%).
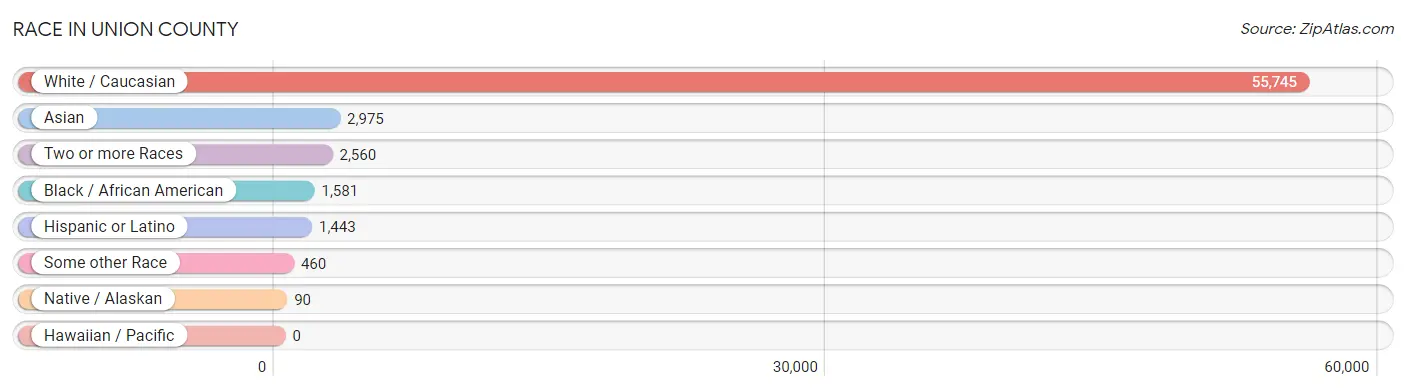
| Race | # Population | % Population |
| Asian | 2,975 | 4.7% |
| Black / African American | 1,581 | 2.5% |
| Hawaiian / Pacific | 0 | 0.0% |
| Hispanic or Latino | 1,443 | 2.3% |
| Native / Alaskan | 90 | 0.1% |
| White / Caucasian | 55,745 | 87.9% |
| Two or more Races | 2,560 | 4.0% |
| Some other Race | 460 | 0.7% |
| Total | 63,411 | 100.0% |
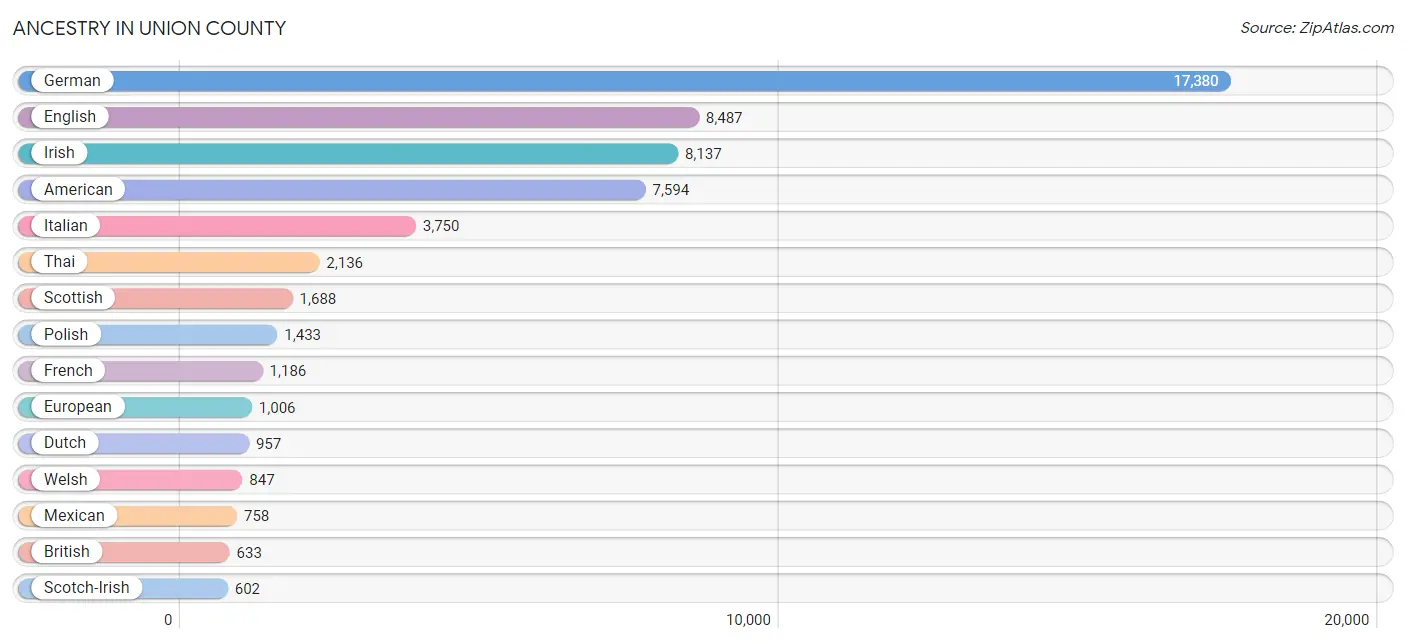
Ancestry in Union County
The most populous ancestries reported in Union County are German (17,380 | 27.4%), English (8,487 | 13.4%), Irish (8,137 | 12.8%), American (7,594 | 12.0%), and Italian (3,750 | 5.9%), together accounting for 71.5% of all Union County residents.
| Ancestry | # Population | % Population |
| African | 79 | 0.1% |
| American | 7,594 | 12.0% |
| Apache | 18 | 0.0% |
| Arab | 459 | 0.7% |
| Armenian | 178 | 0.3% |
| Austrian | 28 | 0.0% |
| Basque | 12 | 0.0% |
| Belgian | 69 | 0.1% |
| Bhutanese | 348 | 0.5% |
| Blackfeet | 51 | 0.1% |
| British | 633 | 1.0% |
| Burmese | 122 | 0.2% |
| Canadian | 164 | 0.3% |
| Central American | 57 | 0.1% |
| Cherokee | 471 | 0.7% |
| Chickasaw | 6 | 0.0% |
| Chilean | 35 | 0.1% |
| Chippewa | 3 | 0.0% |
| Colombian | 9 | 0.0% |
| Croatian | 22 | 0.0% |
| Cuban | 21 | 0.0% |
| Czech | 159 | 0.3% |
| Czechoslovakian | 220 | 0.4% |
| Danish | 136 | 0.2% |
| Dominican | 54 | 0.1% |
| Dutch | 957 | 1.5% |
| Eastern European | 184 | 0.3% |
| English | 8,487 | 13.4% |
| Ethiopian | 26 | 0.0% |
| European | 1,006 | 1.6% |
| Filipino | 34 | 0.1% |
| Finnish | 75 | 0.1% |
| French | 1,186 | 1.9% |
| French Canadian | 6 | 0.0% |
| German | 17,380 | 27.4% |
| German Russian | 59 | 0.1% |
| Greek | 455 | 0.7% |
| Guatemalan | 21 | 0.0% |
| Haitian | 8 | 0.0% |
| Honduran | 6 | 0.0% |
| Hungarian | 567 | 0.9% |
| Icelander | 6 | 0.0% |
| Indian (Asian) | 390 | 0.6% |
| Iraqi | 251 | 0.4% |
| Irish | 8,137 | 12.8% |
| Italian | 3,750 | 5.9% |
| Jamaican | 10 | 0.0% |
| Kiowa | 25 | 0.0% |
| Korean | 97 | 0.2% |
| Lebanese | 28 | 0.0% |
| Lithuanian | 23 | 0.0% |
| Macedonian | 61 | 0.1% |
| Malaysian | 56 | 0.1% |
| Mexican | 758 | 1.2% |
| Mongolian | 8 | 0.0% |
| Navajo | 9 | 0.0% |
| New Zealander | 1 | 0.0% |
| Nigerian | 64 | 0.1% |
| Northern European | 251 | 0.4% |
| Norwegian | 321 | 0.5% |
| Pakistani | 8 | 0.0% |
| Pennsylvania German | 6 | 0.0% |
| Peruvian | 37 | 0.1% |
| Polish | 1,433 | 2.3% |
| Portuguese | 178 | 0.3% |
| Puerto Rican | 370 | 0.6% |
| Romanian | 110 | 0.2% |
| Russian | 336 | 0.5% |
| Salvadoran | 30 | 0.1% |
| Scandinavian | 129 | 0.2% |
| Scotch-Irish | 602 | 0.9% |
| Scottish | 1,688 | 2.7% |
| Seminole | 5 | 0.0% |
| Serbian | 13 | 0.0% |
| Sioux | 9 | 0.0% |
| Slavic | 13 | 0.0% |
| Slovak | 166 | 0.3% |
| Slovene | 113 | 0.2% |
| Somali | 6 | 0.0% |
| South American | 81 | 0.1% |
| Spanish | 60 | 0.1% |
| Sri Lankan | 18 | 0.0% |
| Subsaharan African | 189 | 0.3% |
| Swedish | 525 | 0.8% |
| Swiss | 380 | 0.6% |
| Syrian | 167 | 0.3% |
| Thai | 2,136 | 3.4% |
| Ugandan | 14 | 0.0% |
| Ukrainian | 66 | 0.1% |
| Vietnamese | 34 | 0.1% |
| Welsh | 847 | 1.3% |
| West Indian | 10 | 0.0% |
| Yugoslavian | 14 | 0.0% | View All 93 Rows |
Immigrants in Union County
The most numerous immigrant groups reported in Union County came from Asia (2,400 | 3.8%), South Central Asia (1,523 | 2.4%), India (1,372 | 2.2%), Eastern Asia (489 | 0.8%), and Latin America (347 | 0.5%), together accounting for 9.7% of all Union County residents.
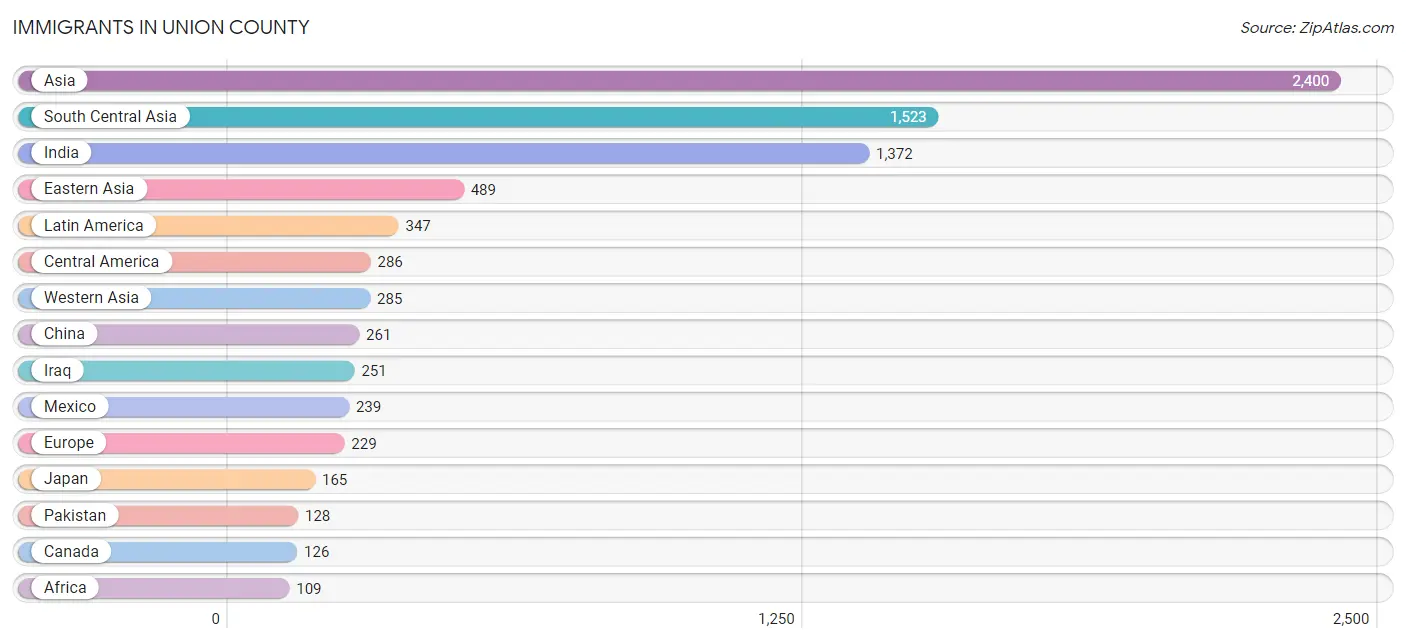
| Immigration Origin | # Population | % Population |
| Africa | 109 | 0.2% |
| Asia | 2,400 | 3.8% |
| Bahamas | 19 | 0.0% |
| Bangladesh | 10 | 0.0% |
| Brazil | 8 | 0.0% |
| Canada | 126 | 0.2% |
| Caribbean | 27 | 0.0% |
| Central America | 286 | 0.4% |
| Chile | 23 | 0.0% |
| China | 261 | 0.4% |
| Colombia | 3 | 0.0% |
| Eastern Africa | 20 | 0.0% |
| Eastern Asia | 489 | 0.8% |
| Eastern Europe | 55 | 0.1% |
| El Salvador | 30 | 0.1% |
| England | 15 | 0.0% |
| Europe | 229 | 0.4% |
| Fiji | 50 | 0.1% |
| France | 12 | 0.0% |
| Germany | 17 | 0.0% |
| Ghana | 14 | 0.0% |
| Honduras | 17 | 0.0% |
| India | 1,372 | 2.2% |
| Iraq | 251 | 0.4% |
| Jamaica | 8 | 0.0% |
| Japan | 165 | 0.3% |
| Korea | 63 | 0.1% |
| Laos | 36 | 0.1% |
| Latin America | 347 | 0.5% |
| Latvia | 7 | 0.0% |
| Malaysia | 17 | 0.0% |
| Mexico | 239 | 0.4% |
| Morocco | 6 | 0.0% |
| Netherlands | 12 | 0.0% |
| Nigeria | 52 | 0.1% |
| Northern Africa | 23 | 0.0% |
| Northern Europe | 56 | 0.1% |
| Oceania | 50 | 0.1% |
| Pakistan | 128 | 0.2% |
| Philippines | 50 | 0.1% |
| Portugal | 51 | 0.1% |
| Russia | 48 | 0.1% |
| Scotland | 8 | 0.0% |
| Somalia | 6 | 0.0% |
| South America | 34 | 0.1% |
| South Central Asia | 1,523 | 2.4% |
| South Eastern Asia | 103 | 0.2% |
| Southern Europe | 51 | 0.1% |
| Sweden | 32 | 0.1% |
| Switzerland | 26 | 0.0% |
| Syria | 34 | 0.1% |
| Taiwan | 20 | 0.0% |
| Uganda | 14 | 0.0% |
| Western Africa | 66 | 0.1% |
| Western Asia | 285 | 0.4% |
| Western Europe | 67 | 0.1% | View All 56 Rows |
Sex and Age in Union County
Sex and Age in Union County
The most populous age groups in Union County are 40 to 44 Years (2,480 | 8.1%) for men and 40 to 44 Years (2,615 | 8.0%) for women.
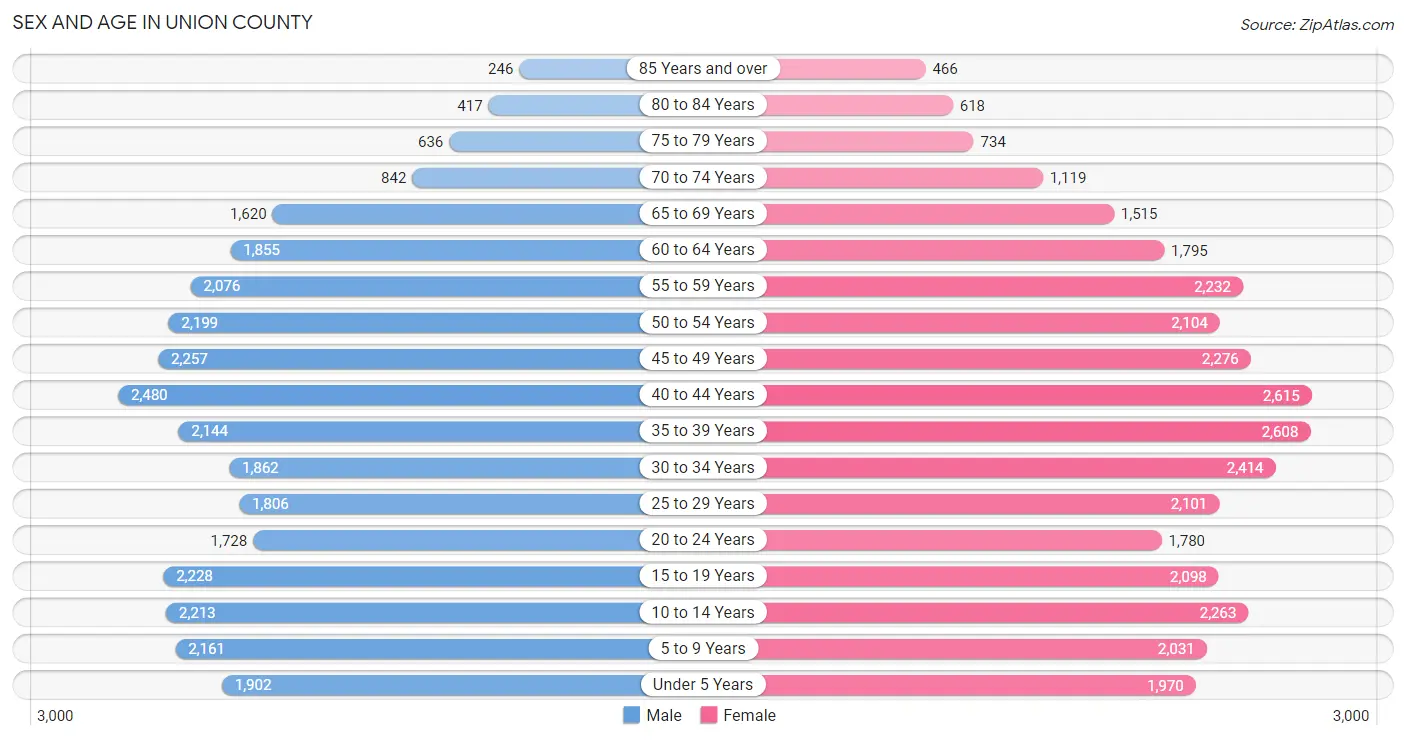
| Age Bracket | Male | Female |
| Under 5 Years | 1,902 (6.2%) | 1,970 (6.0%) |
| 5 to 9 Years | 2,161 (7.0%) | 2,031 (6.2%) |
| 10 to 14 Years | 2,213 (7.2%) | 2,263 (6.9%) |
| 15 to 19 Years | 2,228 (7.3%) | 2,098 (6.4%) |
| 20 to 24 Years | 1,728 (5.6%) | 1,780 (5.4%) |
| 25 to 29 Years | 1,806 (5.9%) | 2,101 (6.4%) |
| 30 to 34 Years | 1,862 (6.1%) | 2,414 (7.4%) |
| 35 to 39 Years | 2,144 (7.0%) | 2,608 (8.0%) |
| 40 to 44 Years | 2,480 (8.1%) | 2,615 (8.0%) |
| 45 to 49 Years | 2,257 (7.4%) | 2,276 (7.0%) |
| 50 to 54 Years | 2,199 (7.2%) | 2,104 (6.4%) |
| 55 to 59 Years | 2,076 (6.8%) | 2,232 (6.8%) |
| 60 to 64 Years | 1,855 (6.0%) | 1,795 (5.5%) |
| 65 to 69 Years | 1,620 (5.3%) | 1,515 (4.6%) |
| 70 to 74 Years | 842 (2.8%) | 1,119 (3.4%) |
| 75 to 79 Years | 636 (2.1%) | 734 (2.2%) |
| 80 to 84 Years | 417 (1.4%) | 618 (1.9%) |
| 85 Years and over | 246 (0.8%) | 466 (1.4%) |
| Total | 30,672 (100.0%) | 32,739 (100.0%) |
Families and Households in Union County
Median Family Size in Union County
The median family size in Union County is 3.08 persons per family, with married-couple families (13,892 | 81.8%) accounting for the largest median family size of 3.19 persons per family. On the other hand, single male/father families (1,320 | 7.8%) represent the smallest median family size with 2.58 persons per family.
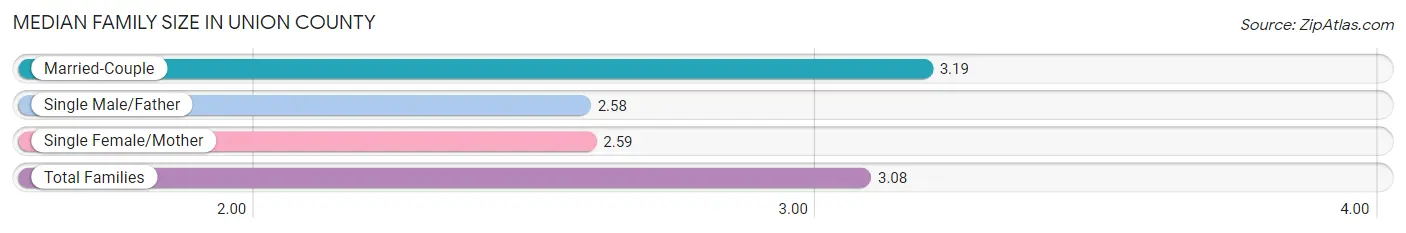
| Family Type | # Families | Family Size |
| Married-Couple | 13,892 (81.8%) | 3.19 |
| Single Male/Father | 1,320 (7.8%) | 2.58 |
| Single Female/Mother | 1,773 (10.4%) | 2.59 |
| Total Families | 16,985 (100.0%) | 3.08 |
Median Household Size in Union County
The median household size in Union County is 2.68 persons per household, with married-couple households (13,892 | 61.4%) accounting for the largest median household size of 3.21 persons per household. non-family households (5,659 | 25.0%) represent the smallest median household size with 1.25 persons per household.
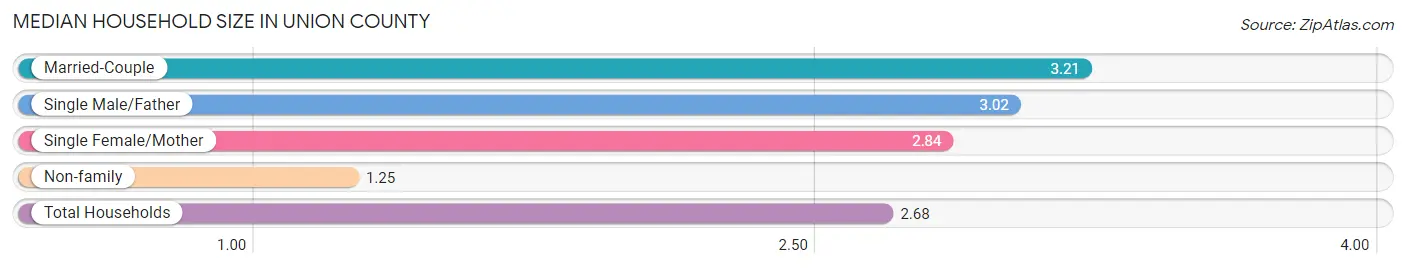
| Household Type | # Households | Household Size |
| Married-Couple | 13,892 (61.4%) | 3.21 |
| Single Male/Father | 1,320 (5.8%) | 3.02 |
| Single Female/Mother | 1,773 (7.8%) | 2.84 |
| Non-family | 5,659 (25.0%) | 1.25 |
| Total Households | 22,644 (100.0%) | 2.68 |
Household Size by Marriage Status in Union County
Out of a total of 22,644 households in Union County, 16,985 (75.0%) are family households, while 5,659 (25.0%) are nonfamily households. The most numerous type of family households are 2-person households, comprising 6,912, and the most common type of nonfamily households are 1-person households, comprising 4,420.
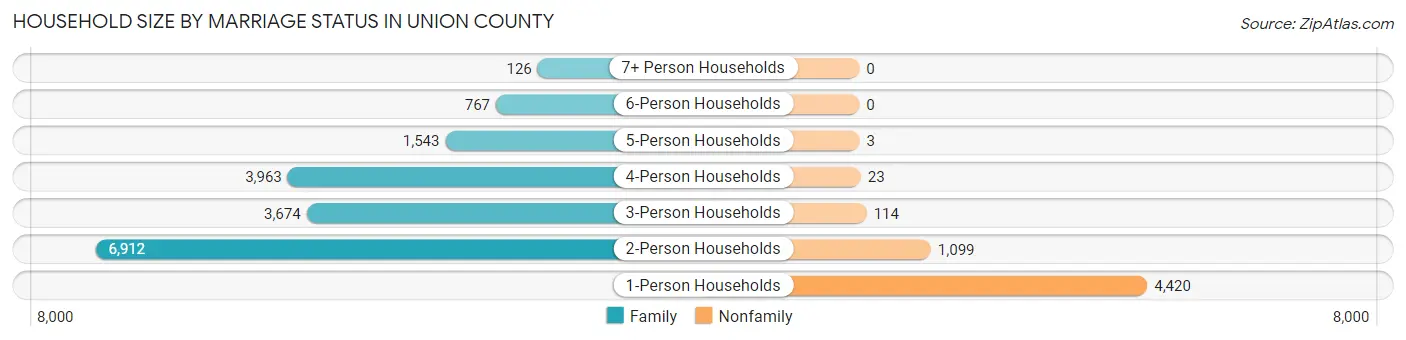
| Household Size | Family Households | Nonfamily Households |
| 1-Person Households | - | 4,420 (19.5%) |
| 2-Person Households | 6,912 (30.5%) | 1,099 (4.9%) |
| 3-Person Households | 3,674 (16.2%) | 114 (0.5%) |
| 4-Person Households | 3,963 (17.5%) | 23 (0.1%) |
| 5-Person Households | 1,543 (6.8%) | 3 (0.0%) |
| 6-Person Households | 767 (3.4%) | 0 (0.0%) |
| 7+ Person Households | 126 (0.6%) | 0 (0.0%) |
| Total | 16,985 (75.0%) | 5,659 (25.0%) |
Female Fertility in Union County
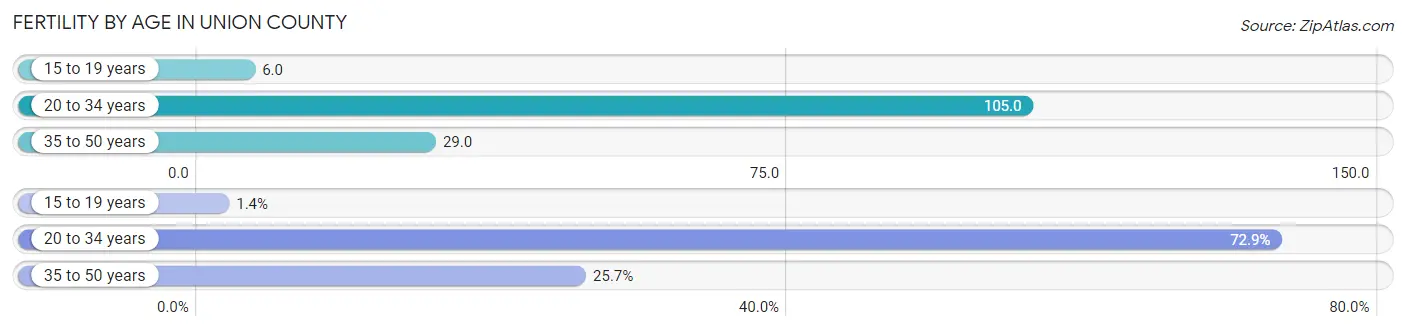
Fertility by Age in Union County
Average fertility rate in Union County is 55.0 births per 1,000 women. Women in the age bracket of 20 to 34 years have the highest fertility rate with 105.0 births per 1,000 women. Women in the age bracket of 20 to 34 years acount for 72.9% of all women with births.
| Age Bracket | Women with Births | Births / 1,000 Women |
| 15 to 19 years | 13 (1.4%) | 6.0 |
| 20 to 34 years | 659 (72.9%) | 105.0 |
| 35 to 50 years | 232 (25.7%) | 29.0 |
| Total | 904 (100.0%) | 55.0 |
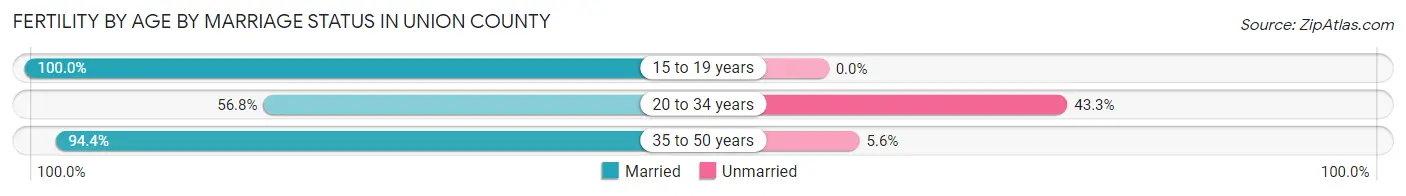
Fertility by Age by Marriage Status in Union County
67.0% of women with births (904) in Union County are married. The highest percentage of unmarried women with births falls into 20 to 34 years age bracket with 43.2% of them unmarried at the time of birth, while the lowest percentage of unmarried women with births belong to 15 to 19 years age bracket with 0.0% of them unmarried.
| Age Bracket | Married | Unmarried |
| 15 to 19 years | 13 (100.0%) | 0 (0.0%) |
| 20 to 34 years | 374 (56.8%) | 285 (43.2%) |
| 35 to 50 years | 219 (94.4%) | 13 (5.6%) |
| Total | 606 (67.0%) | 298 (33.0%) |
Fertility by Education in Union County
Average fertility rate in Union County is 55.0 births per 1,000 women. Women with the education attainment of graduate degree have the highest fertility rate of 132.0 births per 1,000 women, while women with the education attainment of college or associate's degree have the lowest fertility at 14.0 births per 1,000 women. Women with the education attainment of graduate degree represent 33.9% of all women with births.
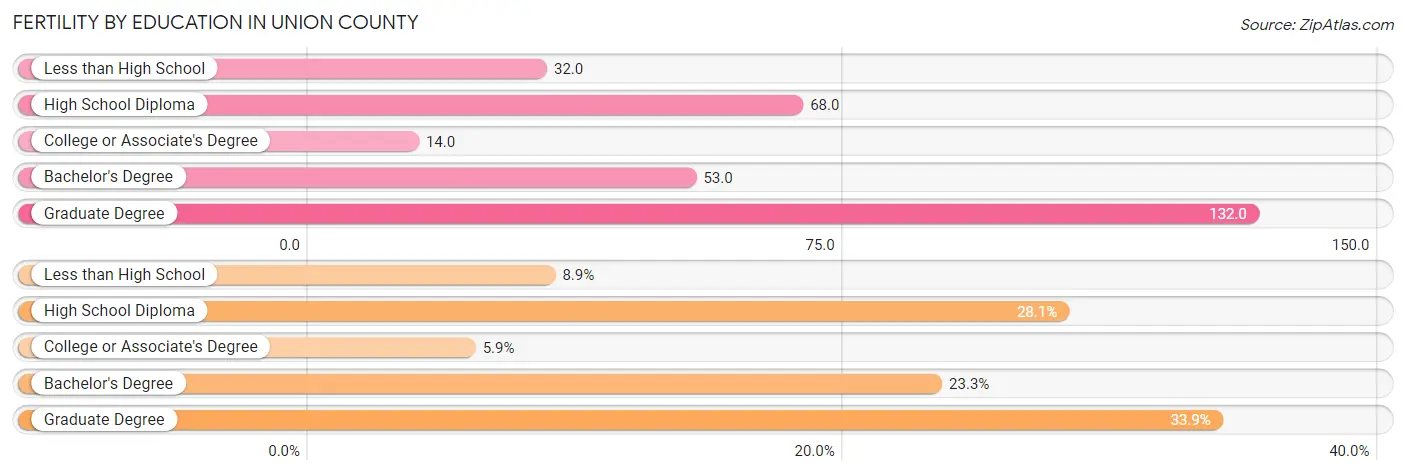
| Educational Attainment | Women with Births | Births / 1,000 Women |
| Less than High School | 80 (8.8%) | 32.0 |
| High School Diploma | 254 (28.1%) | 68.0 |
| College or Associate's Degree | 53 (5.9%) | 14.0 |
| Bachelor's Degree | 211 (23.3%) | 53.0 |
| Graduate Degree | 306 (33.9%) | 132.0 |
| Total | 904 (100.0%) | 55.0 |
Fertility by Education by Marriage Status in Union County
33.0% of women with births in Union County are unmarried. Women with the educational attainment of graduate degree are most likely to be married with 100.0% of them married at childbirth, while women with the educational attainment of less than high school are least likely to be married with 92.5% of them unmarried at childbirth.
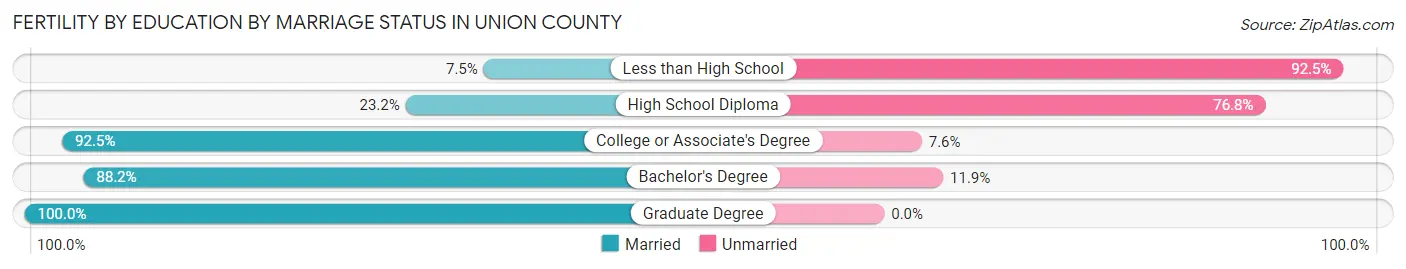
| Educational Attainment | Married | Unmarried |
| Less than High School | 6 (7.5%) | 74 (92.5%) |
| High School Diploma | 59 (23.2%) | 195 (76.8%) |
| College or Associate's Degree | 49 (92.4%) | 4 (7.5%) |
| Bachelor's Degree | 186 (88.1%) | 25 (11.8%) |
| Graduate Degree | 306 (100.0%) | 0 (0.0%) |
| Total | 606 (67.0%) | 298 (33.0%) |
Employment Characteristics in Union County
Employment by Class of Employer in Union County
Among the 31,865 employed individuals in Union County, private company employees (22,339 | 70.1%), not-for-profit organizations (2,491 | 7.8%), and local government employees (2,375 | 7.4%) make up the most common classes of employment.
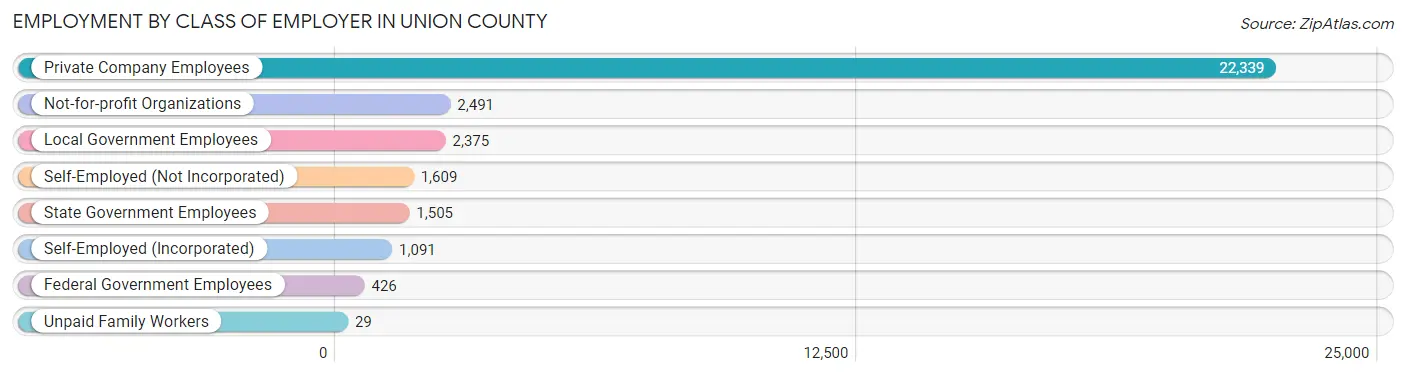
| Employer Class | # Employees | % Employees |
| Private Company Employees | 22,339 | 70.1% |
| Self-Employed (Incorporated) | 1,091 | 3.4% |
| Self-Employed (Not Incorporated) | 1,609 | 5.1% |
| Not-for-profit Organizations | 2,491 | 7.8% |
| Local Government Employees | 2,375 | 7.4% |
| State Government Employees | 1,505 | 4.7% |
| Federal Government Employees | 426 | 1.3% |
| Unpaid Family Workers | 29 | 0.1% |
| Total | 31,865 | 100.0% |
Employment Status by Age in Union County
According to the labor force statistics for Union County, out of the total population over 16 years of age (49,814), 67.8% or 33,774 individuals are in the labor force, with 2.9% or 979 of them unemployed. The age group with the highest labor force participation rate is 45 to 54 years, with 85.7% or 7,572 individuals in the labor force. Within the labor force, the 75 years and over age range has the highest percentage of unemployed individuals, with 8.0% or 26 of them being unemployed.
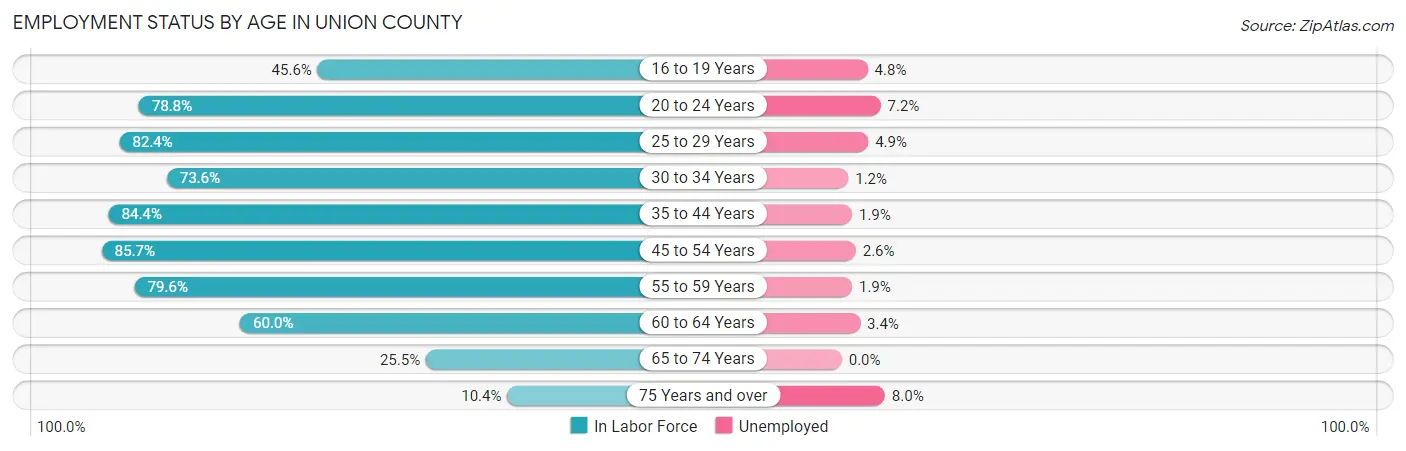
| Age Bracket | In Labor Force | Unemployed |
| 16 to 19 Years | 1,491 (45.6%) | 72 (4.8%) |
| 20 to 24 Years | 2,764 (78.8%) | 199 (7.2%) |
| 25 to 29 Years | 3,219 (82.4%) | 158 (4.9%) |
| 30 to 34 Years | 3,147 (73.6%) | 38 (1.2%) |
| 35 to 44 Years | 8,311 (84.4%) | 158 (1.9%) |
| 45 to 54 Years | 7,572 (85.7%) | 197 (2.6%) |
| 55 to 59 Years | 3,429 (79.6%) | 65 (1.9%) |
| 60 to 64 Years | 2,190 (60.0%) | 74 (3.4%) |
| 65 to 74 Years | 1,299 (25.5%) | 0 (0.0%) |
| 75 Years and over | 324 (10.4%) | 26 (8.0%) |
| Total | 33,774 (67.8%) | 979 (2.9%) |
Employment Status by Educational Attainment in Union County
According to labor force statistics for Union County, 80.0% of individuals (27,859) out of the total population between 25 and 64 years of age (34,824) are in the labor force, with 2.5% or 696 of them being unemployed. The group with the highest labor force participation rate are those with the educational attainment of bachelor's degree or higher, with 89.9% or 13,662 individuals in the labor force. Within the labor force, individuals with less than high school education have the highest percentage of unemployment, with 22.3% or 162 of them being unemployed.
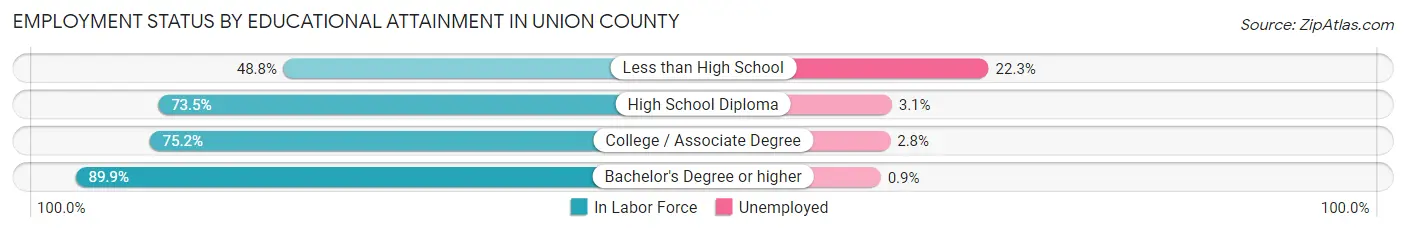
| Educational Attainment | In Labor Force | Unemployed |
| Less than High School | 728 (48.8%) | 332 (22.3%) |
| High School Diploma | 6,880 (73.5%) | 290 (3.1%) |
| College / Associate Degree | 6,599 (75.2%) | 246 (2.8%) |
| Bachelor's Degree or higher | 13,662 (89.9%) | 137 (0.9%) |
| Total | 27,859 (80.0%) | 871 (2.5%) |
Employment Occupations by Sex in Union County
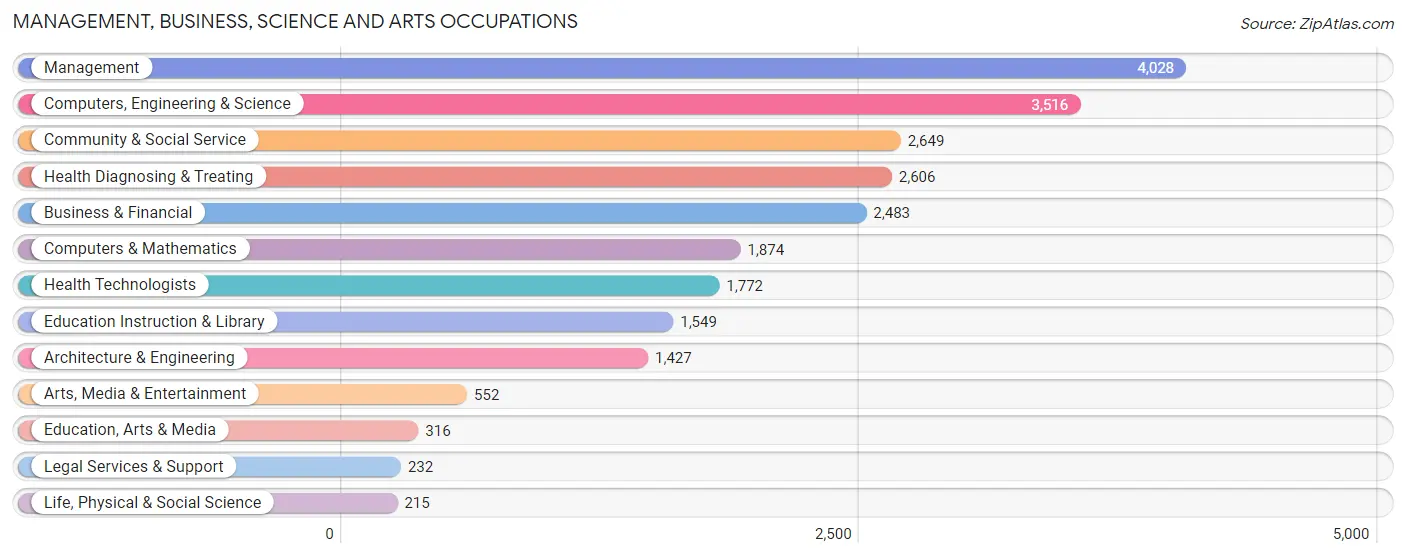
Management, Business, Science and Arts Occupations
The most common Management, Business, Science and Arts occupations in Union County are Management (4,028 | 12.3%), Computers, Engineering & Science (3,516 | 10.7%), Community & Social Service (2,649 | 8.1%), Health Diagnosing & Treating (2,606 | 8.0%), and Business & Financial (2,483 | 7.6%).
Management, Business, Science and Arts Occupations by Sex
Within the Management, Business, Science and Arts occupations in Union County, the most male-oriented occupations are Architecture & Engineering (93.1%), Computers, Engineering & Science (82.3%), and Computers & Mathematics (77.2%), while the most female-oriented occupations are Education Instruction & Library (83.1%), Legal Services & Support (72.0%), and Health Diagnosing & Treating (70.5%).
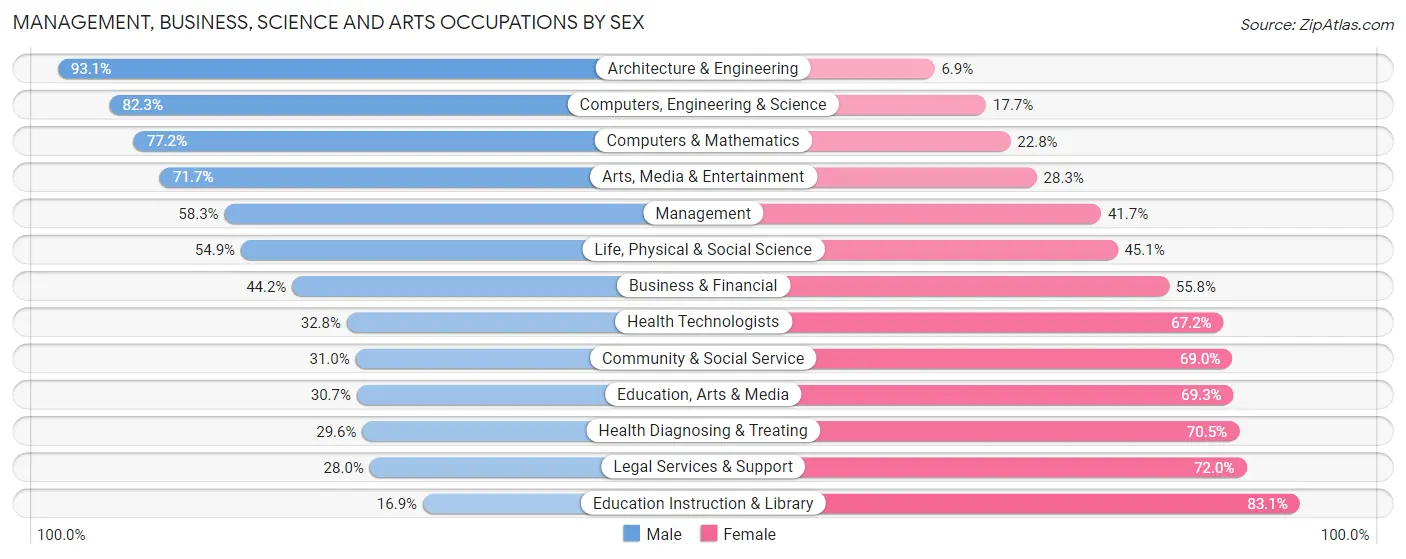
| Occupation | Male | Female |
| Management | 2,349 (58.3%) | 1,679 (41.7%) |
| Business & Financial | 1,097 (44.2%) | 1,386 (55.8%) |
| Computers, Engineering & Science | 2,893 (82.3%) | 623 (17.7%) |
| Computers & Mathematics | 1,447 (77.2%) | 427 (22.8%) |
| Architecture & Engineering | 1,328 (93.1%) | 99 (6.9%) |
| Life, Physical & Social Science | 118 (54.9%) | 97 (45.1%) |
| Community & Social Service | 820 (31.0%) | 1,829 (69.0%) |
| Education, Arts & Media | 97 (30.7%) | 219 (69.3%) |
| Legal Services & Support | 65 (28.0%) | 167 (72.0%) |
| Education Instruction & Library | 262 (16.9%) | 1,287 (83.1%) |
| Arts, Media & Entertainment | 396 (71.7%) | 156 (28.3%) |
| Health Diagnosing & Treating | 770 (29.5%) | 1,836 (70.5%) |
| Health Technologists | 581 (32.8%) | 1,191 (67.2%) |
| Total (Category) | 7,929 (51.9%) | 7,353 (48.1%) |
| Total (Overall) | 17,639 (53.9%) | 15,110 (46.1%) |
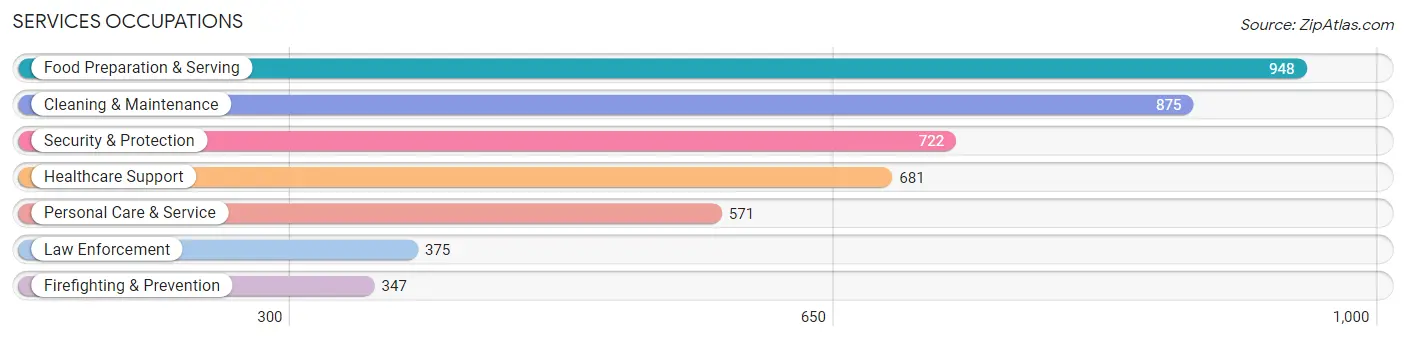
Services Occupations
The most common Services occupations in Union County are Food Preparation & Serving (948 | 2.9%), Cleaning & Maintenance (875 | 2.7%), Security & Protection (722 | 2.2%), Healthcare Support (681 | 2.1%), and Personal Care & Service (571 | 1.7%).
Services Occupations by Sex
Within the Services occupations in Union County, the most male-oriented occupations are Firefighting & Prevention (79.5%), Security & Protection (76.0%), and Law Enforcement (72.8%), while the most female-oriented occupations are Healthcare Support (97.8%), Personal Care & Service (75.7%), and Food Preparation & Serving (47.7%).
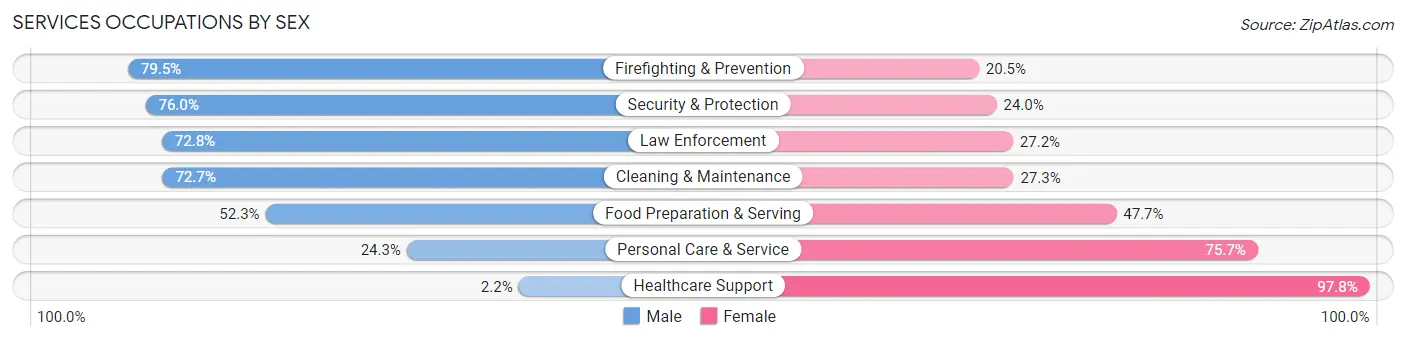
| Occupation | Male | Female |
| Healthcare Support | 15 (2.2%) | 666 (97.8%) |
| Security & Protection | 549 (76.0%) | 173 (24.0%) |
| Firefighting & Prevention | 276 (79.5%) | 71 (20.5%) |
| Law Enforcement | 273 (72.8%) | 102 (27.2%) |
| Food Preparation & Serving | 496 (52.3%) | 452 (47.7%) |
| Cleaning & Maintenance | 636 (72.7%) | 239 (27.3%) |
| Personal Care & Service | 139 (24.3%) | 432 (75.7%) |
| Total (Category) | 1,835 (48.3%) | 1,962 (51.7%) |
| Total (Overall) | 17,639 (53.9%) | 15,110 (46.1%) |
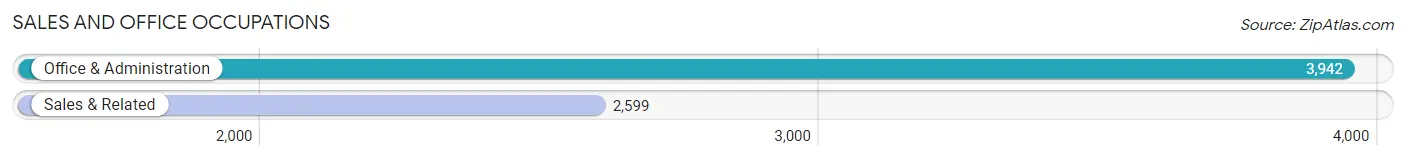
Sales and Office Occupations
The most common Sales and Office occupations in Union County are Office & Administration (3,942 | 12.0%), and Sales & Related (2,599 | 7.9%).
Sales and Office Occupations by Sex
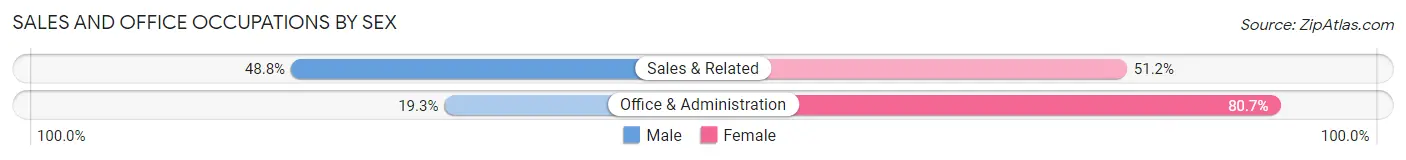
| Occupation | Male | Female |
| Sales & Related | 1,268 (48.8%) | 1,331 (51.2%) |
| Office & Administration | 761 (19.3%) | 3,181 (80.7%) |
| Total (Category) | 2,029 (31.0%) | 4,512 (69.0%) |
| Total (Overall) | 17,639 (53.9%) | 15,110 (46.1%) |
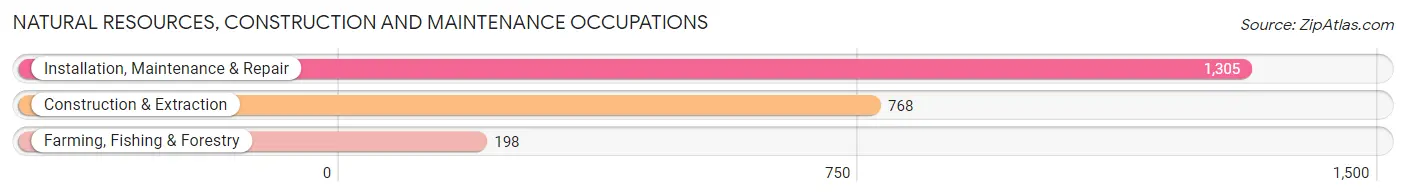
Natural Resources, Construction and Maintenance Occupations
The most common Natural Resources, Construction and Maintenance occupations in Union County are Installation, Maintenance & Repair (1,305 | 4.0%), Construction & Extraction (768 | 2.4%), and Farming, Fishing & Forestry (198 | 0.6%).
Natural Resources, Construction and Maintenance Occupations by Sex
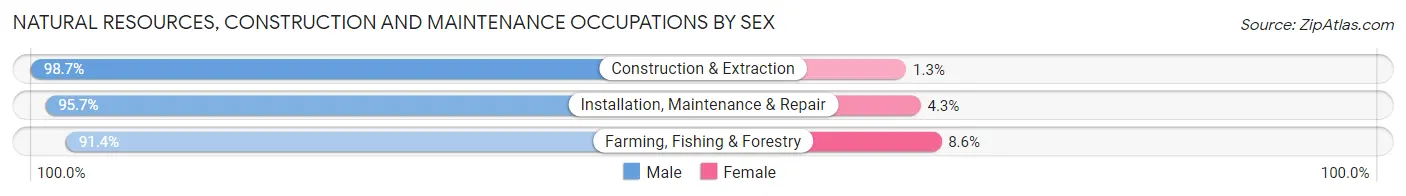
| Occupation | Male | Female |
| Farming, Fishing & Forestry | 181 (91.4%) | 17 (8.6%) |
| Construction & Extraction | 758 (98.7%) | 10 (1.3%) |
| Installation, Maintenance & Repair | 1,249 (95.7%) | 56 (4.3%) |
| Total (Category) | 2,188 (96.4%) | 83 (3.6%) |
| Total (Overall) | 17,639 (53.9%) | 15,110 (46.1%) |
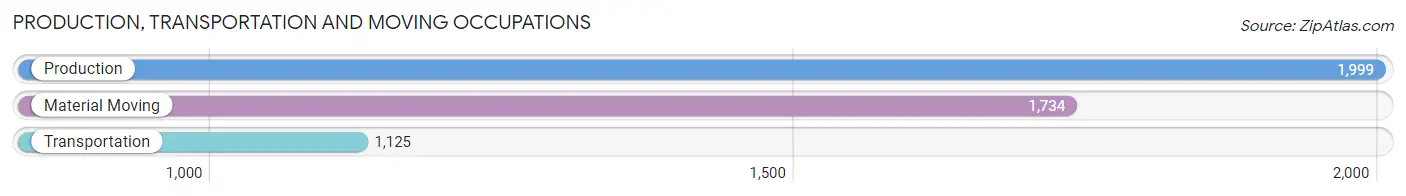
Production, Transportation and Moving Occupations
The most common Production, Transportation and Moving occupations in Union County are Production (1,999 | 6.1%), Material Moving (1,734 | 5.3%), and Transportation (1,125 | 3.4%).
Production, Transportation and Moving Occupations by Sex
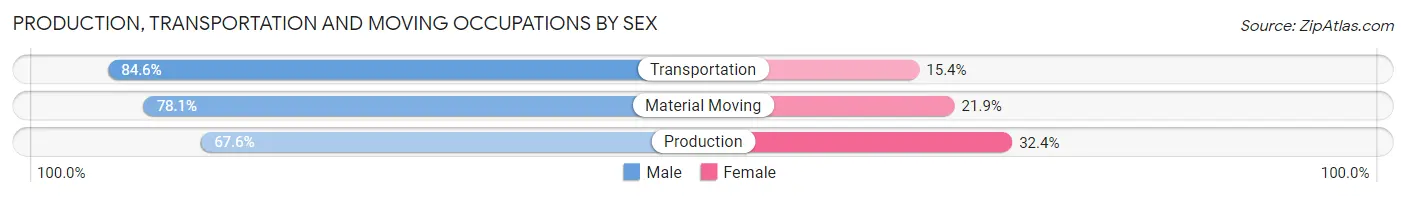
| Occupation | Male | Female |
| Production | 1,351 (67.6%) | 648 (32.4%) |
| Transportation | 952 (84.6%) | 173 (15.4%) |
| Material Moving | 1,355 (78.1%) | 379 (21.9%) |
| Total (Category) | 3,658 (75.3%) | 1,200 (24.7%) |
| Total (Overall) | 17,639 (53.9%) | 15,110 (46.1%) |
Employment Industries by Sex in Union County
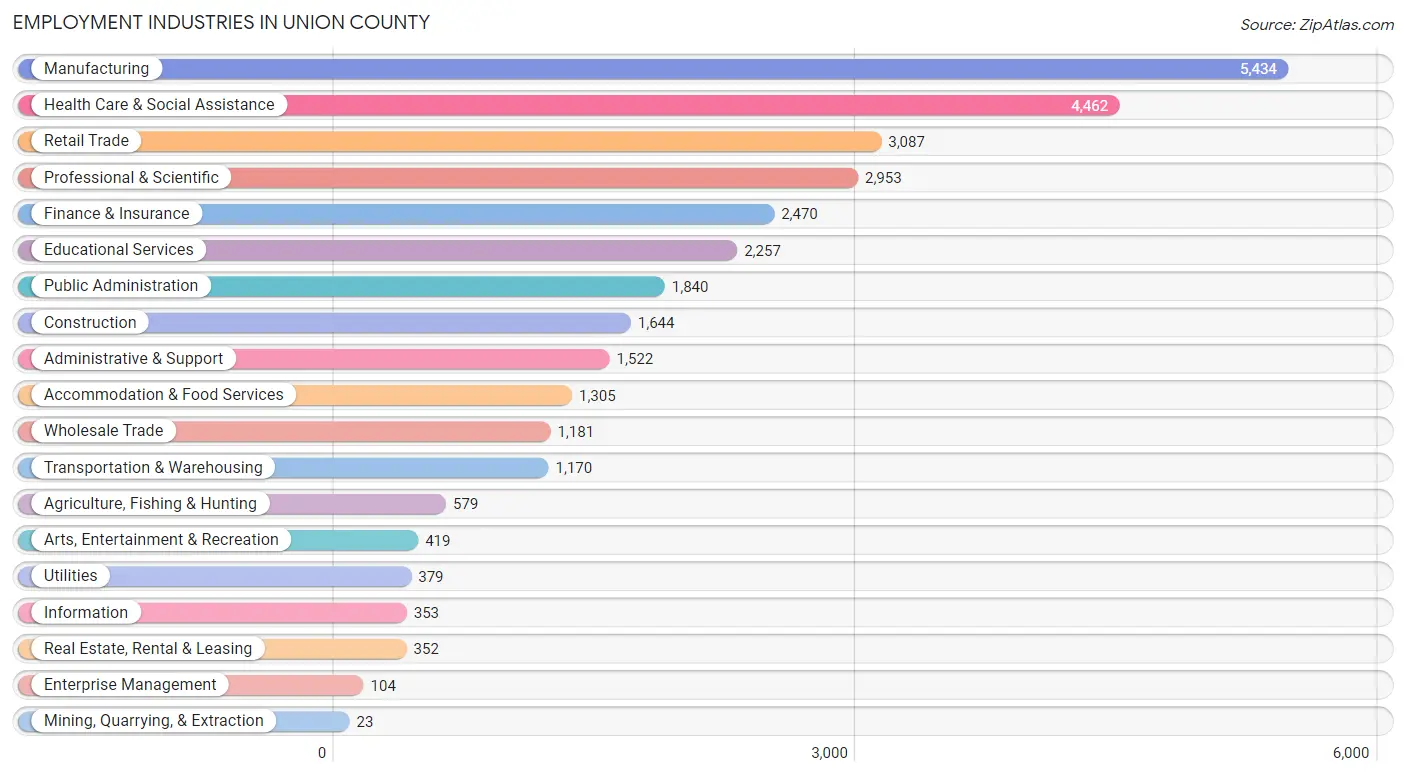
Employment Industries in Union County
The major employment industries in Union County include Manufacturing (5,434 | 16.6%), Health Care & Social Assistance (4,462 | 13.6%), Retail Trade (3,087 | 9.4%), Professional & Scientific (2,953 | 9.0%), and Finance & Insurance (2,470 | 7.5%).
Employment Industries by Sex in Union County
The Union County industries that see more men than women are Mining, Quarrying, & Extraction (100.0%), Enterprise Management (100.0%), and Construction (90.3%), whereas the industries that tend to have a higher number of women are Health Care & Social Assistance (78.1%), Educational Services (72.4%), and Information (57.2%).
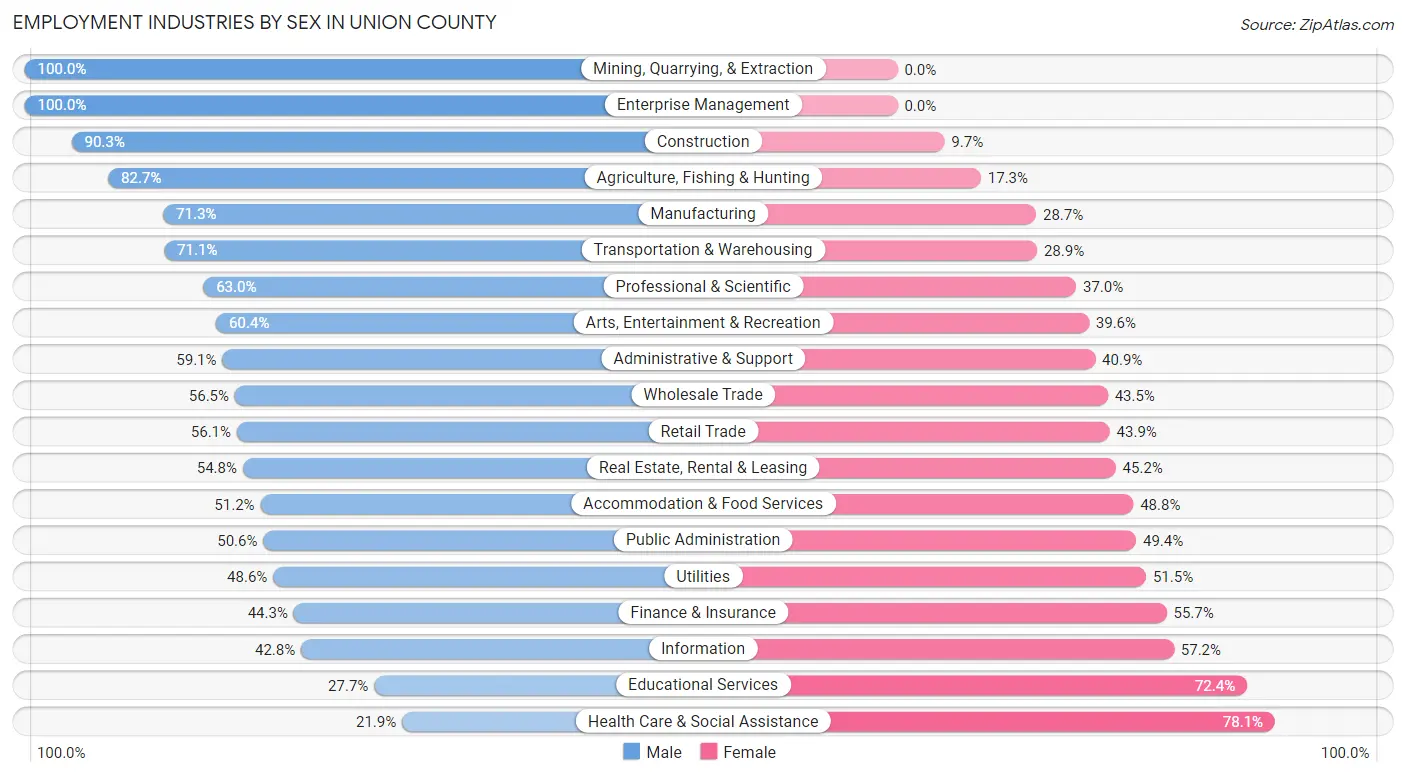
| Industry | Male | Female |
| Agriculture, Fishing & Hunting | 479 (82.7%) | 100 (17.3%) |
| Mining, Quarrying, & Extraction | 23 (100.0%) | 0 (0.0%) |
| Construction | 1,484 (90.3%) | 160 (9.7%) |
| Manufacturing | 3,875 (71.3%) | 1,559 (28.7%) |
| Wholesale Trade | 667 (56.5%) | 514 (43.5%) |
| Retail Trade | 1,731 (56.1%) | 1,356 (43.9%) |
| Transportation & Warehousing | 832 (71.1%) | 338 (28.9%) |
| Utilities | 184 (48.5%) | 195 (51.4%) |
| Information | 151 (42.8%) | 202 (57.2%) |
| Finance & Insurance | 1,094 (44.3%) | 1,376 (55.7%) |
| Real Estate, Rental & Leasing | 193 (54.8%) | 159 (45.2%) |
| Professional & Scientific | 1,861 (63.0%) | 1,092 (37.0%) |
| Enterprise Management | 104 (100.0%) | 0 (0.0%) |
| Administrative & Support | 899 (59.1%) | 623 (40.9%) |
| Educational Services | 624 (27.7%) | 1,633 (72.4%) |
| Health Care & Social Assistance | 976 (21.9%) | 3,486 (78.1%) |
| Arts, Entertainment & Recreation | 253 (60.4%) | 166 (39.6%) |
| Accommodation & Food Services | 668 (51.2%) | 637 (48.8%) |
| Public Administration | 931 (50.6%) | 909 (49.4%) |
| Total | 17,639 (53.9%) | 15,110 (46.1%) |
Education in Union County
School Enrollment in Union County
The most common levels of schooling among the 15,742 students in Union County are high school (4,091 | 26.0%), middle school (3,587 | 22.8%), and elementary school (3,257 | 20.7%).
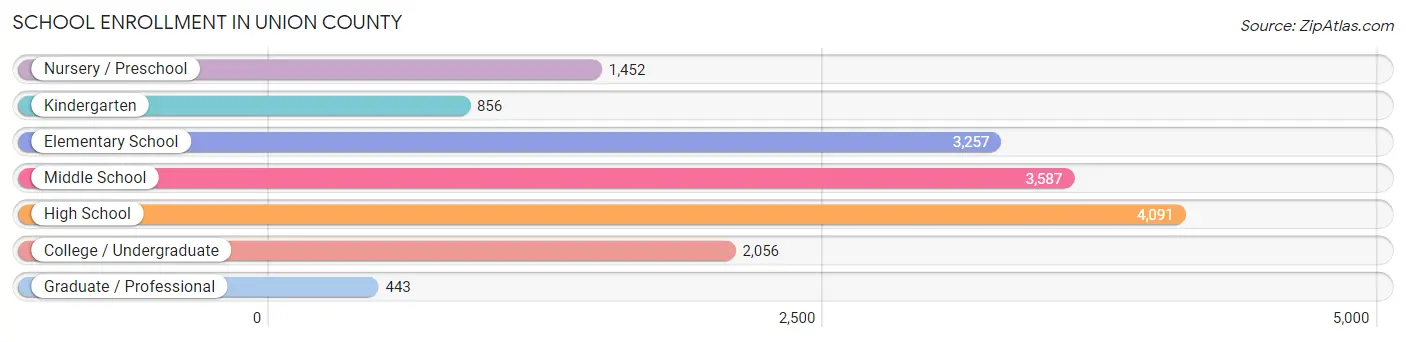
| School Level | # Students | % Students |
| Nursery / Preschool | 1,452 | 9.2% |
| Kindergarten | 856 | 5.4% |
| Elementary School | 3,257 | 20.7% |
| Middle School | 3,587 | 22.8% |
| High School | 4,091 | 26.0% |
| College / Undergraduate | 2,056 | 13.1% |
| Graduate / Professional | 443 | 2.8% |
| Total | 15,742 | 100.0% |
School Enrollment by Age by Funding Source in Union County
Out of a total of 15,742 students who are enrolled in schools in Union County, 2,786 (17.7%) attend a private institution, while the remaining 12,956 (82.3%) are enrolled in public schools. The age group of 3 to 4 year olds has the highest likelihood of being enrolled in private schools, with 592 (54.2% in the age bracket) enrolled. Conversely, the age group of 15 to 17 year olds has the lowest likelihood of being enrolled in a private school, with 2,568 (95.5% in the age bracket) attending a public institution.
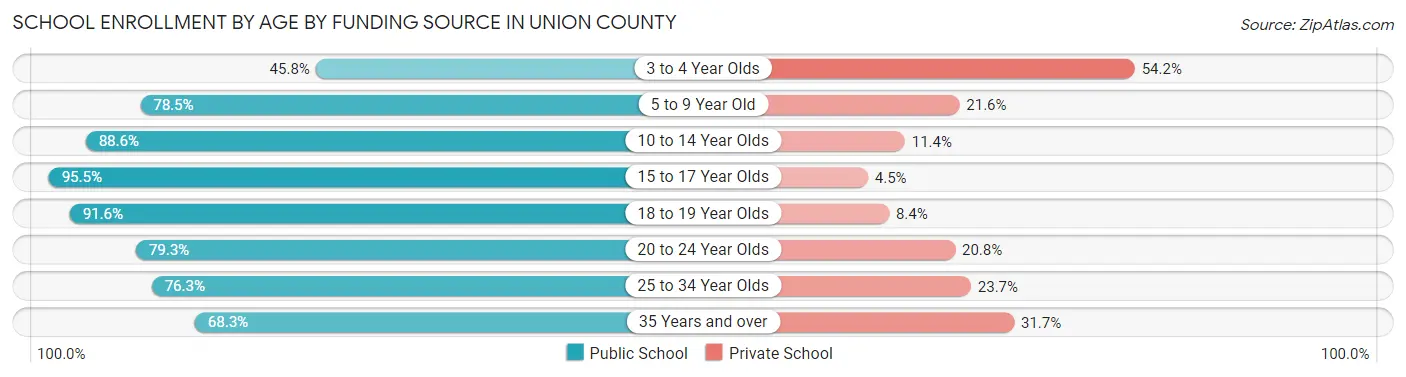
| Age Bracket | Public School | Private School |
| 3 to 4 Year Olds | 500 (45.8%) | 592 (54.2%) |
| 5 to 9 Year Old | 3,145 (78.4%) | 864 (21.5%) |
| 10 to 14 Year Olds | 3,915 (88.6%) | 503 (11.4%) |
| 15 to 17 Year Olds | 2,568 (95.5%) | 121 (4.5%) |
| 18 to 19 Year Olds | 1,097 (91.6%) | 101 (8.4%) |
| 20 to 24 Year Olds | 657 (79.2%) | 172 (20.7%) |
| 25 to 34 Year Olds | 467 (76.3%) | 145 (23.7%) |
| 35 Years and over | 611 (68.3%) | 284 (31.7%) |
| Total | 12,956 (82.3%) | 2,786 (17.7%) |
Educational Attainment by Field of Study in Union County
Business (4,160 | 23.0%), science & technology (2,319 | 12.8%), engineering (1,840 | 10.2%), education (1,565 | 8.6%), and bio, nature & agricultural (1,412 | 7.8%) are the most common fields of study among 18,097 individuals in Union County who have obtained a bachelor's degree or higher.
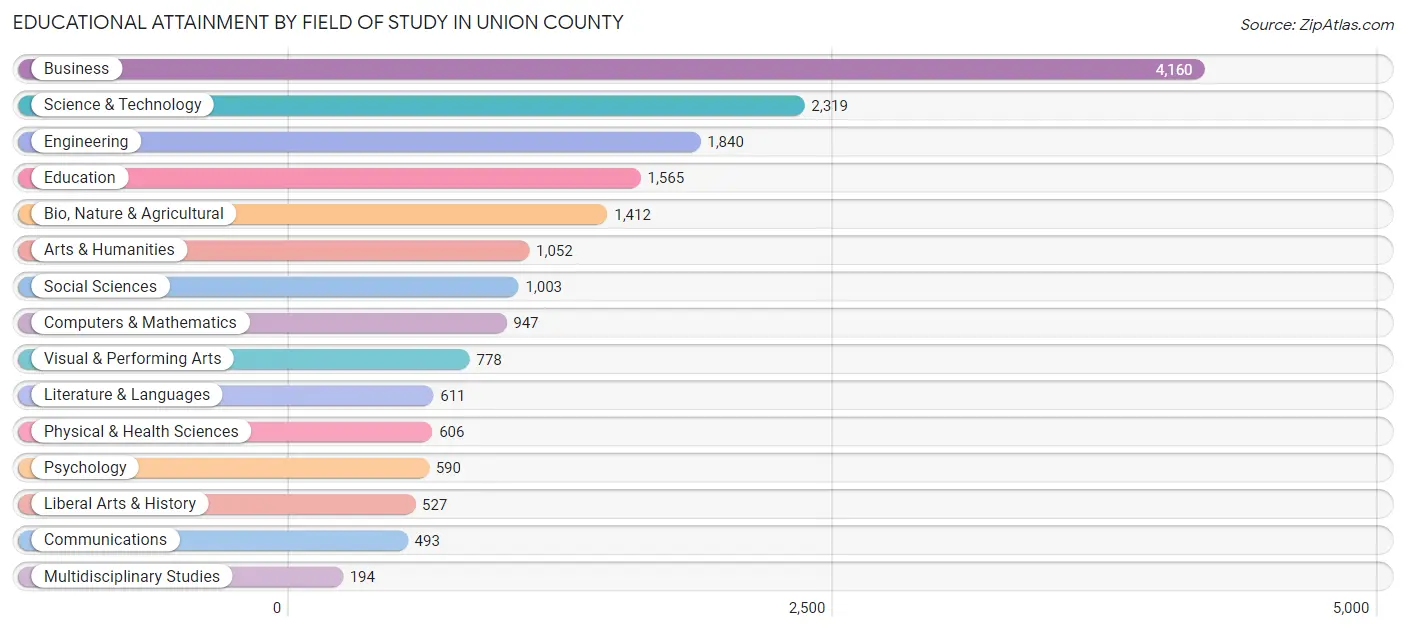
| Field of Study | # Graduates | % Graduates |
| Computers & Mathematics | 947 | 5.2% |
| Bio, Nature & Agricultural | 1,412 | 7.8% |
| Physical & Health Sciences | 606 | 3.4% |
| Psychology | 590 | 3.3% |
| Social Sciences | 1,003 | 5.5% |
| Engineering | 1,840 | 10.2% |
| Multidisciplinary Studies | 194 | 1.1% |
| Science & Technology | 2,319 | 12.8% |
| Business | 4,160 | 23.0% |
| Education | 1,565 | 8.6% |
| Literature & Languages | 611 | 3.4% |
| Liberal Arts & History | 527 | 2.9% |
| Visual & Performing Arts | 778 | 4.3% |
| Communications | 493 | 2.7% |
| Arts & Humanities | 1,052 | 5.8% |
| Total | 18,097 | 100.0% |
Transportation & Commute in Union County
Vehicle Availability by Sex in Union County
The most prevalent vehicle ownership categories in Union County are males with 2 vehicles (8,021, accounting for 46.4%) and females with 2 vehicles (6,271, making up 55.0%).
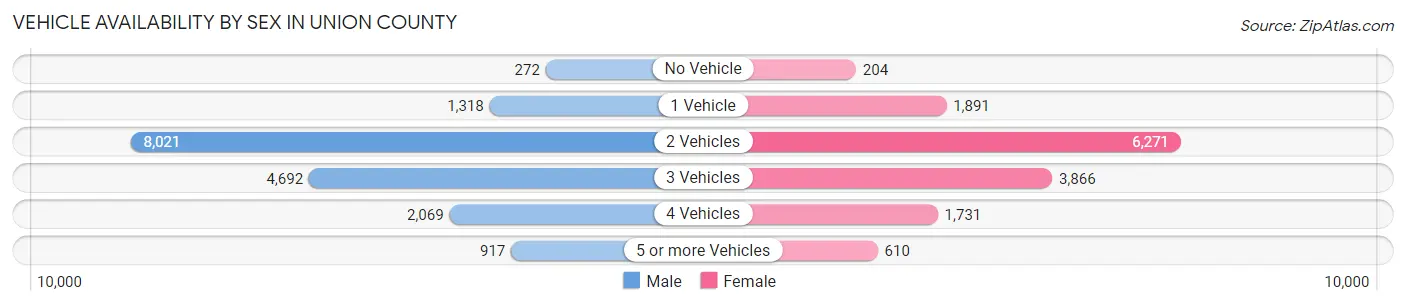
| Vehicles Available | Male | Female |
| No Vehicle | 272 (1.6%) | 204 (1.4%) |
| 1 Vehicle | 1,318 (7.6%) | 1,891 (13.0%) |
| 2 Vehicles | 8,021 (46.4%) | 6,271 (43.0%) |
| 3 Vehicles | 4,692 (27.1%) | 3,866 (26.5%) |
| 4 Vehicles | 2,069 (12.0%) | 1,731 (11.9%) |
| 5 or more Vehicles | 917 (5.3%) | 610 (4.2%) |
| Total | 17,289 (100.0%) | 14,573 (100.0%) |
Commute Time in Union County
The most frequently occuring commute durations in Union County are 10 to 14 minutes (3,900 commuters, 15.0%), 20 to 24 minutes (3,576 commuters, 13.8%), and 30 to 34 minutes (3,424 commuters, 13.2%).
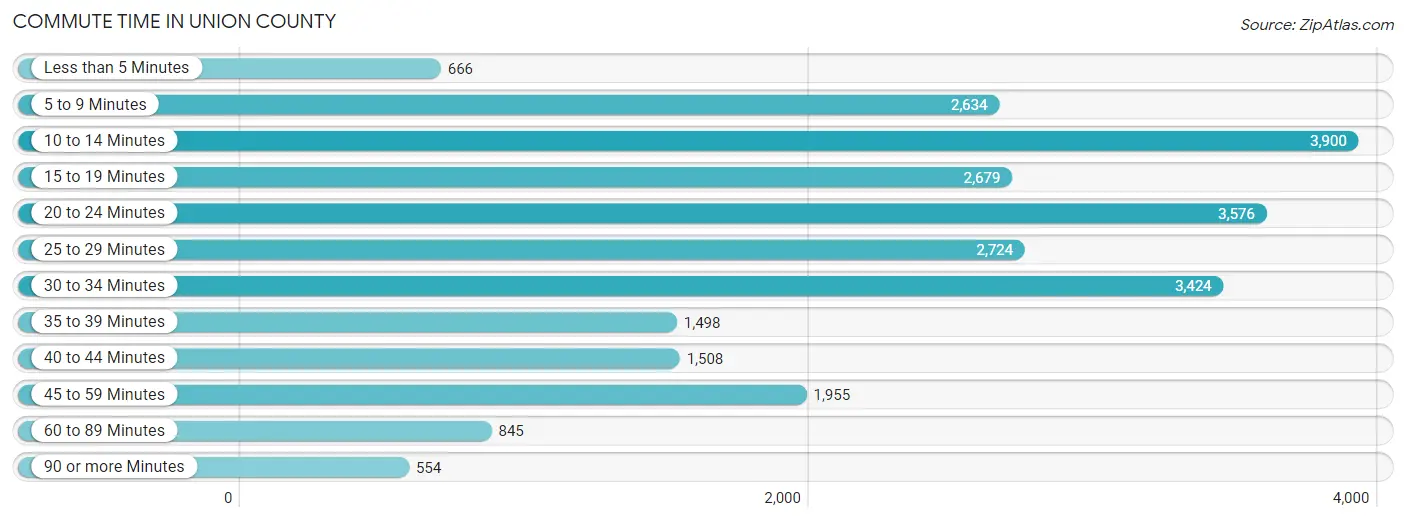
| Commute Time | # Commuters | % Commuters |
| Less than 5 Minutes | 666 | 2.6% |
| 5 to 9 Minutes | 2,634 | 10.2% |
| 10 to 14 Minutes | 3,900 | 15.0% |
| 15 to 19 Minutes | 2,679 | 10.3% |
| 20 to 24 Minutes | 3,576 | 13.8% |
| 25 to 29 Minutes | 2,724 | 10.5% |
| 30 to 34 Minutes | 3,424 | 13.2% |
| 35 to 39 Minutes | 1,498 | 5.8% |
| 40 to 44 Minutes | 1,508 | 5.8% |
| 45 to 59 Minutes | 1,955 | 7.5% |
| 60 to 89 Minutes | 845 | 3.3% |
| 90 or more Minutes | 554 | 2.1% |
Commute Time by Sex in Union County
The most common commute times in Union County are 10 to 14 minutes (2,076 commuters, 14.2%) for males and 10 to 14 minutes (1,824 commuters, 16.1%) for females.
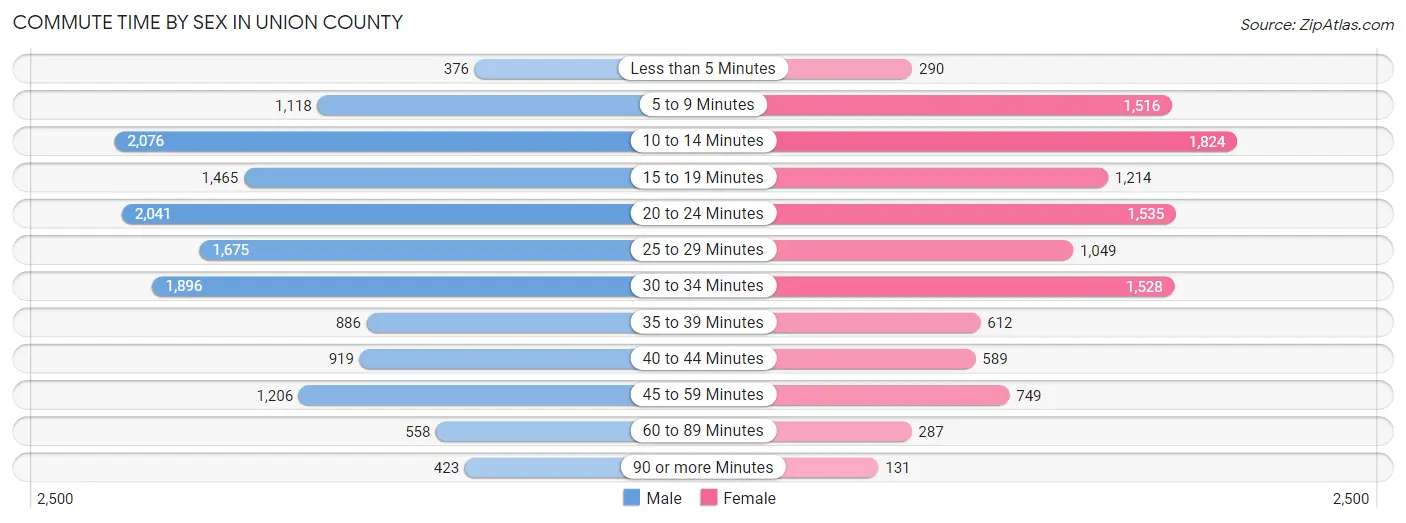
| Commute Time | Male | Female |
| Less than 5 Minutes | 376 (2.6%) | 290 (2.6%) |
| 5 to 9 Minutes | 1,118 (7.6%) | 1,516 (13.4%) |
| 10 to 14 Minutes | 2,076 (14.2%) | 1,824 (16.1%) |
| 15 to 19 Minutes | 1,465 (10.0%) | 1,214 (10.7%) |
| 20 to 24 Minutes | 2,041 (13.9%) | 1,535 (13.6%) |
| 25 to 29 Minutes | 1,675 (11.4%) | 1,049 (9.3%) |
| 30 to 34 Minutes | 1,896 (13.0%) | 1,528 (13.5%) |
| 35 to 39 Minutes | 886 (6.0%) | 612 (5.4%) |
| 40 to 44 Minutes | 919 (6.3%) | 589 (5.2%) |
| 45 to 59 Minutes | 1,206 (8.2%) | 749 (6.6%) |
| 60 to 89 Minutes | 558 (3.8%) | 287 (2.5%) |
| 90 or more Minutes | 423 (2.9%) | 131 (1.2%) |
Time of Departure to Work by Sex in Union County
The most frequent times of departure to work in Union County are 7:00 AM to 7:29 AM (2,065, 14.1%) for males and 7:00 AM to 7:29 AM (1,894, 16.7%) for females.
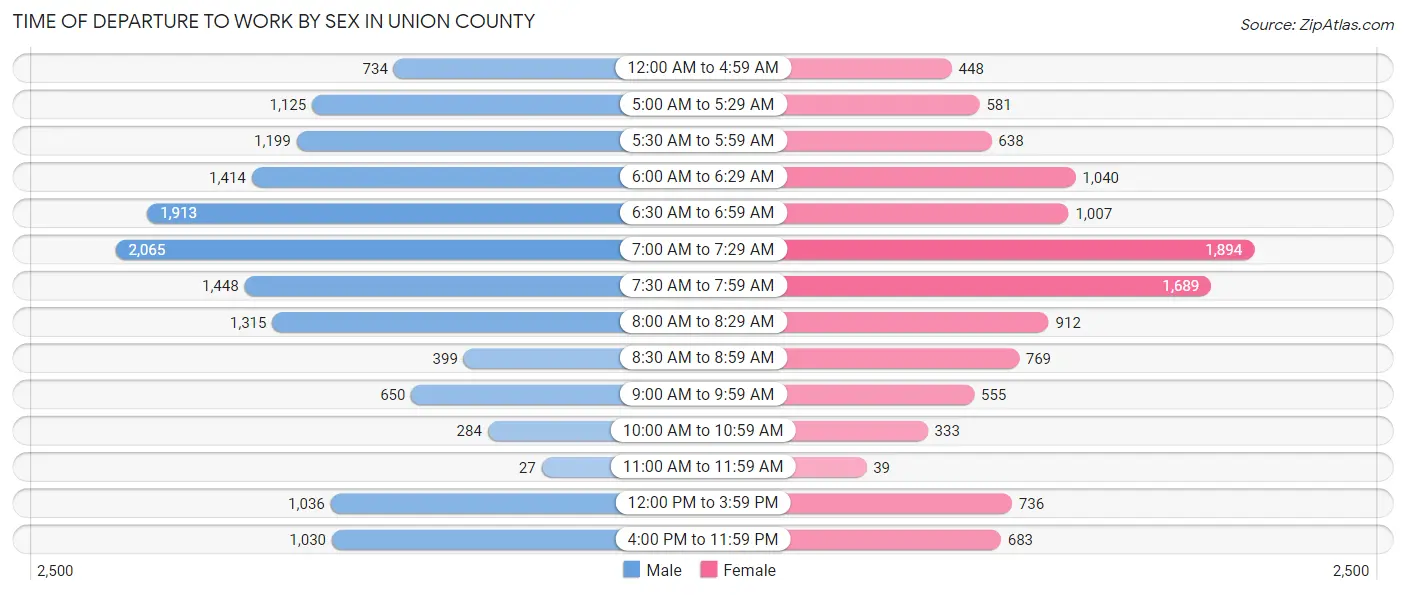
| Time of Departure | Male | Female |
| 12:00 AM to 4:59 AM | 734 (5.0%) | 448 (4.0%) |
| 5:00 AM to 5:29 AM | 1,125 (7.7%) | 581 (5.1%) |
| 5:30 AM to 5:59 AM | 1,199 (8.2%) | 638 (5.6%) |
| 6:00 AM to 6:29 AM | 1,414 (9.7%) | 1,040 (9.2%) |
| 6:30 AM to 6:59 AM | 1,913 (13.1%) | 1,007 (8.9%) |
| 7:00 AM to 7:29 AM | 2,065 (14.1%) | 1,894 (16.7%) |
| 7:30 AM to 7:59 AM | 1,448 (9.9%) | 1,689 (14.9%) |
| 8:00 AM to 8:29 AM | 1,315 (9.0%) | 912 (8.1%) |
| 8:30 AM to 8:59 AM | 399 (2.7%) | 769 (6.8%) |
| 9:00 AM to 9:59 AM | 650 (4.4%) | 555 (4.9%) |
| 10:00 AM to 10:59 AM | 284 (1.9%) | 333 (2.9%) |
| 11:00 AM to 11:59 AM | 27 (0.2%) | 39 (0.3%) |
| 12:00 PM to 3:59 PM | 1,036 (7.1%) | 736 (6.5%) |
| 4:00 PM to 11:59 PM | 1,030 (7.0%) | 683 (6.0%) |
| Total | 14,639 (100.0%) | 11,324 (100.0%) |
Housing Occupancy in Union County
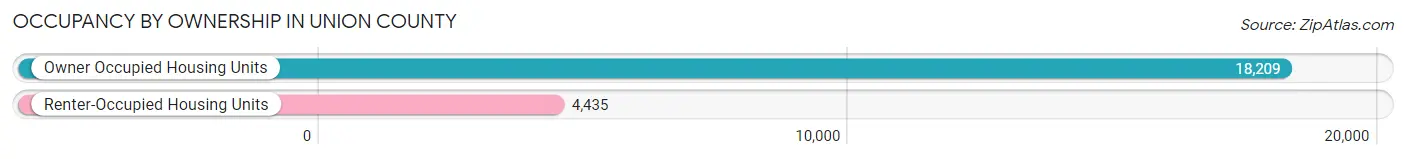
Occupancy by Ownership in Union County
Of the total 22,644 dwellings in Union County, owner-occupied units account for 18,209 (80.4%), while renter-occupied units make up 4,435 (19.6%).
| Occupancy | # Housing Units | % Housing Units |
| Owner Occupied Housing Units | 18,209 | 80.4% |
| Renter-Occupied Housing Units | 4,435 | 19.6% |
| Total Occupied Housing Units | 22,644 | 100.0% |
Occupancy by Household Size in Union County
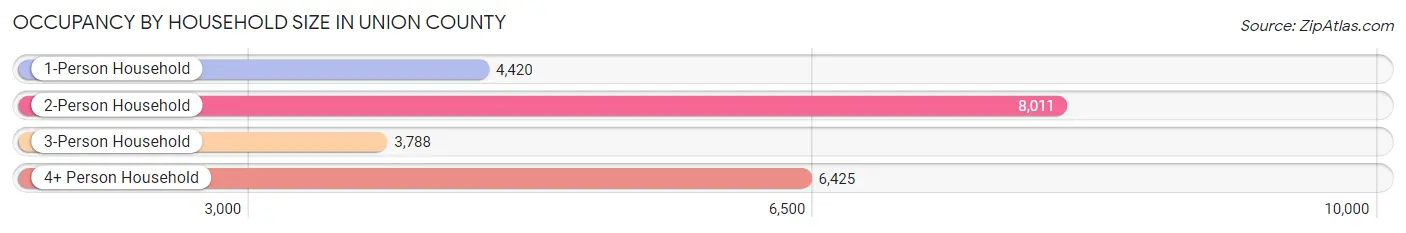
| Household Size | # Housing Units | % Housing Units |
| 1-Person Household | 4,420 | 19.5% |
| 2-Person Household | 8,011 | 35.4% |
| 3-Person Household | 3,788 | 16.7% |
| 4+ Person Household | 6,425 | 28.4% |
| Total Housing Units | 22,644 | 100.0% |
Occupancy by Ownership by Household Size in Union County
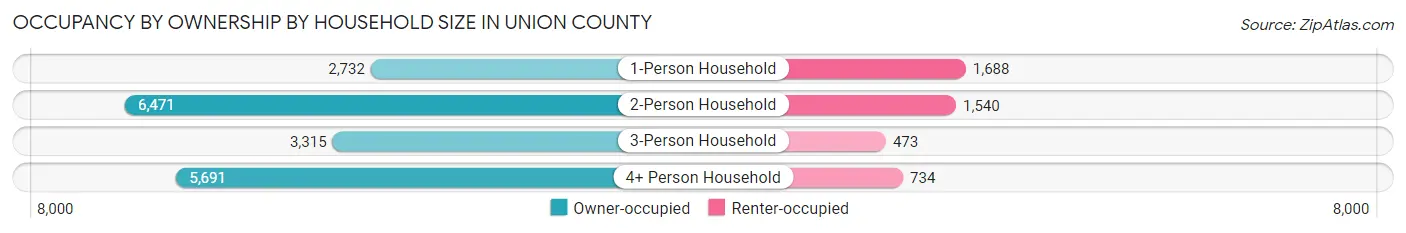
| Household Size | Owner-occupied | Renter-occupied |
| 1-Person Household | 2,732 (61.8%) | 1,688 (38.2%) |
| 2-Person Household | 6,471 (80.8%) | 1,540 (19.2%) |
| 3-Person Household | 3,315 (87.5%) | 473 (12.5%) |
| 4+ Person Household | 5,691 (88.6%) | 734 (11.4%) |
| Total Housing Units | 18,209 (80.4%) | 4,435 (19.6%) |
Occupancy by Educational Attainment in Union County
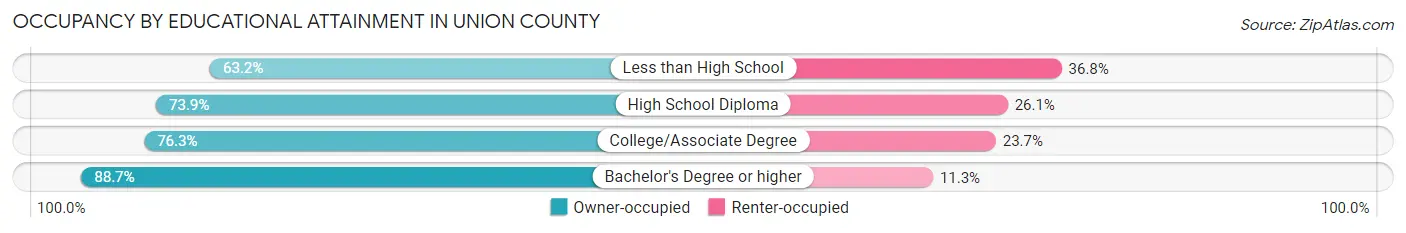
| Household Size | Owner-occupied | Renter-occupied |
| Less than High School | 564 (63.2%) | 328 (36.8%) |
| High School Diploma | 4,765 (73.9%) | 1,681 (26.1%) |
| College/Associate Degree | 4,303 (76.3%) | 1,338 (23.7%) |
| Bachelor's Degree or higher | 8,577 (88.7%) | 1,088 (11.3%) |
Occupancy by Age of Householder in Union County
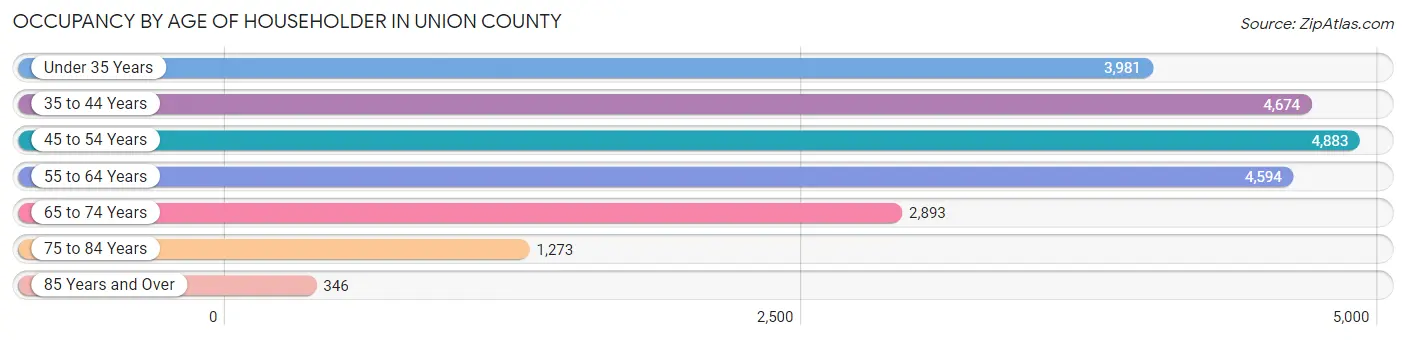
| Age Bracket | # Households | % Households |
| Under 35 Years | 3,981 | 17.6% |
| 35 to 44 Years | 4,674 | 20.6% |
| 45 to 54 Years | 4,883 | 21.6% |
| 55 to 64 Years | 4,594 | 20.3% |
| 65 to 74 Years | 2,893 | 12.8% |
| 75 to 84 Years | 1,273 | 5.6% |
| 85 Years and Over | 346 | 1.5% |
| Total | 22,644 | 100.0% |
Housing Finances in Union County
Median Income by Occupancy in Union County
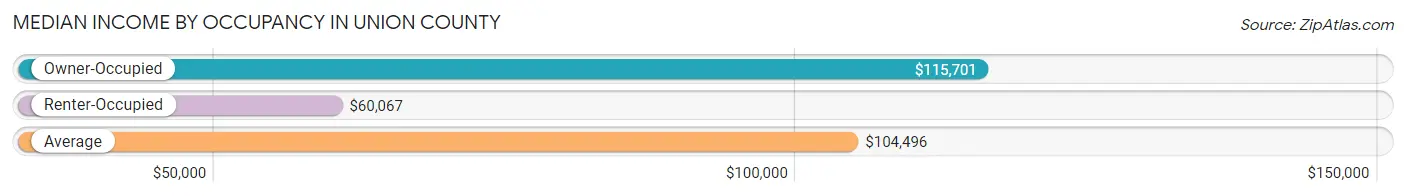
| Occupancy Type | # Households | Median Income |
| Owner-Occupied | 18,209 (80.4%) | $115,701 |
| Renter-Occupied | 4,435 (19.6%) | $60,067 |
| Average | 22,644 (100.0%) | $104,496 |
Occupancy by Householder Income Bracket in Union County
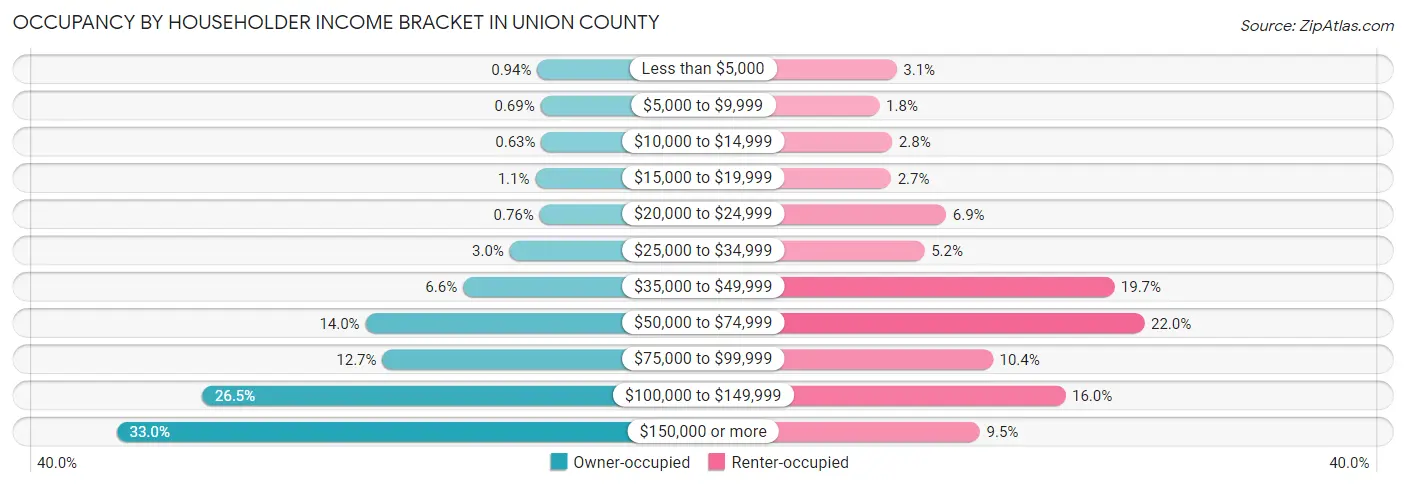
| Income Bracket | Owner-occupied | Renter-occupied |
| Less than $5,000 | 172 (0.9%) | 138 (3.1%) |
| $5,000 to $9,999 | 126 (0.7%) | 80 (1.8%) |
| $10,000 to $14,999 | 114 (0.6%) | 123 (2.8%) |
| $15,000 to $19,999 | 199 (1.1%) | 119 (2.7%) |
| $20,000 to $24,999 | 138 (0.8%) | 305 (6.9%) |
| $25,000 to $34,999 | 553 (3.0%) | 232 (5.2%) |
| $35,000 to $49,999 | 1,201 (6.6%) | 873 (19.7%) |
| $50,000 to $74,999 | 2,555 (14.0%) | 975 (22.0%) |
| $75,000 to $99,999 | 2,319 (12.7%) | 463 (10.4%) |
| $100,000 to $149,999 | 4,824 (26.5%) | 708 (16.0%) |
| $150,000 or more | 6,008 (33.0%) | 419 (9.5%) |
| Total | 18,209 (100.0%) | 4,435 (100.0%) |
Monthly Housing Cost Tiers in Union County
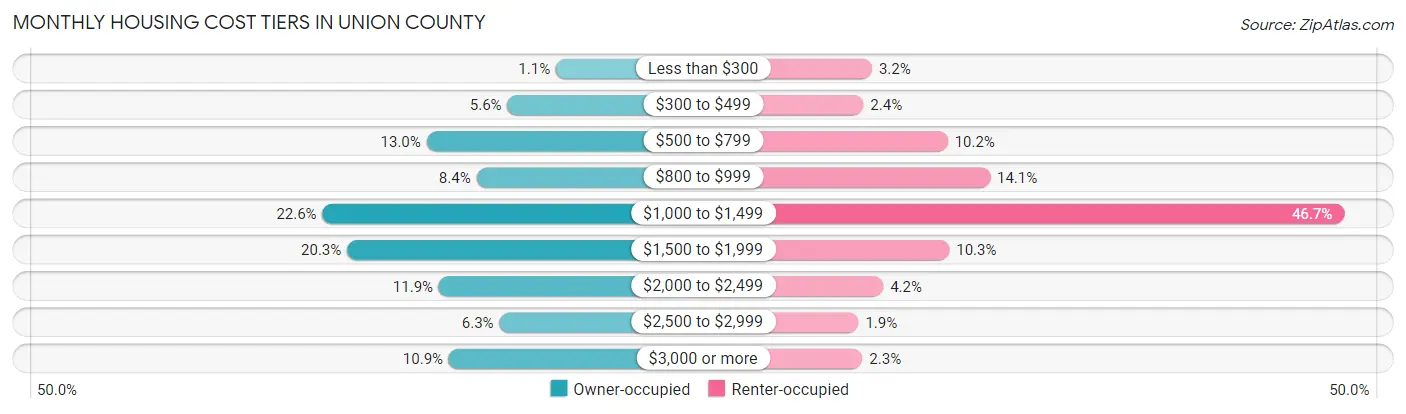
| Monthly Cost | Owner-occupied | Renter-occupied |
| Less than $300 | 196 (1.1%) | 141 (3.2%) |
| $300 to $499 | 1,011 (5.6%) | 106 (2.4%) |
| $500 to $799 | 2,366 (13.0%) | 450 (10.2%) |
| $800 to $999 | 1,529 (8.4%) | 623 (14.1%) |
| $1,000 to $1,499 | 4,112 (22.6%) | 2,069 (46.7%) |
| $1,500 to $1,999 | 3,699 (20.3%) | 457 (10.3%) |
| $2,000 to $2,499 | 2,159 (11.9%) | 187 (4.2%) |
| $2,500 to $2,999 | 1,145 (6.3%) | 86 (1.9%) |
| $3,000 or more | 1,992 (10.9%) | 102 (2.3%) |
| Total | 18,209 (100.0%) | 4,435 (100.0%) |
Physical Housing Characteristics in Union County
Housing Structures in Union County
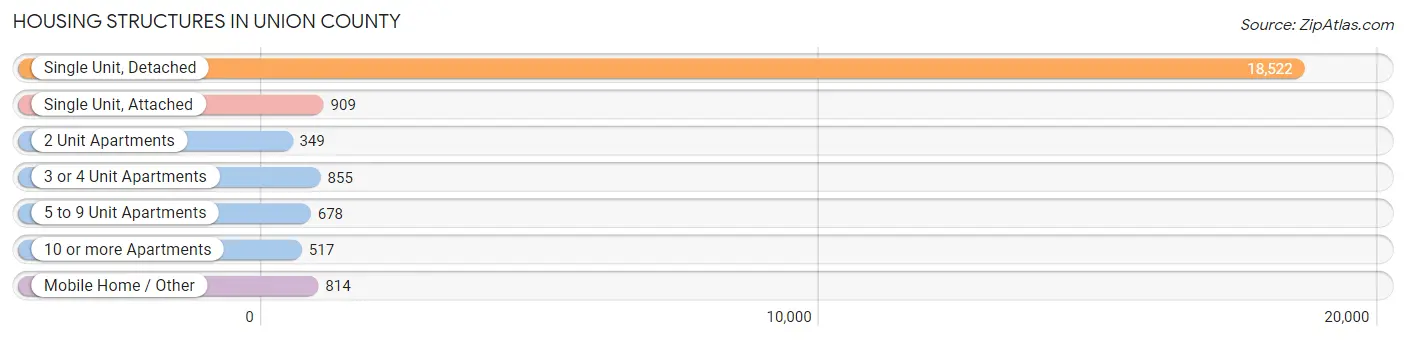
| Structure Type | # Housing Units | % Housing Units |
| Single Unit, Detached | 18,522 | 81.8% |
| Single Unit, Attached | 909 | 4.0% |
| 2 Unit Apartments | 349 | 1.5% |
| 3 or 4 Unit Apartments | 855 | 3.8% |
| 5 to 9 Unit Apartments | 678 | 3.0% |
| 10 or more Apartments | 517 | 2.3% |
| Mobile Home / Other | 814 | 3.6% |
| Total | 22,644 | 100.0% |
Housing Structures by Occupancy in Union County
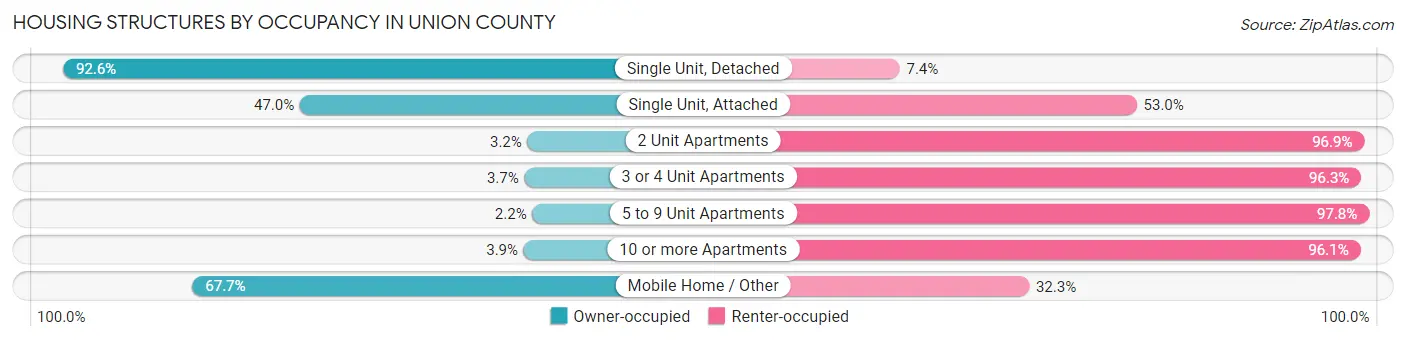
| Structure Type | Owner-occupied | Renter-occupied |
| Single Unit, Detached | 17,153 (92.6%) | 1,369 (7.4%) |
| Single Unit, Attached | 427 (47.0%) | 482 (53.0%) |
| 2 Unit Apartments | 11 (3.2%) | 338 (96.9%) |
| 3 or 4 Unit Apartments | 32 (3.7%) | 823 (96.3%) |
| 5 to 9 Unit Apartments | 15 (2.2%) | 663 (97.8%) |
| 10 or more Apartments | 20 (3.9%) | 497 (96.1%) |
| Mobile Home / Other | 551 (67.7%) | 263 (32.3%) |
| Total | 18,209 (80.4%) | 4,435 (19.6%) |
Housing Structures by Number of Rooms in Union County
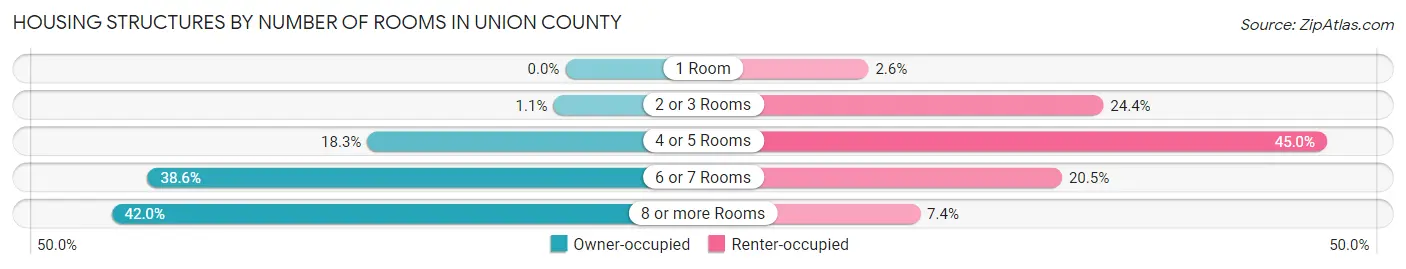
| Number of Rooms | Owner-occupied | Renter-occupied |
| 1 Room | 0 (0.0%) | 117 (2.6%) |
| 2 or 3 Rooms | 203 (1.1%) | 1,081 (24.4%) |
| 4 or 5 Rooms | 3,336 (18.3%) | 1,997 (45.0%) |
| 6 or 7 Rooms | 7,032 (38.6%) | 911 (20.5%) |
| 8 or more Rooms | 7,638 (41.9%) | 329 (7.4%) |
| Total | 18,209 (100.0%) | 4,435 (100.0%) |
Housing Structure by Heating Type in Union County
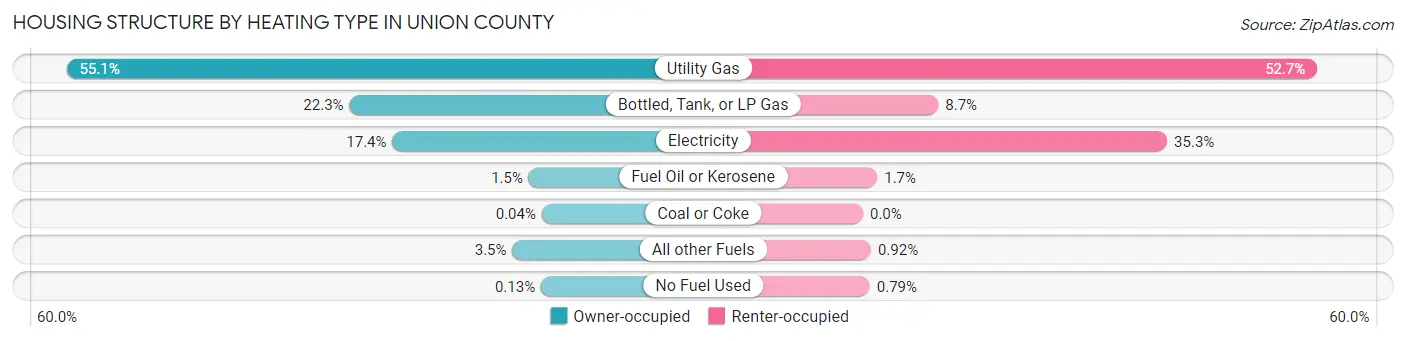
| Heating Type | Owner-occupied | Renter-occupied |
| Utility Gas | 10,041 (55.1%) | 2,335 (52.6%) |
| Bottled, Tank, or LP Gas | 4,067 (22.3%) | 387 (8.7%) |
| Electricity | 3,161 (17.4%) | 1,564 (35.3%) |
| Fuel Oil or Kerosene | 280 (1.5%) | 73 (1.7%) |
| Coal or Coke | 8 (0.0%) | 0 (0.0%) |
| All other Fuels | 628 (3.5%) | 41 (0.9%) |
| No Fuel Used | 24 (0.1%) | 35 (0.8%) |
| Total | 18,209 (100.0%) | 4,435 (100.0%) |
Household Vehicle Usage in Union County
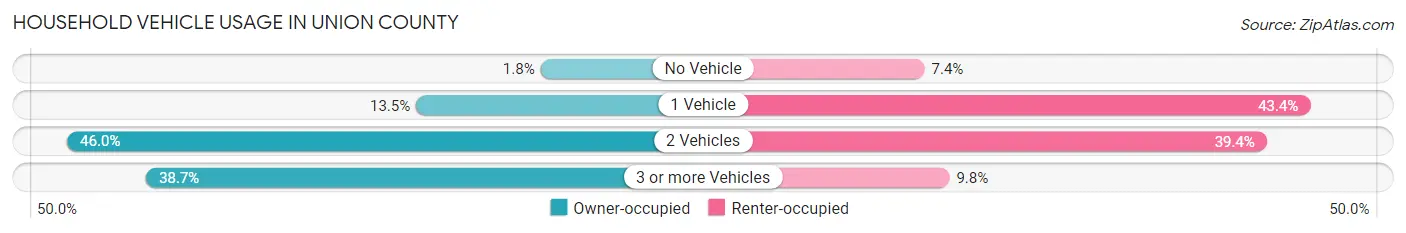
| Vehicles per Household | Owner-occupied | Renter-occupied |
| No Vehicle | 335 (1.8%) | 330 (7.4%) |
| 1 Vehicle | 2,451 (13.5%) | 1,926 (43.4%) |
| 2 Vehicles | 8,381 (46.0%) | 1,746 (39.4%) |
| 3 or more Vehicles | 7,042 (38.7%) | 433 (9.8%) |
| Total | 18,209 (100.0%) | 4,435 (100.0%) |
Real Estate & Mortgages in Union County
Real Estate and Mortgage Overview in Union County
| Characteristic | Without Mortgage | With Mortgage |
| Housing Units | 5,140 | 13,069 |
| Median Property Value | $256,900 | $294,000 |
| Median Household Income | $85,802 | $4,630 |
| Monthly Housing Costs | $671 | $1,984 |
| Real Estate Taxes | $3,328 | $122 |
Property Value by Mortgage Status in Union County
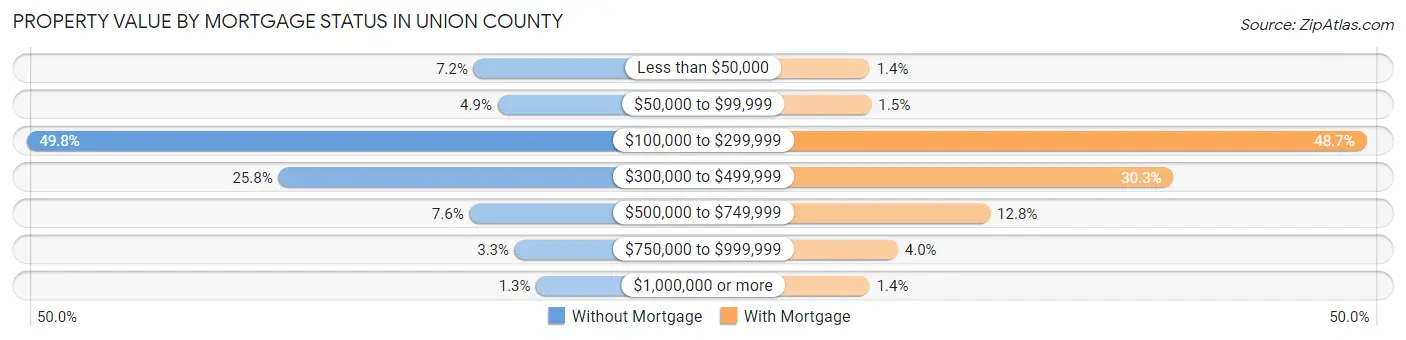
| Property Value | Without Mortgage | With Mortgage |
| Less than $50,000 | 371 (7.2%) | 176 (1.3%) |
| $50,000 to $99,999 | 254 (4.9%) | 197 (1.5%) |
| $100,000 to $299,999 | 2,561 (49.8%) | 6,360 (48.7%) |
| $300,000 to $499,999 | 1,327 (25.8%) | 3,956 (30.3%) |
| $500,000 to $749,999 | 392 (7.6%) | 1,676 (12.8%) |
| $750,000 to $999,999 | 170 (3.3%) | 527 (4.0%) |
| $1,000,000 or more | 65 (1.3%) | 177 (1.3%) |
| Total | 5,140 (100.0%) | 13,069 (100.0%) |
Household Income by Mortgage Status in Union County
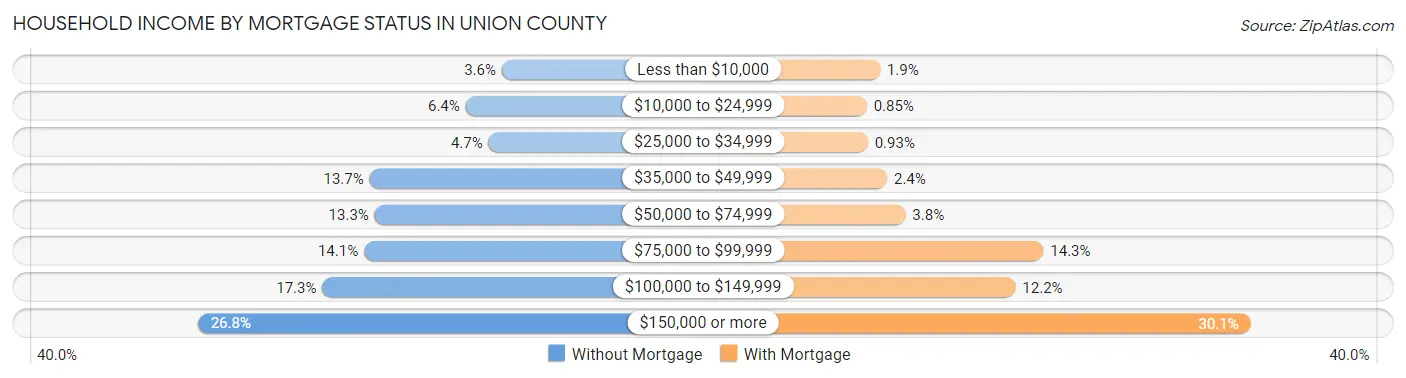
| Household Income | Without Mortgage | With Mortgage |
| Less than $10,000 | 187 (3.6%) | 243 (1.9%) |
| $10,000 to $24,999 | 329 (6.4%) | 111 (0.9%) |
| $25,000 to $34,999 | 239 (4.6%) | 122 (0.9%) |
| $35,000 to $49,999 | 705 (13.7%) | 314 (2.4%) |
| $50,000 to $74,999 | 685 (13.3%) | 496 (3.8%) |
| $75,000 to $99,999 | 727 (14.1%) | 1,870 (14.3%) |
| $100,000 to $149,999 | 890 (17.3%) | 1,592 (12.2%) |
| $150,000 or more | 1,378 (26.8%) | 3,934 (30.1%) |
| Total | 5,140 (100.0%) | 13,069 (100.0%) |
Property Value to Household Income Ratio in Union County
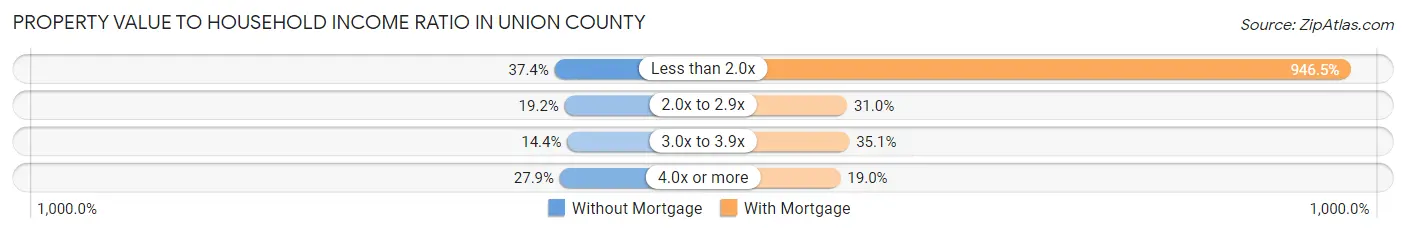
| Value-to-Income Ratio | Without Mortgage | With Mortgage |
| Less than 2.0x | 1,924 (37.4%) | 123,700 (946.5%) |
| 2.0x to 2.9x | 987 (19.2%) | 4,051 (31.0%) |
| 3.0x to 3.9x | 738 (14.4%) | 4,582 (35.1%) |
| 4.0x or more | 1,432 (27.9%) | 2,487 (19.0%) |
| Total | 5,140 (100.0%) | 13,069 (100.0%) |
Real Estate Taxes by Mortgage Status in Union County
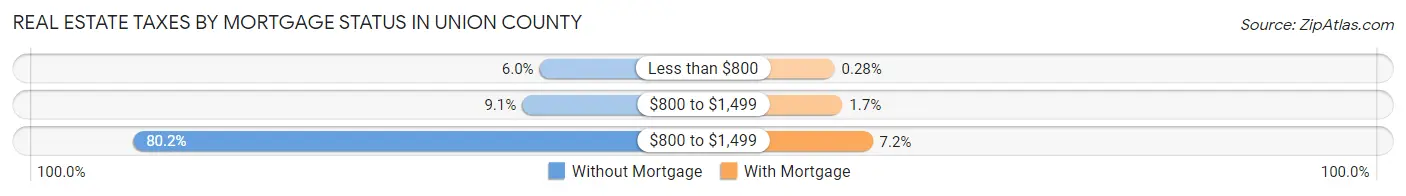
| Property Taxes | Without Mortgage | With Mortgage |
| Less than $800 | 307 (6.0%) | 37 (0.3%) |
| $800 to $1,499 | 470 (9.1%) | 224 (1.7%) |
| $800 to $1,499 | 4,120 (80.2%) | 945 (7.2%) |
| Total | 5,140 (100.0%) | 13,069 (100.0%) |
Health & Disability in Union County
Health Insurance Coverage by Age in Union County
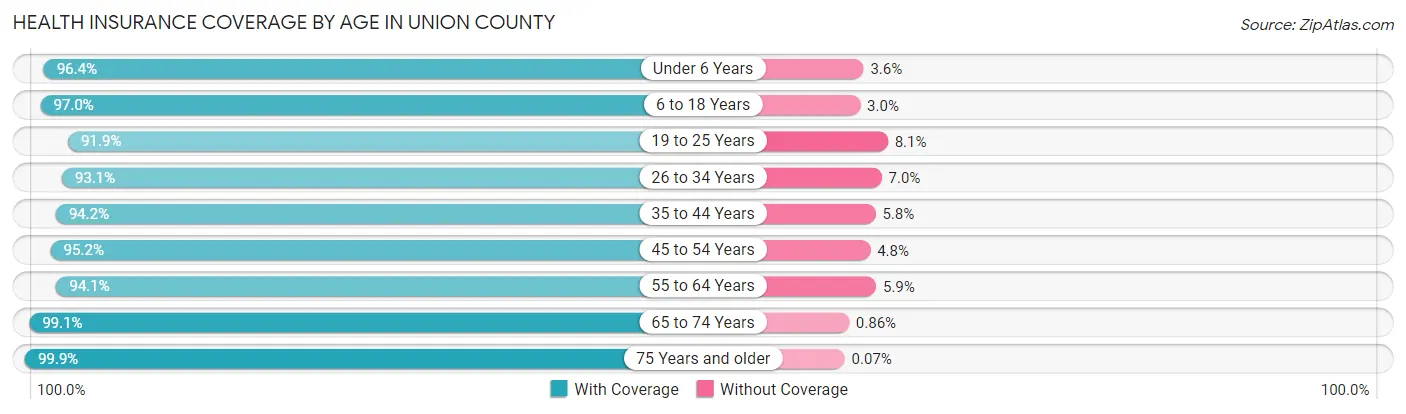
| Age Bracket | With Coverage | Without Coverage |
| Under 6 Years | 4,361 (96.4%) | 162 (3.6%) |
| 6 to 18 Years | 11,422 (97.0%) | 348 (3.0%) |
| 19 to 25 Years | 4,347 (91.9%) | 383 (8.1%) |
| 26 to 34 Years | 5,974 (93.0%) | 446 (7.0%) |
| 35 to 44 Years | 8,557 (94.2%) | 528 (5.8%) |
| 45 to 54 Years | 8,042 (95.2%) | 408 (4.8%) |
| 55 to 64 Years | 7,376 (94.1%) | 464 (5.9%) |
| 65 to 74 Years | 4,954 (99.1%) | 43 (0.9%) |
| 75 Years and older | 2,900 (99.9%) | 2 (0.1%) |
| Total | 57,933 (95.4%) | 2,784 (4.6%) |
Health Insurance Coverage by Citizenship Status in Union County
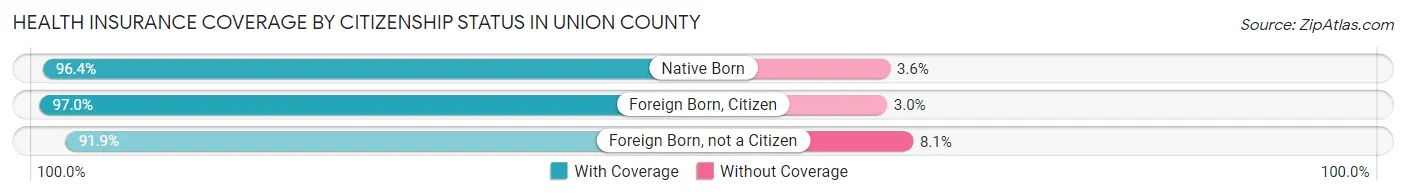
| Citizenship Status | With Coverage | Without Coverage |
| Native Born | 4,361 (96.4%) | 162 (3.6%) |
| Foreign Born, Citizen | 11,422 (97.0%) | 348 (3.0%) |
| Foreign Born, not a Citizen | 4,347 (91.9%) | 383 (8.1%) |
Health Insurance Coverage by Household Income in Union County
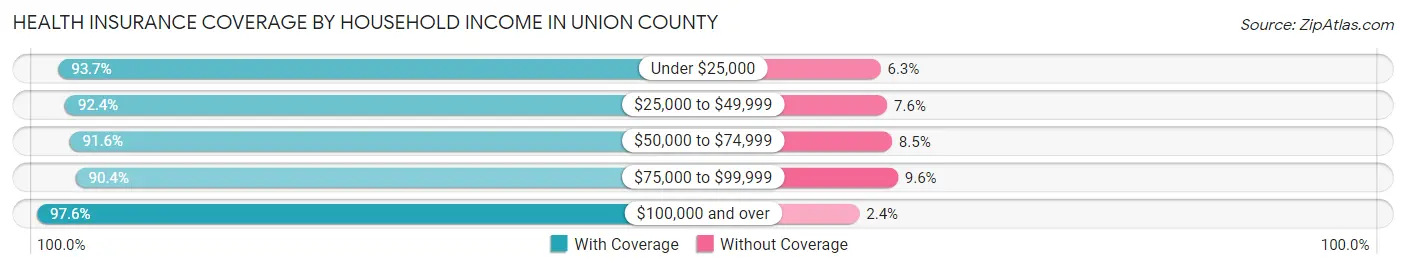
| Household Income | With Coverage | Without Coverage |
| Under $25,000 | 2,343 (93.7%) | 158 (6.3%) |
| $25,000 to $49,999 | 5,108 (92.4%) | 418 (7.6%) |
| $50,000 to $74,999 | 7,153 (91.5%) | 660 (8.5%) |
| $75,000 to $99,999 | 6,167 (90.4%) | 652 (9.6%) |
| $100,000 and over | 37,142 (97.6%) | 896 (2.4%) |
Public vs Private Health Insurance Coverage by Age in Union County
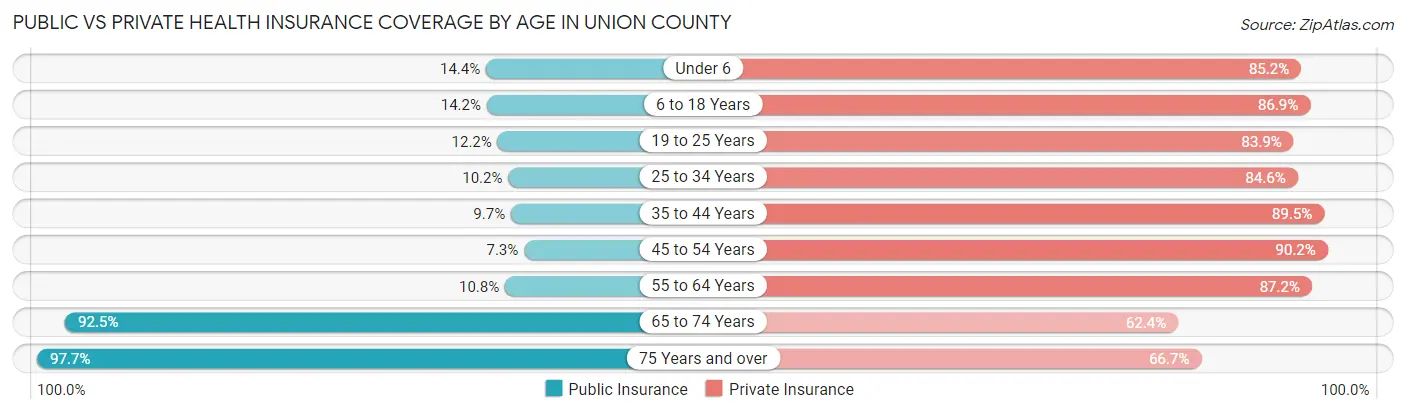
| Age Bracket | Public Insurance | Private Insurance |
| Under 6 | 649 (14.3%) | 3,855 (85.2%) |
| 6 to 18 Years | 1,672 (14.2%) | 10,230 (86.9%) |
| 19 to 25 Years | 577 (12.2%) | 3,967 (83.9%) |
| 25 to 34 Years | 656 (10.2%) | 5,432 (84.6%) |
| 35 to 44 Years | 883 (9.7%) | 8,134 (89.5%) |
| 45 to 54 Years | 615 (7.3%) | 7,619 (90.2%) |
| 55 to 64 Years | 848 (10.8%) | 6,838 (87.2%) |
| 65 to 74 Years | 4,621 (92.5%) | 3,119 (62.4%) |
| 75 Years and over | 2,835 (97.7%) | 1,936 (66.7%) |
| Total | 13,356 (22.0%) | 51,130 (84.2%) |
Disability Status by Sex by Age in Union County
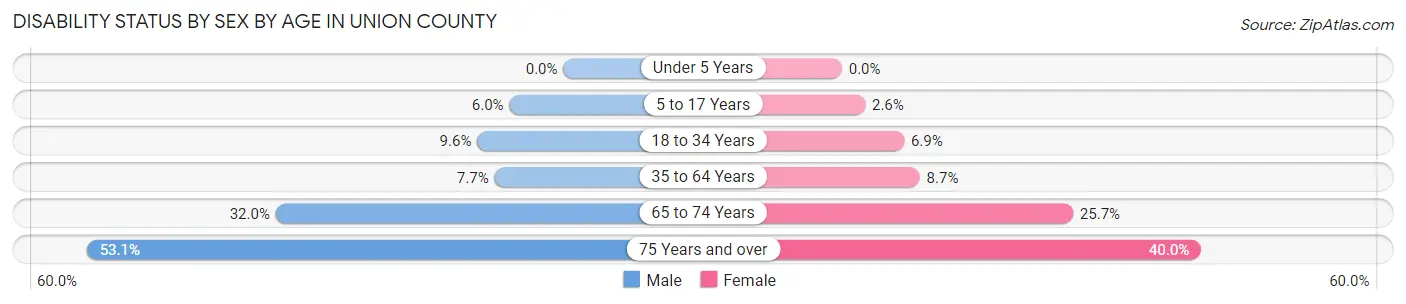
| Age Bracket | Male | Female |
| Under 5 Years | 0 (0.0%) | 0 (0.0%) |
| 5 to 17 Years | 352 (6.0%) | 145 (2.6%) |
| 18 to 34 Years | 585 (9.6%) | 417 (6.9%) |
| 35 to 64 Years | 997 (7.7%) | 1,072 (8.7%) |
| 65 to 74 Years | 784 (32.0%) | 656 (25.7%) |
| 75 Years and over | 681 (53.1%) | 648 (40.0%) |
Disability Class by Sex by Age in Union County
Disability Class: Hearing Difficulty
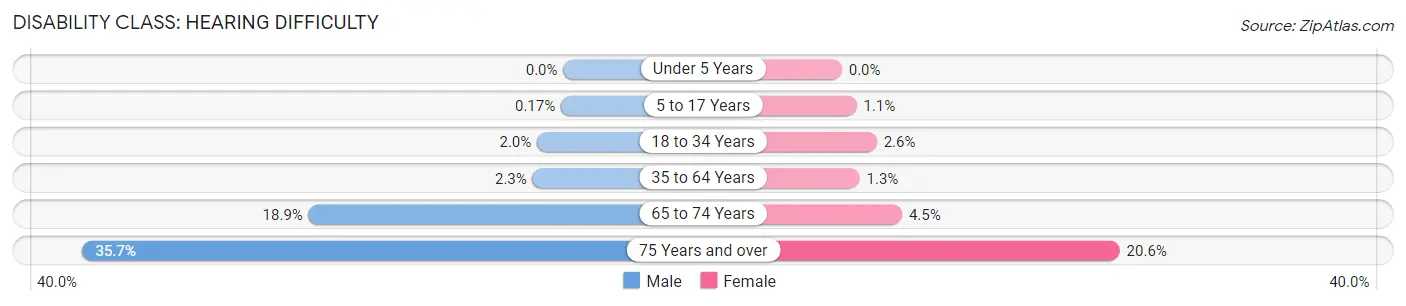
| Age Bracket | Male | Female |
| Under 5 Years | 0 (0.0%) | 0 (0.0%) |
| 5 to 17 Years | 10 (0.2%) | 61 (1.1%) |
| 18 to 34 Years | 119 (1.9%) | 156 (2.6%) |
| 35 to 64 Years | 296 (2.3%) | 163 (1.3%) |
| 65 to 74 Years | 463 (18.9%) | 114 (4.5%) |
| 75 Years and over | 458 (35.7%) | 334 (20.6%) |
Disability Class: Vision Difficulty
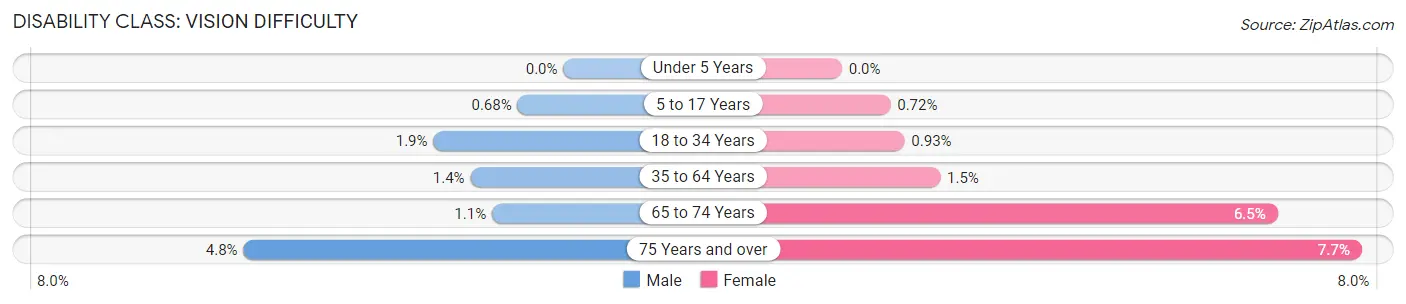
| Age Bracket | Male | Female |
| Under 5 Years | 0 (0.0%) | 0 (0.0%) |
| 5 to 17 Years | 40 (0.7%) | 40 (0.7%) |
| 18 to 34 Years | 118 (1.9%) | 56 (0.9%) |
| 35 to 64 Years | 179 (1.4%) | 180 (1.5%) |
| 65 to 74 Years | 26 (1.1%) | 165 (6.5%) |
| 75 Years and over | 61 (4.8%) | 125 (7.7%) |
Disability Class: Cognitive Difficulty
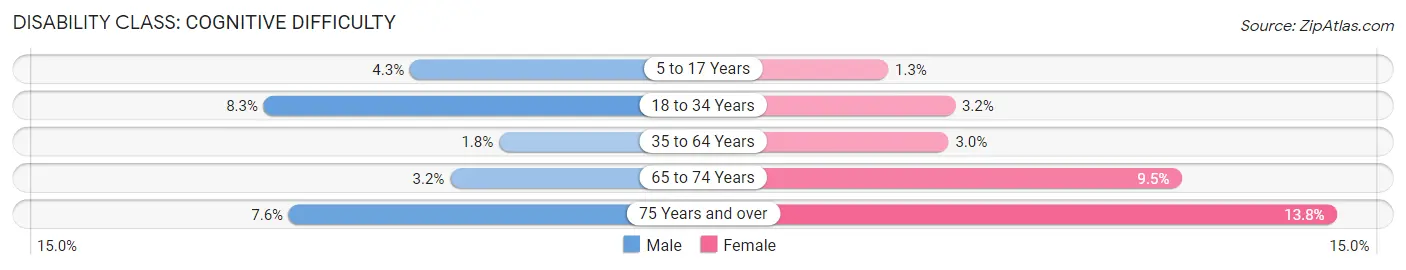
| Age Bracket | Male | Female |
| 5 to 17 Years | 250 (4.3%) | 72 (1.3%) |
| 18 to 34 Years | 509 (8.3%) | 190 (3.2%) |
| 35 to 64 Years | 233 (1.8%) | 367 (3.0%) |
| 65 to 74 Years | 77 (3.2%) | 241 (9.5%) |
| 75 Years and over | 98 (7.6%) | 223 (13.8%) |
Disability Class: Ambulatory Difficulty
| Age Bracket | Male | Female |
| 5 to 17 Years | 17 (0.3%) | 0 (0.0%) |
| 18 to 34 Years | 66 (1.1%) | 175 (2.9%) |
| 35 to 64 Years | 511 (3.9%) | 549 (4.4%) |
| 65 to 74 Years | 304 (12.4%) | 473 (18.6%) |
| 75 Years and over | 372 (29.0%) | 410 (25.3%) |
Disability Class: Self-Care Difficulty
| Age Bracket | Male | Female |
| 5 to 17 Years | 71 (1.2%) | 12 (0.2%) |
| 18 to 34 Years | 86 (1.4%) | 110 (1.8%) |
| 35 to 64 Years | 171 (1.3%) | 89 (0.7%) |
| 65 to 74 Years | 147 (6.0%) | 69 (2.7%) |
| 75 Years and over | 88 (6.9%) | 114 (7.0%) |
Technology Access in Union County
Computing Device Access in Union County
| Device Type | # Households | % Households |
| Desktop or Laptop | 19,559 | 86.4% |
| Smartphone | 20,982 | 92.7% |
| Tablet | 16,638 | 73.5% |
| No Computing Device | 801 | 3.5% |
| Total | 22,644 | 100.0% |
Internet Access in Union County
| Internet Type | # Households | % Households |
| Dial-Up Internet | 20 | 0.1% |
| Broadband Home | 17,650 | 77.9% |
| Cellular Data Only | 2,209 | 9.8% |
| Satellite Internet | 1,567 | 6.9% |
| No Internet | 1,478 | 6.5% |
| Total | 22,644 | 100.0% |
Union County Summary
Introduction
Union County is located in the central part of the state of Ohio, and is part of the Columbus metropolitan area. It is bordered by Delaware, Franklin, Madison, and Logan counties. The county seat is Marysville, and the county was established in 1820. The county has a population of approximately 53,000 people, and is home to several small towns and villages.
Geography
Union County is located in the central part of Ohio, and is bordered by Delaware, Franklin, Madison, and Logan counties. The county is situated in the Appalachian Plateau region of the state, and is characterized by rolling hills and valleys. The county is drained by the Scioto River, which flows through the county from north to south. The county is also home to several small lakes and ponds, as well as several state parks and wildlife areas.
The county has a total area of 437 square miles, of which 434 square miles is land and 3 square miles is water. The county is home to several small towns and villages, including Marysville, the county seat, and Richwood, the largest town in the county.
Economy
Union County has a diverse economy, with a variety of industries providing employment opportunities. The county is home to several large employers, including Honda of America Manufacturing, Inc., which has a manufacturing plant in Marysville, and Union County Hospital, which is located in Marysville. Other major employers in the county include Union County Public Schools, Union County Board of Developmental Disabilities, and Union County Sheriff's Office.
The county is also home to several small businesses, including retail stores, restaurants, and other service-oriented businesses. Agriculture is also an important part of the county's economy, with corn, soybeans, and wheat being the primary crops grown in the county.
Demographics
As of the 2010 census, the population of Union County was 53,297, with a population density of 121 people per square mile. The racial makeup of the county was 94.3% White, 2.3% African American, 0.3% Native American, 0.7% Asian, 0.1% Pacific Islander, 0.7% from other races, and 1.6% from two or more races. Hispanic or Latino of any race were 2.2% of the population.
The median income for a household in the county was $50,945, and the median income for a family was $60,945. The per capita income for the county was $24,945. About 8.3% of families and 10.7% of the population were below the poverty line, including 14.2% of those under age 18 and 6.2% of those age 65 or over.
Conclusion
Union County is a diverse county located in the central part of Ohio. It is home to several small towns and villages, and is bordered by Delaware, Franklin, Madison, and Logan counties. The county has a population of approximately 53,000 people, and is home to several large employers, including Honda of America Manufacturing, Inc., and Union County Hospital. The county also has a diverse economy, with a variety of industries providing employment opportunities. The county has a median income of $50,945, and the per capita income is $24,945.
Common Questions
What is Per Capita Income in Union County?
Per Capita income in Union County is $48,025.
What is the Median Family Income in Union County?
Median Family Income in Union County is $120,130.
What is the Median Household income in Union County?
Median Household Income in Union County is $104,496.
What is Income or Wage Gap in Union County?
Income or Wage Gap in Union County is 35.0%.
Women in Union County earn 65.0 cents for every dollar earned by a man.
What is Family Income Deficit in Union County?
Family Income Deficit in Union County is $9,378.
Families that are below poverty line in Union County earn $9,378 less on average than the poverty threshold level.
What is Inequality or Gini Index in Union County?
Inequality or Gini Index in Union County is 0.41.
What is the Total Population of Union County?
Total Population of Union County is 63,411.
What is the Total Male Population of Union County?
Total Male Population of Union County is 30,672.
What is the Total Female Population of Union County?
Total Female Population of Union County is 32,739.
What is the Ratio of Males per 100 Females in Union County?
There are 93.69 Males per 100 Females in Union County.
What is the Ratio of Females per 100 Males in Union County?
There are 106.74 Females per 100 Males in Union County.
What is the Median Population Age in Union County?
Median Population Age in Union County is 38.4 Years.
What is the Average Family Size in Union County
Average Family Size in Union County is 3.1 People.
What is the Average Household Size in Union County
Average Household Size in Union County is 2.7 People.
How Large is the Labor Force in Union County?
There are 33,774 People in the Labor Forcein in Union County.
What is the Percentage of People in the Labor Force in Union County?
67.8% of People are in the Labor Force in Union County.
What is the Unemployment Rate in Union County?
Unemployment Rate in Union County is 2.9%.