Ross County, OH Map & Demographics
Ross County Map
Ross County Overview
$29,718
PER CAPITA INCOME
$76,899
AVG FAMILY INCOME
$58,048
AVG HOUSEHOLD INCOME
32.7%
WAGE / INCOME GAP [ % ]
67.3¢/ $1
WAGE / INCOME GAP [ $ ]
$11,474
FAMILY INCOME DEFICIT
0.45
INEQUALITY / GINI INDEX
76,957
TOTAL POPULATION
40,257
MALE POPULATION
36,700
FEMALE POPULATION
109.69
MALES / 100 FEMALES
91.16
FEMALES / 100 MALES
41.3
MEDIAN AGE
3.0
AVG FAMILY SIZE
2.4
AVG HOUSEHOLD SIZE
33,745
LABOR FORCE [ PEOPLE ]
53.8%
PERCENT IN LABOR FORCE
5.7%
UNEMPLOYMENT RATE
Income in Ross County
Income Overview in Ross County
Per Capita Income in Ross County is $29,718, while median incomes of families and households are $76,899 and $58,048 respectively.
| Characteristic | Number | Measure |
| Per Capita Income | 76,957 | $29,718 |
| Median Family Income | 18,826 | $76,899 |
| Mean Family Income | 18,826 | $90,631 |
| Median Household Income | 29,565 | $58,048 |
| Mean Household Income | 29,565 | $75,219 |
| Income Deficit | 18,826 | $11,474 |
| Wage / Income Gap (%) | 76,957 | 32.75% |
| Wage / Income Gap ($) | 76,957 | 67.25¢ per $1 |
| Gini / Inequality Index | 76,957 | 0.45 |
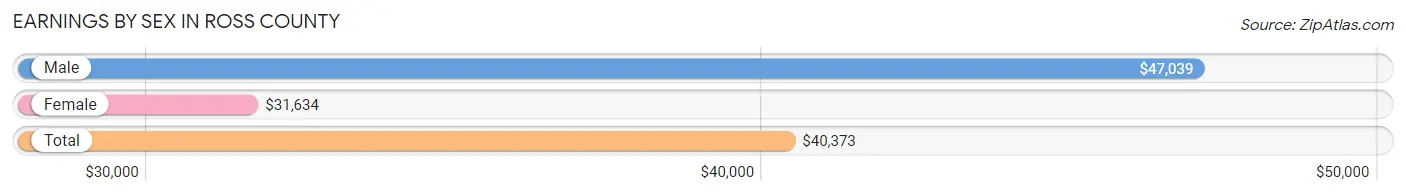
Earnings by Sex in Ross County
Average Earnings in Ross County are $40,373, $47,039 for men and $31,634 for women, a difference of 32.8%.
| Sex | Number | Average Earnings |
| Male | 18,491 (52.7%) | $47,039 |
| Female | 16,622 (47.3%) | $31,634 |
| Total | 35,113 (100.0%) | $40,373 |
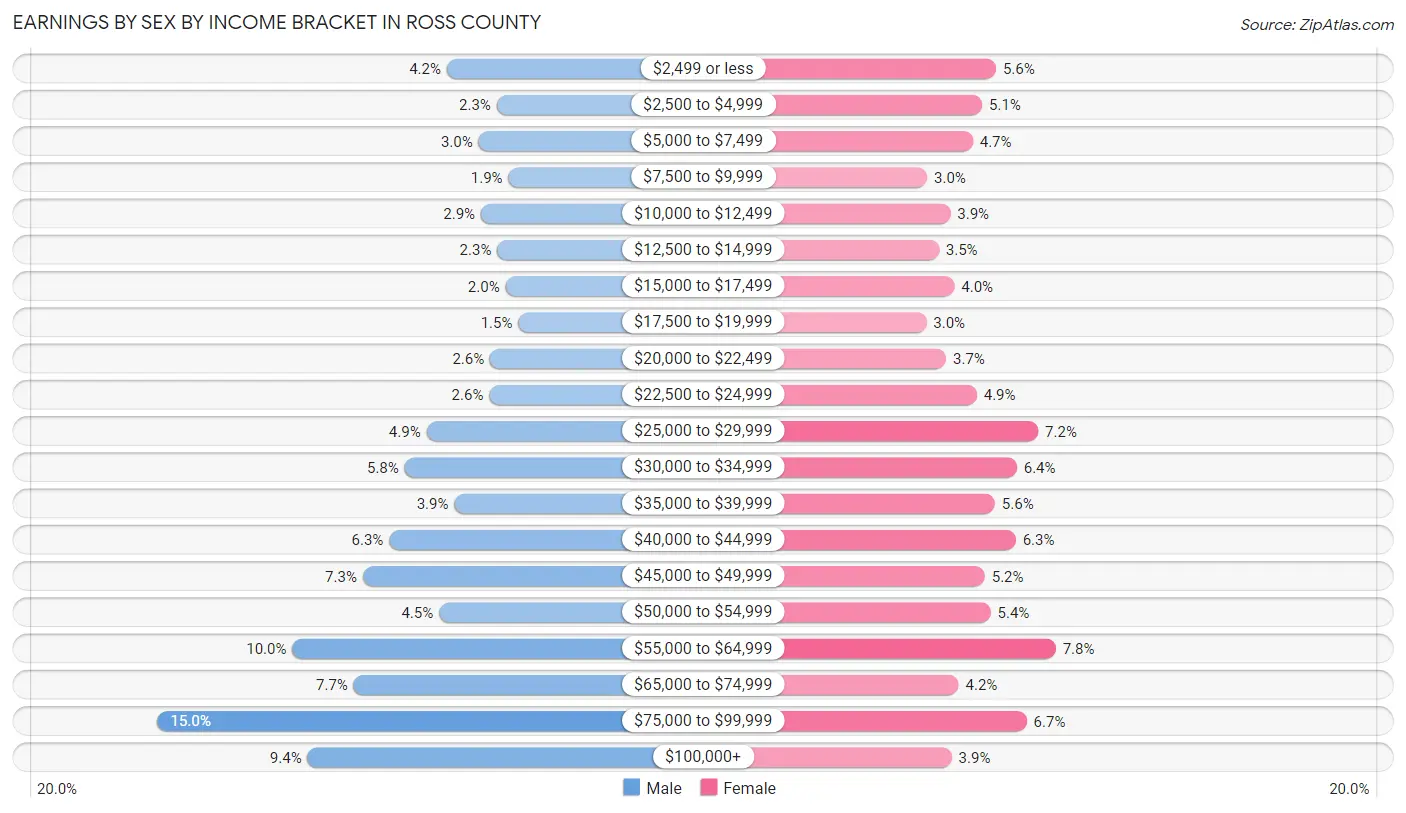
Earnings by Sex by Income Bracket in Ross County
The most common earnings brackets in Ross County are $75,000 to $99,999 for men (2,777 | 15.0%) and $55,000 to $64,999 for women (1,302 | 7.8%).
| Income | Male | Female |
| $2,499 or less | 773 (4.2%) | 930 (5.6%) |
| $2,500 to $4,999 | 428 (2.3%) | 843 (5.1%) |
| $5,000 to $7,499 | 553 (3.0%) | 785 (4.7%) |
| $7,500 to $9,999 | 345 (1.9%) | 500 (3.0%) |
| $10,000 to $12,499 | 537 (2.9%) | 645 (3.9%) |
| $12,500 to $14,999 | 424 (2.3%) | 574 (3.5%) |
| $15,000 to $17,499 | 367 (2.0%) | 670 (4.0%) |
| $17,500 to $19,999 | 278 (1.5%) | 495 (3.0%) |
| $20,000 to $22,499 | 474 (2.6%) | 619 (3.7%) |
| $22,500 to $24,999 | 479 (2.6%) | 809 (4.9%) |
| $25,000 to $29,999 | 913 (4.9%) | 1,192 (7.2%) |
| $30,000 to $34,999 | 1,065 (5.8%) | 1,059 (6.4%) |
| $35,000 to $39,999 | 722 (3.9%) | 922 (5.6%) |
| $40,000 to $44,999 | 1,173 (6.3%) | 1,053 (6.3%) |
| $45,000 to $49,999 | 1,355 (7.3%) | 859 (5.2%) |
| $50,000 to $54,999 | 826 (4.5%) | 896 (5.4%) |
| $55,000 to $64,999 | 1,844 (10.0%) | 1,302 (7.8%) |
| $65,000 to $74,999 | 1,419 (7.7%) | 696 (4.2%) |
| $75,000 to $99,999 | 2,777 (15.0%) | 1,120 (6.7%) |
| $100,000+ | 1,739 (9.4%) | 653 (3.9%) |
| Total | 18,491 (100.0%) | 16,622 (100.0%) |
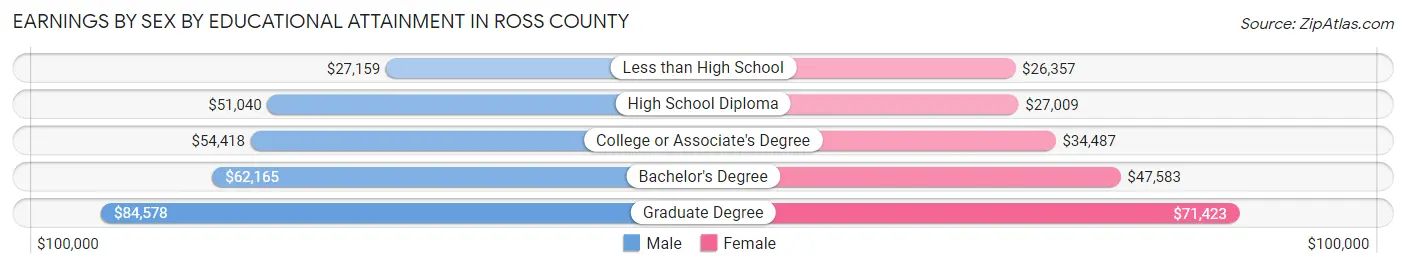
Earnings by Sex by Educational Attainment in Ross County
Average earnings in Ross County are $52,964 for men and $35,883 for women, a difference of 32.3%. Men with an educational attainment of graduate degree enjoy the highest average annual earnings of $84,578, while those with less than high school education earn the least with $27,159. Women with an educational attainment of graduate degree earn the most with the average annual earnings of $71,423, while those with less than high school education have the smallest earnings of $26,357.
| Educational Attainment | Male Income | Female Income |
| Less than High School | $27,159 | $26,357 |
| High School Diploma | $51,040 | $27,009 |
| College or Associate's Degree | $54,418 | $34,487 |
| Bachelor's Degree | $62,165 | $47,583 |
| Graduate Degree | $84,578 | $71,423 |
| Total | $52,964 | $35,883 |
Family Income in Ross County
Family Income Brackets in Ross County
According to the Ross County family income data, there are 4,386 families falling into the $100,000 to $149,999 income range, which is the most common income bracket and makes up 23.3% of all families. Conversely, the $10,000 to $14,999 income bracket is the least frequent group with only 471 families (2.5%) belonging to this category.
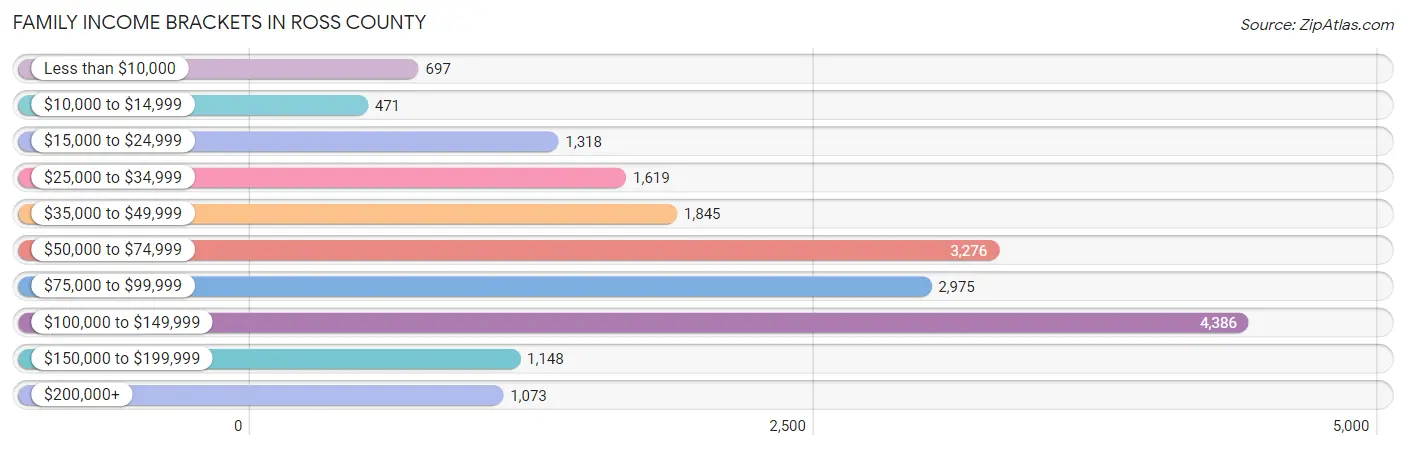
| Income Bracket | # Families | % Families |
| Less than $10,000 | 697 | 3.7% |
| $10,000 to $14,999 | 471 | 2.5% |
| $15,000 to $24,999 | 1,318 | 7.0% |
| $25,000 to $34,999 | 1,619 | 8.6% |
| $35,000 to $49,999 | 1,845 | 9.8% |
| $50,000 to $74,999 | 3,276 | 17.4% |
| $75,000 to $99,999 | 2,975 | 15.8% |
| $100,000 to $149,999 | 4,386 | 23.3% |
| $150,000 to $199,999 | 1,148 | 6.1% |
| $200,000+ | 1,073 | 5.7% |
Family Income by Famaliy Size in Ross County
5-person families (1,333 | 7.1%) account for the highest median family income in Ross County with $102,817 per family, while 2-person families (9,723 | 51.6%) have the highest median income of $33,728 per family member.
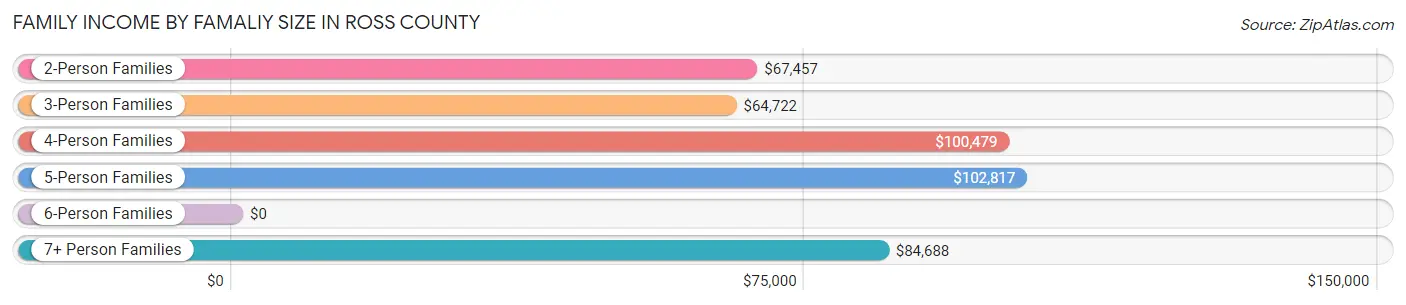
| Income Bracket | # Families | Median Income |
| 2-Person Families | 9,723 (51.6%) | $67,457 |
| 3-Person Families | 3,796 (20.2%) | $64,722 |
| 4-Person Families | 3,345 (17.8%) | $100,479 |
| 5-Person Families | 1,333 (7.1%) | $102,817 |
| 6-Person Families | 424 (2.2%) | $0 |
| 7+ Person Families | 205 (1.1%) | $84,688 |
| Total | 18,826 (100.0%) | $76,899 |
Family Income by Number of Earners in Ross County
The median family income in Ross County is $76,899, with families comprising 3+ earners (1,721) having the highest median family income of $117,750, while families with no earners (3,862) have the lowest median family income of $34,111, accounting for 9.1% and 20.5% of families, respectively.
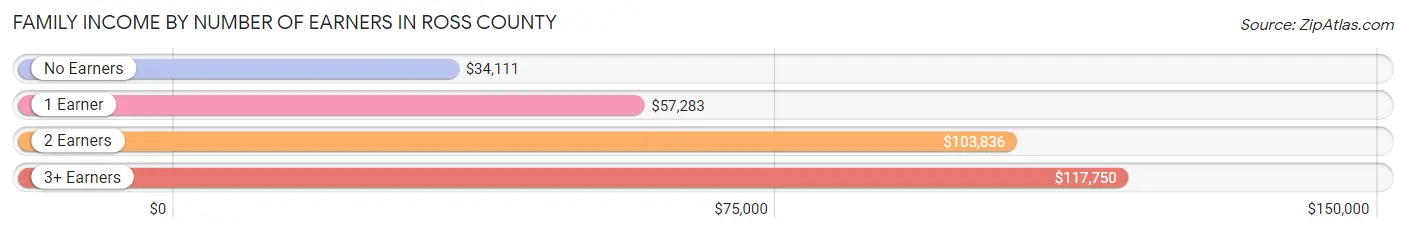
| Number of Earners | # Families | Median Income |
| No Earners | 3,862 (20.5%) | $34,111 |
| 1 Earner | 6,250 (33.2%) | $57,283 |
| 2 Earners | 6,993 (37.1%) | $103,836 |
| 3+ Earners | 1,721 (9.1%) | $117,750 |
| Total | 18,826 (100.0%) | $76,899 |
Household Income in Ross County
Household Income Brackets in Ross County
With 5,292 households falling in the category, the $100,000 to $149,999 income range is the most frequent in Ross County, accounting for 17.9% of all households. In contrast, only 1,183 households (4.0%) fall into the $200,000+ income bracket, making it the least populous group.
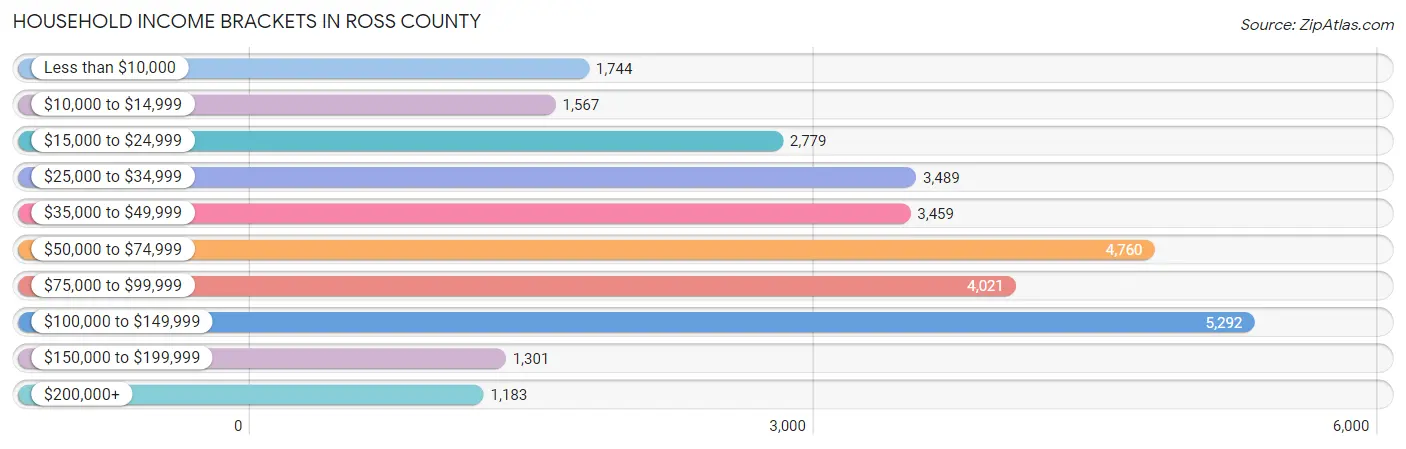
| Income Bracket | # Households | % Households |
| Less than $10,000 | 1,744 | 5.9% |
| $10,000 to $14,999 | 1,567 | 5.3% |
| $15,000 to $24,999 | 2,779 | 9.4% |
| $25,000 to $34,999 | 3,489 | 11.8% |
| $35,000 to $49,999 | 3,459 | 11.7% |
| $50,000 to $74,999 | 4,760 | 16.1% |
| $75,000 to $99,999 | 4,021 | 13.6% |
| $100,000 to $149,999 | 5,292 | 17.9% |
| $150,000 to $199,999 | 1,301 | 4.4% |
| $200,000+ | 1,183 | 4.0% |
Household Income by Householder Age in Ross County
The median household income in Ross County is $58,048, with the highest median household income of $71,715 found in the 25 to 44 years age bracket for the primary householder. A total of 8,173 households (27.6%) fall into this category. Meanwhile, the 65+ years age bracket for the primary householder has the lowest median household income of $38,558, with 8,592 households (29.1%) in this group.
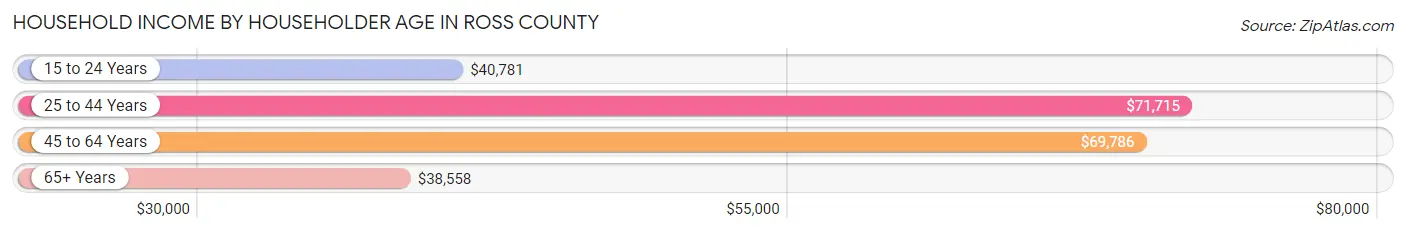
| Income Bracket | # Households | Median Income |
| 15 to 24 Years | 1,145 (3.9%) | $40,781 |
| 25 to 44 Years | 8,173 (27.6%) | $71,715 |
| 45 to 64 Years | 11,655 (39.4%) | $69,786 |
| 65+ Years | 8,592 (29.1%) | $38,558 |
| Total | 29,565 (100.0%) | $58,048 |
Poverty in Ross County
Income Below Poverty by Sex and Age in Ross County
With 13.5% poverty level for males and 18.6% for females among the residents of Ross County, 16 and 17 year old males and 5 year old females are the most vulnerable to poverty, with 320 males (29.4%) and 144 females (37.4%) in their respective age groups living below the poverty level.
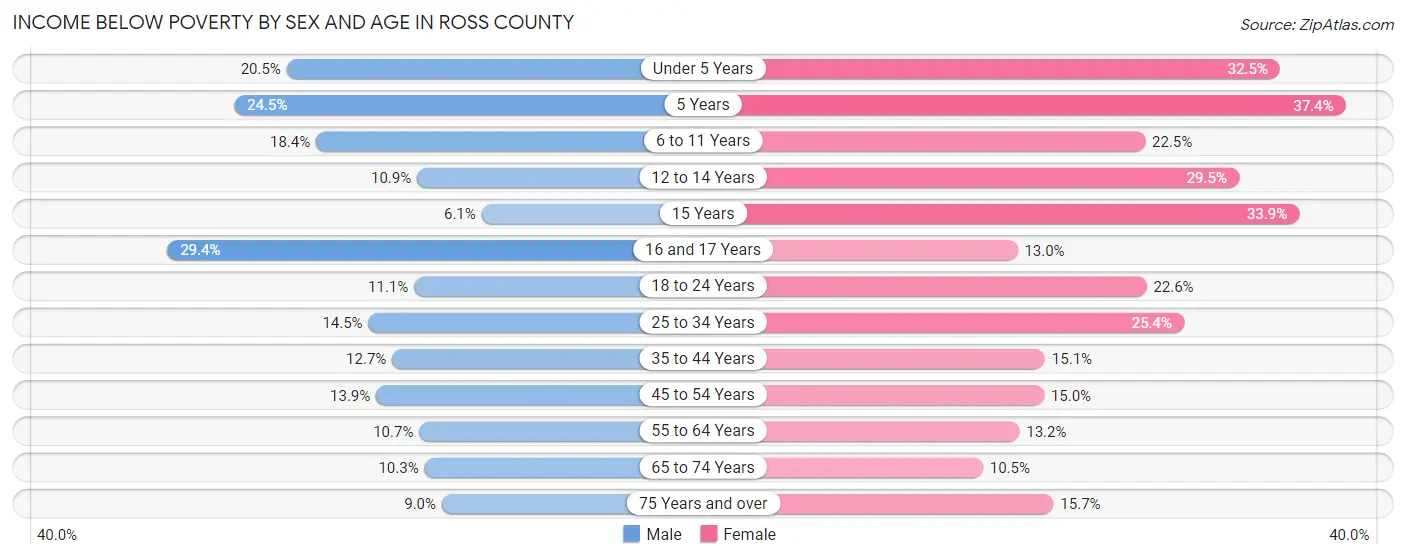
| Age Bracket | Male | Female |
| Under 5 Years | 421 (20.5%) | 683 (32.5%) |
| 5 Years | 67 (24.4%) | 144 (37.4%) |
| 6 to 11 Years | 481 (18.4%) | 520 (22.5%) |
| 12 to 14 Years | 199 (10.9%) | 480 (29.5%) |
| 15 Years | 23 (6.1%) | 168 (33.9%) |
| 16 and 17 Years | 320 (29.4%) | 118 (13.0%) |
| 18 to 24 Years | 309 (11.1%) | 636 (22.6%) |
| 25 to 34 Years | 595 (14.5%) | 1,032 (25.4%) |
| 35 to 44 Years | 576 (12.7%) | 670 (15.1%) |
| 45 to 54 Years | 716 (13.9%) | 720 (15.0%) |
| 55 to 64 Years | 534 (10.7%) | 694 (13.2%) |
| 65 to 74 Years | 364 (10.3%) | 424 (10.5%) |
| 75 Years and over | 193 (9.0%) | 461 (15.7%) |
| Total | 4,798 (13.5%) | 6,750 (18.6%) |
Income Above Poverty by Sex and Age in Ross County
According to the poverty statistics in Ross County, males aged 15 years and females aged 65 to 74 years are the age groups that are most secure financially, with 93.9% of males and 89.5% of females in these age groups living above the poverty line.
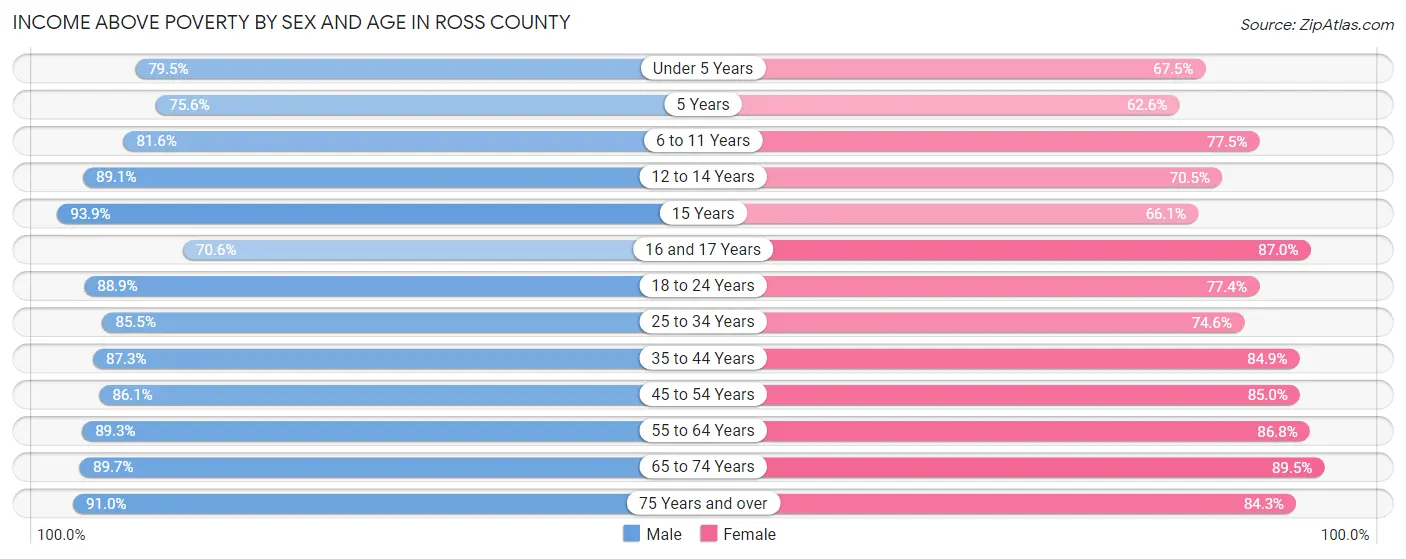
| Age Bracket | Male | Female |
| Under 5 Years | 1,629 (79.5%) | 1,417 (67.5%) |
| 5 Years | 207 (75.5%) | 241 (62.6%) |
| 6 to 11 Years | 2,139 (81.6%) | 1,789 (77.5%) |
| 12 to 14 Years | 1,634 (89.1%) | 1,149 (70.5%) |
| 15 Years | 356 (93.9%) | 327 (66.1%) |
| 16 and 17 Years | 768 (70.6%) | 787 (87.0%) |
| 18 to 24 Years | 2,481 (88.9%) | 2,176 (77.4%) |
| 25 to 34 Years | 3,516 (85.5%) | 3,033 (74.6%) |
| 35 to 44 Years | 3,956 (87.3%) | 3,774 (84.9%) |
| 45 to 54 Years | 4,434 (86.1%) | 4,076 (85.0%) |
| 55 to 64 Years | 4,456 (89.3%) | 4,572 (86.8%) |
| 65 to 74 Years | 3,165 (89.7%) | 3,627 (89.5%) |
| 75 Years and over | 1,947 (91.0%) | 2,474 (84.3%) |
| Total | 30,688 (86.5%) | 29,442 (81.4%) |
Income Below Poverty Among Married-Couple Families in Ross County
The poverty statistics for married-couple families in Ross County show that 5.2% or 705 of the total 13,506 families live below the poverty line. Families with 5 or more children have the highest poverty rate of 20.2%, comprising of 23 families. On the other hand, families with no children have the lowest poverty rate of 2.8%, which includes 233 families.
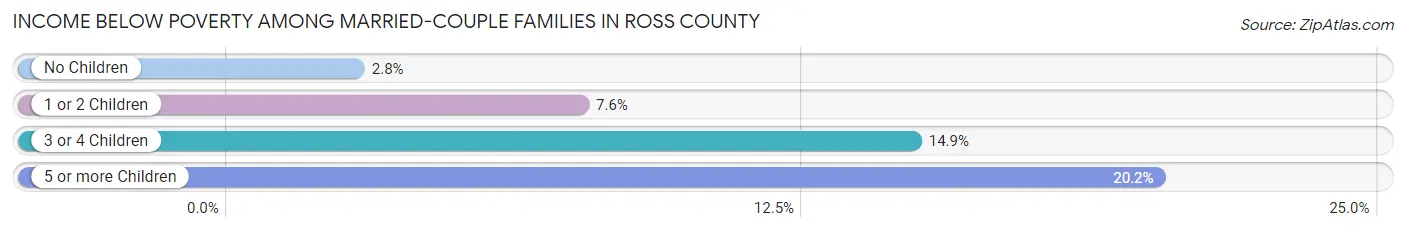
| Children | Above Poverty | Below Poverty |
| No Children | 8,194 (97.2%) | 233 (2.8%) |
| 1 or 2 Children | 3,698 (92.4%) | 306 (7.6%) |
| 3 or 4 Children | 818 (85.1%) | 143 (14.9%) |
| 5 or more Children | 91 (79.8%) | 23 (20.2%) |
| Total | 12,801 (94.8%) | 705 (5.2%) |
Income Below Poverty Among Single-Parent Households in Ross County
According to the poverty data in Ross County, 11.6% or 194 single-father households and 32.0% or 1,165 single-mother households are living below the poverty line. Among single-father households, those with 3 or 4 children have the highest poverty rate, with 28 households (35.0%) experiencing poverty. Likewise, among single-mother households, those with 3 or 4 children have the highest poverty rate, with 301 households (77.0%) falling below the poverty line.
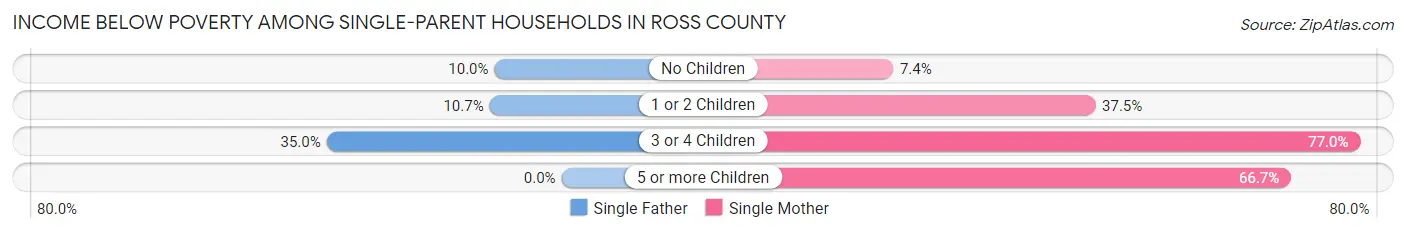
| Children | Single Father | Single Mother |
| No Children | 73 (10.0%) | 87 (7.3%) |
| 1 or 2 Children | 93 (10.7%) | 773 (37.5%) |
| 3 or 4 Children | 28 (35.0%) | 301 (77.0%) |
| 5 or more Children | 0 (0.0%) | 4 (66.7%) |
| Total | 194 (11.6%) | 1,165 (32.0%) |
Income Below Poverty Among Married-Couple vs Single-Parent Households in Ross County
The poverty data for Ross County shows that 705 of the married-couple family households (5.2%) and 1,359 of the single-parent households (25.6%) are living below the poverty level. Within the married-couple family households, those with 5 or more children have the highest poverty rate, with 23 households (20.2%) falling below the poverty line. Among the single-parent households, those with 3 or 4 children have the highest poverty rate, with 329 household (69.9%) living below poverty.
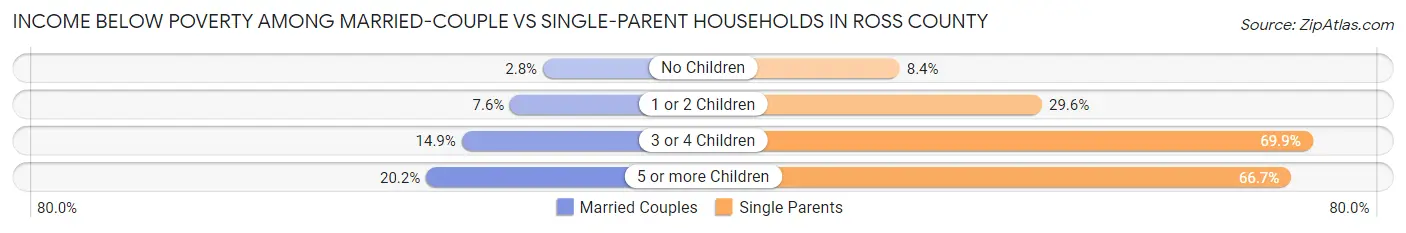
| Children | Married-Couple Families | Single-Parent Households |
| No Children | 233 (2.8%) | 160 (8.4%) |
| 1 or 2 Children | 306 (7.6%) | 866 (29.6%) |
| 3 or 4 Children | 143 (14.9%) | 329 (69.9%) |
| 5 or more Children | 23 (20.2%) | 4 (66.7%) |
| Total | 705 (5.2%) | 1,359 (25.6%) |
Race in Ross County
The most populous races in Ross County are White / Caucasian (68,763 | 89.3%), Black / African American (4,268 | 5.6%), and Two or more Races (2,982 | 3.9%).
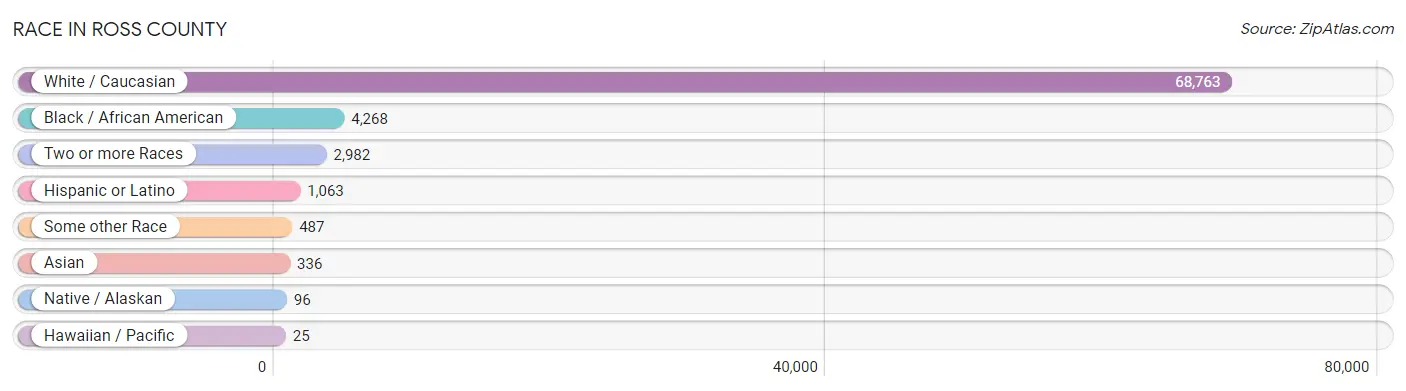
| Race | # Population | % Population |
| Asian | 336 | 0.4% |
| Black / African American | 4,268 | 5.6% |
| Hawaiian / Pacific | 25 | 0.0% |
| Hispanic or Latino | 1,063 | 1.4% |
| Native / Alaskan | 96 | 0.1% |
| White / Caucasian | 68,763 | 89.3% |
| Two or more Races | 2,982 | 3.9% |
| Some other Race | 487 | 0.6% |
| Total | 76,957 | 100.0% |
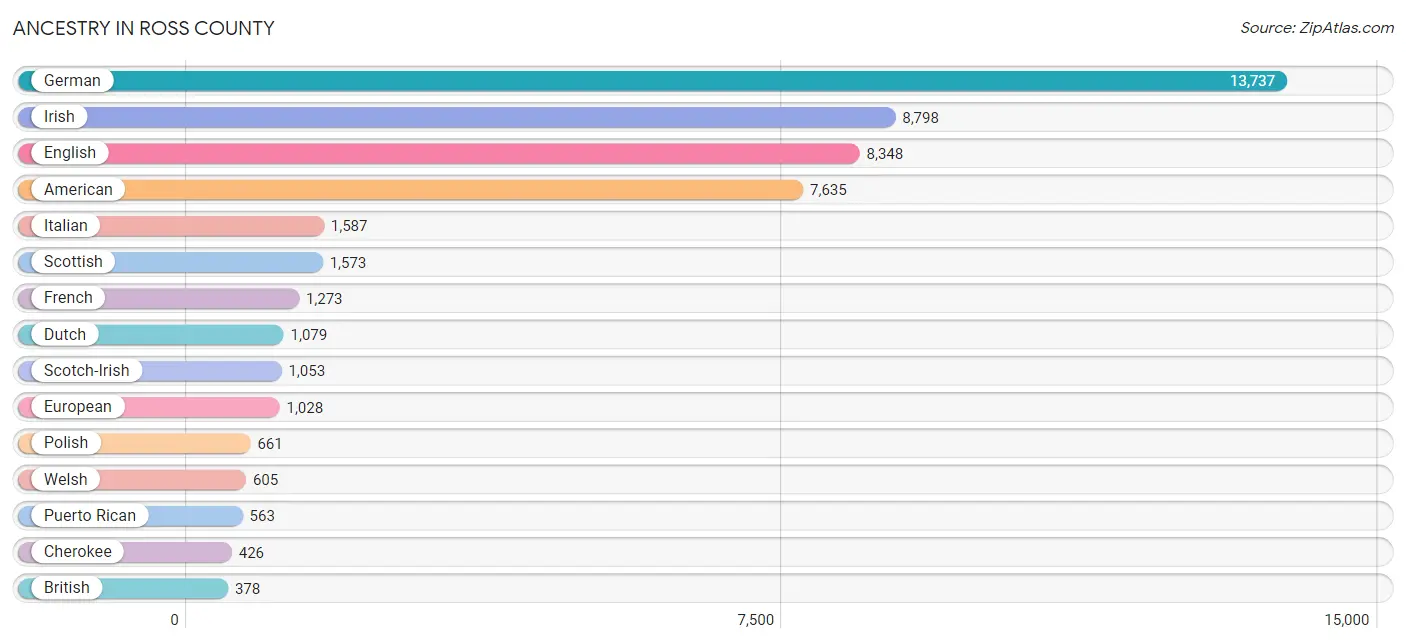
Ancestry in Ross County
The most populous ancestries reported in Ross County are German (13,737 | 17.8%), Irish (8,798 | 11.4%), English (8,348 | 10.8%), American (7,635 | 9.9%), and Italian (1,587 | 2.1%), together accounting for 52.1% of all Ross County residents.
| Ancestry | # Population | % Population |
| African | 176 | 0.2% |
| American | 7,635 | 9.9% |
| Arab | 44 | 0.1% |
| Arapaho | 10 | 0.0% |
| Armenian | 9 | 0.0% |
| Barbadian | 7 | 0.0% |
| Belgian | 31 | 0.0% |
| Bhutanese | 50 | 0.1% |
| Blackfeet | 31 | 0.0% |
| Brazilian | 11 | 0.0% |
| British | 378 | 0.5% |
| Burmese | 20 | 0.0% |
| Canadian | 233 | 0.3% |
| Celtic | 10 | 0.0% |
| Central American | 57 | 0.1% |
| Cherokee | 426 | 0.5% |
| Chippewa | 19 | 0.0% |
| Comanche | 2 | 0.0% |
| Cree | 4 | 0.0% |
| Croatian | 12 | 0.0% |
| Crow | 3 | 0.0% |
| Cuban | 6 | 0.0% |
| Czech | 67 | 0.1% |
| Czechoslovakian | 30 | 0.0% |
| Danish | 111 | 0.1% |
| Delaware | 14 | 0.0% |
| Dominican | 64 | 0.1% |
| Dutch | 1,079 | 1.4% |
| Eastern European | 36 | 0.1% |
| Egyptian | 6 | 0.0% |
| English | 8,348 | 10.8% |
| European | 1,028 | 1.3% |
| French | 1,273 | 1.7% |
| French American Indian | 10 | 0.0% |
| French Canadian | 199 | 0.3% |
| German | 13,737 | 17.8% |
| Greek | 165 | 0.2% |
| Guatemalan | 51 | 0.1% |
| Haitian | 44 | 0.1% |
| Hungarian | 139 | 0.2% |
| Indian (Asian) | 113 | 0.2% |
| Iranian | 10 | 0.0% |
| Irish | 8,798 | 11.4% |
| Iroquois | 23 | 0.0% |
| Israeli | 14 | 0.0% |
| Italian | 1,587 | 2.1% |
| Jamaican | 16 | 0.0% |
| Japanese | 27 | 0.0% |
| Korean | 256 | 0.3% |
| Lebanese | 8 | 0.0% |
| Lithuanian | 55 | 0.1% |
| Mexican | 310 | 0.4% |
| Moroccan | 26 | 0.0% |
| Native Hawaiian | 15 | 0.0% |
| Navajo | 26 | 0.0% |
| Nigerian | 54 | 0.1% |
| Northern European | 30 | 0.0% |
| Norwegian | 340 | 0.4% |
| Polish | 661 | 0.9% |
| Portuguese | 6 | 0.0% |
| Puerto Rican | 563 | 0.7% |
| Russian | 27 | 0.0% |
| Salvadoran | 6 | 0.0% |
| Scandinavian | 266 | 0.4% |
| Scotch-Irish | 1,053 | 1.4% |
| Scottish | 1,573 | 2.0% |
| Seminole | 24 | 0.0% |
| Slovak | 9 | 0.0% |
| Slovene | 7 | 0.0% |
| Spanish | 34 | 0.0% |
| Spanish American Indian | 6 | 0.0% |
| Sri Lankan | 53 | 0.1% |
| Subsaharan African | 235 | 0.3% |
| Swedish | 109 | 0.1% |
| Swiss | 262 | 0.3% |
| Syrian | 4 | 0.0% |
| Thai | 72 | 0.1% |
| Turkish | 12 | 0.0% |
| Ugandan | 24 | 0.0% |
| Ukrainian | 56 | 0.1% |
| Welsh | 605 | 0.8% |
| West Indian | 35 | 0.1% |
| Yugoslavian | 14 | 0.0% | View All 83 Rows |
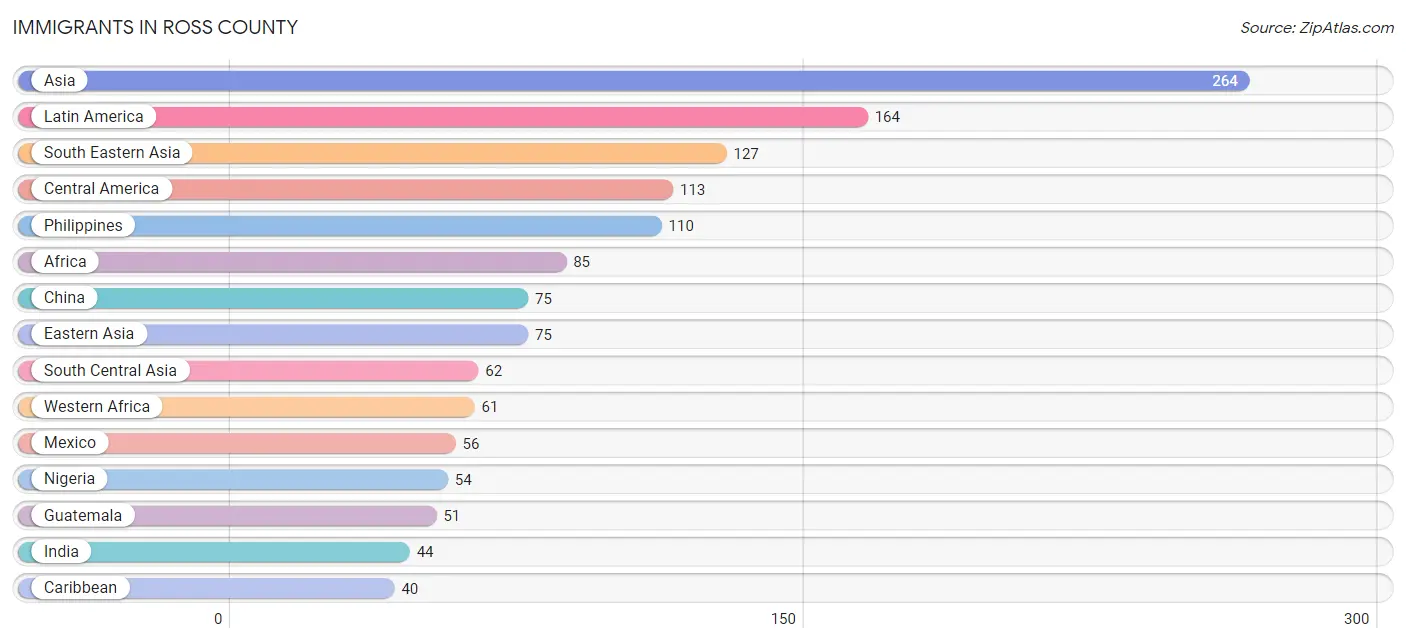
Immigrants in Ross County
The most numerous immigrant groups reported in Ross County came from Asia (264 | 0.3%), Latin America (164 | 0.2%), South Eastern Asia (127 | 0.2%), Central America (113 | 0.2%), and Philippines (110 | 0.1%), together accounting for 1.0% of all Ross County residents.
| Immigration Origin | # Population | % Population |
| Africa | 85 | 0.1% |
| Asia | 264 | 0.3% |
| Brazil | 11 | 0.0% |
| Cambodia | 8 | 0.0% |
| Canada | 27 | 0.0% |
| Caribbean | 40 | 0.1% |
| Central America | 113 | 0.2% |
| China | 75 | 0.1% |
| Dominican Republic | 5 | 0.0% |
| Eastern Africa | 24 | 0.0% |
| Eastern Asia | 75 | 0.1% |
| El Salvador | 6 | 0.0% |
| Europe | 12 | 0.0% |
| Guatemala | 51 | 0.1% |
| Haiti | 23 | 0.0% |
| India | 44 | 0.1% |
| Iran | 18 | 0.0% |
| Ireland | 2 | 0.0% |
| Italy | 3 | 0.0% |
| Jamaica | 12 | 0.0% |
| Latin America | 164 | 0.2% |
| Liberia | 7 | 0.0% |
| Mexico | 56 | 0.1% |
| Micronesia | 13 | 0.0% |
| Nigeria | 54 | 0.1% |
| Northern Europe | 9 | 0.0% |
| Oceania | 13 | 0.0% |
| Philippines | 110 | 0.1% |
| South America | 11 | 0.0% |
| South Central Asia | 62 | 0.1% |
| South Eastern Asia | 127 | 0.2% |
| Southern Europe | 3 | 0.0% |
| Uganda | 24 | 0.0% |
| Vietnam | 9 | 0.0% |
| Western Africa | 61 | 0.1% | View All 35 Rows |
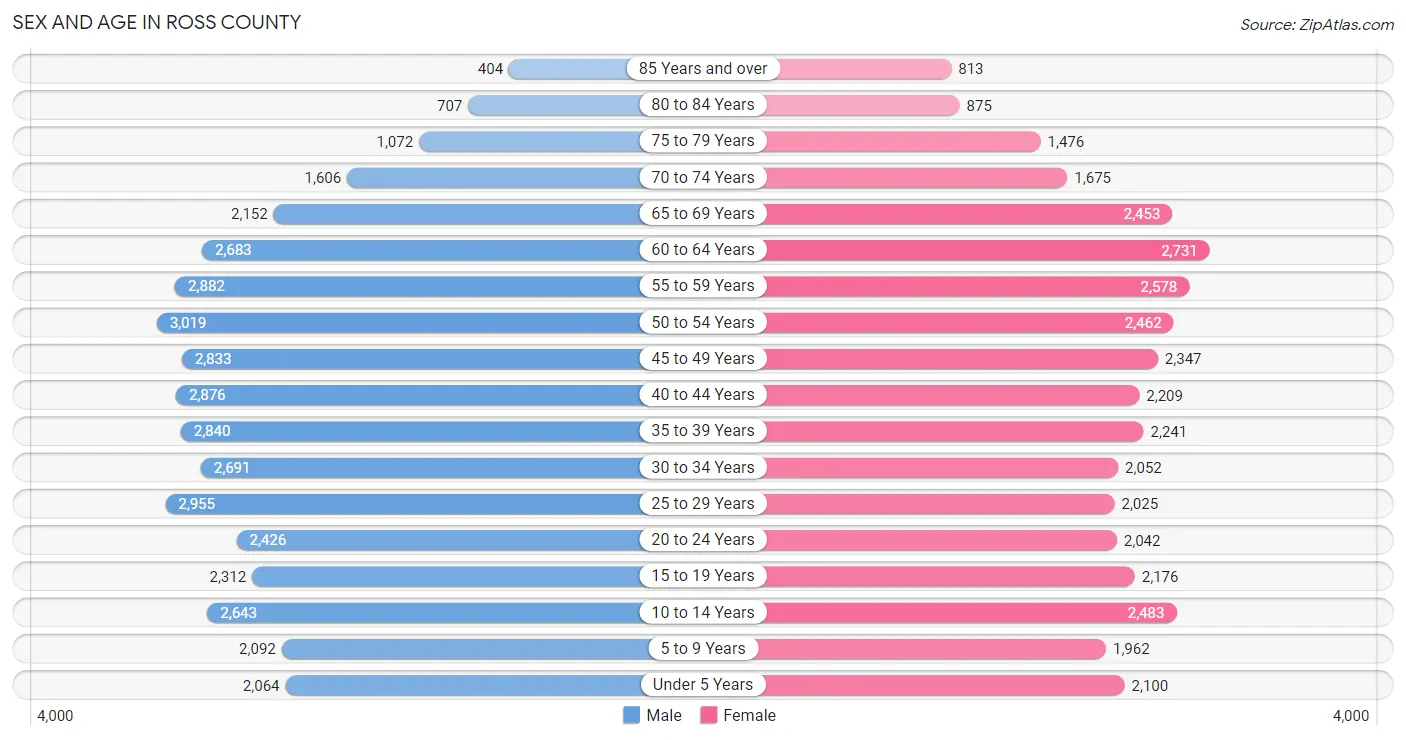
Sex and Age in Ross County
Sex and Age in Ross County
The most populous age groups in Ross County are 50 to 54 Years (3,019 | 7.5%) for men and 60 to 64 Years (2,731 | 7.4%) for women.
| Age Bracket | Male | Female |
| Under 5 Years | 2,064 (5.1%) | 2,100 (5.7%) |
| 5 to 9 Years | 2,092 (5.2%) | 1,962 (5.3%) |
| 10 to 14 Years | 2,643 (6.6%) | 2,483 (6.8%) |
| 15 to 19 Years | 2,312 (5.7%) | 2,176 (5.9%) |
| 20 to 24 Years | 2,426 (6.0%) | 2,042 (5.6%) |
| 25 to 29 Years | 2,955 (7.3%) | 2,025 (5.5%) |
| 30 to 34 Years | 2,691 (6.7%) | 2,052 (5.6%) |
| 35 to 39 Years | 2,840 (7.0%) | 2,241 (6.1%) |
| 40 to 44 Years | 2,876 (7.1%) | 2,209 (6.0%) |
| 45 to 49 Years | 2,833 (7.0%) | 2,347 (6.4%) |
| 50 to 54 Years | 3,019 (7.5%) | 2,462 (6.7%) |
| 55 to 59 Years | 2,882 (7.2%) | 2,578 (7.0%) |
| 60 to 64 Years | 2,683 (6.7%) | 2,731 (7.4%) |
| 65 to 69 Years | 2,152 (5.3%) | 2,453 (6.7%) |
| 70 to 74 Years | 1,606 (4.0%) | 1,675 (4.6%) |
| 75 to 79 Years | 1,072 (2.7%) | 1,476 (4.0%) |
| 80 to 84 Years | 707 (1.8%) | 875 (2.4%) |
| 85 Years and over | 404 (1.0%) | 813 (2.2%) |
| Total | 40,257 (100.0%) | 36,700 (100.0%) |
Families and Households in Ross County
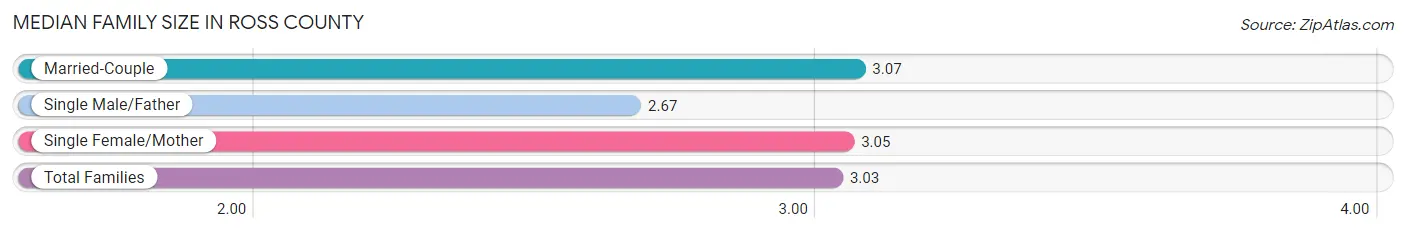
Median Family Size in Ross County
The median family size in Ross County is 3.03 persons per family, with married-couple families (13,506 | 71.7%) accounting for the largest median family size of 3.07 persons per family. On the other hand, single male/father families (1,677 | 8.9%) represent the smallest median family size with 2.67 persons per family.
| Family Type | # Families | Family Size |
| Married-Couple | 13,506 (71.7%) | 3.07 |
| Single Male/Father | 1,677 (8.9%) | 2.67 |
| Single Female/Mother | 3,643 (19.4%) | 3.05 |
| Total Families | 18,826 (100.0%) | 3.03 |
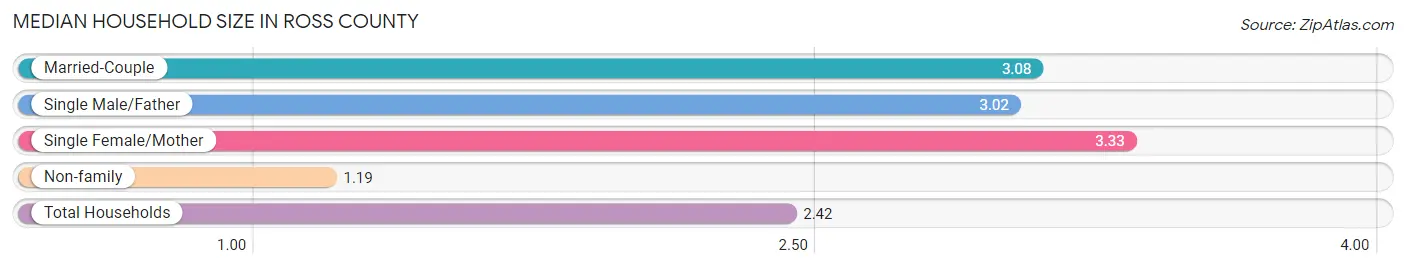
Median Household Size in Ross County
The median household size in Ross County is 2.42 persons per household, with single female/mother households (3,643 | 12.3%) accounting for the largest median household size of 3.33 persons per household. non-family households (10,739 | 36.3%) represent the smallest median household size with 1.19 persons per household.
| Household Type | # Households | Household Size |
| Married-Couple | 13,506 (45.7%) | 3.08 |
| Single Male/Father | 1,677 (5.7%) | 3.02 |
| Single Female/Mother | 3,643 (12.3%) | 3.33 |
| Non-family | 10,739 (36.3%) | 1.19 |
| Total Households | 29,565 (100.0%) | 2.42 |
Household Size by Marriage Status in Ross County
Out of a total of 29,565 households in Ross County, 18,826 (63.7%) are family households, while 10,739 (36.3%) are nonfamily households. The most numerous type of family households are 2-person households, comprising 9,051, and the most common type of nonfamily households are 1-person households, comprising 8,961.
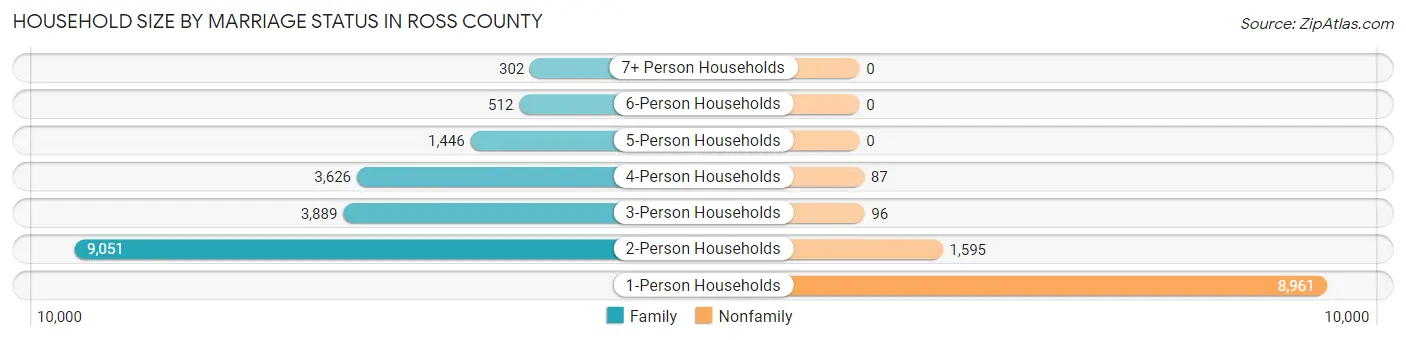
| Household Size | Family Households | Nonfamily Households |
| 1-Person Households | - | 8,961 (30.3%) |
| 2-Person Households | 9,051 (30.6%) | 1,595 (5.4%) |
| 3-Person Households | 3,889 (13.2%) | 96 (0.3%) |
| 4-Person Households | 3,626 (12.3%) | 87 (0.3%) |
| 5-Person Households | 1,446 (4.9%) | 0 (0.0%) |
| 6-Person Households | 512 (1.7%) | 0 (0.0%) |
| 7+ Person Households | 302 (1.0%) | 0 (0.0%) |
| Total | 18,826 (63.7%) | 10,739 (36.3%) |
Female Fertility in Ross County
Fertility by Age in Ross County
Average fertility rate in Ross County is 49.0 births per 1,000 women. Women in the age bracket of 20 to 34 years have the highest fertility rate with 107.0 births per 1,000 women. Women in the age bracket of 20 to 34 years acount for 86.5% of all women with births.
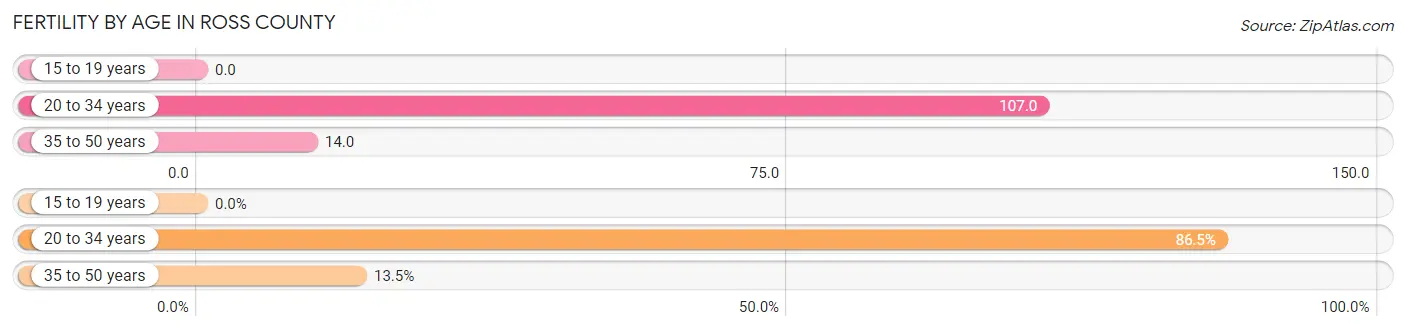
| Age Bracket | Women with Births | Births / 1,000 Women |
| 15 to 19 years | 0 (0.0%) | 0.0 |
| 20 to 34 years | 654 (86.5%) | 107.0 |
| 35 to 50 years | 102 (13.5%) | 14.0 |
| Total | 756 (100.0%) | 49.0 |
Fertility by Age by Marriage Status in Ross County
65.9% of women with births (756) in Ross County are married. The highest percentage of unmarried women with births falls into 20 to 34 years age bracket with 39.5% of them unmarried at the time of birth, while the lowest percentage of unmarried women with births belong to 35 to 50 years age bracket with 0.0% of them unmarried.
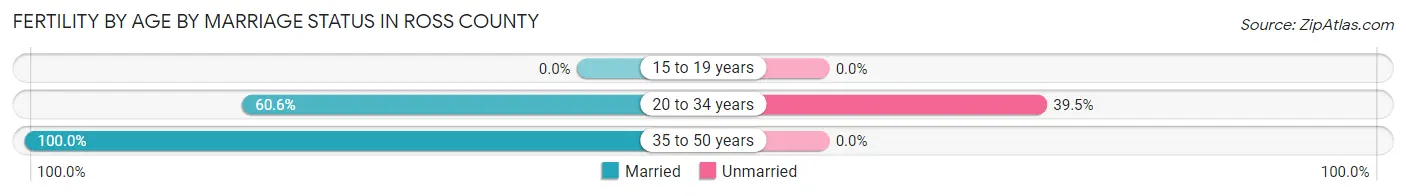
| Age Bracket | Married | Unmarried |
| 15 to 19 years | 0 (0.0%) | 0 (0.0%) |
| 20 to 34 years | 396 (60.6%) | 258 (39.5%) |
| 35 to 50 years | 102 (100.0%) | 0 (0.0%) |
| Total | 498 (65.9%) | 258 (34.1%) |
Fertility by Education in Ross County
Average fertility rate in Ross County is 49.0 births per 1,000 women. Women with the education attainment of graduate degree have the highest fertility rate of 74.0 births per 1,000 women, while women with the education attainment of less than high school have the lowest fertility at 25.0 births per 1,000 women. Women with the education attainment of high school diploma represent 36.4% of all women with births.
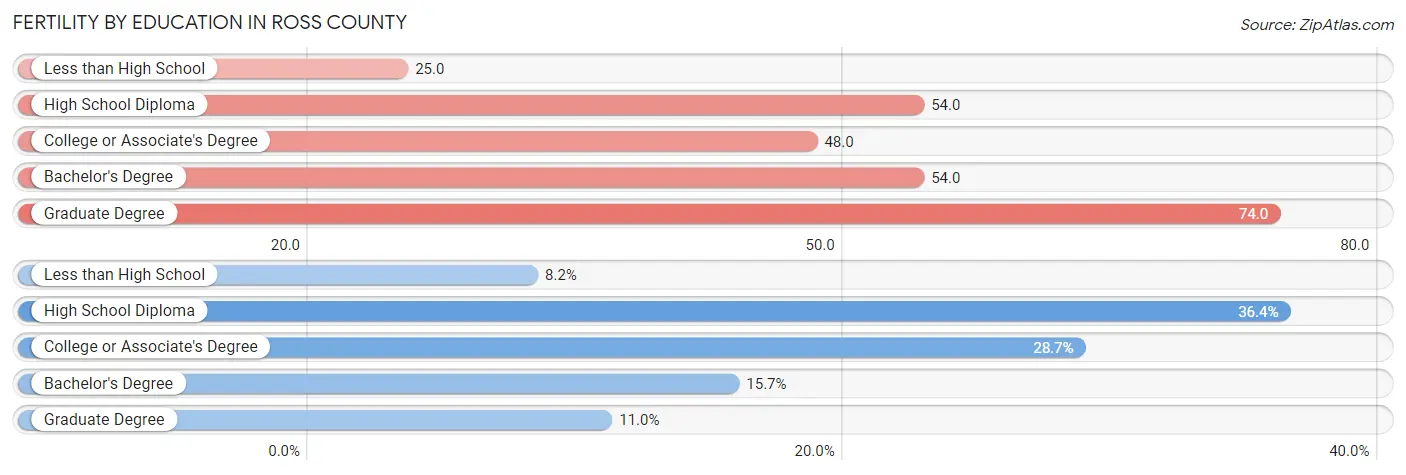
| Educational Attainment | Women with Births | Births / 1,000 Women |
| Less than High School | 62 (8.2%) | 25.0 |
| High School Diploma | 275 (36.4%) | 54.0 |
| College or Associate's Degree | 217 (28.7%) | 48.0 |
| Bachelor's Degree | 119 (15.7%) | 54.0 |
| Graduate Degree | 83 (11.0%) | 74.0 |
| Total | 756 (100.0%) | 49.0 |
Fertility by Education by Marriage Status in Ross County
34.1% of women with births in Ross County are unmarried. Women with the educational attainment of bachelor's degree are most likely to be married with 100.0% of them married at childbirth, while women with the educational attainment of less than high school are least likely to be married with 67.7% of them unmarried at childbirth.
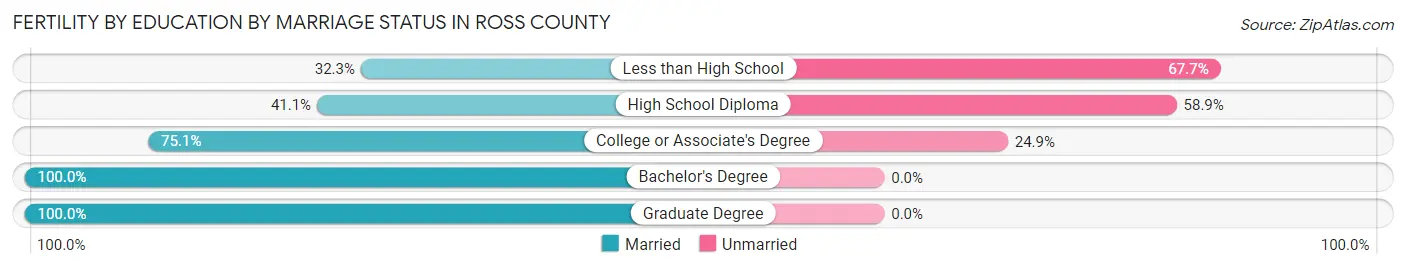
| Educational Attainment | Married | Unmarried |
| Less than High School | 20 (32.3%) | 42 (67.7%) |
| High School Diploma | 113 (41.1%) | 162 (58.9%) |
| College or Associate's Degree | 163 (75.1%) | 54 (24.9%) |
| Bachelor's Degree | 119 (100.0%) | 0 (0.0%) |
| Graduate Degree | 83 (100.0%) | 0 (0.0%) |
| Total | 498 (65.9%) | 258 (34.1%) |
Employment Characteristics in Ross County
Employment by Class of Employer in Ross County
Among the 30,977 employed individuals in Ross County, private company employees (20,387 | 65.8%), not-for-profit organizations (2,810 | 9.1%), and local government employees (2,361 | 7.6%) make up the most common classes of employment.
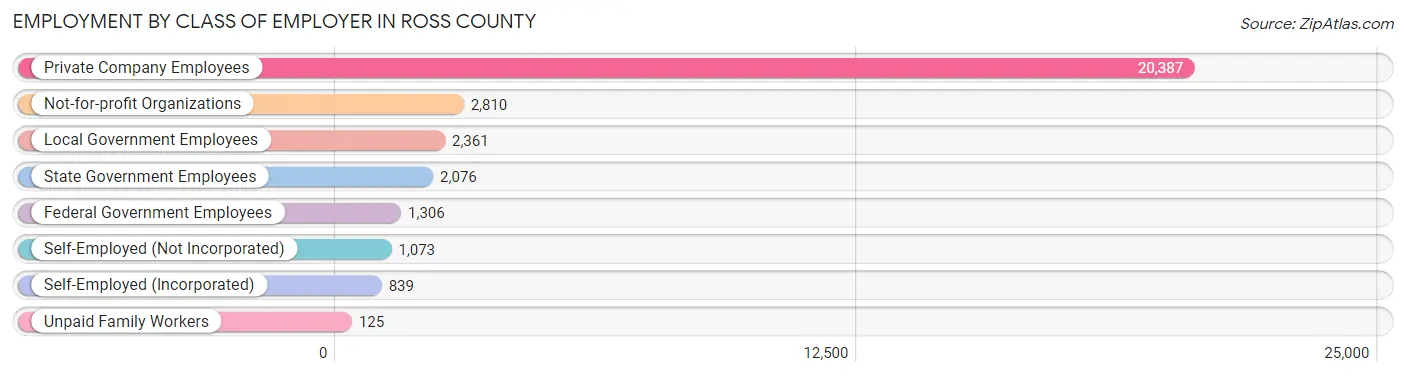
| Employer Class | # Employees | % Employees |
| Private Company Employees | 20,387 | 65.8% |
| Self-Employed (Incorporated) | 839 | 2.7% |
| Self-Employed (Not Incorporated) | 1,073 | 3.5% |
| Not-for-profit Organizations | 2,810 | 9.1% |
| Local Government Employees | 2,361 | 7.6% |
| State Government Employees | 2,076 | 6.7% |
| Federal Government Employees | 1,306 | 4.2% |
| Unpaid Family Workers | 125 | 0.4% |
| Total | 30,977 | 100.0% |
Employment Status by Age in Ross County
According to the labor force statistics for Ross County, out of the total population over 16 years of age (62,723), 53.8% or 33,745 individuals are in the labor force, with 5.7% or 1,923 of them unemployed. The age group with the highest labor force participation rate is 20 to 24 years, with 75.9% or 3,391 individuals in the labor force. Within the labor force, the 16 to 19 years age range has the highest percentage of unemployed individuals, with 20.9% or 305 of them being unemployed.
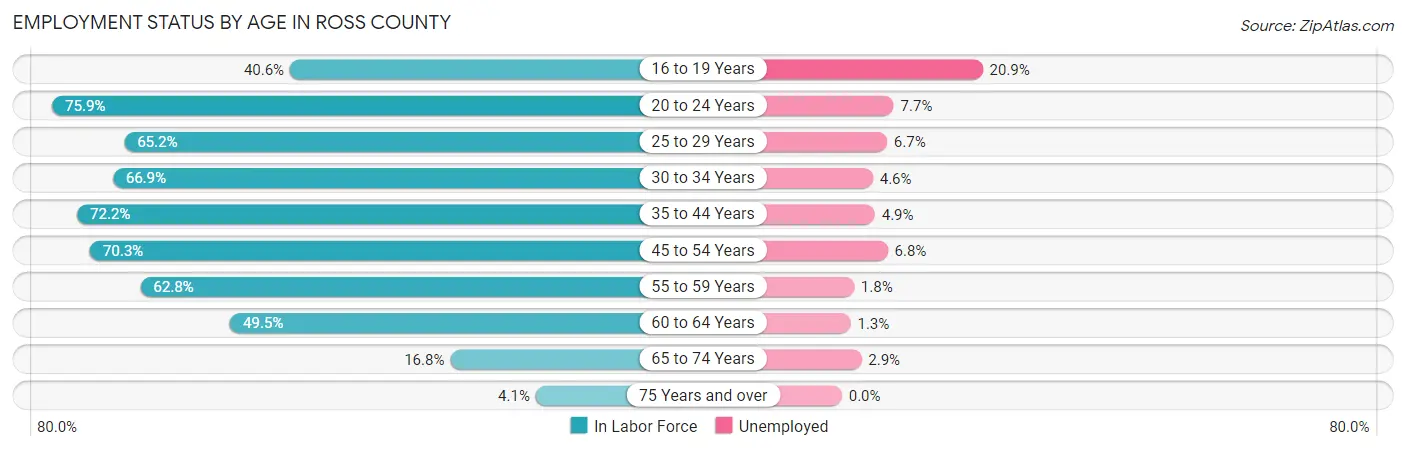
| Age Bracket | In Labor Force | Unemployed |
| 16 to 19 Years | 1,461 (40.6%) | 305 (20.9%) |
| 20 to 24 Years | 3,391 (75.9%) | 261 (7.7%) |
| 25 to 29 Years | 3,247 (65.2%) | 218 (6.7%) |
| 30 to 34 Years | 3,173 (66.9%) | 146 (4.6%) |
| 35 to 44 Years | 7,340 (72.2%) | 360 (4.9%) |
| 45 to 54 Years | 7,495 (70.3%) | 510 (6.8%) |
| 55 to 59 Years | 3,429 (62.8%) | 62 (1.8%) |
| 60 to 64 Years | 2,680 (49.5%) | 35 (1.3%) |
| 65 to 74 Years | 1,325 (16.8%) | 38 (2.9%) |
| 75 Years and over | 219 (4.1%) | 0 (0.0%) |
| Total | 33,745 (53.8%) | 1,923 (5.7%) |
Employment Status by Educational Attainment in Ross County
According to labor force statistics for Ross County, 66.1% of individuals (27,381) out of the total population between 25 and 64 years of age (41,424) are in the labor force, with 4.9% or 1,342 of them being unemployed. The group with the highest labor force participation rate are those with the educational attainment of bachelor's degree or higher, with 85.5% or 5,962 individuals in the labor force. Within the labor force, individuals with less than high school education have the highest percentage of unemployment, with 12.7% or 164 of them being unemployed.
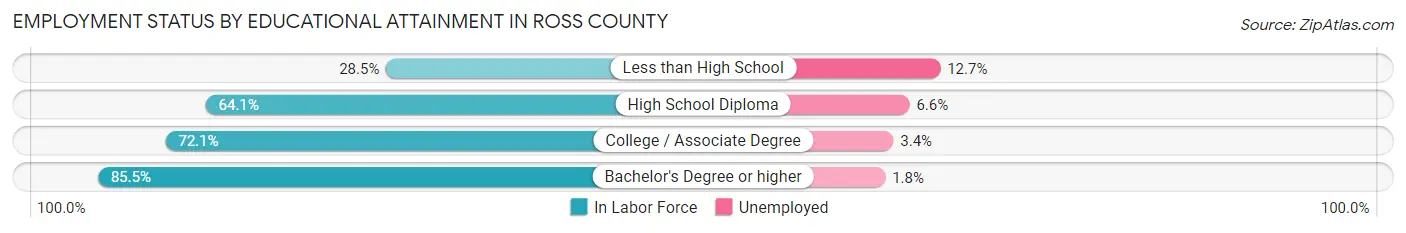
| Educational Attainment | In Labor Force | Unemployed |
| Less than High School | 1,295 (28.5%) | 577 (12.7%) |
| High School Diploma | 11,643 (64.1%) | 1,199 (6.6%) |
| College / Associate Degree | 8,467 (72.1%) | 399 (3.4%) |
| Bachelor's Degree or higher | 5,962 (85.5%) | 126 (1.8%) |
| Total | 27,381 (66.1%) | 2,030 (4.9%) |
Employment Occupations by Sex in Ross County
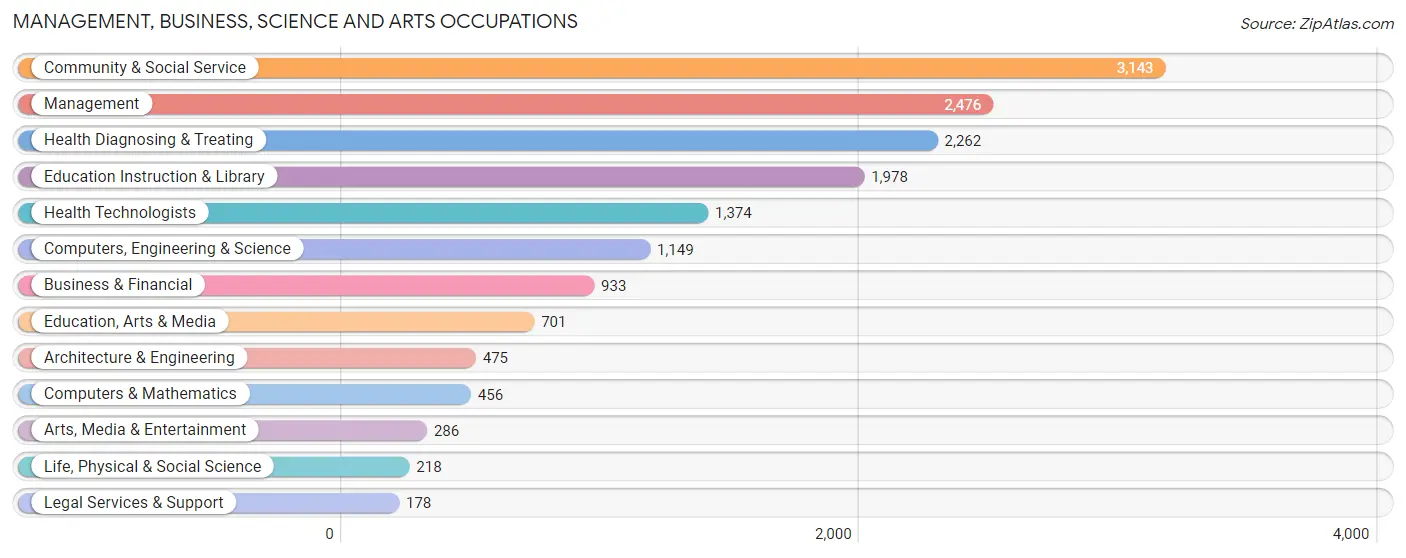
Management, Business, Science and Arts Occupations
The most common Management, Business, Science and Arts occupations in Ross County are Community & Social Service (3,143 | 9.9%), Management (2,476 | 7.8%), Health Diagnosing & Treating (2,262 | 7.1%), Education Instruction & Library (1,978 | 6.2%), and Health Technologists (1,374 | 4.3%).
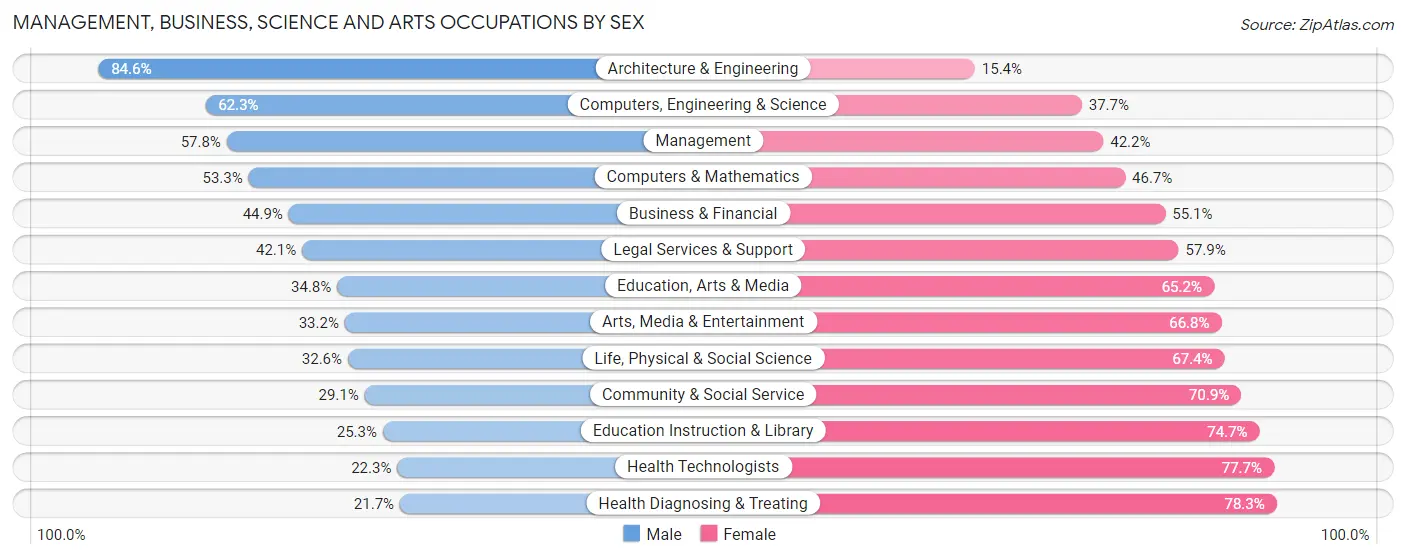
Management, Business, Science and Arts Occupations by Sex
Within the Management, Business, Science and Arts occupations in Ross County, the most male-oriented occupations are Architecture & Engineering (84.6%), Computers, Engineering & Science (62.3%), and Management (57.8%), while the most female-oriented occupations are Health Diagnosing & Treating (78.3%), Health Technologists (77.7%), and Education Instruction & Library (74.7%).
| Occupation | Male | Female |
| Management | 1,432 (57.8%) | 1,044 (42.2%) |
| Business & Financial | 419 (44.9%) | 514 (55.1%) |
| Computers, Engineering & Science | 716 (62.3%) | 433 (37.7%) |
| Computers & Mathematics | 243 (53.3%) | 213 (46.7%) |
| Architecture & Engineering | 402 (84.6%) | 73 (15.4%) |
| Life, Physical & Social Science | 71 (32.6%) | 147 (67.4%) |
| Community & Social Service | 914 (29.1%) | 2,229 (70.9%) |
| Education, Arts & Media | 244 (34.8%) | 457 (65.2%) |
| Legal Services & Support | 75 (42.1%) | 103 (57.9%) |
| Education Instruction & Library | 500 (25.3%) | 1,478 (74.7%) |
| Arts, Media & Entertainment | 95 (33.2%) | 191 (66.8%) |
| Health Diagnosing & Treating | 491 (21.7%) | 1,771 (78.3%) |
| Health Technologists | 306 (22.3%) | 1,068 (77.7%) |
| Total (Category) | 3,972 (39.9%) | 5,991 (60.1%) |
| Total (Overall) | 16,632 (52.3%) | 15,161 (47.7%) |
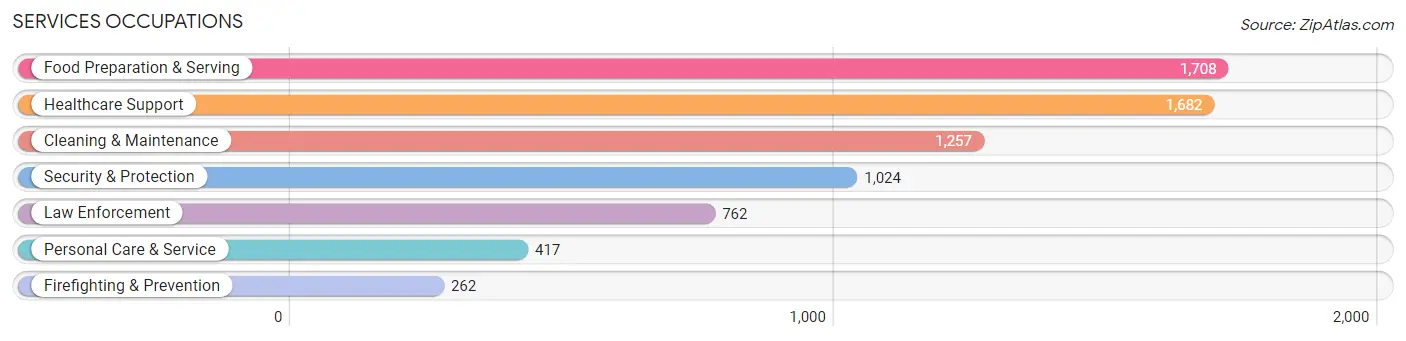
Services Occupations
The most common Services occupations in Ross County are Food Preparation & Serving (1,708 | 5.4%), Healthcare Support (1,682 | 5.3%), Cleaning & Maintenance (1,257 | 4.0%), Security & Protection (1,024 | 3.2%), and Law Enforcement (762 | 2.4%).
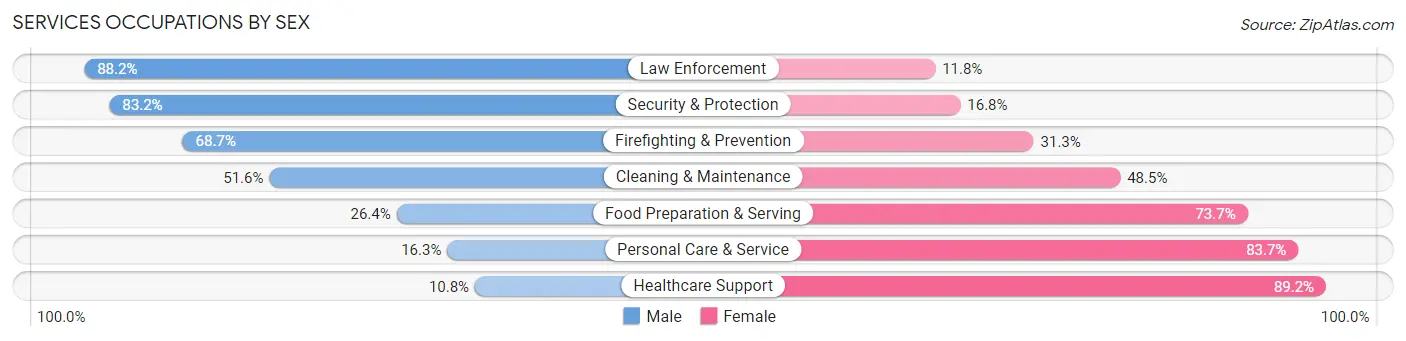
Services Occupations by Sex
Within the Services occupations in Ross County, the most male-oriented occupations are Law Enforcement (88.2%), Security & Protection (83.2%), and Firefighting & Prevention (68.7%), while the most female-oriented occupations are Healthcare Support (89.2%), Personal Care & Service (83.7%), and Food Preparation & Serving (73.7%).
| Occupation | Male | Female |
| Healthcare Support | 182 (10.8%) | 1,500 (89.2%) |
| Security & Protection | 852 (83.2%) | 172 (16.8%) |
| Firefighting & Prevention | 180 (68.7%) | 82 (31.3%) |
| Law Enforcement | 672 (88.2%) | 90 (11.8%) |
| Food Preparation & Serving | 450 (26.4%) | 1,258 (73.7%) |
| Cleaning & Maintenance | 648 (51.5%) | 609 (48.4%) |
| Personal Care & Service | 68 (16.3%) | 349 (83.7%) |
| Total (Category) | 2,200 (36.1%) | 3,888 (63.9%) |
| Total (Overall) | 16,632 (52.3%) | 15,161 (47.7%) |
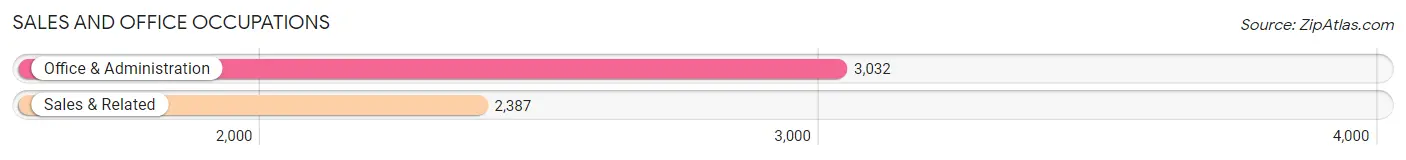
Sales and Office Occupations
The most common Sales and Office occupations in Ross County are Office & Administration (3,032 | 9.5%), and Sales & Related (2,387 | 7.5%).
Sales and Office Occupations by Sex
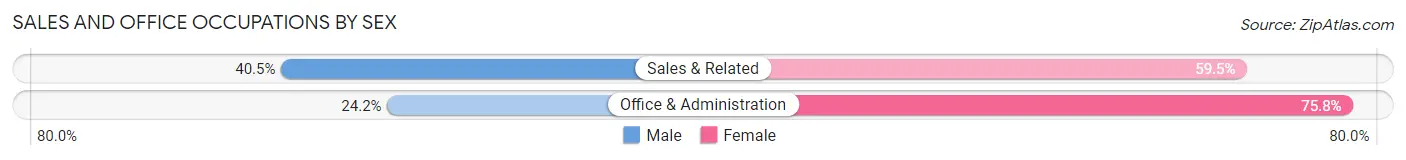
| Occupation | Male | Female |
| Sales & Related | 967 (40.5%) | 1,420 (59.5%) |
| Office & Administration | 733 (24.2%) | 2,299 (75.8%) |
| Total (Category) | 1,700 (31.4%) | 3,719 (68.6%) |
| Total (Overall) | 16,632 (52.3%) | 15,161 (47.7%) |
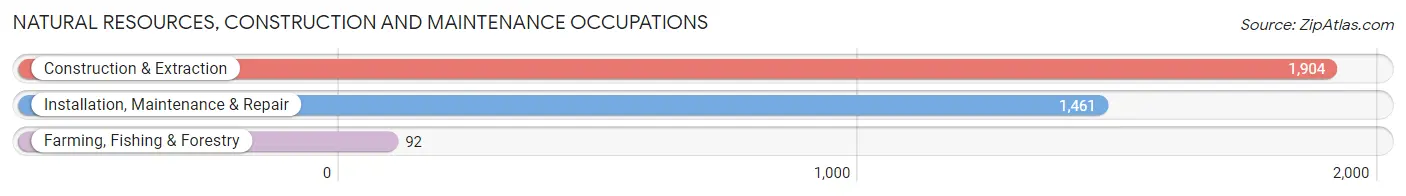
Natural Resources, Construction and Maintenance Occupations
The most common Natural Resources, Construction and Maintenance occupations in Ross County are Construction & Extraction (1,904 | 6.0%), Installation, Maintenance & Repair (1,461 | 4.6%), and Farming, Fishing & Forestry (92 | 0.3%).
Natural Resources, Construction and Maintenance Occupations by Sex
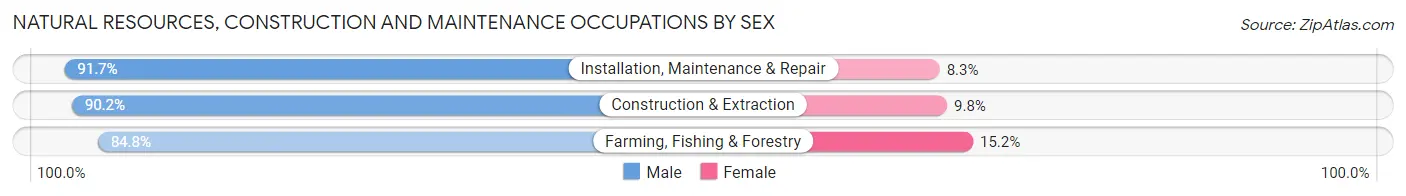
| Occupation | Male | Female |
| Farming, Fishing & Forestry | 78 (84.8%) | 14 (15.2%) |
| Construction & Extraction | 1,717 (90.2%) | 187 (9.8%) |
| Installation, Maintenance & Repair | 1,340 (91.7%) | 121 (8.3%) |
| Total (Category) | 3,135 (90.7%) | 322 (9.3%) |
| Total (Overall) | 16,632 (52.3%) | 15,161 (47.7%) |
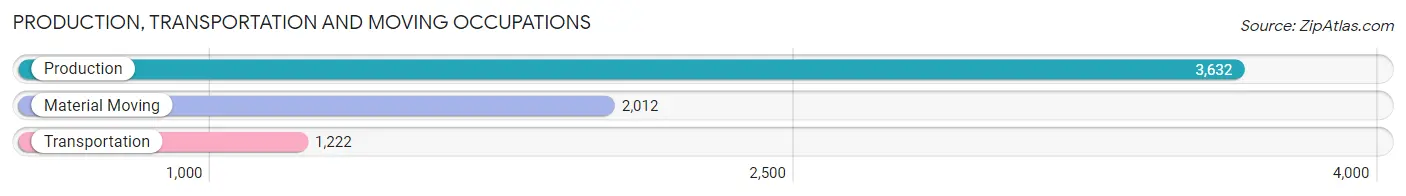
Production, Transportation and Moving Occupations
The most common Production, Transportation and Moving occupations in Ross County are Production (3,632 | 11.4%), Material Moving (2,012 | 6.3%), and Transportation (1,222 | 3.8%).
Production, Transportation and Moving Occupations by Sex
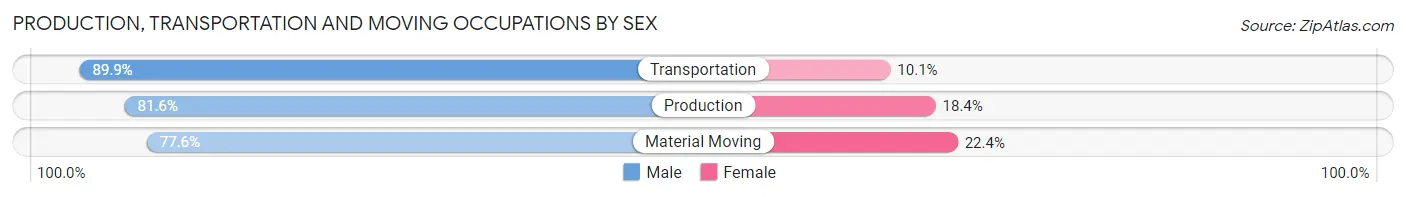
| Occupation | Male | Female |
| Production | 2,965 (81.6%) | 667 (18.4%) |
| Transportation | 1,099 (89.9%) | 123 (10.1%) |
| Material Moving | 1,561 (77.6%) | 451 (22.4%) |
| Total (Category) | 5,625 (81.9%) | 1,241 (18.1%) |
| Total (Overall) | 16,632 (52.3%) | 15,161 (47.7%) |
Employment Industries by Sex in Ross County
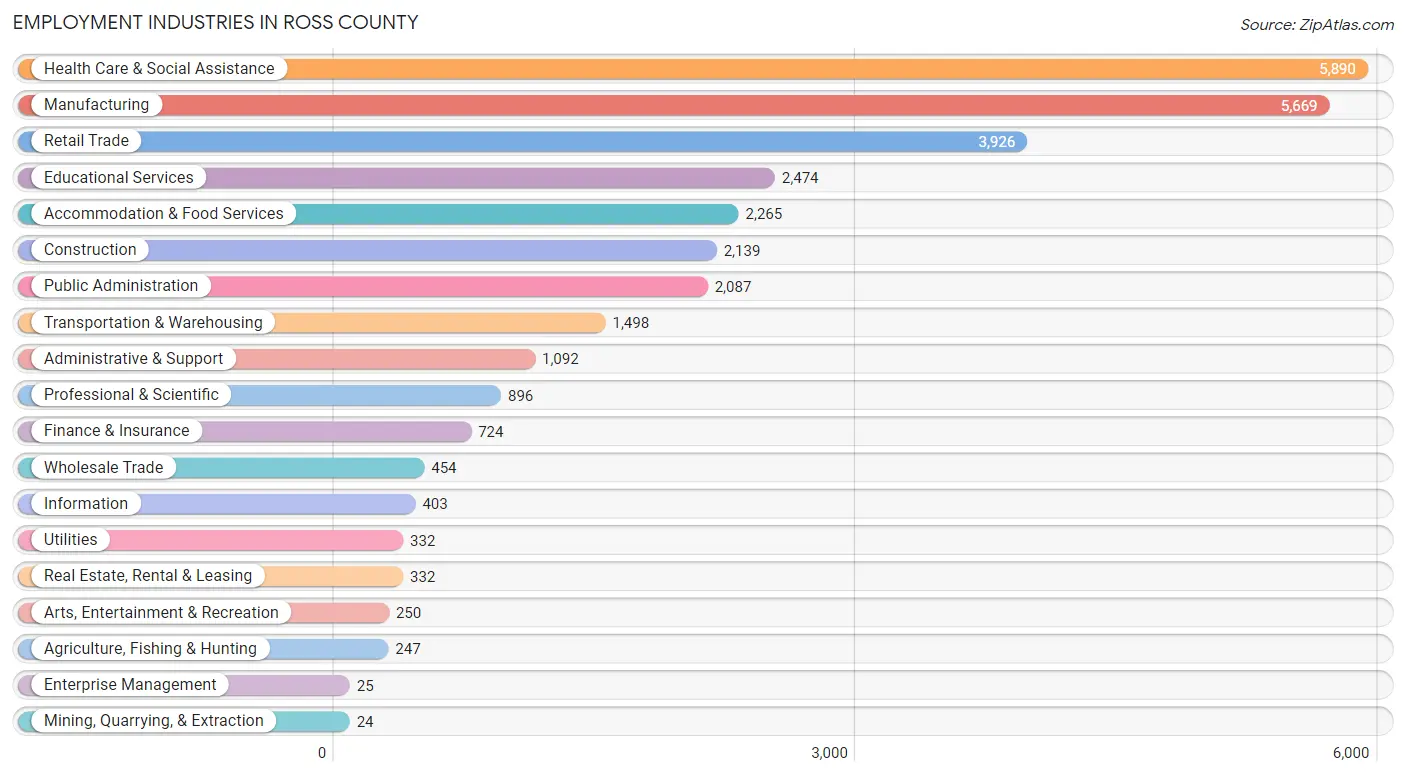
Employment Industries in Ross County
The major employment industries in Ross County include Health Care & Social Assistance (5,890 | 18.5%), Manufacturing (5,669 | 17.8%), Retail Trade (3,926 | 12.3%), Educational Services (2,474 | 7.8%), and Accommodation & Food Services (2,265 | 7.1%).
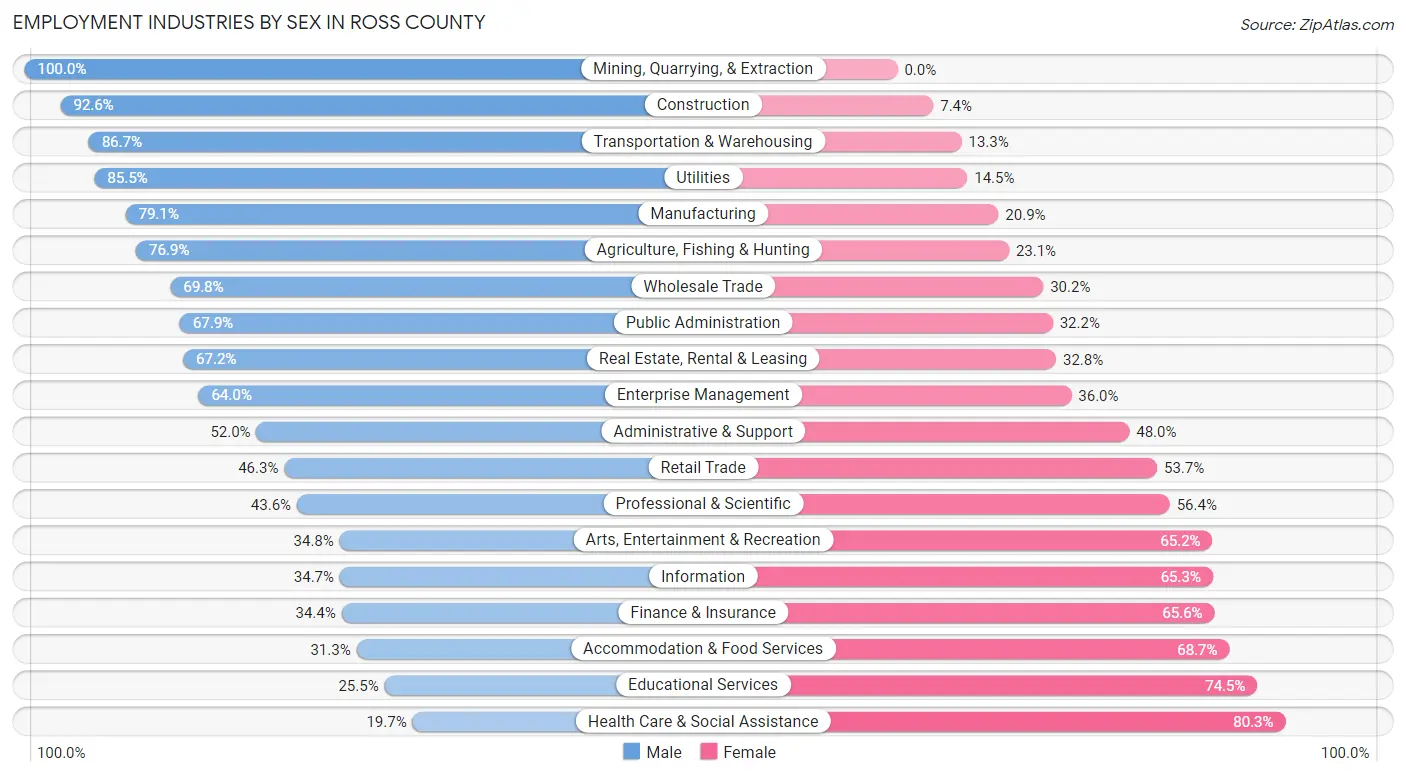
Employment Industries by Sex in Ross County
The Ross County industries that see more men than women are Mining, Quarrying, & Extraction (100.0%), Construction (92.6%), and Transportation & Warehousing (86.7%), whereas the industries that tend to have a higher number of women are Health Care & Social Assistance (80.3%), Educational Services (74.5%), and Accommodation & Food Services (68.7%).
| Industry | Male | Female |
| Agriculture, Fishing & Hunting | 190 (76.9%) | 57 (23.1%) |
| Mining, Quarrying, & Extraction | 24 (100.0%) | 0 (0.0%) |
| Construction | 1,980 (92.6%) | 159 (7.4%) |
| Manufacturing | 4,484 (79.1%) | 1,185 (20.9%) |
| Wholesale Trade | 317 (69.8%) | 137 (30.2%) |
| Retail Trade | 1,816 (46.3%) | 2,110 (53.7%) |
| Transportation & Warehousing | 1,299 (86.7%) | 199 (13.3%) |
| Utilities | 284 (85.5%) | 48 (14.5%) |
| Information | 140 (34.7%) | 263 (65.3%) |
| Finance & Insurance | 249 (34.4%) | 475 (65.6%) |
| Real Estate, Rental & Leasing | 223 (67.2%) | 109 (32.8%) |
| Professional & Scientific | 391 (43.6%) | 505 (56.4%) |
| Enterprise Management | 16 (64.0%) | 9 (36.0%) |
| Administrative & Support | 568 (52.0%) | 524 (48.0%) |
| Educational Services | 631 (25.5%) | 1,843 (74.5%) |
| Health Care & Social Assistance | 1,161 (19.7%) | 4,729 (80.3%) |
| Arts, Entertainment & Recreation | 87 (34.8%) | 163 (65.2%) |
| Accommodation & Food Services | 709 (31.3%) | 1,556 (68.7%) |
| Public Administration | 1,416 (67.8%) | 671 (32.2%) |
| Total | 16,632 (52.3%) | 15,161 (47.7%) |
Education in Ross County
School Enrollment in Ross County
The most common levels of schooling among the 15,977 students in Ross County are middle school (4,229 | 26.5%), high school (4,000 | 25.0%), and elementary school (3,201 | 20.0%).
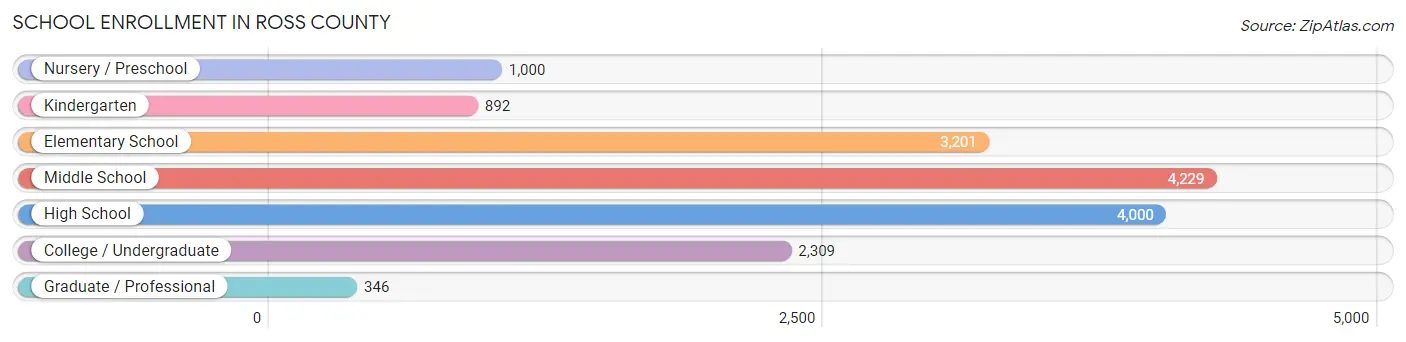
| School Level | # Students | % Students |
| Nursery / Preschool | 1,000 | 6.3% |
| Kindergarten | 892 | 5.6% |
| Elementary School | 3,201 | 20.0% |
| Middle School | 4,229 | 26.5% |
| High School | 4,000 | 25.0% |
| College / Undergraduate | 2,309 | 14.4% |
| Graduate / Professional | 346 | 2.2% |
| Total | 15,977 | 100.0% |
School Enrollment by Age by Funding Source in Ross County
Out of a total of 15,977 students who are enrolled in schools in Ross County, 1,981 (12.4%) attend a private institution, while the remaining 13,996 (87.6%) are enrolled in public schools. The age group of 25 to 34 year olds has the highest likelihood of being enrolled in private schools, with 222 (35.4% in the age bracket) enrolled. Conversely, the age group of 5 to 9 year old has the lowest likelihood of being enrolled in a private school, with 3,596 (92.9% in the age bracket) attending a public institution.
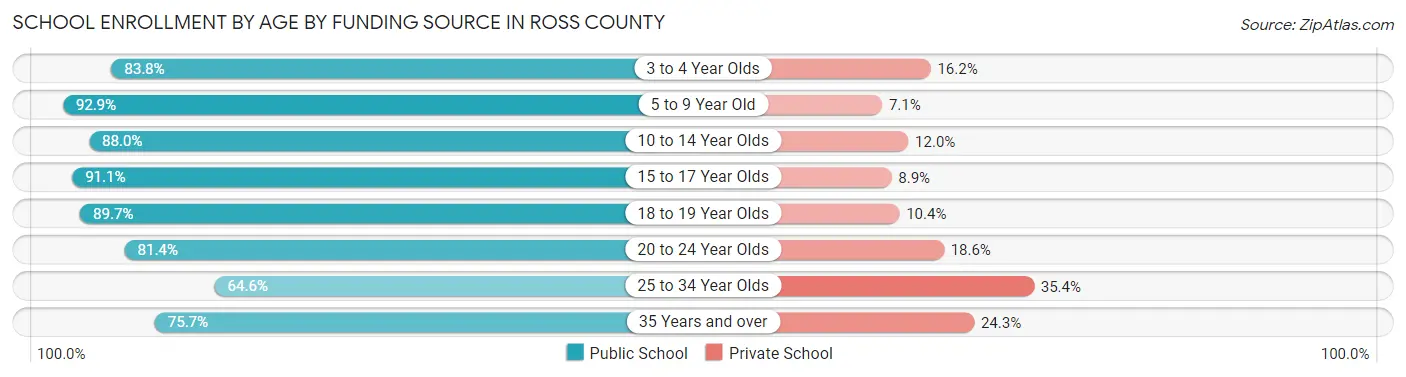
| Age Bracket | Public School | Private School |
| 3 to 4 Year Olds | 586 (83.8%) | 113 (16.2%) |
| 5 to 9 Year Old | 3,596 (92.9%) | 276 (7.1%) |
| 10 to 14 Year Olds | 4,411 (88.0%) | 602 (12.0%) |
| 15 to 17 Year Olds | 2,545 (91.1%) | 248 (8.9%) |
| 18 to 19 Year Olds | 866 (89.6%) | 100 (10.3%) |
| 20 to 24 Year Olds | 939 (81.4%) | 215 (18.6%) |
| 25 to 34 Year Olds | 405 (64.6%) | 222 (35.4%) |
| 35 Years and over | 646 (75.7%) | 207 (24.3%) |
| Total | 13,996 (87.6%) | 1,981 (12.4%) |
Educational Attainment by Field of Study in Ross County
Education (2,552 | 26.1%), business (1,290 | 13.2%), science & technology (1,275 | 13.0%), bio, nature & agricultural (792 | 8.1%), and arts & humanities (666 | 6.8%) are the most common fields of study among 9,790 individuals in Ross County who have obtained a bachelor's degree or higher.
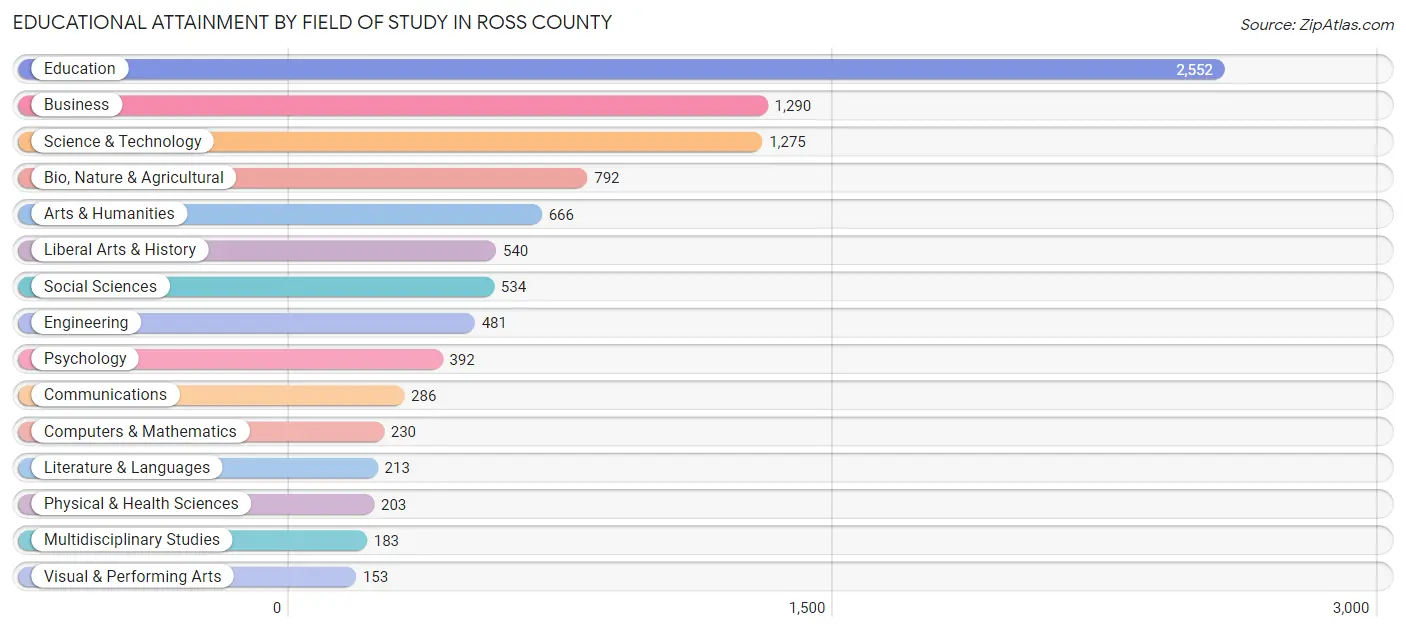
| Field of Study | # Graduates | % Graduates |
| Computers & Mathematics | 230 | 2.4% |
| Bio, Nature & Agricultural | 792 | 8.1% |
| Physical & Health Sciences | 203 | 2.1% |
| Psychology | 392 | 4.0% |
| Social Sciences | 534 | 5.4% |
| Engineering | 481 | 4.9% |
| Multidisciplinary Studies | 183 | 1.9% |
| Science & Technology | 1,275 | 13.0% |
| Business | 1,290 | 13.2% |
| Education | 2,552 | 26.1% |
| Literature & Languages | 213 | 2.2% |
| Liberal Arts & History | 540 | 5.5% |
| Visual & Performing Arts | 153 | 1.6% |
| Communications | 286 | 2.9% |
| Arts & Humanities | 666 | 6.8% |
| Total | 9,790 | 100.0% |
Transportation & Commute in Ross County
Vehicle Availability by Sex in Ross County
The most prevalent vehicle ownership categories in Ross County are males with 2 vehicles (6,285, accounting for 38.3%) and females with 2 vehicles (5,183, making up 43.4%).
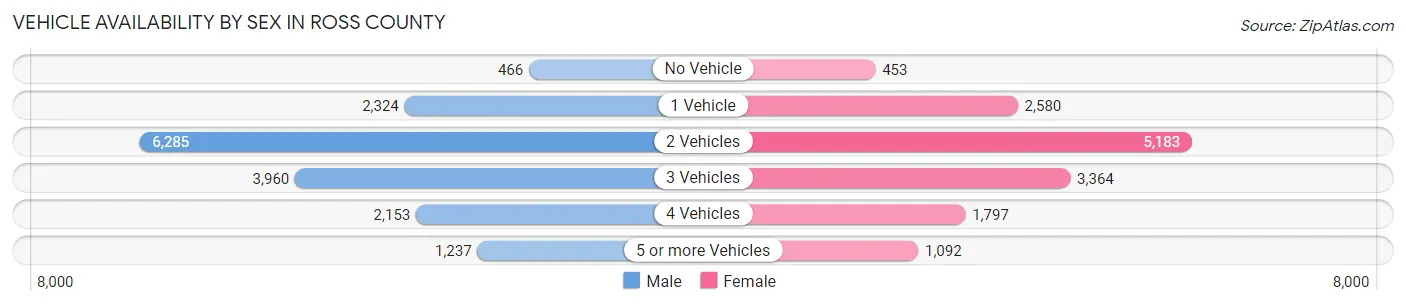
| Vehicles Available | Male | Female |
| No Vehicle | 466 (2.8%) | 453 (3.1%) |
| 1 Vehicle | 2,324 (14.1%) | 2,580 (17.8%) |
| 2 Vehicles | 6,285 (38.3%) | 5,183 (35.8%) |
| 3 Vehicles | 3,960 (24.1%) | 3,364 (23.3%) |
| 4 Vehicles | 2,153 (13.1%) | 1,797 (12.4%) |
| 5 or more Vehicles | 1,237 (7.5%) | 1,092 (7.5%) |
| Total | 16,425 (100.0%) | 14,469 (100.0%) |
Commute Time in Ross County
The most frequently occuring commute durations in Ross County are 15 to 19 minutes (5,212 commuters, 17.5%), 10 to 14 minutes (5,177 commuters, 17.4%), and 20 to 24 minutes (4,266 commuters, 14.3%).
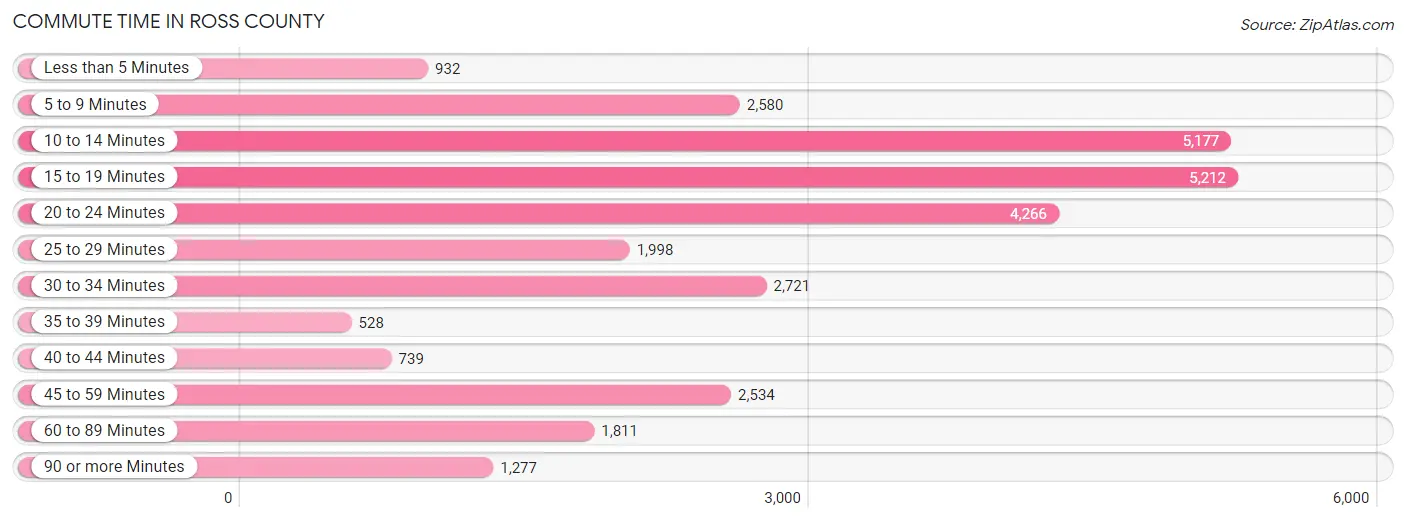
| Commute Time | # Commuters | % Commuters |
| Less than 5 Minutes | 932 | 3.1% |
| 5 to 9 Minutes | 2,580 | 8.7% |
| 10 to 14 Minutes | 5,177 | 17.4% |
| 15 to 19 Minutes | 5,212 | 17.5% |
| 20 to 24 Minutes | 4,266 | 14.3% |
| 25 to 29 Minutes | 1,998 | 6.7% |
| 30 to 34 Minutes | 2,721 | 9.1% |
| 35 to 39 Minutes | 528 | 1.8% |
| 40 to 44 Minutes | 739 | 2.5% |
| 45 to 59 Minutes | 2,534 | 8.5% |
| 60 to 89 Minutes | 1,811 | 6.1% |
| 90 or more Minutes | 1,277 | 4.3% |
Commute Time by Sex in Ross County
The most common commute times in Ross County are 10 to 14 minutes (2,502 commuters, 15.7%) for males and 15 to 19 minutes (2,727 commuters, 19.7%) for females.
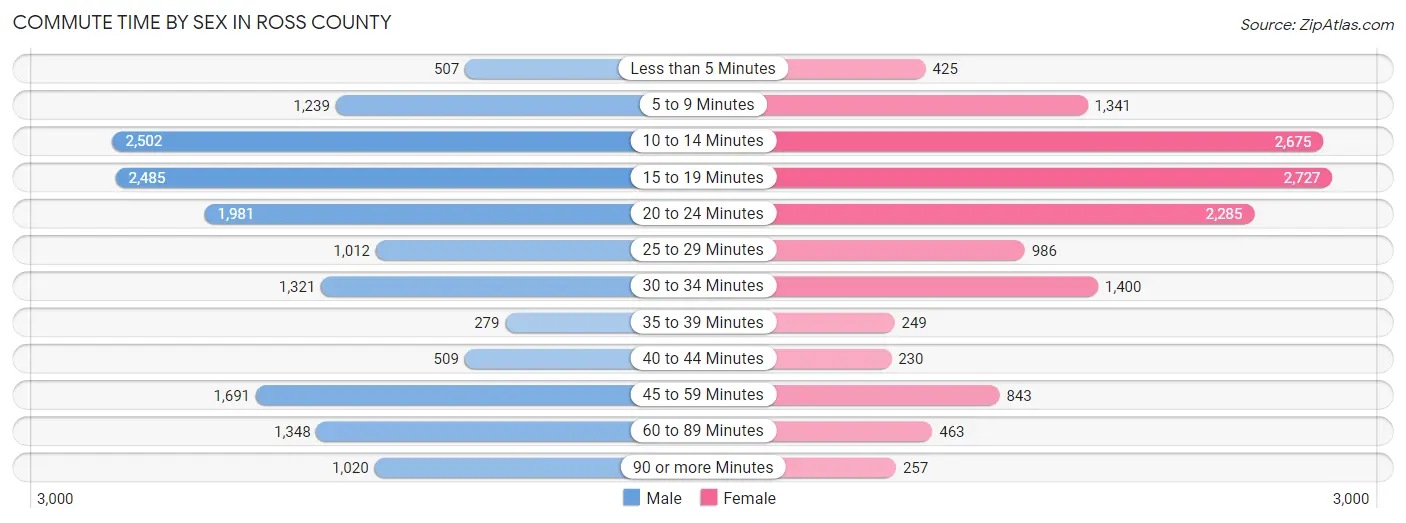
| Commute Time | Male | Female |
| Less than 5 Minutes | 507 (3.2%) | 425 (3.1%) |
| 5 to 9 Minutes | 1,239 (7.8%) | 1,341 (9.7%) |
| 10 to 14 Minutes | 2,502 (15.7%) | 2,675 (19.3%) |
| 15 to 19 Minutes | 2,485 (15.6%) | 2,727 (19.7%) |
| 20 to 24 Minutes | 1,981 (12.5%) | 2,285 (16.5%) |
| 25 to 29 Minutes | 1,012 (6.4%) | 986 (7.1%) |
| 30 to 34 Minutes | 1,321 (8.3%) | 1,400 (10.1%) |
| 35 to 39 Minutes | 279 (1.8%) | 249 (1.8%) |
| 40 to 44 Minutes | 509 (3.2%) | 230 (1.7%) |
| 45 to 59 Minutes | 1,691 (10.6%) | 843 (6.1%) |
| 60 to 89 Minutes | 1,348 (8.5%) | 463 (3.3%) |
| 90 or more Minutes | 1,020 (6.4%) | 257 (1.8%) |
Time of Departure to Work by Sex in Ross County
The most frequent times of departure to work in Ross County are 6:00 AM to 6:29 AM (2,173, 13.7%) for males and 7:00 AM to 7:29 AM (2,282, 16.4%) for females.
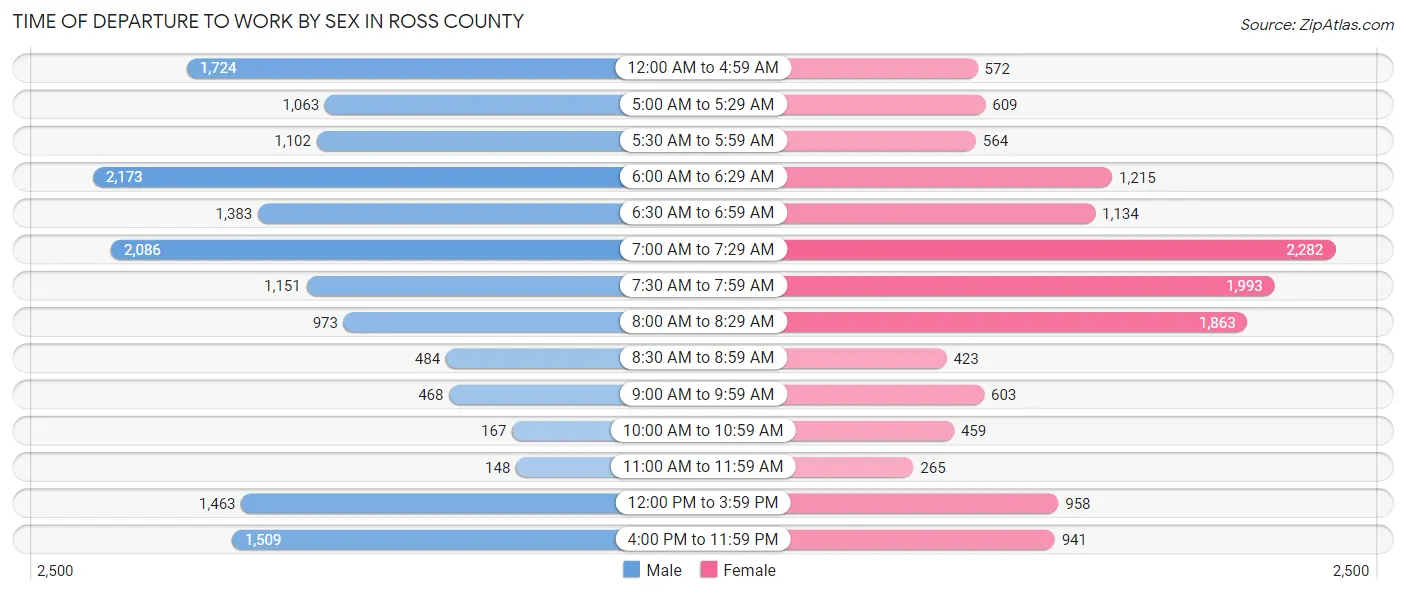
| Time of Departure | Male | Female |
| 12:00 AM to 4:59 AM | 1,724 (10.8%) | 572 (4.1%) |
| 5:00 AM to 5:29 AM | 1,063 (6.7%) | 609 (4.4%) |
| 5:30 AM to 5:59 AM | 1,102 (6.9%) | 564 (4.1%) |
| 6:00 AM to 6:29 AM | 2,173 (13.7%) | 1,215 (8.7%) |
| 6:30 AM to 6:59 AM | 1,383 (8.7%) | 1,134 (8.2%) |
| 7:00 AM to 7:29 AM | 2,086 (13.1%) | 2,282 (16.4%) |
| 7:30 AM to 7:59 AM | 1,151 (7.2%) | 1,993 (14.4%) |
| 8:00 AM to 8:29 AM | 973 (6.1%) | 1,863 (13.4%) |
| 8:30 AM to 8:59 AM | 484 (3.0%) | 423 (3.0%) |
| 9:00 AM to 9:59 AM | 468 (2.9%) | 603 (4.3%) |
| 10:00 AM to 10:59 AM | 167 (1.1%) | 459 (3.3%) |
| 11:00 AM to 11:59 AM | 148 (0.9%) | 265 (1.9%) |
| 12:00 PM to 3:59 PM | 1,463 (9.2%) | 958 (6.9%) |
| 4:00 PM to 11:59 PM | 1,509 (9.5%) | 941 (6.8%) |
| Total | 15,894 (100.0%) | 13,881 (100.0%) |
Housing Occupancy in Ross County
Occupancy by Ownership in Ross County
Of the total 29,565 dwellings in Ross County, owner-occupied units account for 20,949 (70.9%), while renter-occupied units make up 8,616 (29.1%).
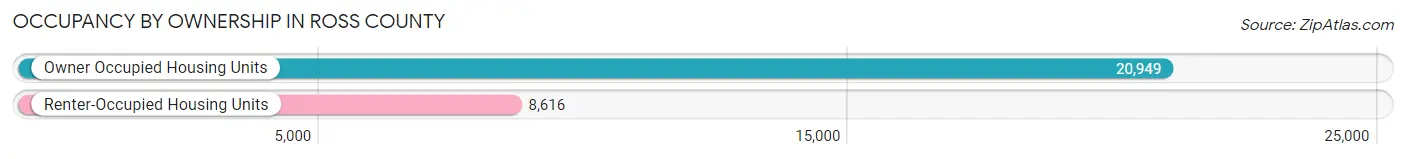
| Occupancy | # Housing Units | % Housing Units |
| Owner Occupied Housing Units | 20,949 | 70.9% |
| Renter-Occupied Housing Units | 8,616 | 29.1% |
| Total Occupied Housing Units | 29,565 | 100.0% |
Occupancy by Household Size in Ross County
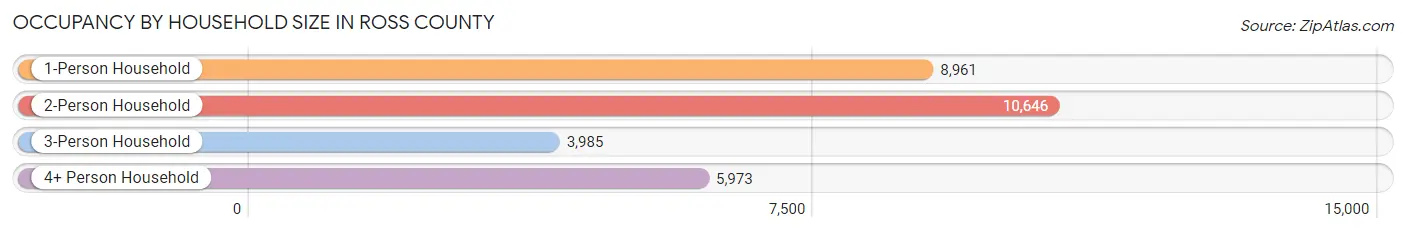
| Household Size | # Housing Units | % Housing Units |
| 1-Person Household | 8,961 | 30.3% |
| 2-Person Household | 10,646 | 36.0% |
| 3-Person Household | 3,985 | 13.5% |
| 4+ Person Household | 5,973 | 20.2% |
| Total Housing Units | 29,565 | 100.0% |
Occupancy by Ownership by Household Size in Ross County
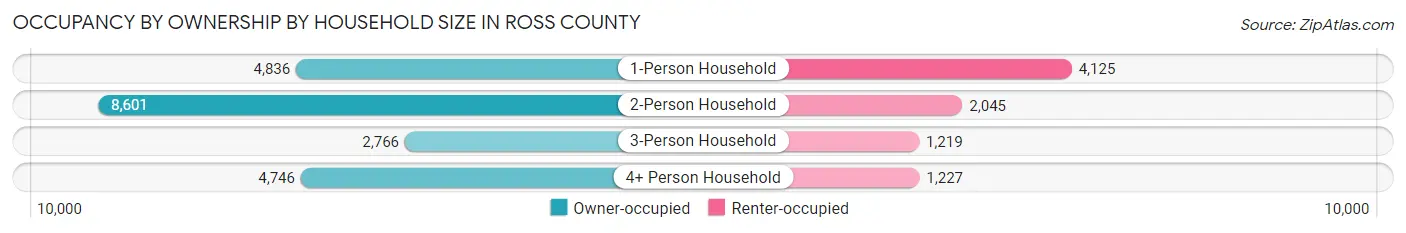
| Household Size | Owner-occupied | Renter-occupied |
| 1-Person Household | 4,836 (54.0%) | 4,125 (46.0%) |
| 2-Person Household | 8,601 (80.8%) | 2,045 (19.2%) |
| 3-Person Household | 2,766 (69.4%) | 1,219 (30.6%) |
| 4+ Person Household | 4,746 (79.5%) | 1,227 (20.5%) |
| Total Housing Units | 20,949 (70.9%) | 8,616 (29.1%) |
Occupancy by Educational Attainment in Ross County
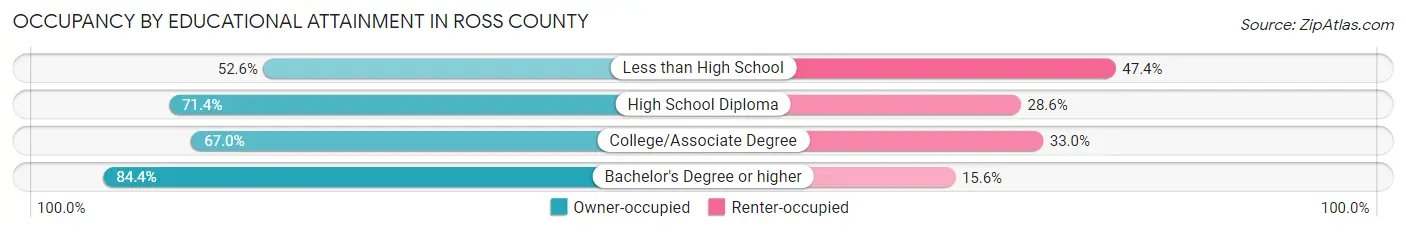
| Household Size | Owner-occupied | Renter-occupied |
| Less than High School | 1,304 (52.6%) | 1,176 (47.4%) |
| High School Diploma | 9,058 (71.4%) | 3,634 (28.6%) |
| College/Associate Degree | 5,989 (67.0%) | 2,955 (33.0%) |
| Bachelor's Degree or higher | 4,598 (84.4%) | 851 (15.6%) |
Occupancy by Age of Householder in Ross County
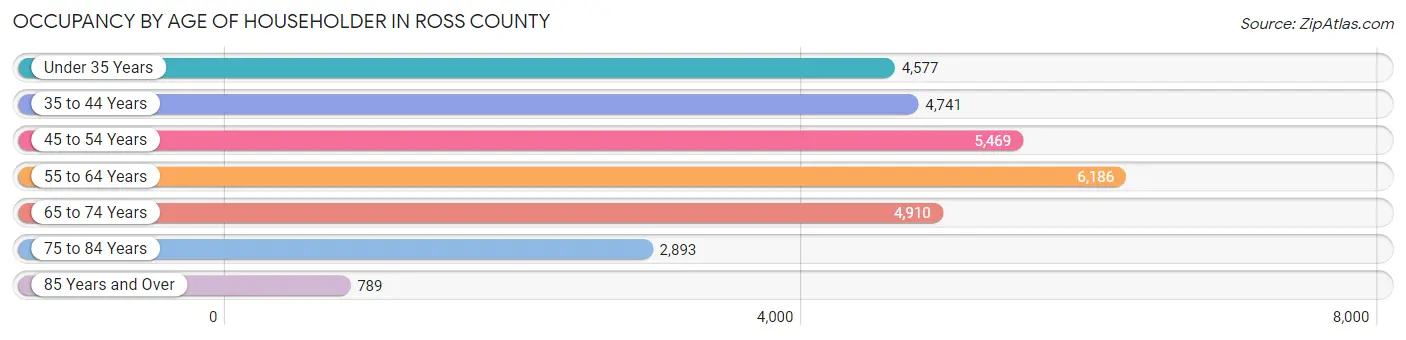
| Age Bracket | # Households | % Households |
| Under 35 Years | 4,577 | 15.5% |
| 35 to 44 Years | 4,741 | 16.0% |
| 45 to 54 Years | 5,469 | 18.5% |
| 55 to 64 Years | 6,186 | 20.9% |
| 65 to 74 Years | 4,910 | 16.6% |
| 75 to 84 Years | 2,893 | 9.8% |
| 85 Years and Over | 789 | 2.7% |
| Total | 29,565 | 100.0% |
Housing Finances in Ross County
Median Income by Occupancy in Ross County
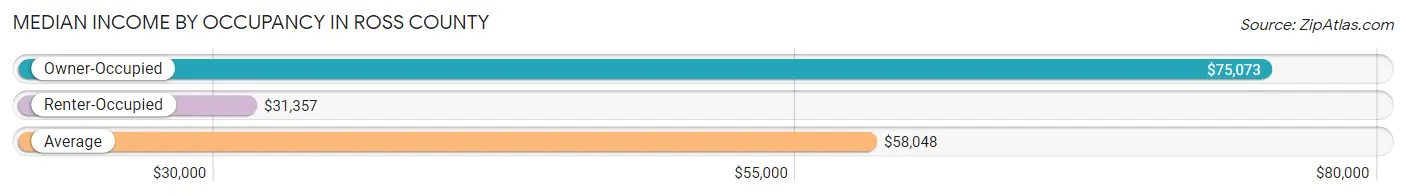
| Occupancy Type | # Households | Median Income |
| Owner-Occupied | 20,949 (70.9%) | $75,073 |
| Renter-Occupied | 8,616 (29.1%) | $31,357 |
| Average | 29,565 (100.0%) | $58,048 |
Occupancy by Householder Income Bracket in Ross County
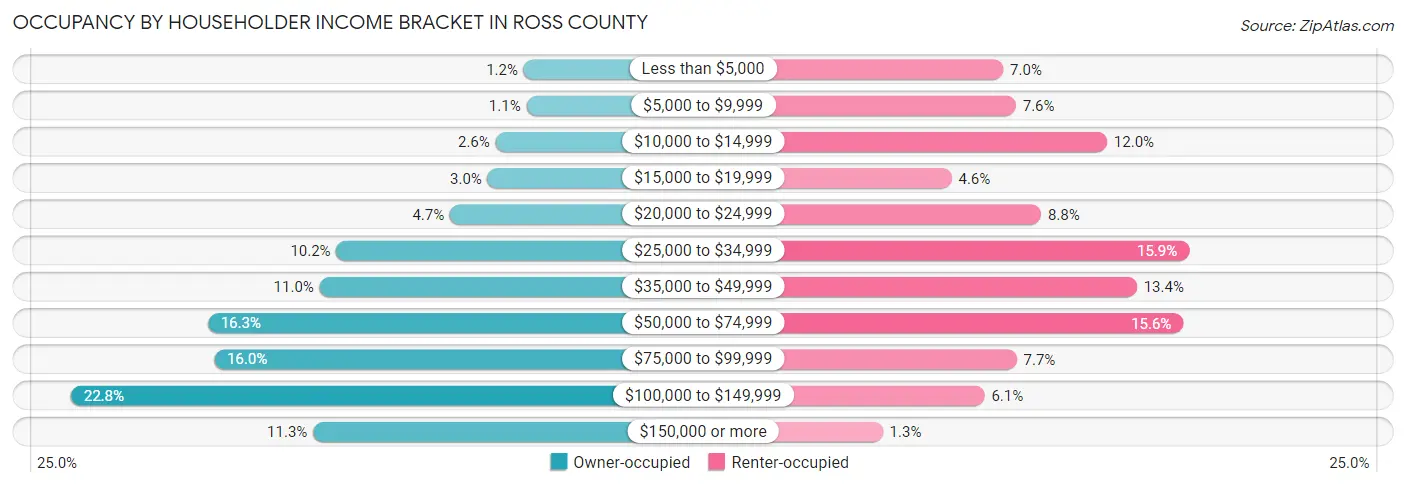
| Income Bracket | Owner-occupied | Renter-occupied |
| Less than $5,000 | 257 (1.2%) | 606 (7.0%) |
| $5,000 to $9,999 | 230 (1.1%) | 657 (7.6%) |
| $10,000 to $14,999 | 538 (2.6%) | 1,031 (12.0%) |
| $15,000 to $19,999 | 619 (2.9%) | 394 (4.6%) |
| $20,000 to $24,999 | 992 (4.7%) | 761 (8.8%) |
| $25,000 to $34,999 | 2,126 (10.2%) | 1,368 (15.9%) |
| $35,000 to $49,999 | 2,293 (11.0%) | 1,154 (13.4%) |
| $50,000 to $74,999 | 3,410 (16.3%) | 1,344 (15.6%) |
| $75,000 to $99,999 | 3,348 (16.0%) | 661 (7.7%) |
| $100,000 to $149,999 | 4,777 (22.8%) | 529 (6.1%) |
| $150,000 or more | 2,359 (11.3%) | 111 (1.3%) |
| Total | 20,949 (100.0%) | 8,616 (100.0%) |
Monthly Housing Cost Tiers in Ross County
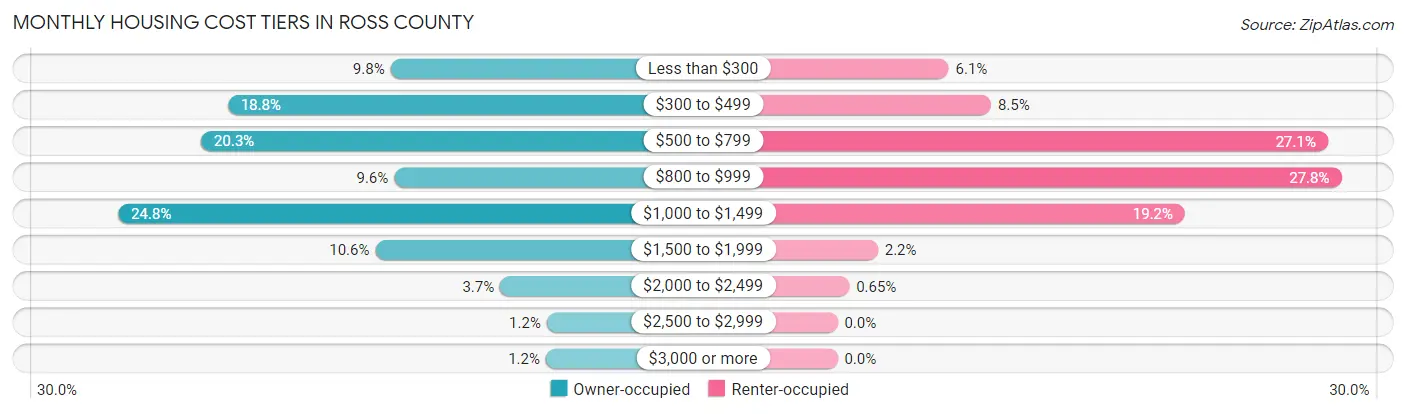
| Monthly Cost | Owner-occupied | Renter-occupied |
| Less than $300 | 2,050 (9.8%) | 529 (6.1%) |
| $300 to $499 | 3,934 (18.8%) | 731 (8.5%) |
| $500 to $799 | 4,245 (20.3%) | 2,333 (27.1%) |
| $800 to $999 | 2,010 (9.6%) | 2,398 (27.8%) |
| $1,000 to $1,499 | 5,204 (24.8%) | 1,653 (19.2%) |
| $1,500 to $1,999 | 2,226 (10.6%) | 192 (2.2%) |
| $2,000 to $2,499 | 784 (3.7%) | 56 (0.6%) |
| $2,500 to $2,999 | 243 (1.2%) | 0 (0.0%) |
| $3,000 or more | 253 (1.2%) | 0 (0.0%) |
| Total | 20,949 (100.0%) | 8,616 (100.0%) |
Physical Housing Characteristics in Ross County
Housing Structures in Ross County
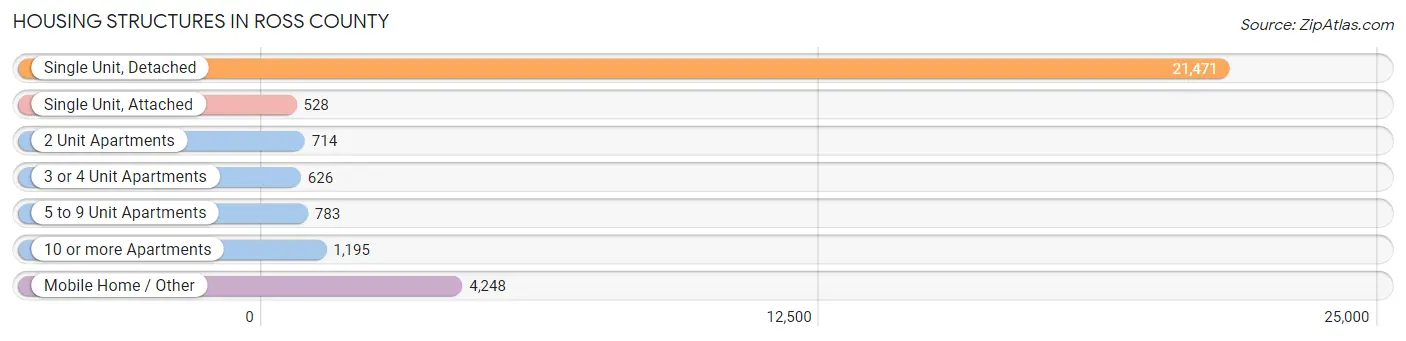
| Structure Type | # Housing Units | % Housing Units |
| Single Unit, Detached | 21,471 | 72.6% |
| Single Unit, Attached | 528 | 1.8% |
| 2 Unit Apartments | 714 | 2.4% |
| 3 or 4 Unit Apartments | 626 | 2.1% |
| 5 to 9 Unit Apartments | 783 | 2.6% |
| 10 or more Apartments | 1,195 | 4.0% |
| Mobile Home / Other | 4,248 | 14.4% |
| Total | 29,565 | 100.0% |
Housing Structures by Occupancy in Ross County
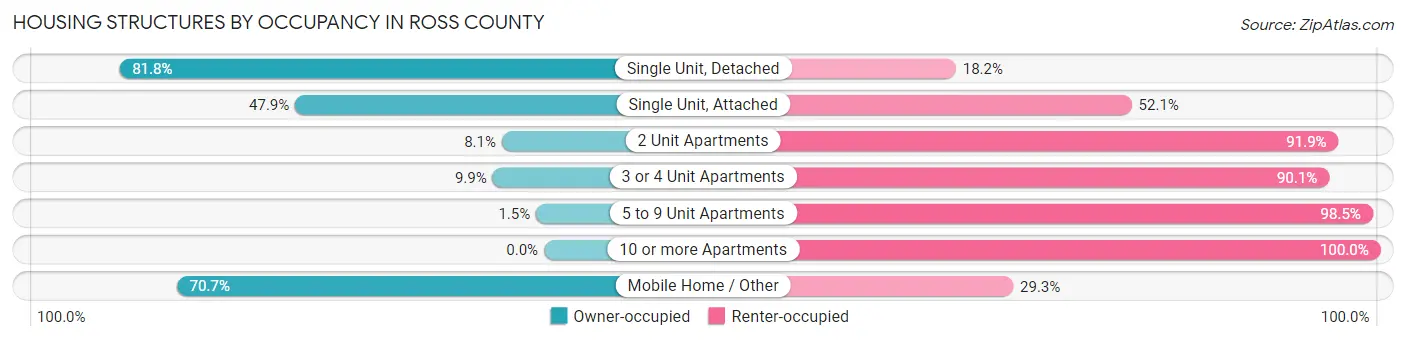
| Structure Type | Owner-occupied | Renter-occupied |
| Single Unit, Detached | 17,559 (81.8%) | 3,912 (18.2%) |
| Single Unit, Attached | 253 (47.9%) | 275 (52.1%) |
| 2 Unit Apartments | 58 (8.1%) | 656 (91.9%) |
| 3 or 4 Unit Apartments | 62 (9.9%) | 564 (90.1%) |
| 5 to 9 Unit Apartments | 12 (1.5%) | 771 (98.5%) |
| 10 or more Apartments | 0 (0.0%) | 1,195 (100.0%) |
| Mobile Home / Other | 3,005 (70.7%) | 1,243 (29.3%) |
| Total | 20,949 (70.9%) | 8,616 (29.1%) |
Housing Structures by Number of Rooms in Ross County
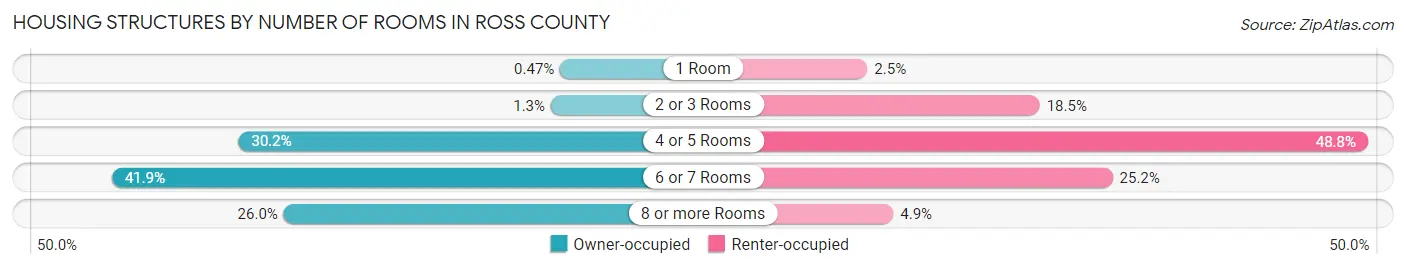
| Number of Rooms | Owner-occupied | Renter-occupied |
| 1 Room | 98 (0.5%) | 219 (2.5%) |
| 2 or 3 Rooms | 279 (1.3%) | 1,592 (18.5%) |
| 4 or 5 Rooms | 6,332 (30.2%) | 4,206 (48.8%) |
| 6 or 7 Rooms | 8,785 (41.9%) | 2,173 (25.2%) |
| 8 or more Rooms | 5,455 (26.0%) | 426 (4.9%) |
| Total | 20,949 (100.0%) | 8,616 (100.0%) |
Housing Structure by Heating Type in Ross County
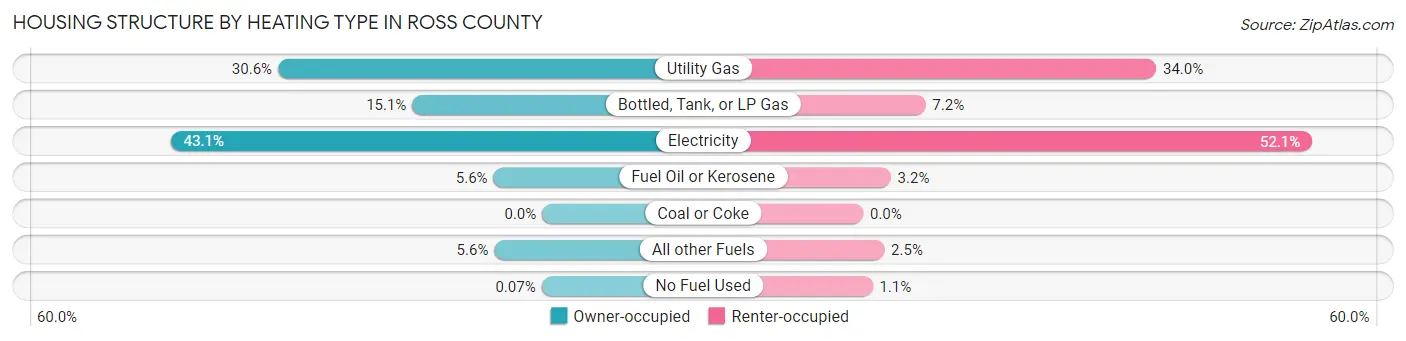
| Heating Type | Owner-occupied | Renter-occupied |
| Utility Gas | 6,416 (30.6%) | 2,927 (34.0%) |
| Bottled, Tank, or LP Gas | 3,154 (15.1%) | 623 (7.2%) |
| Electricity | 9,020 (43.1%) | 4,485 (52.0%) |
| Fuel Oil or Kerosene | 1,181 (5.6%) | 276 (3.2%) |
| Coal or Coke | 0 (0.0%) | 0 (0.0%) |
| All other Fuels | 1,163 (5.6%) | 211 (2.5%) |
| No Fuel Used | 15 (0.1%) | 94 (1.1%) |
| Total | 20,949 (100.0%) | 8,616 (100.0%) |
Household Vehicle Usage in Ross County
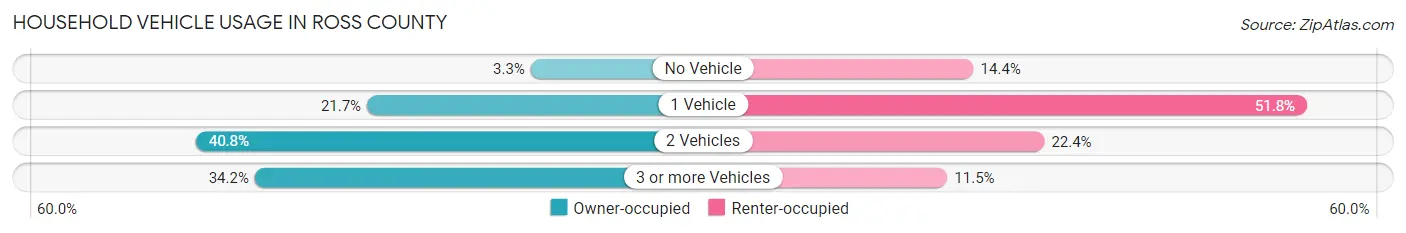
| Vehicles per Household | Owner-occupied | Renter-occupied |
| No Vehicle | 693 (3.3%) | 1,242 (14.4%) |
| 1 Vehicle | 4,536 (21.6%) | 4,459 (51.7%) |
| 2 Vehicles | 8,552 (40.8%) | 1,926 (22.4%) |
| 3 or more Vehicles | 7,168 (34.2%) | 989 (11.5%) |
| Total | 20,949 (100.0%) | 8,616 (100.0%) |
Real Estate & Mortgages in Ross County
Real Estate and Mortgage Overview in Ross County
| Characteristic | Without Mortgage | With Mortgage |
| Housing Units | 9,642 | 11,307 |
| Median Property Value | $126,400 | $164,900 |
| Median Household Income | $52,726 | $1,612 |
| Monthly Housing Costs | $462 | $253 |
| Real Estate Taxes | $1,391 | $244 |
Property Value by Mortgage Status in Ross County
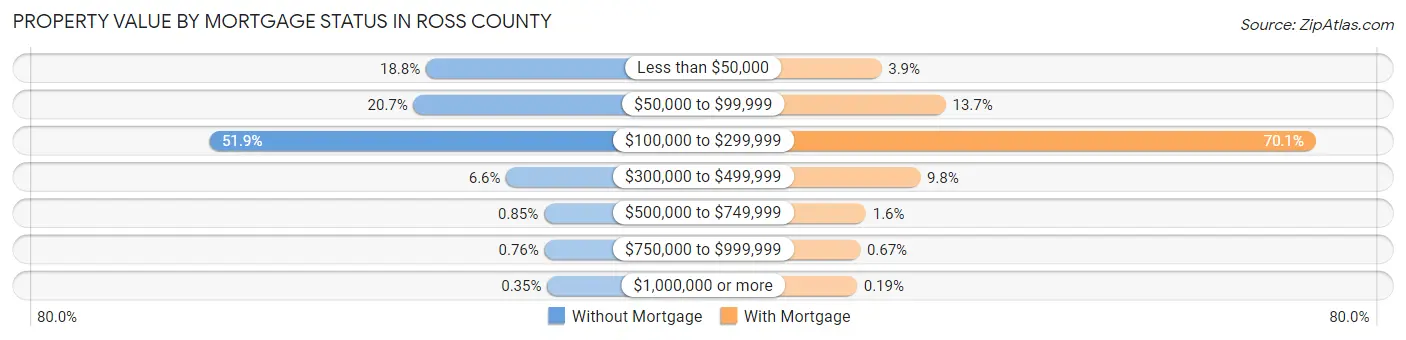
| Property Value | Without Mortgage | With Mortgage |
| Less than $50,000 | 1,816 (18.8%) | 443 (3.9%) |
| $50,000 to $99,999 | 1,998 (20.7%) | 1,551 (13.7%) |
| $100,000 to $299,999 | 5,004 (51.9%) | 7,930 (70.1%) |
| $300,000 to $499,999 | 635 (6.6%) | 1,110 (9.8%) |
| $500,000 to $749,999 | 82 (0.9%) | 176 (1.6%) |
| $750,000 to $999,999 | 73 (0.8%) | 76 (0.7%) |
| $1,000,000 or more | 34 (0.4%) | 21 (0.2%) |
| Total | 9,642 (100.0%) | 11,307 (100.0%) |
Household Income by Mortgage Status in Ross County
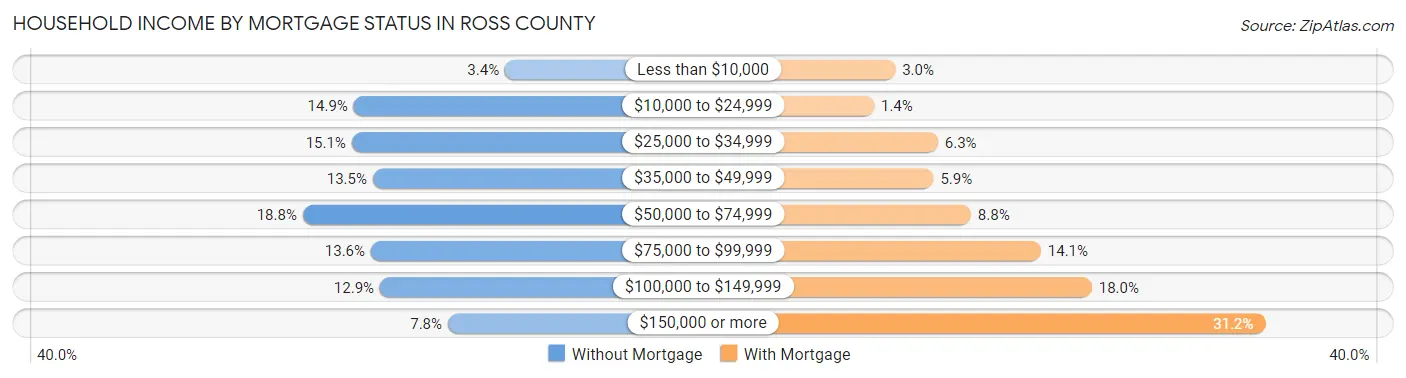
| Household Income | Without Mortgage | With Mortgage |
| Less than $10,000 | 328 (3.4%) | 342 (3.0%) |
| $10,000 to $24,999 | 1,440 (14.9%) | 159 (1.4%) |
| $25,000 to $34,999 | 1,454 (15.1%) | 709 (6.3%) |
| $35,000 to $49,999 | 1,299 (13.5%) | 672 (5.9%) |
| $50,000 to $74,999 | 1,814 (18.8%) | 994 (8.8%) |
| $75,000 to $99,999 | 1,313 (13.6%) | 1,596 (14.1%) |
| $100,000 to $149,999 | 1,247 (12.9%) | 2,035 (18.0%) |
| $150,000 or more | 747 (7.7%) | 3,530 (31.2%) |
| Total | 9,642 (100.0%) | 11,307 (100.0%) |
Property Value to Household Income Ratio in Ross County
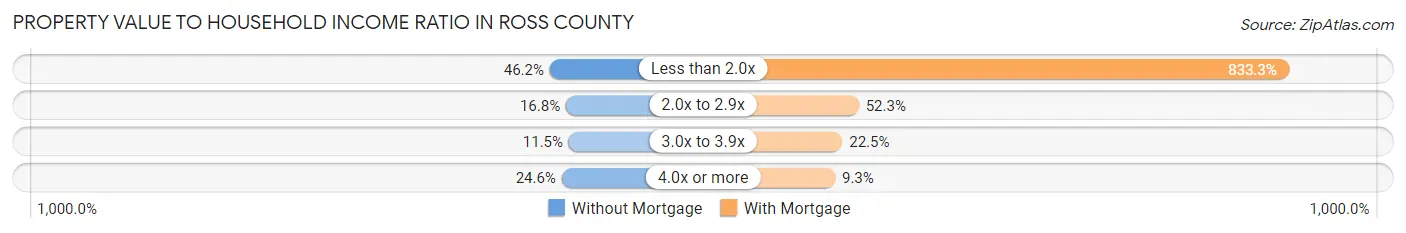
| Value-to-Income Ratio | Without Mortgage | With Mortgage |
| Less than 2.0x | 4,456 (46.2%) | 94,222 (833.3%) |
| 2.0x to 2.9x | 1,617 (16.8%) | 5,913 (52.3%) |
| 3.0x to 3.9x | 1,113 (11.5%) | 2,538 (22.5%) |
| 4.0x or more | 2,373 (24.6%) | 1,053 (9.3%) |
| Total | 9,642 (100.0%) | 11,307 (100.0%) |
Real Estate Taxes by Mortgage Status in Ross County
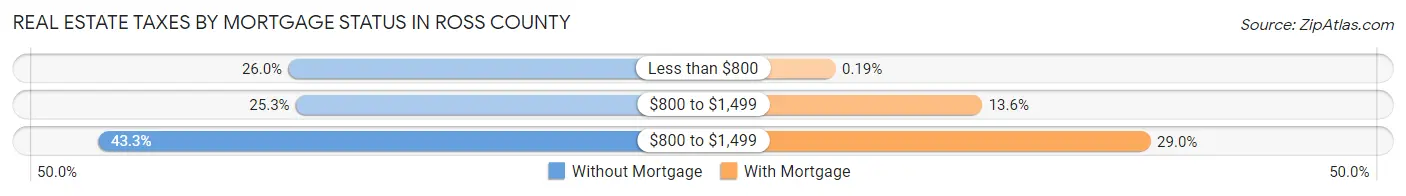
| Property Taxes | Without Mortgage | With Mortgage |
| Less than $800 | 2,502 (26.0%) | 22 (0.2%) |
| $800 to $1,499 | 2,437 (25.3%) | 1,535 (13.6%) |
| $800 to $1,499 | 4,174 (43.3%) | 3,275 (29.0%) |
| Total | 9,642 (100.0%) | 11,307 (100.0%) |
Health & Disability in Ross County
Health Insurance Coverage by Age in Ross County
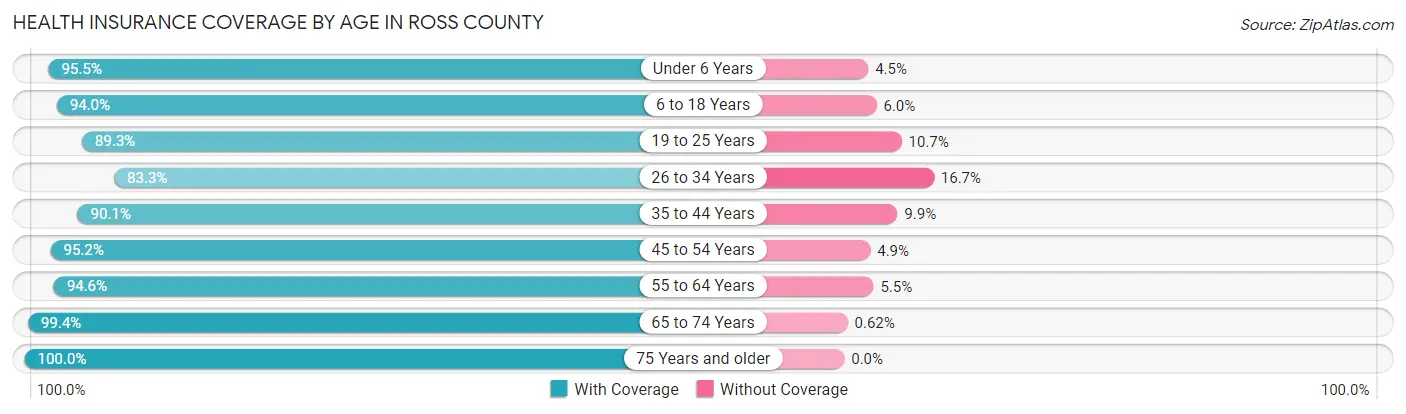
| Age Bracket | With Coverage | Without Coverage |
| Under 6 Years | 4,611 (95.5%) | 215 (4.5%) |
| 6 to 18 Years | 11,473 (94.0%) | 733 (6.0%) |
| 19 to 25 Years | 5,178 (89.3%) | 620 (10.7%) |
| 26 to 34 Years | 5,959 (83.3%) | 1,195 (16.7%) |
| 35 to 44 Years | 8,063 (90.1%) | 886 (9.9%) |
| 45 to 54 Years | 9,464 (95.2%) | 482 (4.9%) |
| 55 to 64 Years | 9,697 (94.6%) | 559 (5.4%) |
| 65 to 74 Years | 7,533 (99.4%) | 47 (0.6%) |
| 75 Years and older | 5,075 (100.0%) | 0 (0.0%) |
| Total | 67,053 (93.4%) | 4,737 (6.6%) |
Health Insurance Coverage by Citizenship Status in Ross County
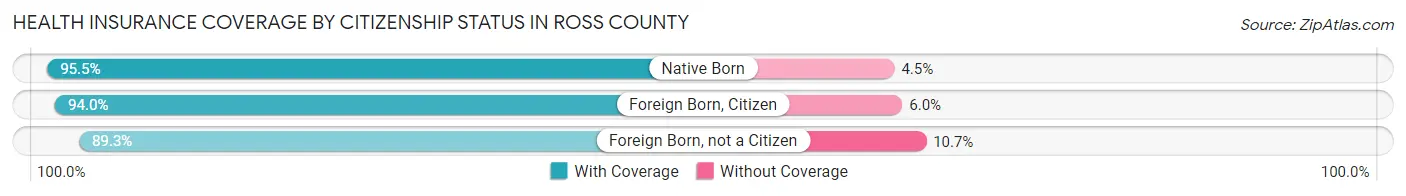
| Citizenship Status | With Coverage | Without Coverage |
| Native Born | 4,611 (95.5%) | 215 (4.5%) |
| Foreign Born, Citizen | 11,473 (94.0%) | 733 (6.0%) |
| Foreign Born, not a Citizen | 5,178 (89.3%) | 620 (10.7%) |
Health Insurance Coverage by Household Income in Ross County
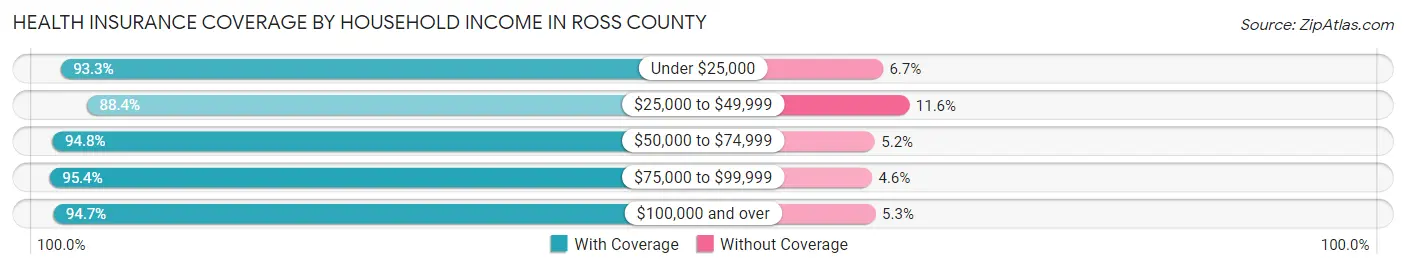
| Household Income | With Coverage | Without Coverage |
| Under $25,000 | 9,805 (93.3%) | 702 (6.7%) |
| $25,000 to $49,999 | 12,345 (88.4%) | 1,624 (11.6%) |
| $50,000 to $74,999 | 10,162 (94.8%) | 554 (5.2%) |
| $75,000 to $99,999 | 10,453 (95.4%) | 507 (4.6%) |
| $100,000 and over | 24,077 (94.7%) | 1,350 (5.3%) |
Public vs Private Health Insurance Coverage by Age in Ross County
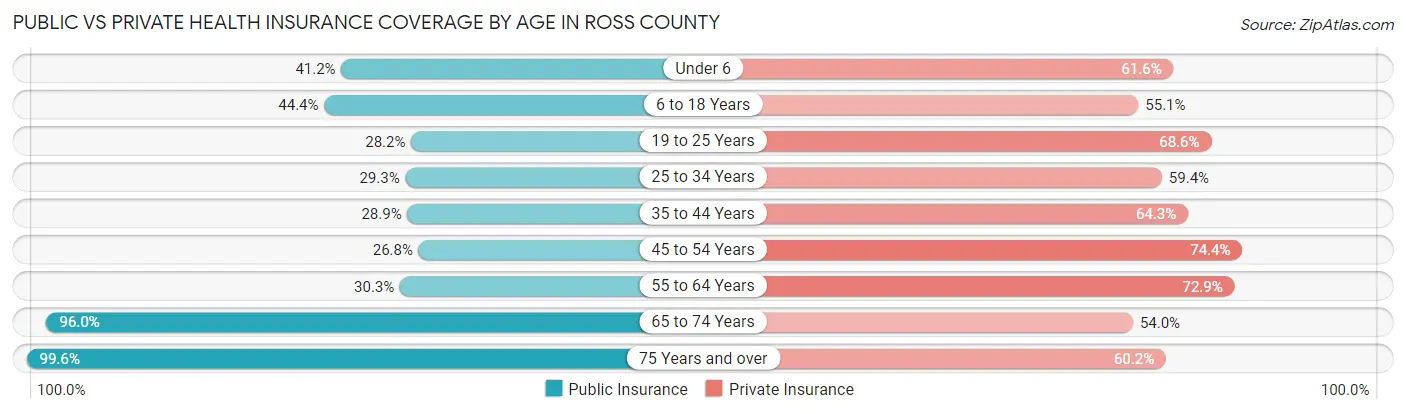
| Age Bracket | Public Insurance | Private Insurance |
| Under 6 | 1,988 (41.2%) | 2,971 (61.6%) |
| 6 to 18 Years | 5,414 (44.4%) | 6,719 (55.0%) |
| 19 to 25 Years | 1,636 (28.2%) | 3,976 (68.6%) |
| 25 to 34 Years | 2,096 (29.3%) | 4,251 (59.4%) |
| 35 to 44 Years | 2,589 (28.9%) | 5,751 (64.3%) |
| 45 to 54 Years | 2,669 (26.8%) | 7,395 (74.4%) |
| 55 to 64 Years | 3,108 (30.3%) | 7,477 (72.9%) |
| 65 to 74 Years | 7,273 (96.0%) | 4,096 (54.0%) |
| 75 Years and over | 5,056 (99.6%) | 3,054 (60.2%) |
| Total | 31,829 (44.3%) | 45,690 (63.6%) |
Disability Status by Sex by Age in Ross County
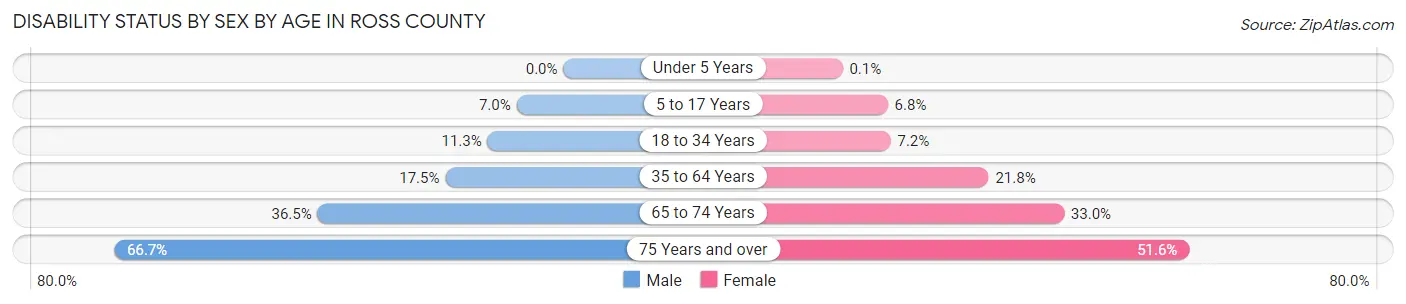
| Age Bracket | Male | Female |
| Under 5 Years | 0 (0.0%) | 2 (0.1%) |
| 5 to 17 Years | 431 (7.0%) | 398 (6.8%) |
| 18 to 34 Years | 777 (11.3%) | 498 (7.2%) |
| 35 to 64 Years | 2,568 (17.5%) | 3,160 (21.8%) |
| 65 to 74 Years | 1,288 (36.5%) | 1,336 (33.0%) |
| 75 Years and over | 1,428 (66.7%) | 1,514 (51.6%) |
Disability Class by Sex by Age in Ross County
Disability Class: Hearing Difficulty
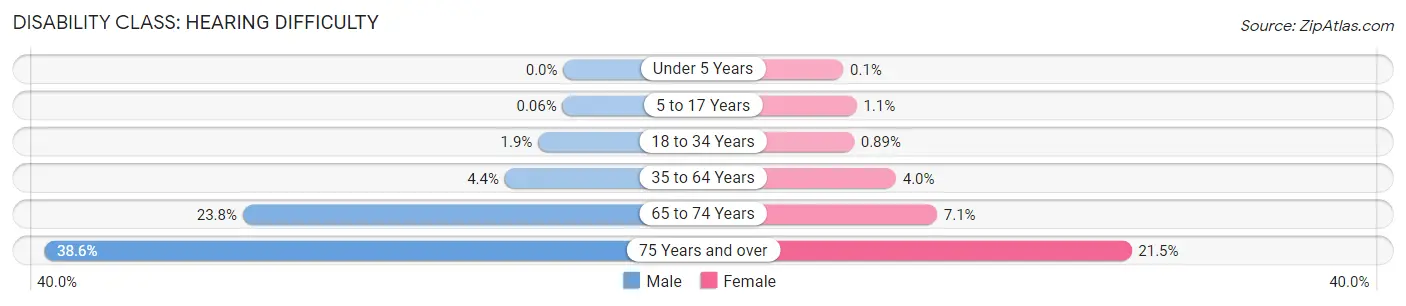
| Age Bracket | Male | Female |
| Under 5 Years | 0 (0.0%) | 2 (0.1%) |
| 5 to 17 Years | 4 (0.1%) | 64 (1.1%) |
| 18 to 34 Years | 129 (1.9%) | 61 (0.9%) |
| 35 to 64 Years | 637 (4.3%) | 581 (4.0%) |
| 65 to 74 Years | 840 (23.8%) | 286 (7.1%) |
| 75 Years and over | 825 (38.6%) | 631 (21.5%) |
Disability Class: Vision Difficulty
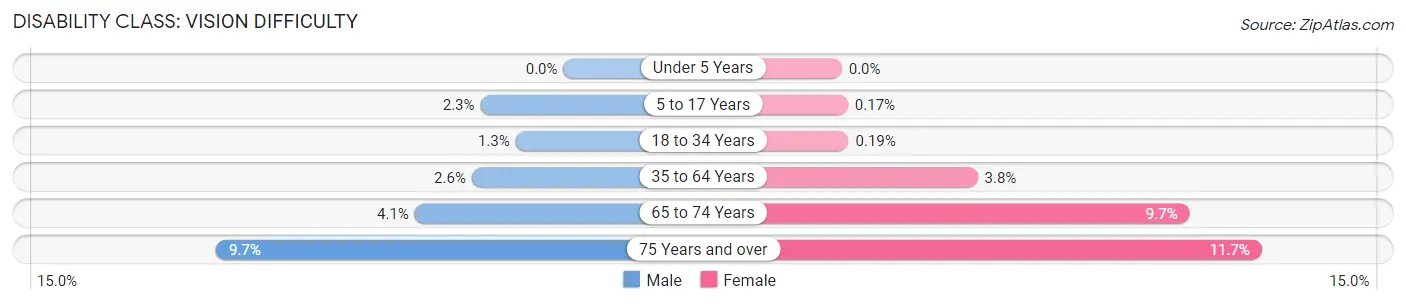
| Age Bracket | Male | Female |
| Under 5 Years | 0 (0.0%) | 0 (0.0%) |
| 5 to 17 Years | 143 (2.3%) | 10 (0.2%) |
| 18 to 34 Years | 92 (1.3%) | 13 (0.2%) |
| 35 to 64 Years | 373 (2.5%) | 549 (3.8%) |
| 65 to 74 Years | 146 (4.1%) | 392 (9.7%) |
| 75 Years and over | 207 (9.7%) | 343 (11.7%) |
Disability Class: Cognitive Difficulty
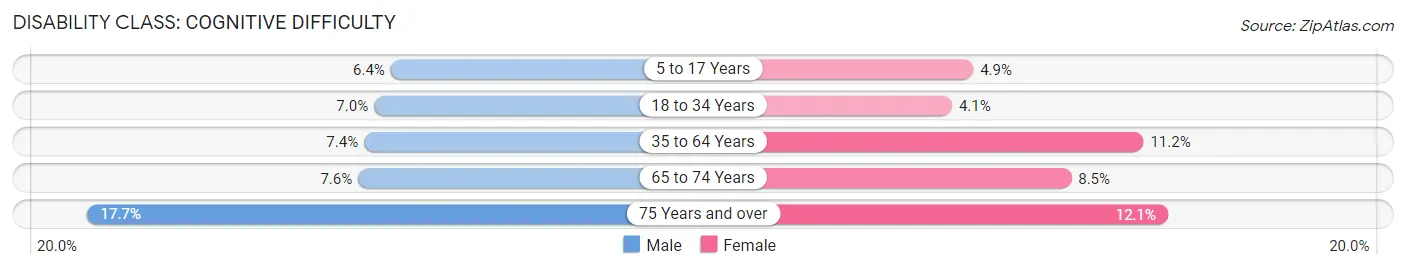
| Age Bracket | Male | Female |
| 5 to 17 Years | 397 (6.4%) | 285 (4.9%) |
| 18 to 34 Years | 485 (7.0%) | 281 (4.1%) |
| 35 to 64 Years | 1,083 (7.4%) | 1,624 (11.2%) |
| 65 to 74 Years | 269 (7.6%) | 345 (8.5%) |
| 75 Years and over | 378 (17.7%) | 355 (12.1%) |
Disability Class: Ambulatory Difficulty
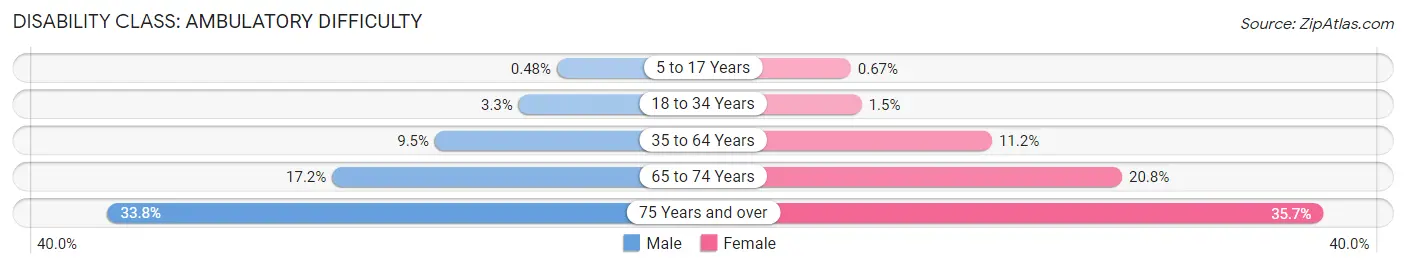
| Age Bracket | Male | Female |
| 5 to 17 Years | 30 (0.5%) | 39 (0.7%) |
| 18 to 34 Years | 229 (3.3%) | 102 (1.5%) |
| 35 to 64 Years | 1,397 (9.5%) | 1,618 (11.2%) |
| 65 to 74 Years | 606 (17.2%) | 843 (20.8%) |
| 75 Years and over | 724 (33.8%) | 1,049 (35.7%) |
Disability Class: Self-Care Difficulty
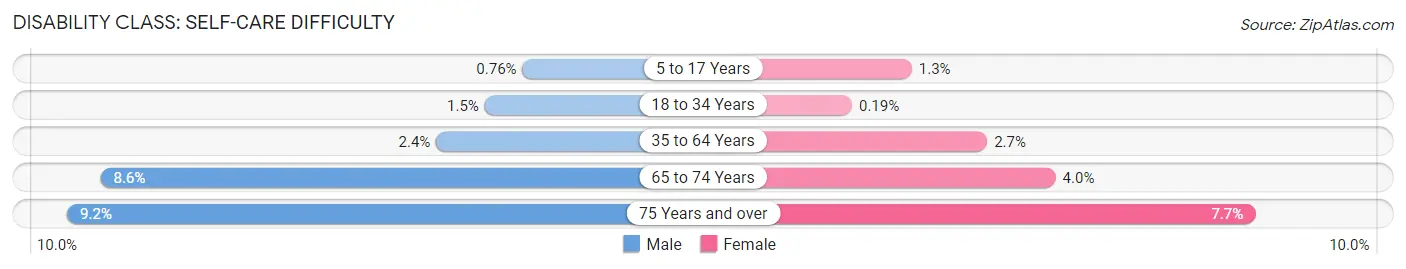
| Age Bracket | Male | Female |
| 5 to 17 Years | 47 (0.8%) | 76 (1.3%) |
| 18 to 34 Years | 101 (1.5%) | 13 (0.2%) |
| 35 to 64 Years | 346 (2.4%) | 392 (2.7%) |
| 65 to 74 Years | 303 (8.6%) | 161 (4.0%) |
| 75 Years and over | 197 (9.2%) | 225 (7.7%) |
Technology Access in Ross County
Computing Device Access in Ross County
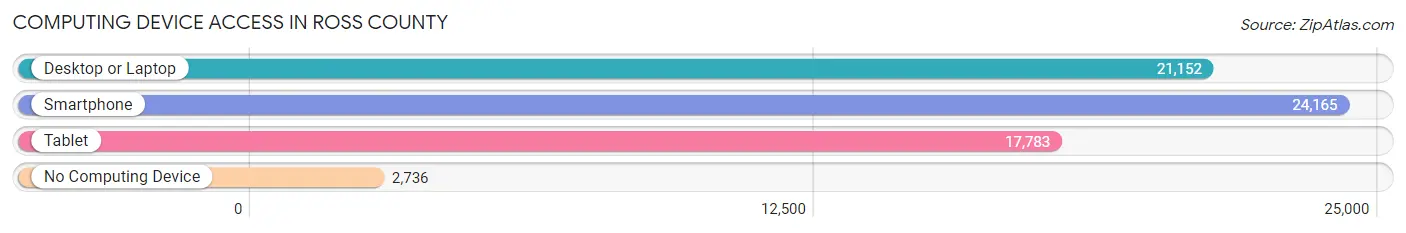
| Device Type | # Households | % Households |
| Desktop or Laptop | 21,152 | 71.5% |
| Smartphone | 24,165 | 81.7% |
| Tablet | 17,783 | 60.2% |
| No Computing Device | 2,736 | 9.2% |
| Total | 29,565 | 100.0% |
Internet Access in Ross County
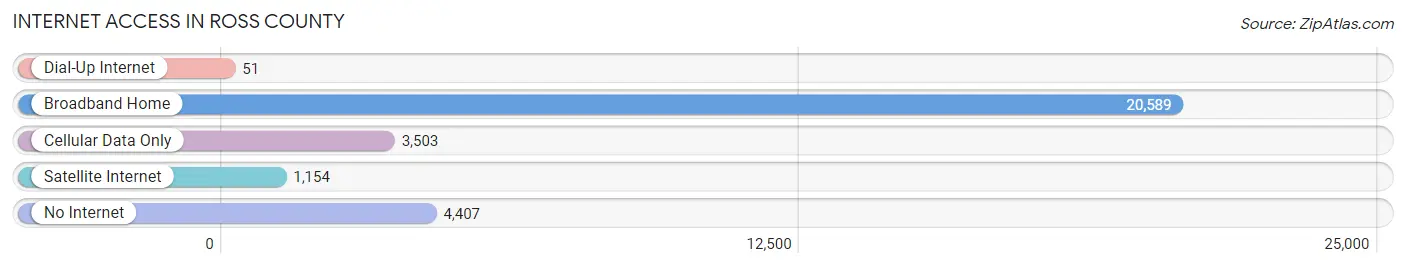
| Internet Type | # Households | % Households |
| Dial-Up Internet | 51 | 0.2% |
| Broadband Home | 20,589 | 69.6% |
| Cellular Data Only | 3,503 | 11.8% |
| Satellite Internet | 1,154 | 3.9% |
| No Internet | 4,407 | 14.9% |
| Total | 29,565 | 100.0% |
Ross County Summary
Ross County is located in the south-central region of Ohio, and is part of the Chillicothe Micropolitan Statistical Area. The county seat is Chillicothe, which is also the largest city in the county. Ross County was established in 1798 and is named after James Ross, a senator from Pennsylvania. The county covers an area of 664 square miles and has a population of 78,064 as of the 2010 census.
History
The area that is now Ross County was originally inhabited by the Shawnee and Mingo Native American tribes. The first European settlers arrived in the area in the late 1700s, and the county was officially established in 1798. The county was named after James Ross, a senator from Pennsylvania.
During the early 1800s, the county was a major center of the Underground Railroad, with many residents helping to hide and transport escaped slaves. The county was also home to several Civil War battles, including the Battle of Buffington Island and the Battle of Piketon.
In the late 1800s, the county experienced a period of economic growth, with the development of the railroad and the establishment of several industries. This period of growth continued into the early 1900s, with the county becoming a major center of manufacturing and industry.
Geography
Ross County is located in the south-central region of Ohio, and is part of the Chillicothe Micropolitan Statistical Area. The county covers an area of 664 square miles and has a population of 78,064 as of the 2010 census.
The county is bordered by Pickaway County to the north, Fayette County to the east, Highland County to the south, and Adams and Scioto Counties to the west. The county is located in the Appalachian Plateau region of Ohio, and is characterized by rolling hills and valleys. The county is home to several rivers, including the Scioto, Paint, and Little Miami Rivers.
Economy
Ross County has a diverse economy, with a mix of manufacturing, agriculture, and service industries. The county is home to several major employers, including Kenworth Truck Company, Adena Health System, and the Chillicothe VA Medical Center.
Agriculture is an important part of the county’s economy, with the county being home to several large farms. The county is also home to several wineries and vineyards, which produce a variety of wines.
Demographics
As of the 2010 census, Ross County had a population of 78,064. The racial makeup of the county was 94.2% White, 2.7% African American, 0.4% Native American, 0.5% Asian, 0.1% Pacific Islander, 0.7% from other races, and 1.5% from two or more races. Hispanic or Latino of any race were 1.9% of the population.
The median income for a household in the county was $41,945, and the median income for a family was $50,945. The per capita income for the county was $20,945. About 11.2% of families and 14.3% of the population were below the poverty line, including 19.2% of those under age 18 and 8.7% of those age 65 or over.
Common Questions
What is Per Capita Income in Ross County?
Per Capita income in Ross County is $29,718.
What is the Median Family Income in Ross County?
Median Family Income in Ross County is $76,899.
What is the Median Household income in Ross County?
Median Household Income in Ross County is $58,048.
What is Income or Wage Gap in Ross County?
Income or Wage Gap in Ross County is 32.7%.
Women in Ross County earn 67.3 cents for every dollar earned by a man.
What is Family Income Deficit in Ross County?
Family Income Deficit in Ross County is $11,474.
Families that are below poverty line in Ross County earn $11,474 less on average than the poverty threshold level.
What is Inequality or Gini Index in Ross County?
Inequality or Gini Index in Ross County is 0.45.
What is the Total Population of Ross County?
Total Population of Ross County is 76,957.
What is the Total Male Population of Ross County?
Total Male Population of Ross County is 40,257.
What is the Total Female Population of Ross County?
Total Female Population of Ross County is 36,700.
What is the Ratio of Males per 100 Females in Ross County?
There are 109.69 Males per 100 Females in Ross County.
What is the Ratio of Females per 100 Males in Ross County?
There are 91.16 Females per 100 Males in Ross County.
What is the Median Population Age in Ross County?
Median Population Age in Ross County is 41.3 Years.
What is the Average Family Size in Ross County
Average Family Size in Ross County is 3.0 People.
What is the Average Household Size in Ross County
Average Household Size in Ross County is 2.4 People.
How Large is the Labor Force in Ross County?
There are 33,745 People in the Labor Forcein in Ross County.
What is the Percentage of People in the Labor Force in Ross County?
53.8% of People are in the Labor Force in Ross County.
What is the Unemployment Rate in Ross County?
Unemployment Rate in Ross County is 5.7%.