Pickaway County, OH Map & Demographics
Pickaway County Map
Pickaway County Overview
$32,689
PER CAPITA INCOME
$84,187
AVG FAMILY INCOME
$67,600
AVG HOUSEHOLD INCOME
22.5%
WAGE / INCOME GAP [ % ]
77.5¢/ $1
WAGE / INCOME GAP [ $ ]
$11,959
FAMILY INCOME DEFICIT
0.43
INEQUALITY / GINI INDEX
58,809
TOTAL POPULATION
31,103
MALE POPULATION
27,706
FEMALE POPULATION
112.26
MALES / 100 FEMALES
89.08
FEMALES / 100 MALES
39.5
MEDIAN AGE
3.1
AVG FAMILY SIZE
2.6
AVG HOUSEHOLD SIZE
27,020
LABOR FORCE [ PEOPLE ]
56.6%
PERCENT IN LABOR FORCE
4.1%
UNEMPLOYMENT RATE
Income in Pickaway County
Income Overview in Pickaway County
Per Capita Income in Pickaway County is $32,689, while median incomes of families and households are $84,187 and $67,600 respectively.
| Characteristic | Number | Measure |
| Per Capita Income | 58,809 | $32,689 |
| Median Family Income | 14,673 | $84,187 |
| Mean Family Income | 14,673 | $99,372 |
| Median Household Income | 21,074 | $67,600 |
| Mean Household Income | 21,074 | $86,737 |
| Income Deficit | 14,673 | $11,959 |
| Wage / Income Gap (%) | 58,809 | 22.55% |
| Wage / Income Gap ($) | 58,809 | 77.45¢ per $1 |
| Gini / Inequality Index | 58,809 | 0.43 |
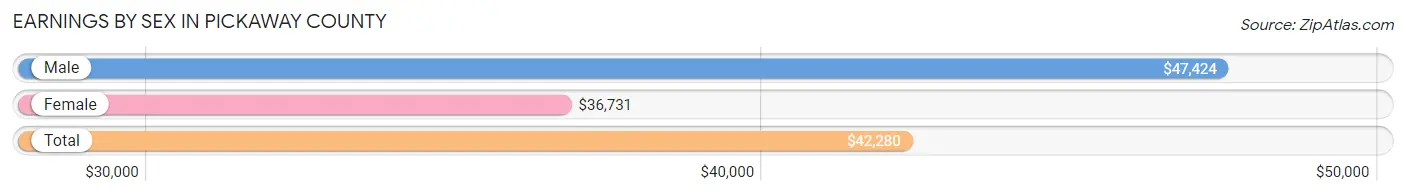
Earnings by Sex in Pickaway County
Average Earnings in Pickaway County are $42,280, $47,424 for men and $36,731 for women, a difference of 22.6%.
| Sex | Number | Average Earnings |
| Male | 16,141 (55.0%) | $47,424 |
| Female | 13,227 (45.0%) | $36,731 |
| Total | 29,368 (100.0%) | $42,280 |
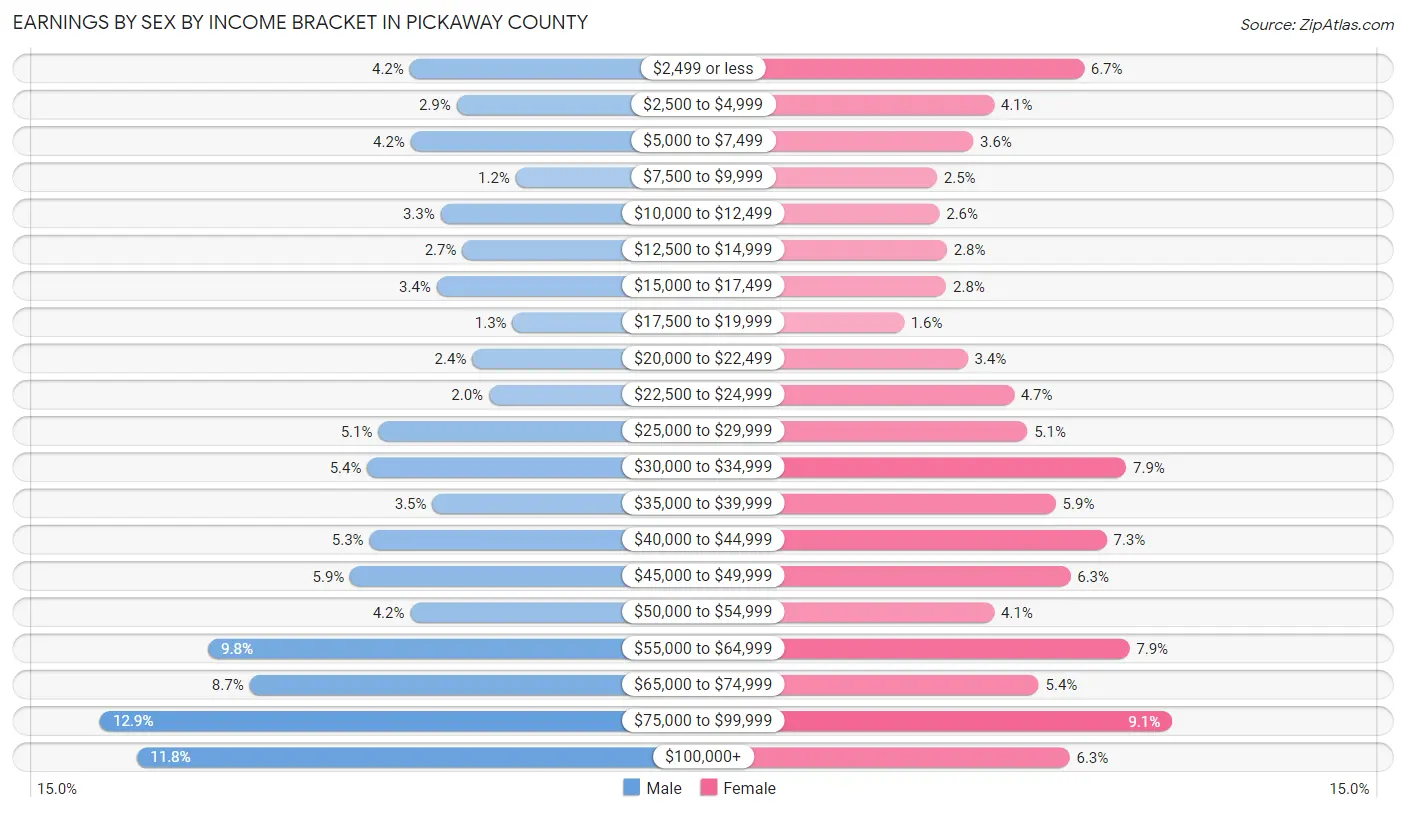
Earnings by Sex by Income Bracket in Pickaway County
The most common earnings brackets in Pickaway County are $75,000 to $99,999 for men (2,079 | 12.9%) and $75,000 to $99,999 for women (1,209 | 9.1%).
| Income | Male | Female |
| $2,499 or less | 674 (4.2%) | 881 (6.7%) |
| $2,500 to $4,999 | 461 (2.9%) | 546 (4.1%) |
| $5,000 to $7,499 | 670 (4.2%) | 470 (3.5%) |
| $7,500 to $9,999 | 194 (1.2%) | 335 (2.5%) |
| $10,000 to $12,499 | 535 (3.3%) | 344 (2.6%) |
| $12,500 to $14,999 | 436 (2.7%) | 372 (2.8%) |
| $15,000 to $17,499 | 552 (3.4%) | 369 (2.8%) |
| $17,500 to $19,999 | 208 (1.3%) | 211 (1.6%) |
| $20,000 to $22,499 | 391 (2.4%) | 449 (3.4%) |
| $22,500 to $24,999 | 314 (1.9%) | 621 (4.7%) |
| $25,000 to $29,999 | 816 (5.1%) | 670 (5.1%) |
| $30,000 to $34,999 | 866 (5.4%) | 1,038 (7.9%) |
| $35,000 to $39,999 | 572 (3.5%) | 777 (5.9%) |
| $40,000 to $44,999 | 857 (5.3%) | 965 (7.3%) |
| $45,000 to $49,999 | 944 (5.9%) | 831 (6.3%) |
| $50,000 to $54,999 | 672 (4.2%) | 548 (4.1%) |
| $55,000 to $64,999 | 1,589 (9.8%) | 1,050 (7.9%) |
| $65,000 to $74,999 | 1,401 (8.7%) | 713 (5.4%) |
| $75,000 to $99,999 | 2,079 (12.9%) | 1,209 (9.1%) |
| $100,000+ | 1,910 (11.8%) | 828 (6.3%) |
| Total | 16,141 (100.0%) | 13,227 (100.0%) |
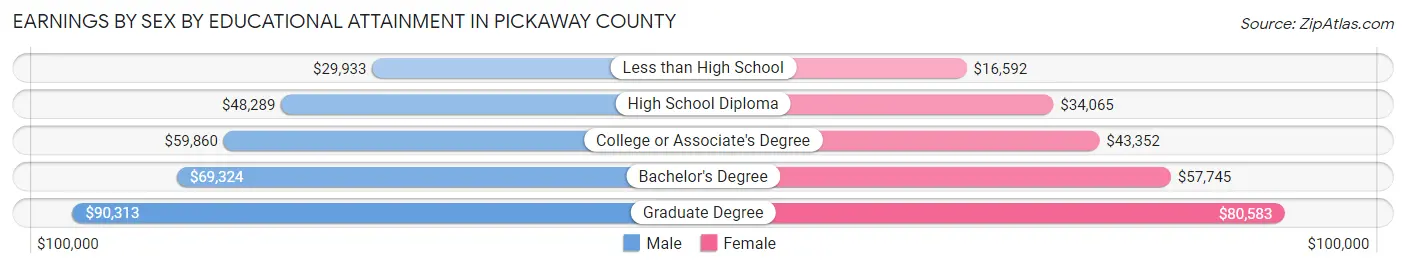
Earnings by Sex by Educational Attainment in Pickaway County
Average earnings in Pickaway County are $55,790 for men and $42,301 for women, a difference of 24.2%. Men with an educational attainment of graduate degree enjoy the highest average annual earnings of $90,313, while those with less than high school education earn the least with $29,933. Women with an educational attainment of graduate degree earn the most with the average annual earnings of $80,583, while those with less than high school education have the smallest earnings of $16,592.
| Educational Attainment | Male Income | Female Income |
| Less than High School | $29,933 | $16,592 |
| High School Diploma | $48,289 | $34,065 |
| College or Associate's Degree | $59,860 | $43,352 |
| Bachelor's Degree | $69,324 | $57,745 |
| Graduate Degree | $90,313 | $80,583 |
| Total | $55,790 | $42,301 |
Family Income in Pickaway County
Family Income Brackets in Pickaway County
According to the Pickaway County family income data, there are 3,580 families falling into the $100,000 to $149,999 income range, which is the most common income bracket and makes up 24.4% of all families. Conversely, the $10,000 to $14,999 income bracket is the least frequent group with only 176 families (1.2%) belonging to this category.
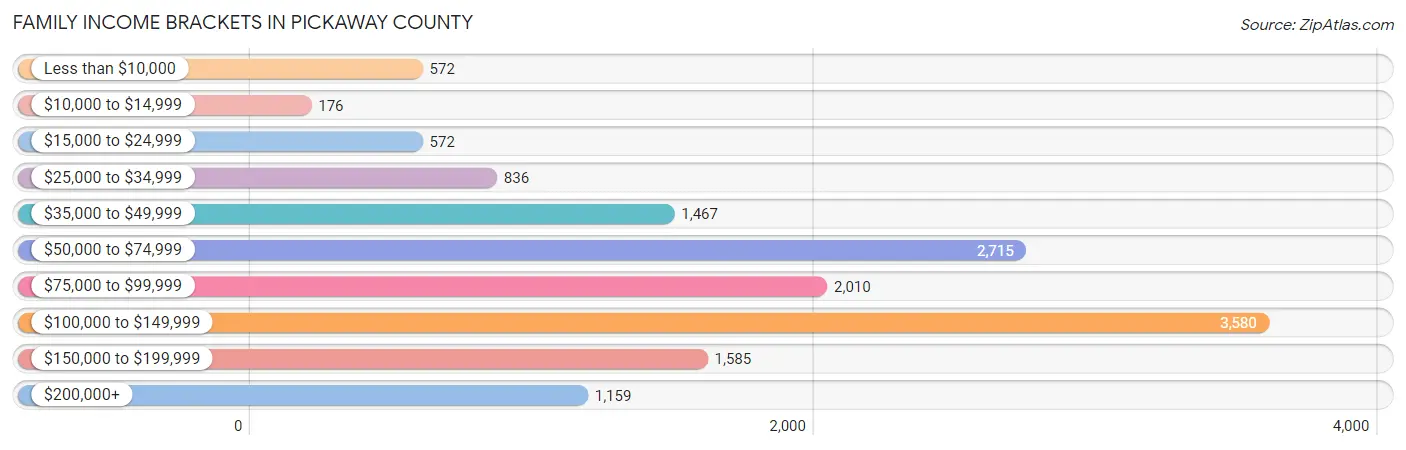
| Income Bracket | # Families | % Families |
| Less than $10,000 | 572 | 3.9% |
| $10,000 to $14,999 | 176 | 1.2% |
| $15,000 to $24,999 | 572 | 3.9% |
| $25,000 to $34,999 | 836 | 5.7% |
| $35,000 to $49,999 | 1,467 | 10.0% |
| $50,000 to $74,999 | 2,715 | 18.5% |
| $75,000 to $99,999 | 2,010 | 13.7% |
| $100,000 to $149,999 | 3,580 | 24.4% |
| $150,000 to $199,999 | 1,585 | 10.8% |
| $200,000+ | 1,159 | 7.9% |
Family Income by Famaliy Size in Pickaway County
5-person families (1,150 | 7.8%) account for the highest median family income in Pickaway County with $118,920 per family, while 2-person families (6,914 | 47.1%) have the highest median income of $36,308 per family member.
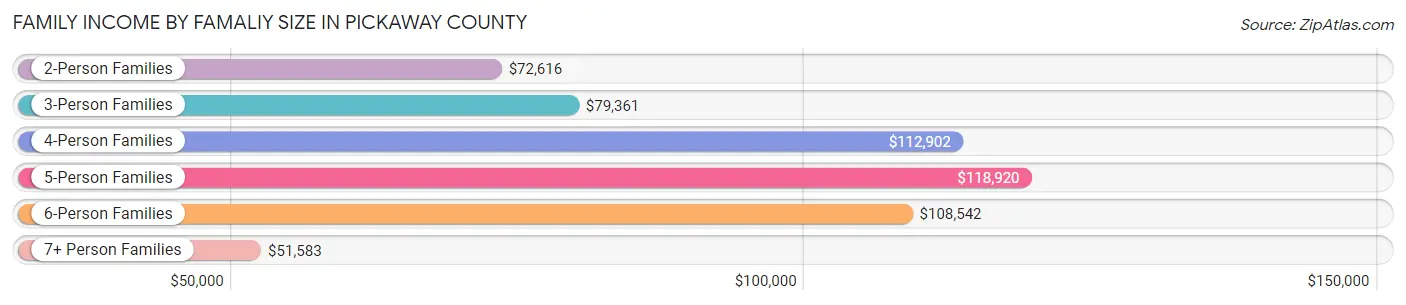
| Income Bracket | # Families | Median Income |
| 2-Person Families | 6,914 (47.1%) | $72,616 |
| 3-Person Families | 3,440 (23.4%) | $79,361 |
| 4-Person Families | 2,424 (16.5%) | $112,902 |
| 5-Person Families | 1,150 (7.8%) | $118,920 |
| 6-Person Families | 450 (3.1%) | $108,542 |
| 7+ Person Families | 295 (2.0%) | $51,583 |
| Total | 14,673 (100.0%) | $84,187 |
Family Income by Number of Earners in Pickaway County
The median family income in Pickaway County is $84,187, with families comprising 3+ earners (1,700) having the highest median family income of $134,510, while families with no earners (2,347) have the lowest median family income of $44,388, accounting for 11.6% and 16.0% of families, respectively.
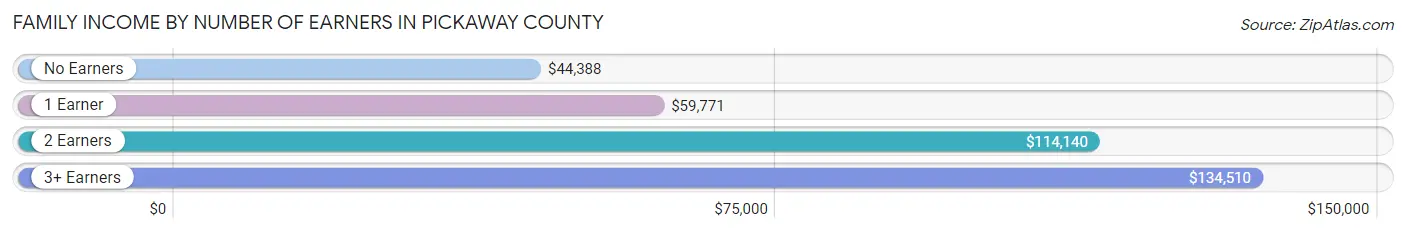
| Number of Earners | # Families | Median Income |
| No Earners | 2,347 (16.0%) | $44,388 |
| 1 Earner | 4,526 (30.8%) | $59,771 |
| 2 Earners | 6,100 (41.6%) | $114,140 |
| 3+ Earners | 1,700 (11.6%) | $134,510 |
| Total | 14,673 (100.0%) | $84,187 |
Household Income in Pickaway County
Household Income Brackets in Pickaway County
With 4,046 households falling in the category, the $50,000 to $74,999 income range is the most frequent in Pickaway County, accounting for 19.2% of all households. In contrast, only 674 households (3.2%) fall into the $10,000 to $14,999 income bracket, making it the least populous group.
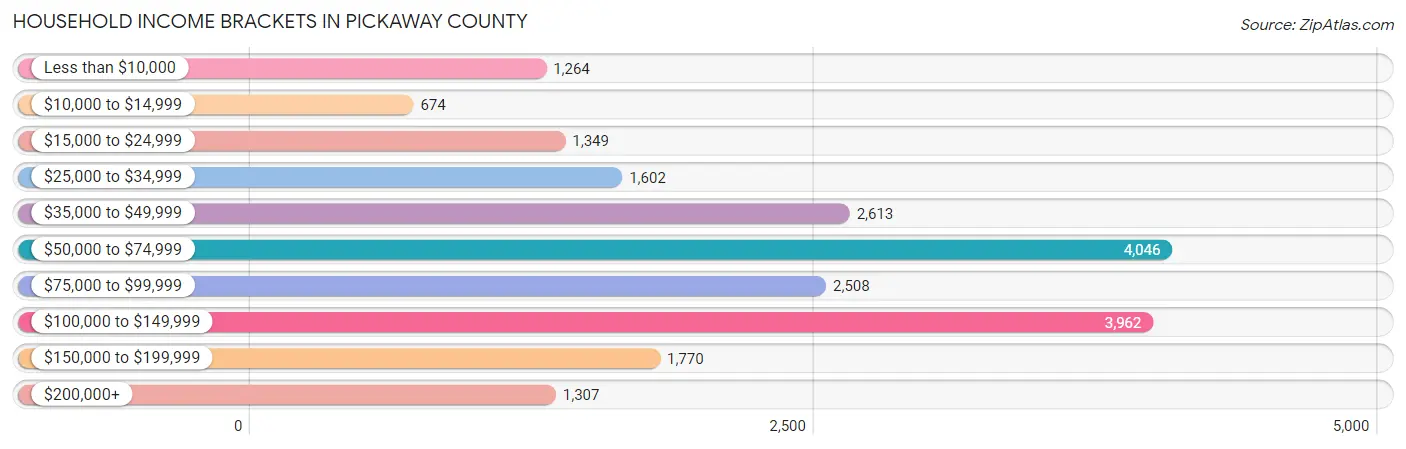
| Income Bracket | # Households | % Households |
| Less than $10,000 | 1,264 | 6.0% |
| $10,000 to $14,999 | 674 | 3.2% |
| $15,000 to $24,999 | 1,349 | 6.4% |
| $25,000 to $34,999 | 1,602 | 7.6% |
| $35,000 to $49,999 | 2,613 | 12.4% |
| $50,000 to $74,999 | 4,046 | 19.2% |
| $75,000 to $99,999 | 2,508 | 11.9% |
| $100,000 to $149,999 | 3,962 | 18.8% |
| $150,000 to $199,999 | 1,770 | 8.4% |
| $200,000+ | 1,307 | 6.2% |
Household Income by Householder Age in Pickaway County
The median household income in Pickaway County is $67,600, with the highest median household income of $77,938 found in the 45 to 64 years age bracket for the primary householder. A total of 8,521 households (40.4%) fall into this category. Meanwhile, the 65+ years age bracket for the primary householder has the lowest median household income of $49,020, with 5,754 households (27.3%) in this group.
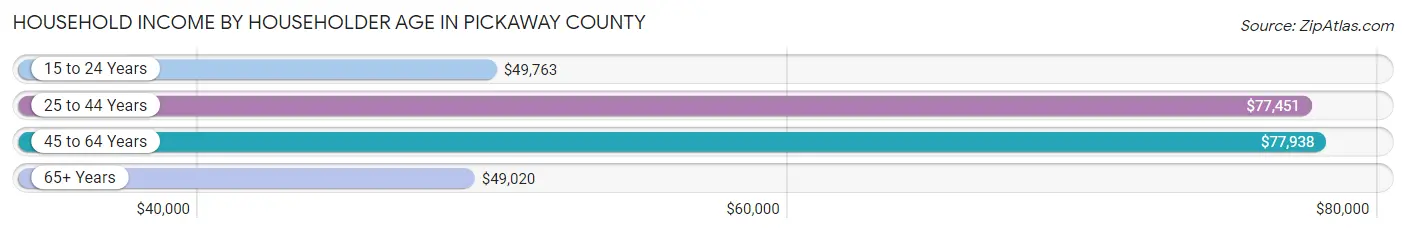
| Income Bracket | # Households | Median Income |
| 15 to 24 Years | 467 (2.2%) | $49,763 |
| 25 to 44 Years | 6,332 (30.0%) | $77,451 |
| 45 to 64 Years | 8,521 (40.4%) | $77,938 |
| 65+ Years | 5,754 (27.3%) | $49,020 |
| Total | 21,074 (100.0%) | $67,600 |
Poverty in Pickaway County
Income Below Poverty by Sex and Age in Pickaway County
With 11.7% poverty level for males and 13.3% for females among the residents of Pickaway County, 5 year old males and under 5 year old females are the most vulnerable to poverty, with 107 males (29.0%) and 439 females (29.3%) in their respective age groups living below the poverty level.
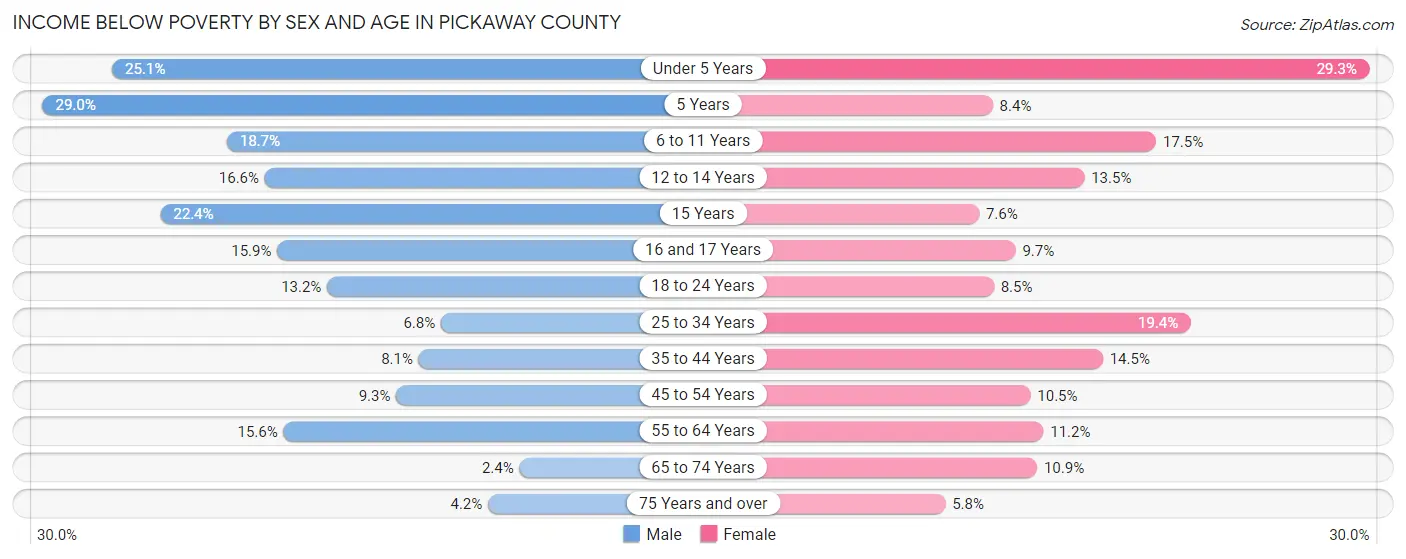
| Age Bracket | Male | Female |
| Under 5 Years | 385 (25.1%) | 439 (29.3%) |
| 5 Years | 107 (29.0%) | 22 (8.4%) |
| 6 to 11 Years | 402 (18.7%) | 382 (17.5%) |
| 12 to 14 Years | 177 (16.6%) | 142 (13.5%) |
| 15 Years | 79 (22.4%) | 33 (7.6%) |
| 16 and 17 Years | 126 (15.9%) | 64 (9.7%) |
| 18 to 24 Years | 339 (13.2%) | 189 (8.5%) |
| 25 to 34 Years | 243 (6.8%) | 630 (19.4%) |
| 35 to 44 Years | 283 (8.1%) | 506 (14.5%) |
| 45 to 54 Years | 345 (9.3%) | 378 (10.5%) |
| 55 to 64 Years | 576 (15.6%) | 412 (11.2%) |
| 65 to 74 Years | 60 (2.4%) | 314 (10.9%) |
| 75 Years and over | 64 (4.2%) | 116 (5.8%) |
| Total | 3,186 (11.7%) | 3,627 (13.3%) |
Income Above Poverty by Sex and Age in Pickaway County
According to the poverty statistics in Pickaway County, males aged 65 to 74 years and females aged 75 years and over are the age groups that are most secure financially, with 97.6% of males and 94.2% of females in these age groups living above the poverty line.
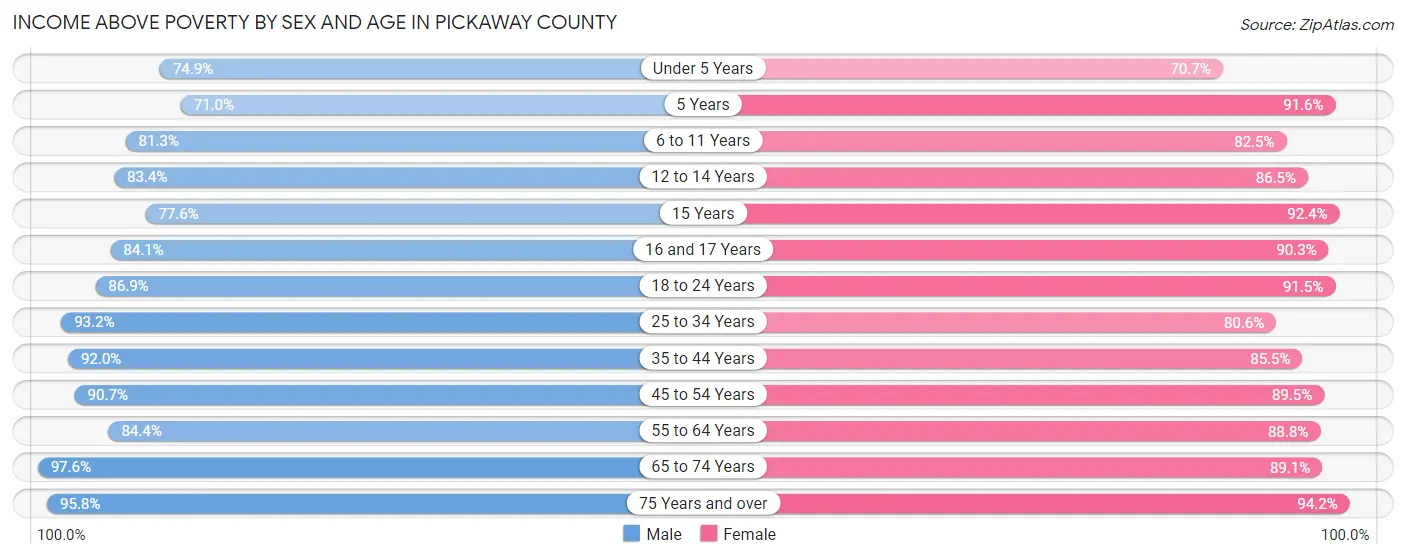
| Age Bracket | Male | Female |
| Under 5 Years | 1,147 (74.9%) | 1,057 (70.7%) |
| 5 Years | 262 (71.0%) | 240 (91.6%) |
| 6 to 11 Years | 1,743 (81.3%) | 1,801 (82.5%) |
| 12 to 14 Years | 888 (83.4%) | 910 (86.5%) |
| 15 Years | 273 (77.6%) | 399 (92.4%) |
| 16 and 17 Years | 665 (84.1%) | 598 (90.3%) |
| 18 to 24 Years | 2,238 (86.9%) | 2,044 (91.5%) |
| 25 to 34 Years | 3,324 (93.2%) | 2,619 (80.6%) |
| 35 to 44 Years | 3,231 (91.9%) | 2,977 (85.5%) |
| 45 to 54 Years | 3,364 (90.7%) | 3,222 (89.5%) |
| 55 to 64 Years | 3,122 (84.4%) | 3,259 (88.8%) |
| 65 to 74 Years | 2,394 (97.6%) | 2,576 (89.1%) |
| 75 Years and over | 1,464 (95.8%) | 1,899 (94.2%) |
| Total | 24,115 (88.3%) | 23,601 (86.7%) |
Income Below Poverty Among Married-Couple Families in Pickaway County
The poverty statistics for married-couple families in Pickaway County show that 3.8% or 425 of the total 11,061 families live below the poverty line. Families with 5 or more children have the highest poverty rate of 39.8%, comprising of 68 families. On the other hand, families with 1 or 2 children have the lowest poverty rate of 1.7%, which includes 64 families.
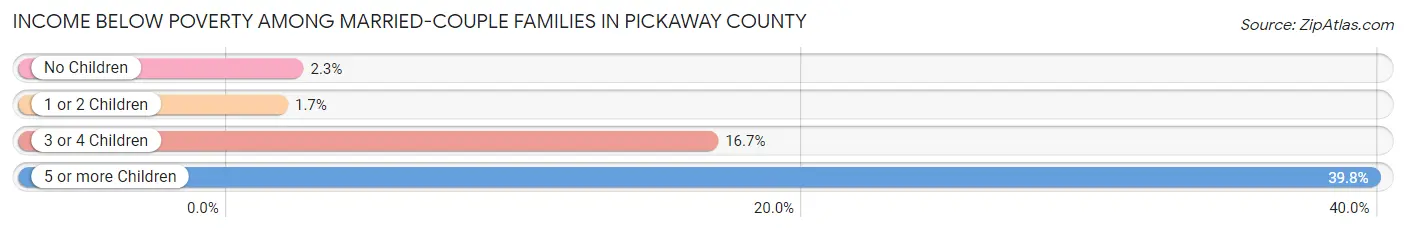
| Children | Above Poverty | Below Poverty |
| No Children | 6,169 (97.7%) | 144 (2.3%) |
| 1 or 2 Children | 3,622 (98.3%) | 64 (1.7%) |
| 3 or 4 Children | 742 (83.3%) | 149 (16.7%) |
| 5 or more Children | 103 (60.2%) | 68 (39.8%) |
| Total | 10,636 (96.2%) | 425 (3.8%) |
Income Below Poverty Among Single-Parent Households in Pickaway County
According to the poverty data in Pickaway County, 14.4% or 186 single-father households and 31.4% or 728 single-mother households are living below the poverty line. Among single-father households, those with no children have the highest poverty rate, with 88 households (17.2%) experiencing poverty. Likewise, among single-mother households, those with 5 or more children have the highest poverty rate, with 61 households (100.0%) falling below the poverty line.
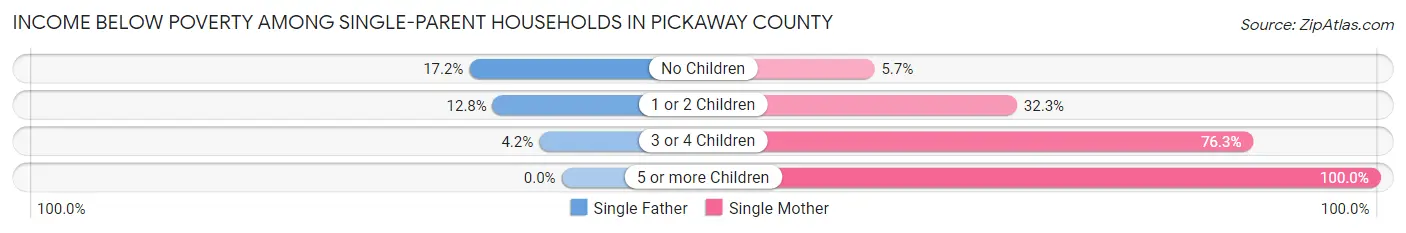
| Children | Single Father | Single Mother |
| No Children | 88 (17.2%) | 43 (5.7%) |
| 1 or 2 Children | 97 (12.8%) | 386 (32.3%) |
| 3 or 4 Children | 1 (4.2%) | 238 (76.3%) |
| 5 or more Children | 0 (0.0%) | 61 (100.0%) |
| Total | 186 (14.4%) | 728 (31.4%) |
Income Below Poverty Among Married-Couple vs Single-Parent Households in Pickaway County
The poverty data for Pickaway County shows that 425 of the married-couple family households (3.8%) and 914 of the single-parent households (25.3%) are living below the poverty level. Within the married-couple family households, those with 5 or more children have the highest poverty rate, with 68 households (39.8%) falling below the poverty line. Among the single-parent households, those with 5 or more children have the highest poverty rate, with 61 household (100.0%) living below poverty.
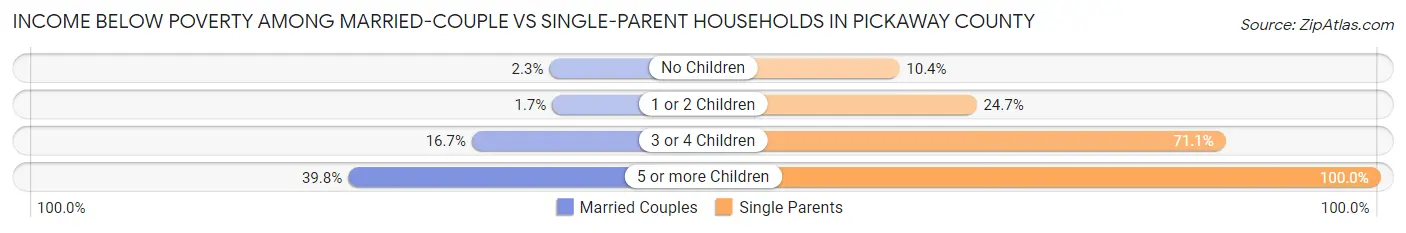
| Children | Married-Couple Families | Single-Parent Households |
| No Children | 144 (2.3%) | 131 (10.4%) |
| 1 or 2 Children | 64 (1.7%) | 483 (24.7%) |
| 3 or 4 Children | 149 (16.7%) | 239 (71.1%) |
| 5 or more Children | 68 (39.8%) | 61 (100.0%) |
| Total | 425 (3.8%) | 914 (25.3%) |
Race in Pickaway County
The most populous races in Pickaway County are White / Caucasian (54,399 | 92.5%), Black / African American (2,228 | 3.8%), and Two or more Races (1,909 | 3.3%).
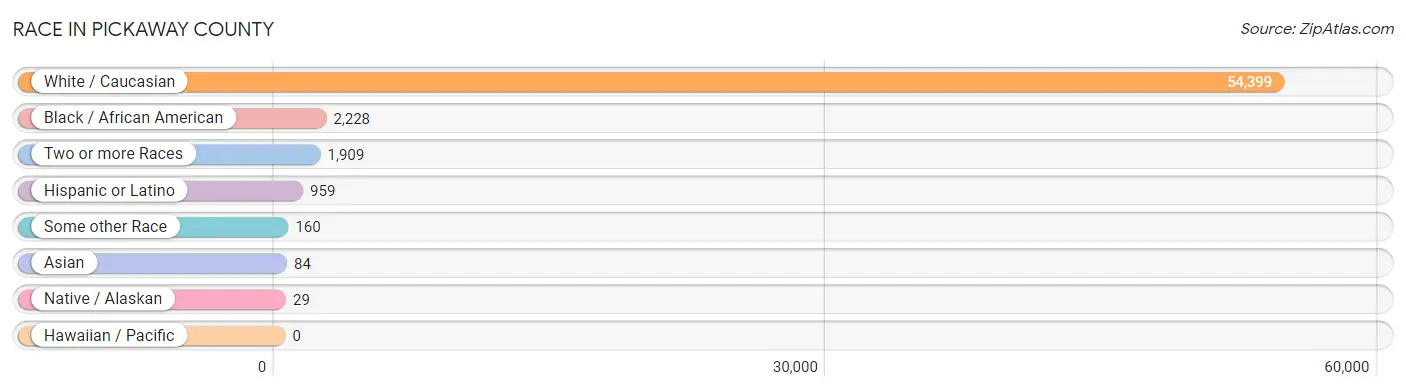
| Race | # Population | % Population |
| Asian | 84 | 0.1% |
| Black / African American | 2,228 | 3.8% |
| Hawaiian / Pacific | 0 | 0.0% |
| Hispanic or Latino | 959 | 1.6% |
| Native / Alaskan | 29 | 0.1% |
| White / Caucasian | 54,399 | 92.5% |
| Two or more Races | 1,909 | 3.3% |
| Some other Race | 160 | 0.3% |
| Total | 58,809 | 100.0% |
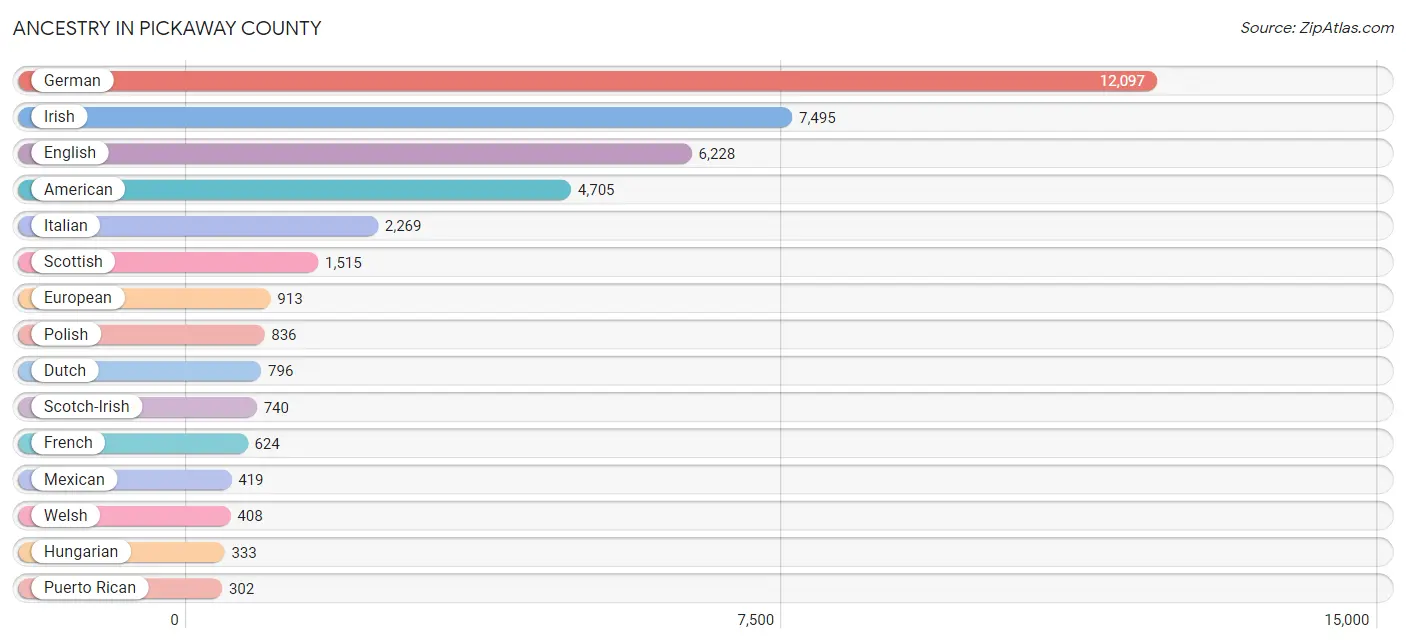
Ancestry in Pickaway County
The most populous ancestries reported in Pickaway County are German (12,097 | 20.6%), Irish (7,495 | 12.7%), English (6,228 | 10.6%), American (4,705 | 8.0%), and Italian (2,269 | 3.9%), together accounting for 55.8% of all Pickaway County residents.
| Ancestry | # Population | % Population |
| African | 66 | 0.1% |
| American | 4,705 | 8.0% |
| Apache | 17 | 0.0% |
| Arab | 113 | 0.2% |
| Argentinean | 14 | 0.0% |
| Austrian | 46 | 0.1% |
| Bhutanese | 43 | 0.1% |
| Blackfeet | 15 | 0.0% |
| British | 191 | 0.3% |
| Burmese | 155 | 0.3% |
| Canadian | 52 | 0.1% |
| Celtic | 10 | 0.0% |
| Central American | 96 | 0.2% |
| Cherokee | 99 | 0.2% |
| Cheyenne | 5 | 0.0% |
| Chilean | 24 | 0.0% |
| Chippewa | 19 | 0.0% |
| Colombian | 12 | 0.0% |
| Croatian | 57 | 0.1% |
| Czech | 109 | 0.2% |
| Czechoslovakian | 11 | 0.0% |
| Danish | 46 | 0.1% |
| Dominican | 7 | 0.0% |
| Dutch | 796 | 1.3% |
| Eastern European | 136 | 0.2% |
| Ecuadorian | 8 | 0.0% |
| English | 6,228 | 10.6% |
| European | 913 | 1.5% |
| Finnish | 42 | 0.1% |
| French | 624 | 1.1% |
| French Canadian | 125 | 0.2% |
| German | 12,097 | 20.6% |
| Greek | 66 | 0.1% |
| Guatemalan | 9 | 0.0% |
| Haitian | 142 | 0.2% |
| Honduran | 84 | 0.1% |
| Hungarian | 333 | 0.6% |
| Indian (Asian) | 9 | 0.0% |
| Irish | 7,495 | 12.7% |
| Iroquois | 19 | 0.0% |
| Italian | 2,269 | 3.9% |
| Jamaican | 5 | 0.0% |
| Korean | 5 | 0.0% |
| Lebanese | 44 | 0.1% |
| Lithuanian | 6 | 0.0% |
| Malaysian | 12 | 0.0% |
| Mexican | 419 | 0.7% |
| Mexican American Indian | 5 | 0.0% |
| Moroccan | 5 | 0.0% |
| Native Hawaiian | 32 | 0.1% |
| Nigerian | 52 | 0.1% |
| Northern European | 39 | 0.1% |
| Norwegian | 137 | 0.2% |
| Pakistani | 10 | 0.0% |
| Pennsylvania German | 21 | 0.0% |
| Polish | 836 | 1.4% |
| Puerto Rican | 302 | 0.5% |
| Romanian | 137 | 0.2% |
| Russian | 71 | 0.1% |
| Salvadoran | 3 | 0.0% |
| Scandinavian | 207 | 0.4% |
| Scotch-Irish | 740 | 1.3% |
| Scottish | 1,515 | 2.6% |
| Serbian | 25 | 0.0% |
| Sioux | 3 | 0.0% |
| Slovak | 59 | 0.1% |
| Slovene | 27 | 0.1% |
| South American | 58 | 0.1% |
| Spaniard | 53 | 0.1% |
| Spanish | 7 | 0.0% |
| Subsaharan African | 124 | 0.2% |
| Swedish | 201 | 0.3% |
| Swiss | 162 | 0.3% |
| Thai | 45 | 0.1% |
| Turkish | 30 | 0.1% |
| Ukrainian | 8 | 0.0% |
| Welsh | 408 | 0.7% |
| West Indian | 6 | 0.0% |
| Yaqui | 6 | 0.0% | View All 79 Rows |
Immigrants in Pickaway County
The most numerous immigrant groups reported in Pickaway County came from Latin America (181 | 0.3%), Central America (136 | 0.2%), Mexico (118 | 0.2%), Asia (103 | 0.2%), and Western Asia (58 | 0.1%), together accounting for 1.0% of all Pickaway County residents.
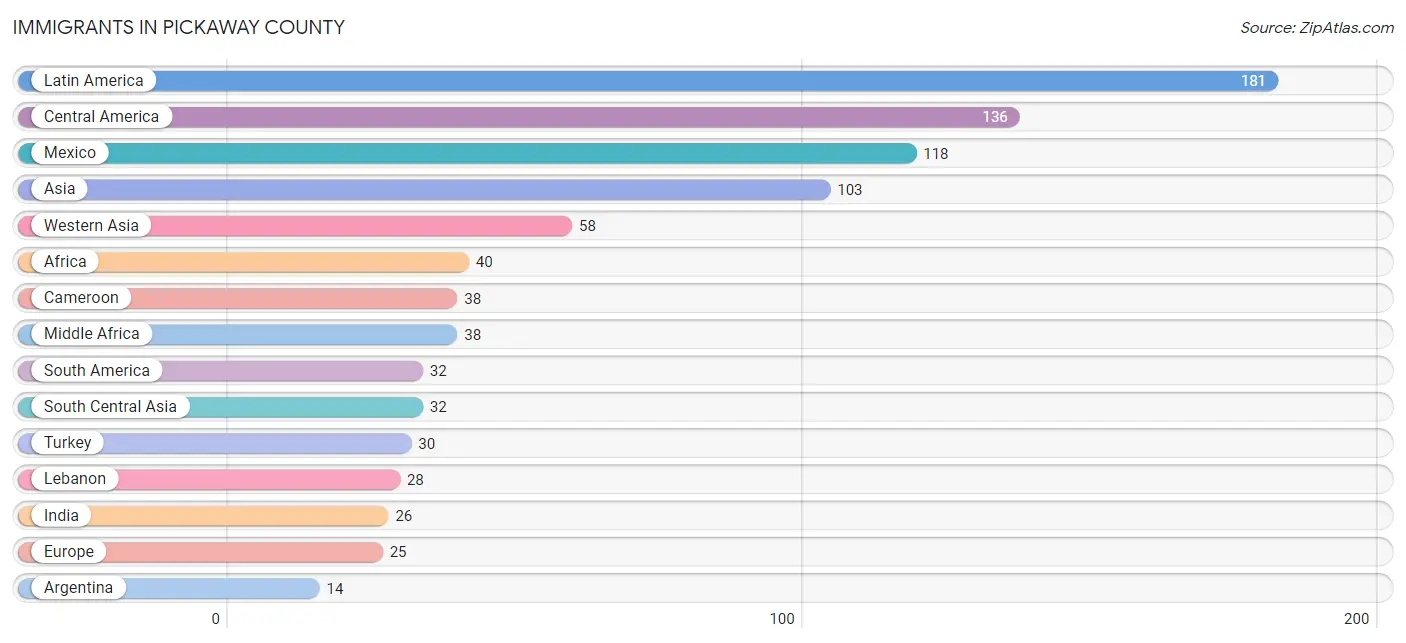
| Immigration Origin | # Population | % Population |
| Africa | 40 | 0.1% |
| Argentina | 14 | 0.0% |
| Asia | 103 | 0.2% |
| Cameroon | 38 | 0.1% |
| Canada | 12 | 0.0% |
| Caribbean | 13 | 0.0% |
| Central America | 136 | 0.2% |
| China | 9 | 0.0% |
| Colombia | 12 | 0.0% |
| Dominican Republic | 7 | 0.0% |
| Eastern Asia | 13 | 0.0% |
| Eastern Europe | 11 | 0.0% |
| El Salvador | 3 | 0.0% |
| England | 9 | 0.0% |
| Europe | 25 | 0.0% |
| Germany | 5 | 0.0% |
| Ghana | 2 | 0.0% |
| Guatemala | 9 | 0.0% |
| Haiti | 6 | 0.0% |
| Honduras | 6 | 0.0% |
| India | 26 | 0.0% |
| Japan | 4 | 0.0% |
| Latin America | 181 | 0.3% |
| Lebanon | 28 | 0.1% |
| Mexico | 118 | 0.2% |
| Middle Africa | 38 | 0.1% |
| Moldova | 4 | 0.0% |
| Nepal | 6 | 0.0% |
| Northern Europe | 9 | 0.0% |
| Russia | 3 | 0.0% |
| South America | 32 | 0.1% |
| South Central Asia | 32 | 0.1% |
| Turkey | 30 | 0.1% |
| Venezuela | 6 | 0.0% |
| Western Africa | 2 | 0.0% |
| Western Asia | 58 | 0.1% |
| Western Europe | 5 | 0.0% | View All 37 Rows |
Sex and Age in Pickaway County
Sex and Age in Pickaway County
The most populous age groups in Pickaway County are 35 to 39 Years (2,336 | 7.5%) for men and 5 to 9 Years (1,942 | 7.0%) for women.
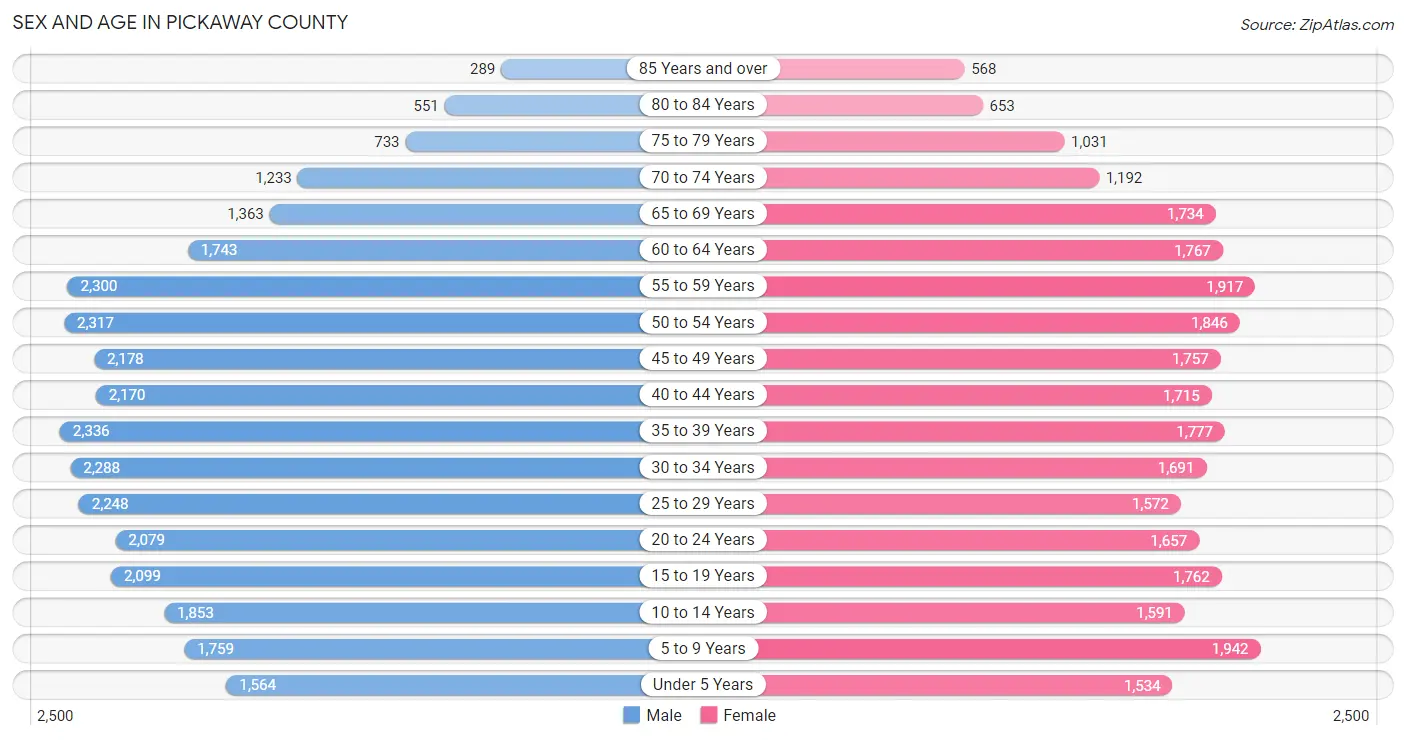
| Age Bracket | Male | Female |
| Under 5 Years | 1,564 (5.0%) | 1,534 (5.5%) |
| 5 to 9 Years | 1,759 (5.7%) | 1,942 (7.0%) |
| 10 to 14 Years | 1,853 (6.0%) | 1,591 (5.7%) |
| 15 to 19 Years | 2,099 (6.8%) | 1,762 (6.4%) |
| 20 to 24 Years | 2,079 (6.7%) | 1,657 (6.0%) |
| 25 to 29 Years | 2,248 (7.2%) | 1,572 (5.7%) |
| 30 to 34 Years | 2,288 (7.4%) | 1,691 (6.1%) |
| 35 to 39 Years | 2,336 (7.5%) | 1,777 (6.4%) |
| 40 to 44 Years | 2,170 (7.0%) | 1,715 (6.2%) |
| 45 to 49 Years | 2,178 (7.0%) | 1,757 (6.3%) |
| 50 to 54 Years | 2,317 (7.4%) | 1,846 (6.7%) |
| 55 to 59 Years | 2,300 (7.4%) | 1,917 (6.9%) |
| 60 to 64 Years | 1,743 (5.6%) | 1,767 (6.4%) |
| 65 to 69 Years | 1,363 (4.4%) | 1,734 (6.3%) |
| 70 to 74 Years | 1,233 (4.0%) | 1,192 (4.3%) |
| 75 to 79 Years | 733 (2.4%) | 1,031 (3.7%) |
| 80 to 84 Years | 551 (1.8%) | 653 (2.4%) |
| 85 Years and over | 289 (0.9%) | 568 (2.1%) |
| Total | 31,103 (100.0%) | 27,706 (100.0%) |
Families and Households in Pickaway County
Median Family Size in Pickaway County
The median family size in Pickaway County is 3.12 persons per family, with single female/mother families (2,320 | 15.8%) accounting for the largest median family size of 3.18 persons per family. On the other hand, single male/father families (1,292 | 8.8%) represent the smallest median family size with 2.60 persons per family.
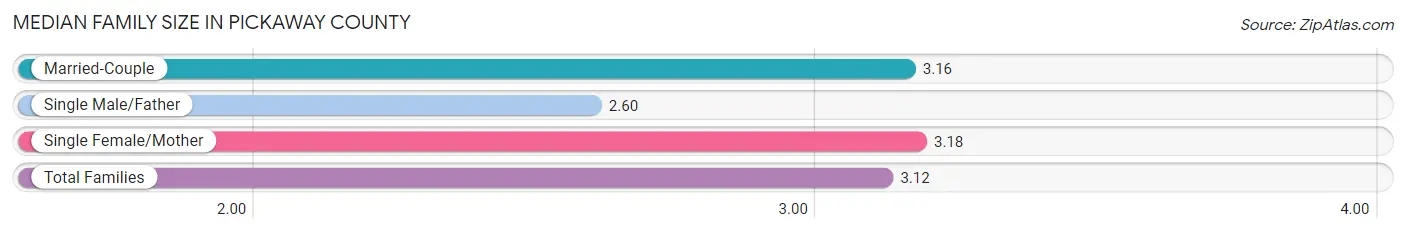
| Family Type | # Families | Family Size |
| Married-Couple | 11,061 (75.4%) | 3.16 |
| Single Male/Father | 1,292 (8.8%) | 2.60 |
| Single Female/Mother | 2,320 (15.8%) | 3.18 |
| Total Families | 14,673 (100.0%) | 3.12 |
Median Household Size in Pickaway County
The median household size in Pickaway County is 2.59 persons per household, with single female/mother households (2,320 | 11.0%) accounting for the largest median household size of 3.5 persons per household. non-family households (6,401 | 30.4%) represent the smallest median household size with 1.15 persons per household.
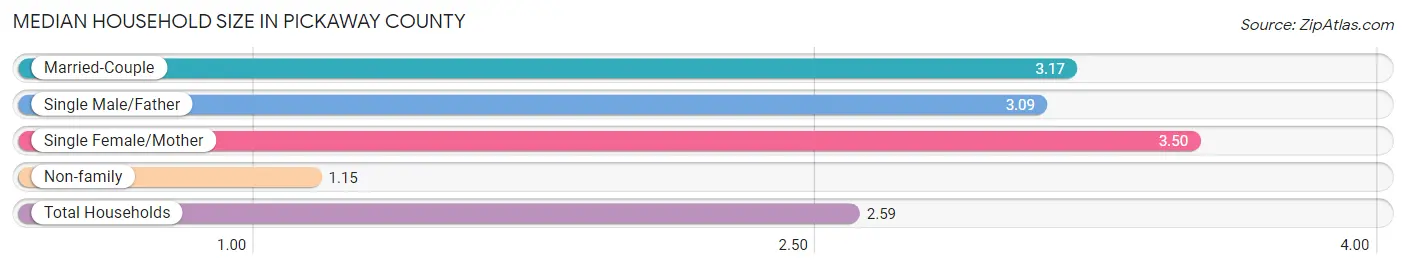
| Household Type | # Households | Household Size |
| Married-Couple | 11,061 (52.5%) | 3.17 |
| Single Male/Father | 1,292 (6.1%) | 3.09 |
| Single Female/Mother | 2,320 (11.0%) | 3.50 |
| Non-family | 6,401 (30.4%) | 1.15 |
| Total Households | 21,074 (100.0%) | 2.59 |
Household Size by Marriage Status in Pickaway County
Out of a total of 21,074 households in Pickaway County, 14,673 (69.6%) are family households, while 6,401 (30.4%) are nonfamily households. The most numerous type of family households are 2-person households, comprising 6,347, and the most common type of nonfamily households are 1-person households, comprising 5,566.
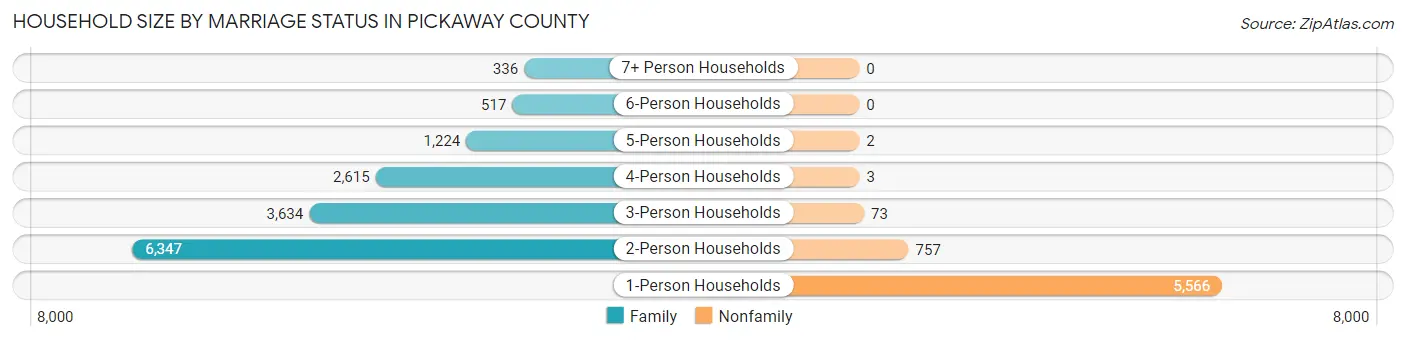
| Household Size | Family Households | Nonfamily Households |
| 1-Person Households | - | 5,566 (26.4%) |
| 2-Person Households | 6,347 (30.1%) | 757 (3.6%) |
| 3-Person Households | 3,634 (17.2%) | 73 (0.4%) |
| 4-Person Households | 2,615 (12.4%) | 3 (0.0%) |
| 5-Person Households | 1,224 (5.8%) | 2 (0.0%) |
| 6-Person Households | 517 (2.5%) | 0 (0.0%) |
| 7+ Person Households | 336 (1.6%) | 0 (0.0%) |
| Total | 14,673 (69.6%) | 6,401 (30.4%) |
Female Fertility in Pickaway County
Fertility by Age in Pickaway County
Average fertility rate in Pickaway County is 37.0 births per 1,000 women. Women in the age bracket of 20 to 34 years have the highest fertility rate with 83.0 births per 1,000 women. Women in the age bracket of 20 to 34 years acount for 87.9% of all women with births.
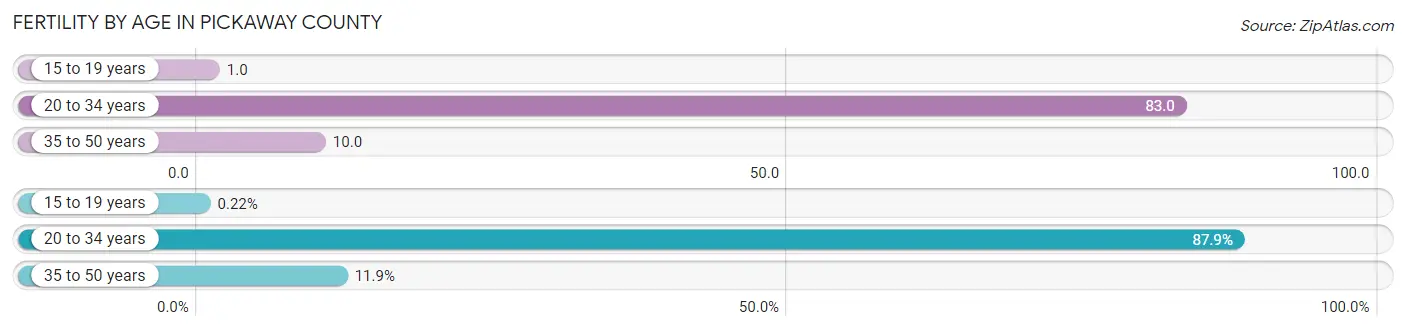
| Age Bracket | Women with Births | Births / 1,000 Women |
| 15 to 19 years | 1 (0.2%) | 1.0 |
| 20 to 34 years | 408 (87.9%) | 83.0 |
| 35 to 50 years | 55 (11.8%) | 10.0 |
| Total | 464 (100.0%) | 37.0 |
Fertility by Age by Marriage Status in Pickaway County
74.4% of women with births (464) in Pickaway County are married. The highest percentage of unmarried women with births falls into 15 to 19 years age bracket with 100.0% of them unmarried at the time of birth, while the lowest percentage of unmarried women with births belong to 35 to 50 years age bracket with 1.8% of them unmarried.
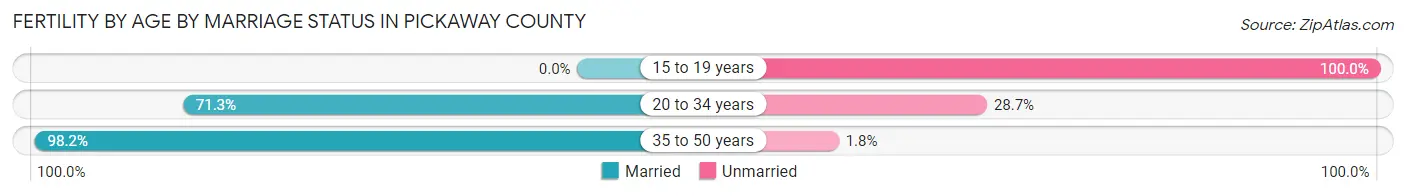
| Age Bracket | Married | Unmarried |
| 15 to 19 years | 0 (0.0%) | 1 (100.0%) |
| 20 to 34 years | 291 (71.3%) | 117 (28.7%) |
| 35 to 50 years | 54 (98.2%) | 1 (1.8%) |
| Total | 345 (74.4%) | 119 (25.7%) |
Fertility by Education in Pickaway County
Average fertility rate in Pickaway County is 37.0 births per 1,000 women. Women with the education attainment of college or associate's degree have the highest fertility rate of 55.0 births per 1,000 women, while women with the education attainment of less than high school have the lowest fertility at 21.0 births per 1,000 women. Women with the education attainment of college or associate's degree represent 46.6% of all women with births.
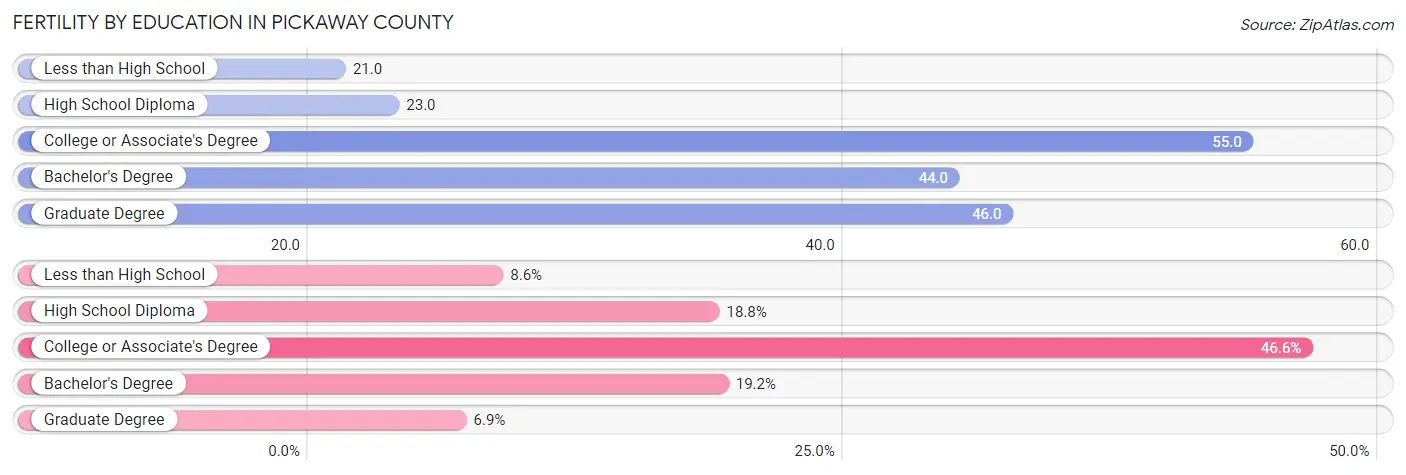
| Educational Attainment | Women with Births | Births / 1,000 Women |
| Less than High School | 40 (8.6%) | 21.0 |
| High School Diploma | 87 (18.8%) | 23.0 |
| College or Associate's Degree | 216 (46.6%) | 55.0 |
| Bachelor's Degree | 89 (19.2%) | 44.0 |
| Graduate Degree | 32 (6.9%) | 46.0 |
| Total | 464 (100.0%) | 37.0 |
Fertility by Education by Marriage Status in Pickaway County
25.7% of women with births in Pickaway County are unmarried. Women with the educational attainment of graduate degree are most likely to be married with 100.0% of them married at childbirth, while women with the educational attainment of high school diploma are least likely to be married with 86.2% of them unmarried at childbirth.
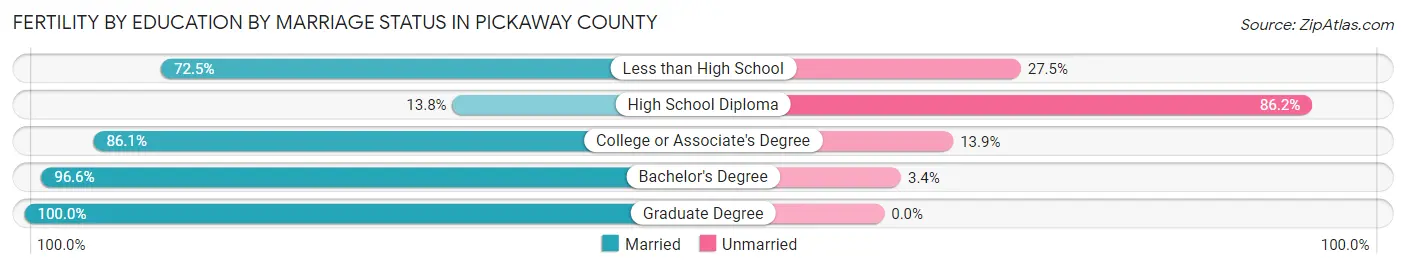
| Educational Attainment | Married | Unmarried |
| Less than High School | 29 (72.5%) | 11 (27.5%) |
| High School Diploma | 12 (13.8%) | 75 (86.2%) |
| College or Associate's Degree | 186 (86.1%) | 30 (13.9%) |
| Bachelor's Degree | 86 (96.6%) | 3 (3.4%) |
| Graduate Degree | 32 (100.0%) | 0 (0.0%) |
| Total | 345 (74.4%) | 119 (25.7%) |
Employment Characteristics in Pickaway County
Employment by Class of Employer in Pickaway County
Among the 25,292 employed individuals in Pickaway County, private company employees (16,566 | 65.5%), local government employees (2,558 | 10.1%), and not-for-profit organizations (2,211 | 8.7%) make up the most common classes of employment.
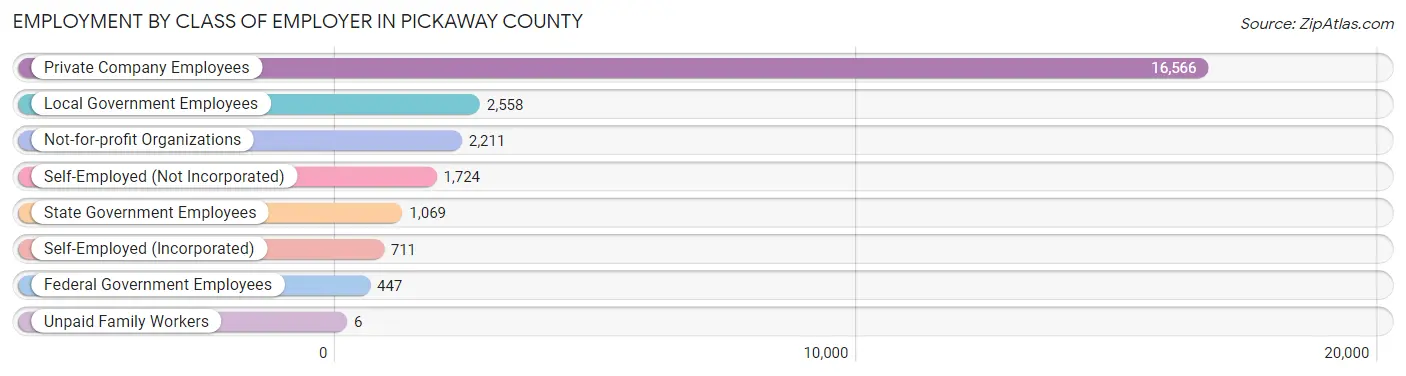
| Employer Class | # Employees | % Employees |
| Private Company Employees | 16,566 | 65.5% |
| Self-Employed (Incorporated) | 711 | 2.8% |
| Self-Employed (Not Incorporated) | 1,724 | 6.8% |
| Not-for-profit Organizations | 2,211 | 8.7% |
| Local Government Employees | 2,558 | 10.1% |
| State Government Employees | 1,069 | 4.2% |
| Federal Government Employees | 447 | 1.8% |
| Unpaid Family Workers | 6 | 0.0% |
| Total | 25,292 | 100.0% |
Employment Status by Age in Pickaway County
According to the labor force statistics for Pickaway County, out of the total population over 16 years of age (47,738), 56.6% or 27,020 individuals are in the labor force, with 4.1% or 1,108 of them unemployed. The age group with the highest labor force participation rate is 35 to 44 years, with 74.8% or 5,983 individuals in the labor force. Within the labor force, the 16 to 19 years age range has the highest percentage of unemployed individuals, with 16.4% or 236 of them being unemployed.
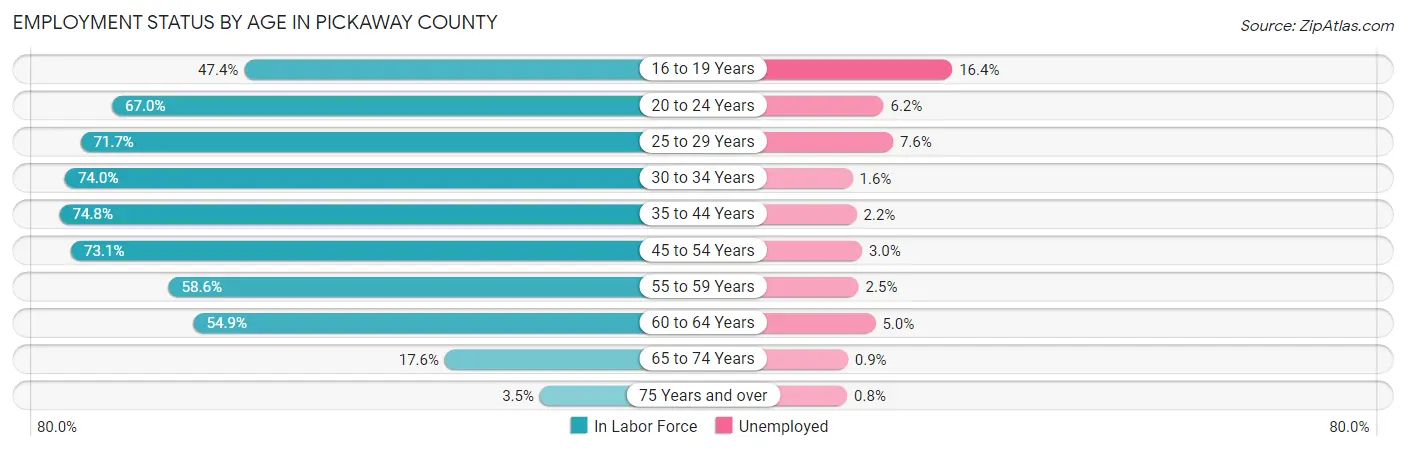
| Age Bracket | In Labor Force | Unemployed |
| 16 to 19 Years | 1,438 (47.4%) | 236 (16.4%) |
| 20 to 24 Years | 2,503 (67.0%) | 155 (6.2%) |
| 25 to 29 Years | 2,739 (71.7%) | 208 (7.6%) |
| 30 to 34 Years | 2,944 (74.0%) | 47 (1.6%) |
| 35 to 44 Years | 5,983 (74.8%) | 132 (2.2%) |
| 45 to 54 Years | 5,920 (73.1%) | 178 (3.0%) |
| 55 to 59 Years | 2,471 (58.6%) | 62 (2.5%) |
| 60 to 64 Years | 1,927 (54.9%) | 96 (5.0%) |
| 65 to 74 Years | 972 (17.6%) | 9 (0.9%) |
| 75 Years and over | 134 (3.5%) | 1 (0.8%) |
| Total | 27,020 (56.6%) | 1,108 (4.1%) |
Employment Status by Educational Attainment in Pickaway County
According to labor force statistics for Pickaway County, 69.5% of individuals (21,977) out of the total population between 25 and 64 years of age (31,622) are in the labor force, with 3.3% or 725 of them being unemployed. The group with the highest labor force participation rate are those with the educational attainment of bachelor's degree or higher, with 85.2% or 5,525 individuals in the labor force. Within the labor force, individuals with high school diploma education have the highest percentage of unemployment, with 5.7% or 481 of them being unemployed.
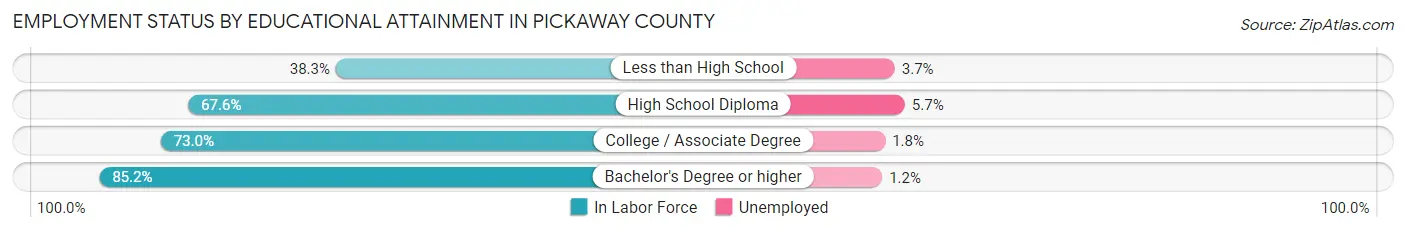
| Educational Attainment | In Labor Force | Unemployed |
| Less than High School | 1,332 (38.3%) | 129 (3.7%) |
| High School Diploma | 8,439 (67.6%) | 712 (5.7%) |
| College / Associate Degree | 6,698 (73.0%) | 165 (1.8%) |
| Bachelor's Degree or higher | 5,525 (85.2%) | 78 (1.2%) |
| Total | 21,977 (69.5%) | 1,044 (3.3%) |
Employment Occupations by Sex in Pickaway County
Management, Business, Science and Arts Occupations
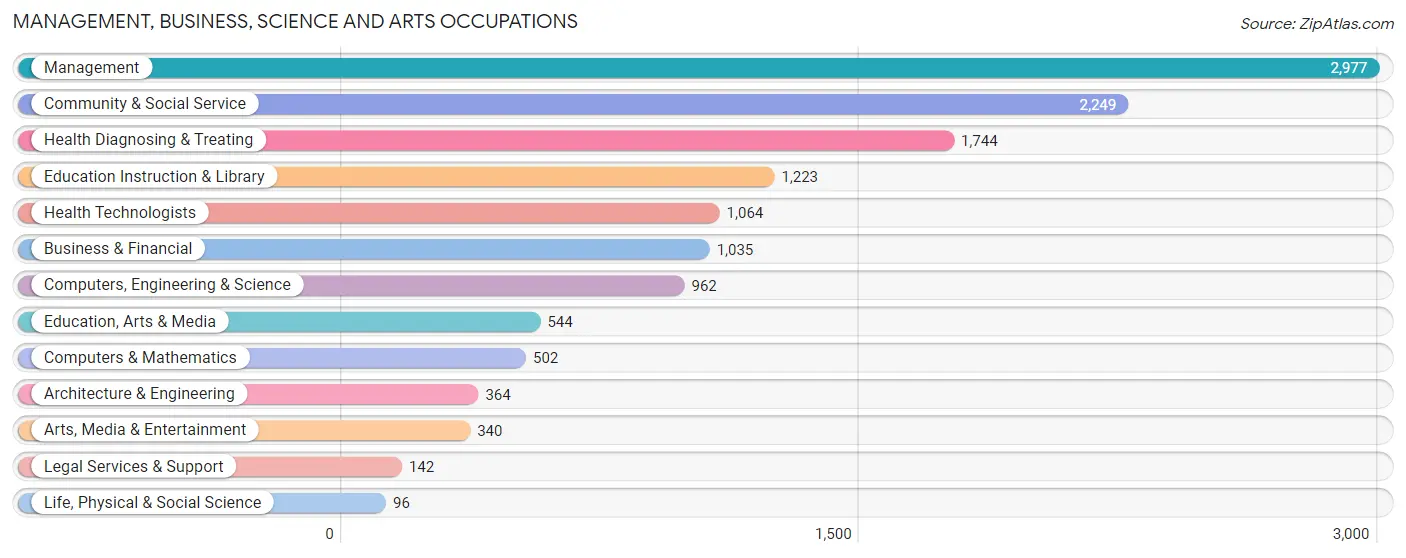
The most common Management, Business, Science and Arts occupations in Pickaway County are Management (2,977 | 11.5%), Community & Social Service (2,249 | 8.7%), Health Diagnosing & Treating (1,744 | 6.7%), Education Instruction & Library (1,223 | 4.7%), and Health Technologists (1,064 | 4.1%).
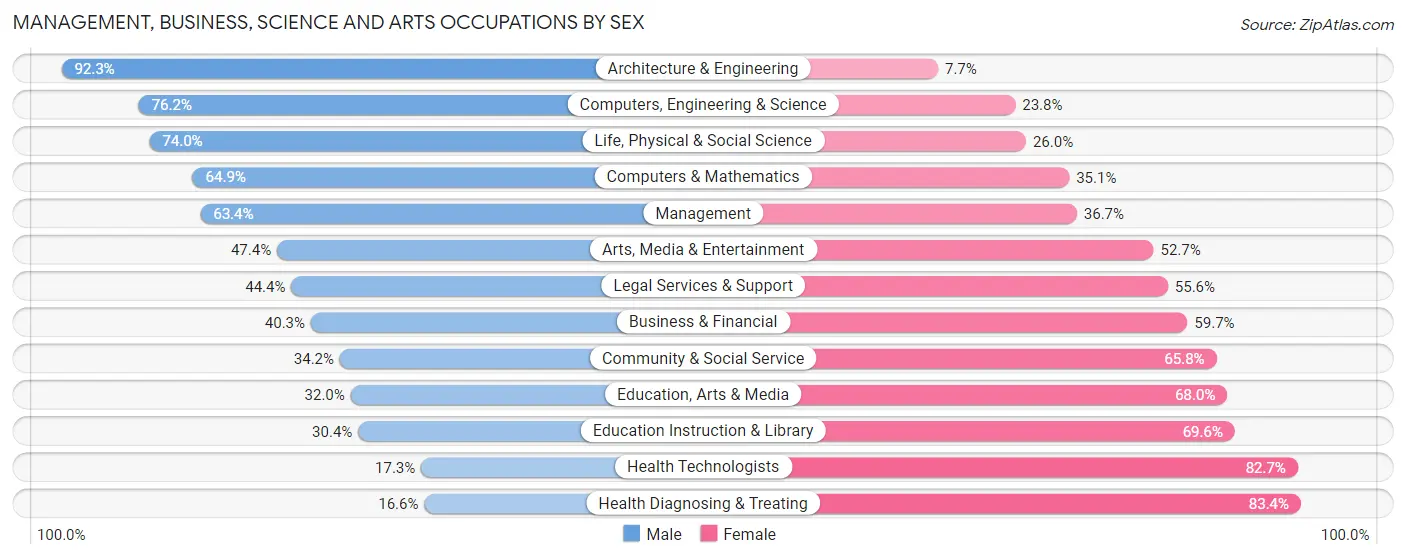
Management, Business, Science and Arts Occupations by Sex
Within the Management, Business, Science and Arts occupations in Pickaway County, the most male-oriented occupations are Architecture & Engineering (92.3%), Computers, Engineering & Science (76.2%), and Life, Physical & Social Science (74.0%), while the most female-oriented occupations are Health Diagnosing & Treating (83.4%), Health Technologists (82.7%), and Education Instruction & Library (69.6%).
| Occupation | Male | Female |
| Management | 1,886 (63.3%) | 1,091 (36.6%) |
| Business & Financial | 417 (40.3%) | 618 (59.7%) |
| Computers, Engineering & Science | 733 (76.2%) | 229 (23.8%) |
| Computers & Mathematics | 326 (64.9%) | 176 (35.1%) |
| Architecture & Engineering | 336 (92.3%) | 28 (7.7%) |
| Life, Physical & Social Science | 71 (74.0%) | 25 (26.0%) |
| Community & Social Service | 770 (34.2%) | 1,479 (65.8%) |
| Education, Arts & Media | 174 (32.0%) | 370 (68.0%) |
| Legal Services & Support | 63 (44.4%) | 79 (55.6%) |
| Education Instruction & Library | 372 (30.4%) | 851 (69.6%) |
| Arts, Media & Entertainment | 161 (47.3%) | 179 (52.6%) |
| Health Diagnosing & Treating | 290 (16.6%) | 1,454 (83.4%) |
| Health Technologists | 184 (17.3%) | 880 (82.7%) |
| Total (Category) | 4,096 (45.7%) | 4,871 (54.3%) |
| Total (Overall) | 14,043 (54.2%) | 11,866 (45.8%) |
Services Occupations
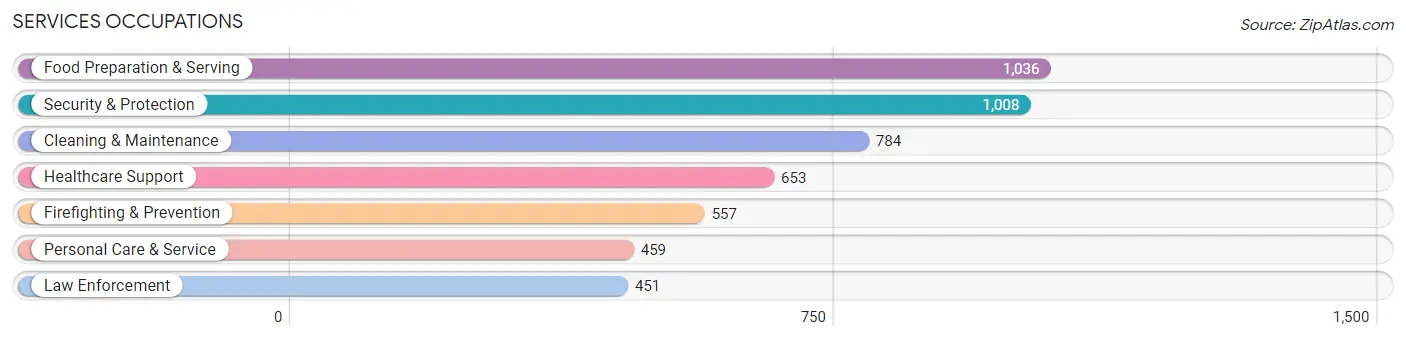
The most common Services occupations in Pickaway County are Food Preparation & Serving (1,036 | 4.0%), Security & Protection (1,008 | 3.9%), Cleaning & Maintenance (784 | 3.0%), Healthcare Support (653 | 2.5%), and Firefighting & Prevention (557 | 2.1%).
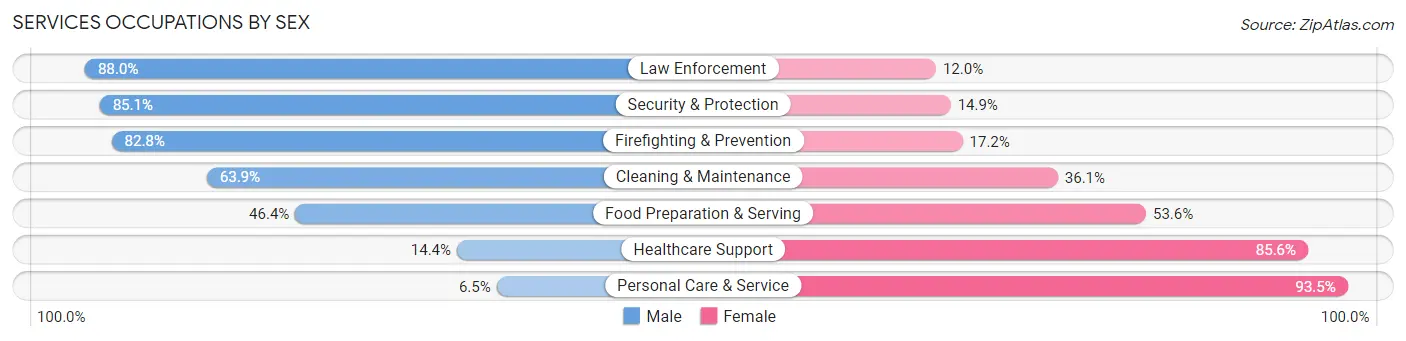
Services Occupations by Sex
Within the Services occupations in Pickaway County, the most male-oriented occupations are Law Enforcement (88.0%), Security & Protection (85.1%), and Firefighting & Prevention (82.8%), while the most female-oriented occupations are Personal Care & Service (93.5%), Healthcare Support (85.6%), and Food Preparation & Serving (53.6%).
| Occupation | Male | Female |
| Healthcare Support | 94 (14.4%) | 559 (85.6%) |
| Security & Protection | 858 (85.1%) | 150 (14.9%) |
| Firefighting & Prevention | 461 (82.8%) | 96 (17.2%) |
| Law Enforcement | 397 (88.0%) | 54 (12.0%) |
| Food Preparation & Serving | 481 (46.4%) | 555 (53.6%) |
| Cleaning & Maintenance | 501 (63.9%) | 283 (36.1%) |
| Personal Care & Service | 30 (6.5%) | 429 (93.5%) |
| Total (Category) | 1,964 (49.8%) | 1,976 (50.1%) |
| Total (Overall) | 14,043 (54.2%) | 11,866 (45.8%) |
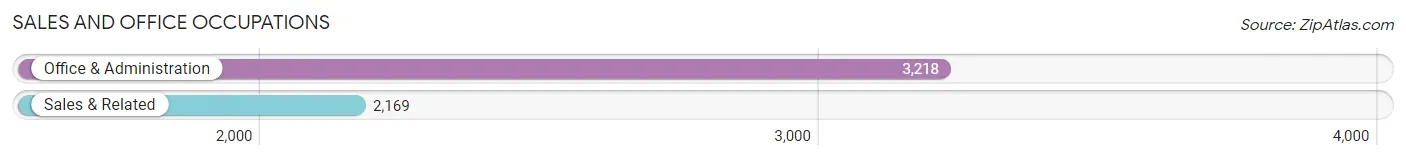
Sales and Office Occupations
The most common Sales and Office occupations in Pickaway County are Office & Administration (3,218 | 12.4%), and Sales & Related (2,169 | 8.4%).
Sales and Office Occupations by Sex
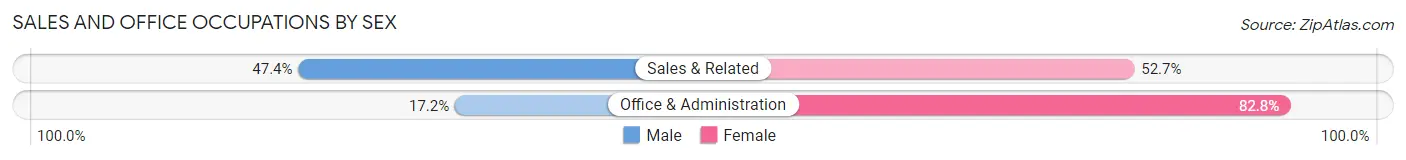
| Occupation | Male | Female |
| Sales & Related | 1,027 (47.3%) | 1,142 (52.6%) |
| Office & Administration | 554 (17.2%) | 2,664 (82.8%) |
| Total (Category) | 1,581 (29.3%) | 3,806 (70.7%) |
| Total (Overall) | 14,043 (54.2%) | 11,866 (45.8%) |
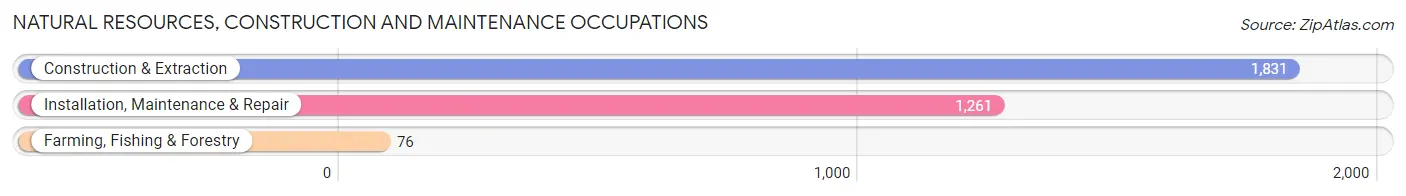
Natural Resources, Construction and Maintenance Occupations
The most common Natural Resources, Construction and Maintenance occupations in Pickaway County are Construction & Extraction (1,831 | 7.1%), Installation, Maintenance & Repair (1,261 | 4.9%), and Farming, Fishing & Forestry (76 | 0.3%).
Natural Resources, Construction and Maintenance Occupations by Sex
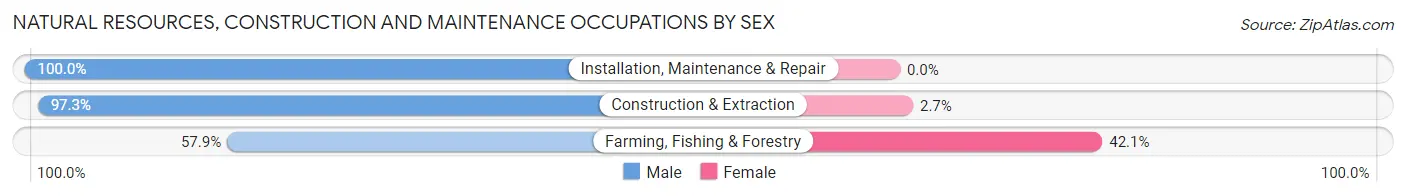
| Occupation | Male | Female |
| Farming, Fishing & Forestry | 44 (57.9%) | 32 (42.1%) |
| Construction & Extraction | 1,781 (97.3%) | 50 (2.7%) |
| Installation, Maintenance & Repair | 1,261 (100.0%) | 0 (0.0%) |
| Total (Category) | 3,086 (97.4%) | 82 (2.6%) |
| Total (Overall) | 14,043 (54.2%) | 11,866 (45.8%) |
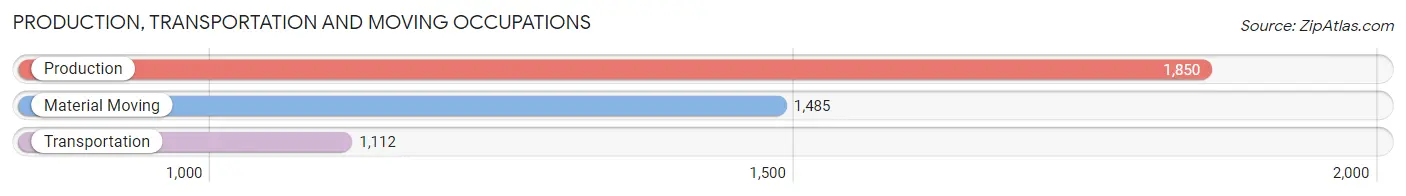
Production, Transportation and Moving Occupations
The most common Production, Transportation and Moving occupations in Pickaway County are Production (1,850 | 7.1%), Material Moving (1,485 | 5.7%), and Transportation (1,112 | 4.3%).
Production, Transportation and Moving Occupations by Sex
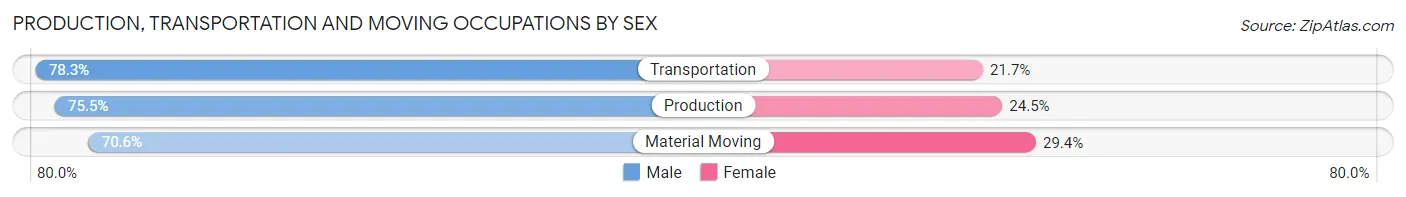
| Occupation | Male | Female |
| Production | 1,397 (75.5%) | 453 (24.5%) |
| Transportation | 871 (78.3%) | 241 (21.7%) |
| Material Moving | 1,048 (70.6%) | 437 (29.4%) |
| Total (Category) | 3,316 (74.6%) | 1,131 (25.4%) |
| Total (Overall) | 14,043 (54.2%) | 11,866 (45.8%) |
Employment Industries by Sex in Pickaway County
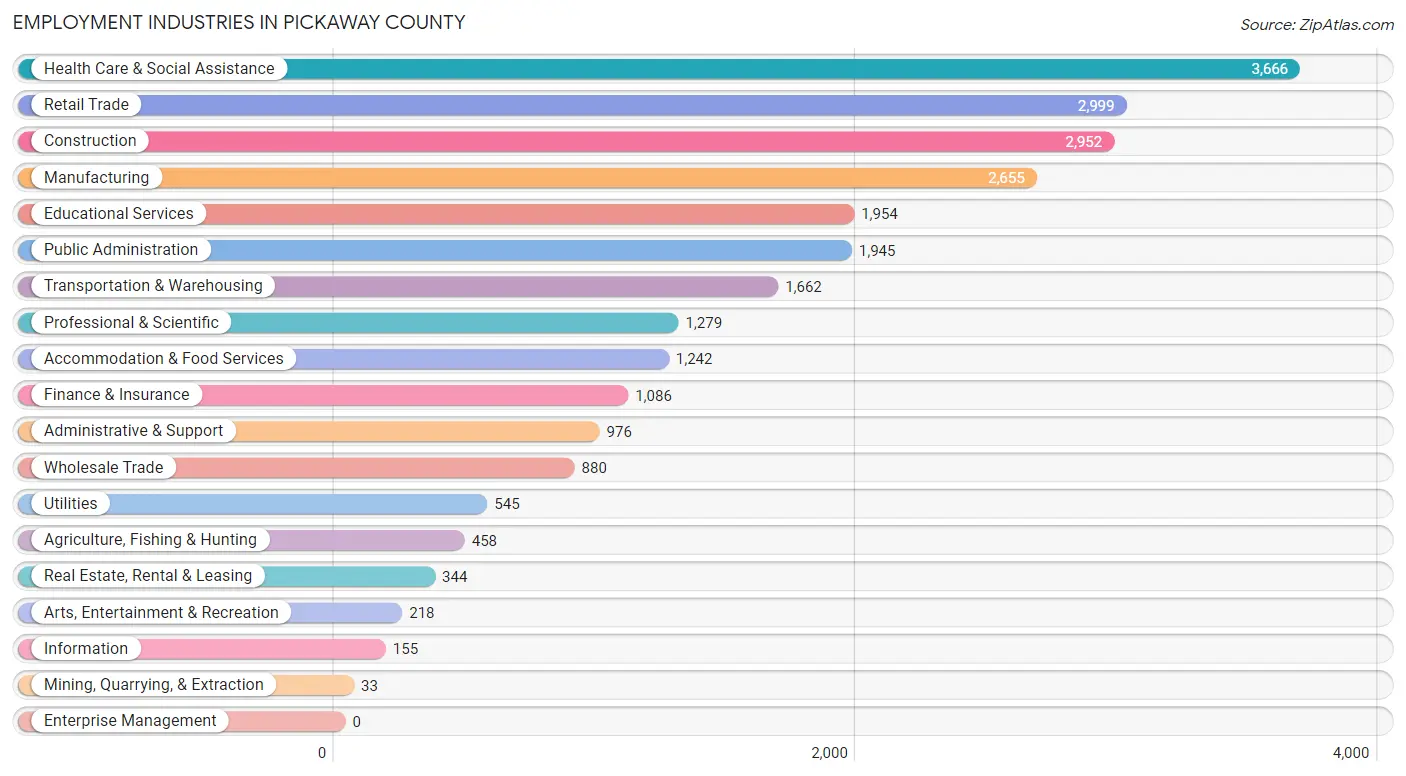
Employment Industries in Pickaway County
The major employment industries in Pickaway County include Health Care & Social Assistance (3,666 | 14.1%), Retail Trade (2,999 | 11.6%), Construction (2,952 | 11.4%), Manufacturing (2,655 | 10.2%), and Educational Services (1,954 | 7.5%).
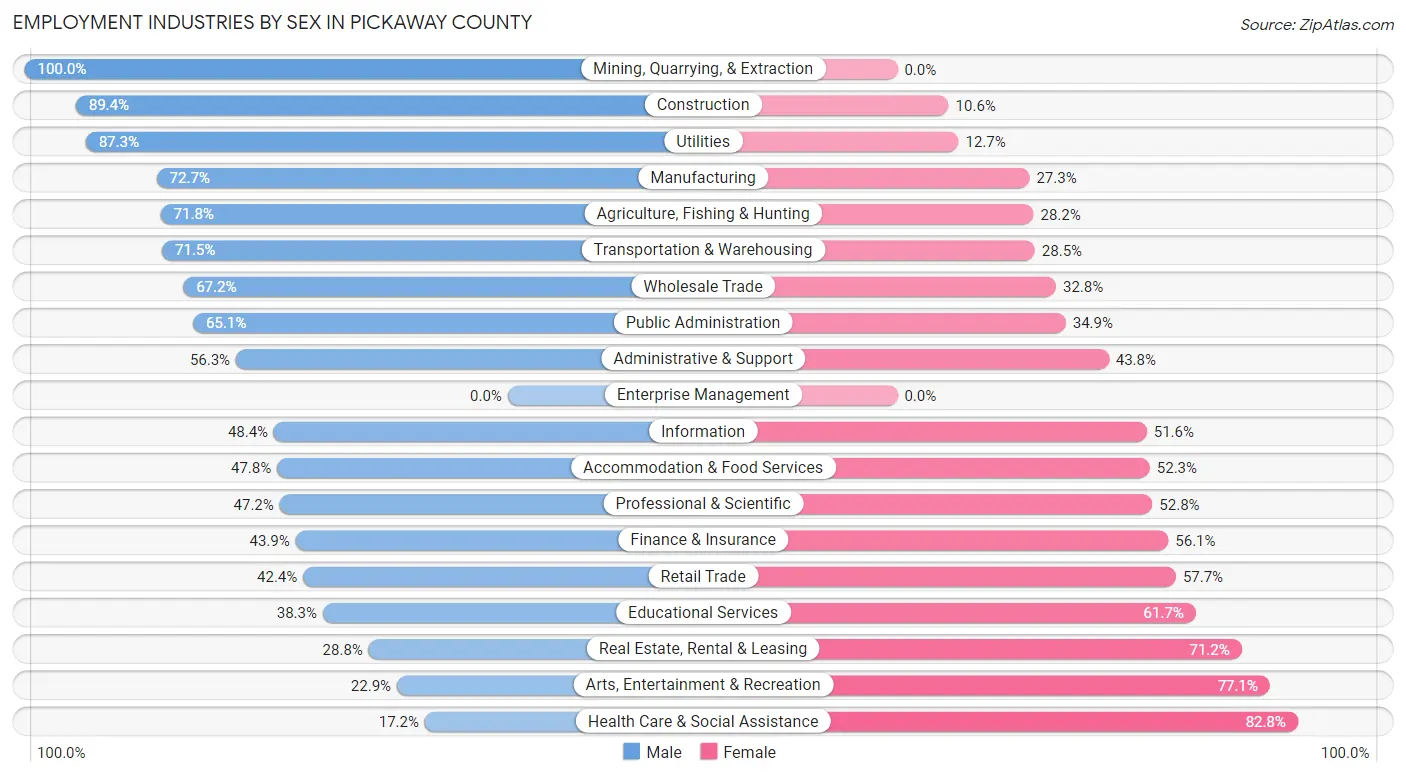
Employment Industries by Sex in Pickaway County
The Pickaway County industries that see more men than women are Mining, Quarrying, & Extraction (100.0%), Construction (89.4%), and Utilities (87.3%), whereas the industries that tend to have a higher number of women are Health Care & Social Assistance (82.8%), Arts, Entertainment & Recreation (77.1%), and Real Estate, Rental & Leasing (71.2%).
| Industry | Male | Female |
| Agriculture, Fishing & Hunting | 329 (71.8%) | 129 (28.2%) |
| Mining, Quarrying, & Extraction | 33 (100.0%) | 0 (0.0%) |
| Construction | 2,639 (89.4%) | 313 (10.6%) |
| Manufacturing | 1,929 (72.7%) | 726 (27.3%) |
| Wholesale Trade | 591 (67.2%) | 289 (32.8%) |
| Retail Trade | 1,270 (42.3%) | 1,729 (57.7%) |
| Transportation & Warehousing | 1,189 (71.5%) | 473 (28.5%) |
| Utilities | 476 (87.3%) | 69 (12.7%) |
| Information | 75 (48.4%) | 80 (51.6%) |
| Finance & Insurance | 477 (43.9%) | 609 (56.1%) |
| Real Estate, Rental & Leasing | 99 (28.8%) | 245 (71.2%) |
| Professional & Scientific | 604 (47.2%) | 675 (52.8%) |
| Enterprise Management | 0 (0.0%) | 0 (0.0%) |
| Administrative & Support | 549 (56.2%) | 427 (43.8%) |
| Educational Services | 748 (38.3%) | 1,206 (61.7%) |
| Health Care & Social Assistance | 629 (17.2%) | 3,037 (82.8%) |
| Arts, Entertainment & Recreation | 50 (22.9%) | 168 (77.1%) |
| Accommodation & Food Services | 593 (47.7%) | 649 (52.2%) |
| Public Administration | 1,267 (65.1%) | 678 (34.9%) |
| Total | 14,043 (54.2%) | 11,866 (45.8%) |
Education in Pickaway County
School Enrollment in Pickaway County
The most common levels of schooling among the 12,927 students in Pickaway County are high school (3,098 | 24.0%), middle school (3,009 | 23.3%), and elementary school (2,852 | 22.1%).
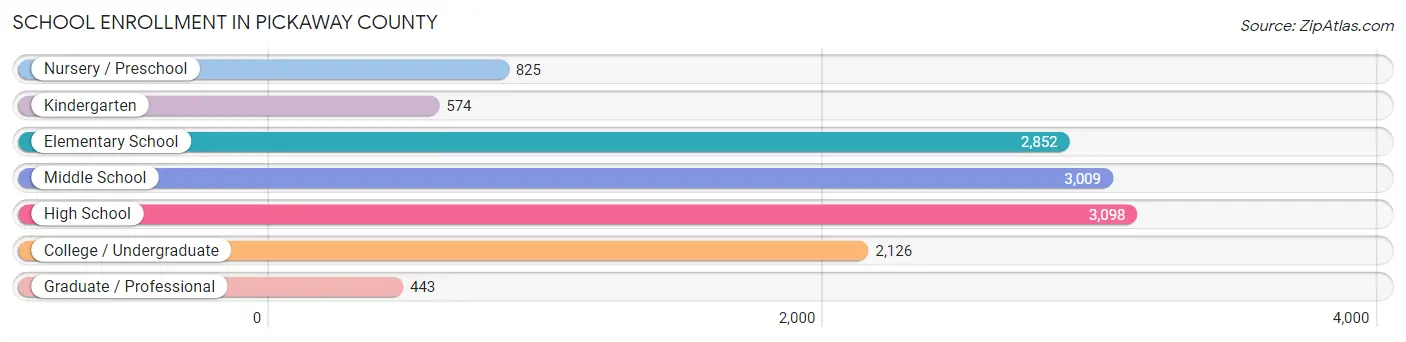
| School Level | # Students | % Students |
| Nursery / Preschool | 825 | 6.4% |
| Kindergarten | 574 | 4.4% |
| Elementary School | 2,852 | 22.1% |
| Middle School | 3,009 | 23.3% |
| High School | 3,098 | 24.0% |
| College / Undergraduate | 2,126 | 16.5% |
| Graduate / Professional | 443 | 3.4% |
| Total | 12,927 | 100.0% |
School Enrollment by Age by Funding Source in Pickaway County
Out of a total of 12,927 students who are enrolled in schools in Pickaway County, 1,861 (14.4%) attend a private institution, while the remaining 11,066 (85.6%) are enrolled in public schools. The age group of 20 to 24 year olds has the highest likelihood of being enrolled in private schools, with 300 (33.7% in the age bracket) enrolled. Conversely, the age group of 15 to 17 year olds has the lowest likelihood of being enrolled in a private school, with 1,983 (89.4% in the age bracket) attending a public institution.
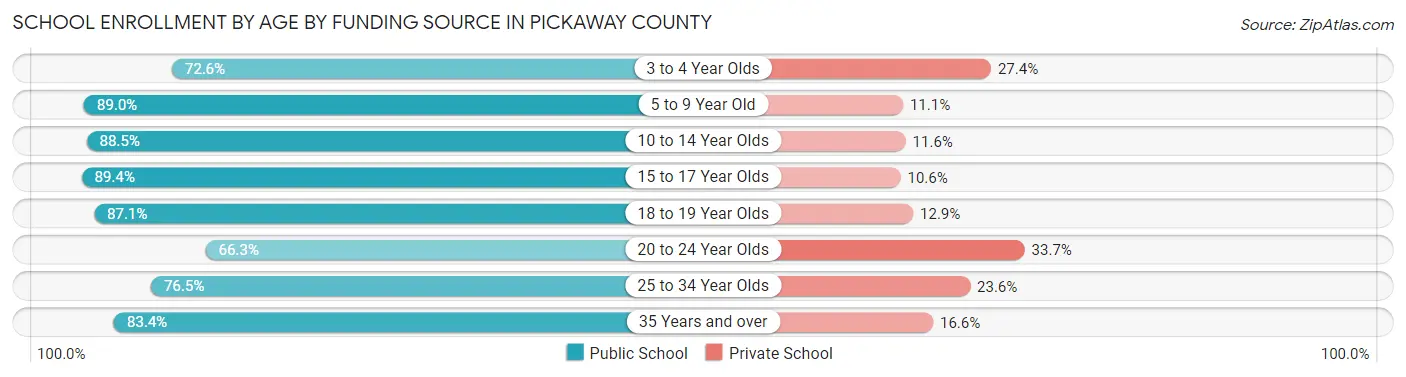
| Age Bracket | Public School | Private School |
| 3 to 4 Year Olds | 349 (72.6%) | 132 (27.4%) |
| 5 to 9 Year Old | 3,139 (88.9%) | 390 (11.1%) |
| 10 to 14 Year Olds | 3,018 (88.4%) | 394 (11.6%) |
| 15 to 17 Year Olds | 1,983 (89.4%) | 235 (10.6%) |
| 18 to 19 Year Olds | 855 (87.1%) | 127 (12.9%) |
| 20 to 24 Year Olds | 590 (66.3%) | 300 (33.7%) |
| 25 to 34 Year Olds | 526 (76.4%) | 162 (23.5%) |
| 35 Years and over | 606 (83.4%) | 121 (16.6%) |
| Total | 11,066 (85.6%) | 1,861 (14.4%) |
Educational Attainment by Field of Study in Pickaway County
Business (1,617 | 19.2%), education (1,420 | 16.9%), science & technology (1,269 | 15.1%), bio, nature & agricultural (789 | 9.4%), and arts & humanities (522 | 6.2%) are the most common fields of study among 8,423 individuals in Pickaway County who have obtained a bachelor's degree or higher.
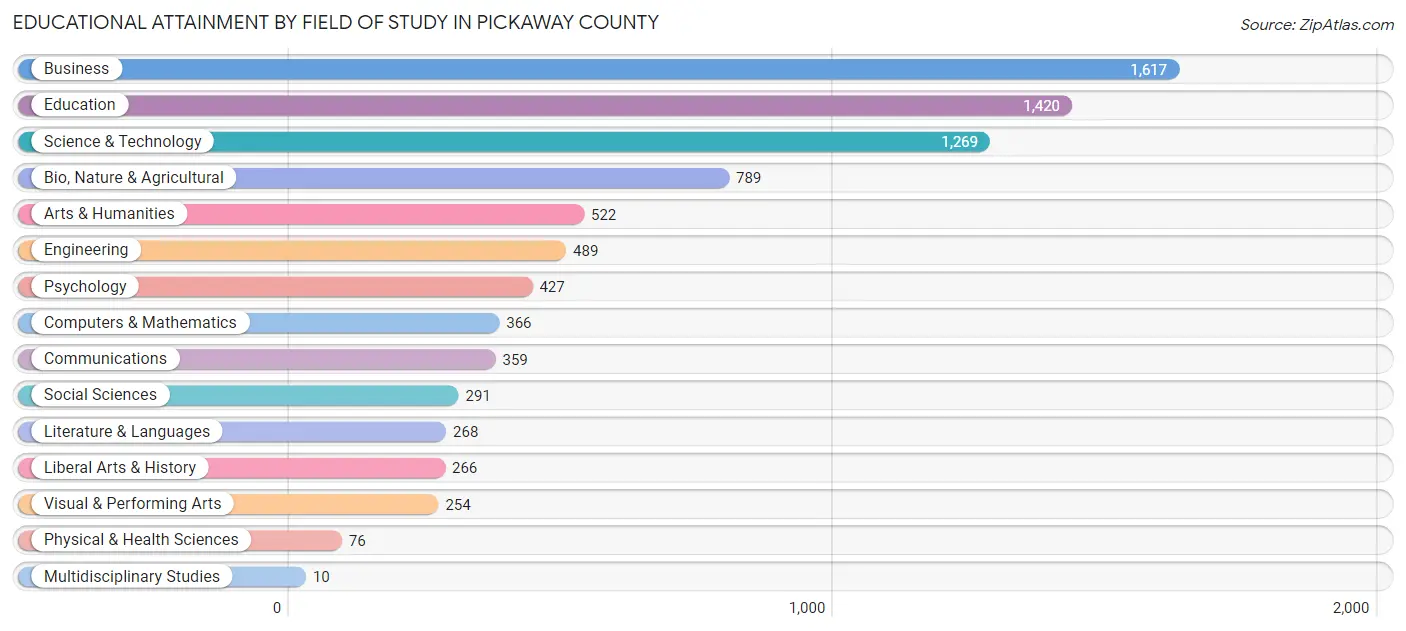
| Field of Study | # Graduates | % Graduates |
| Computers & Mathematics | 366 | 4.3% |
| Bio, Nature & Agricultural | 789 | 9.4% |
| Physical & Health Sciences | 76 | 0.9% |
| Psychology | 427 | 5.1% |
| Social Sciences | 291 | 3.5% |
| Engineering | 489 | 5.8% |
| Multidisciplinary Studies | 10 | 0.1% |
| Science & Technology | 1,269 | 15.1% |
| Business | 1,617 | 19.2% |
| Education | 1,420 | 16.9% |
| Literature & Languages | 268 | 3.2% |
| Liberal Arts & History | 266 | 3.2% |
| Visual & Performing Arts | 254 | 3.0% |
| Communications | 359 | 4.3% |
| Arts & Humanities | 522 | 6.2% |
| Total | 8,423 | 100.0% |
Transportation & Commute in Pickaway County
Vehicle Availability by Sex in Pickaway County
The most prevalent vehicle ownership categories in Pickaway County are males with 2 vehicles (5,568, accounting for 40.6%) and females with 2 vehicles (4,304, making up 48.3%).
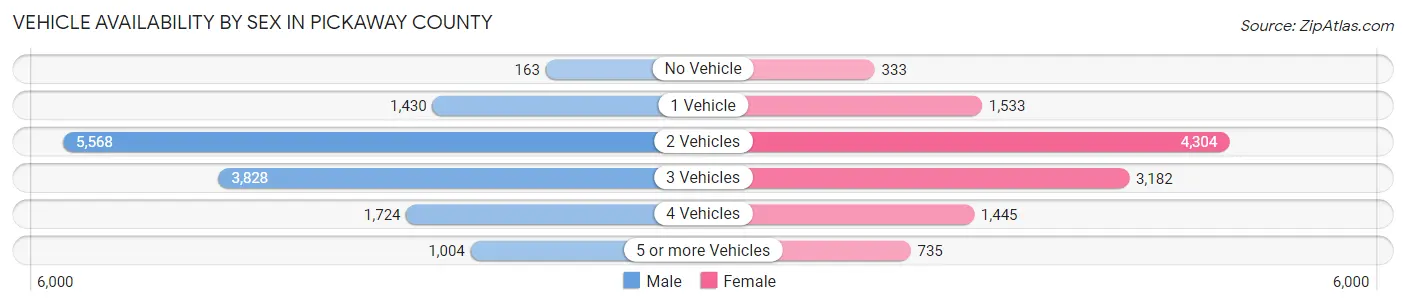
| Vehicles Available | Male | Female |
| No Vehicle | 163 (1.2%) | 333 (2.9%) |
| 1 Vehicle | 1,430 (10.4%) | 1,533 (13.3%) |
| 2 Vehicles | 5,568 (40.6%) | 4,304 (37.3%) |
| 3 Vehicles | 3,828 (27.9%) | 3,182 (27.6%) |
| 4 Vehicles | 1,724 (12.6%) | 1,445 (12.5%) |
| 5 or more Vehicles | 1,004 (7.3%) | 735 (6.4%) |
| Total | 13,717 (100.0%) | 11,532 (100.0%) |
Commute Time in Pickaway County
The most frequently occuring commute durations in Pickaway County are 30 to 34 minutes (3,309 commuters, 14.4%), 45 to 59 minutes (3,101 commuters, 13.5%), and 10 to 14 minutes (2,574 commuters, 11.2%).
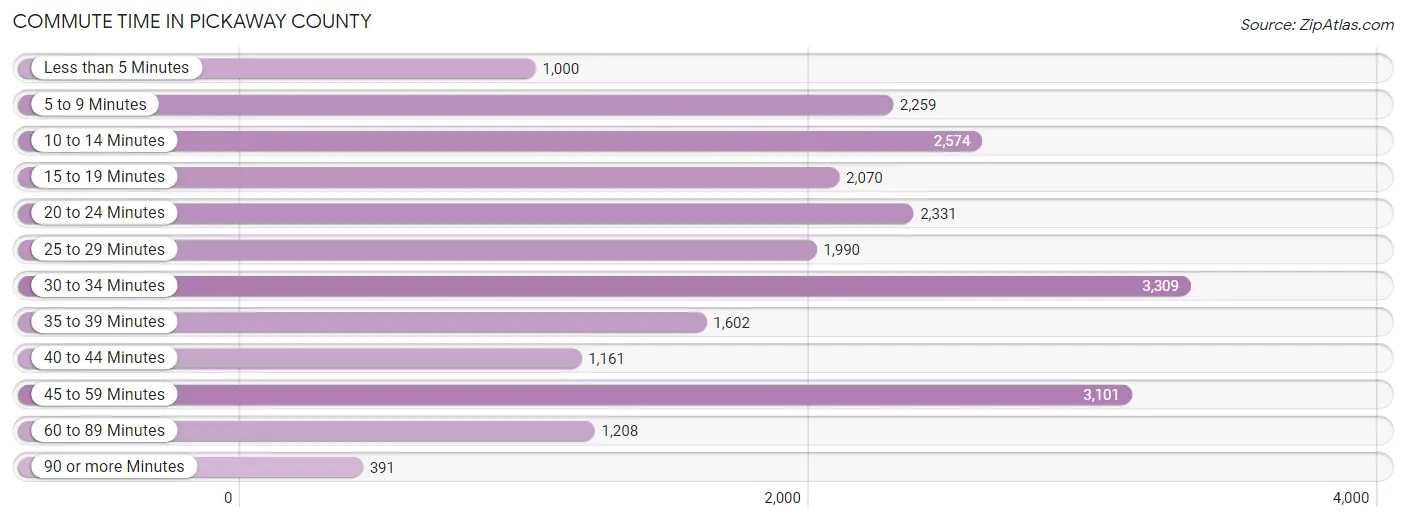
| Commute Time | # Commuters | % Commuters |
| Less than 5 Minutes | 1,000 | 4.3% |
| 5 to 9 Minutes | 2,259 | 9.8% |
| 10 to 14 Minutes | 2,574 | 11.2% |
| 15 to 19 Minutes | 2,070 | 9.0% |
| 20 to 24 Minutes | 2,331 | 10.1% |
| 25 to 29 Minutes | 1,990 | 8.6% |
| 30 to 34 Minutes | 3,309 | 14.4% |
| 35 to 39 Minutes | 1,602 | 7.0% |
| 40 to 44 Minutes | 1,161 | 5.1% |
| 45 to 59 Minutes | 3,101 | 13.5% |
| 60 to 89 Minutes | 1,208 | 5.2% |
| 90 or more Minutes | 391 | 1.7% |
Commute Time by Sex in Pickaway County
The most common commute times in Pickaway County are 30 to 34 minutes (1,782 commuters, 14.2%) for males and 30 to 34 minutes (1,527 commuters, 14.7%) for females.
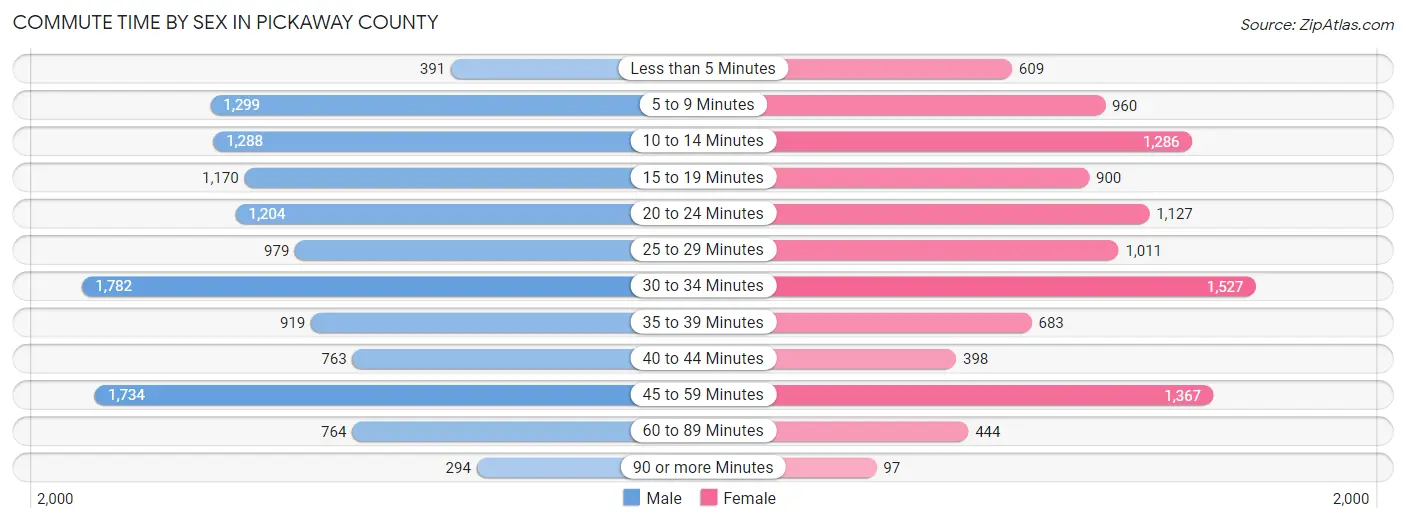
| Commute Time | Male | Female |
| Less than 5 Minutes | 391 (3.1%) | 609 (5.9%) |
| 5 to 9 Minutes | 1,299 (10.3%) | 960 (9.2%) |
| 10 to 14 Minutes | 1,288 (10.2%) | 1,286 (12.3%) |
| 15 to 19 Minutes | 1,170 (9.3%) | 900 (8.6%) |
| 20 to 24 Minutes | 1,204 (9.6%) | 1,127 (10.8%) |
| 25 to 29 Minutes | 979 (7.8%) | 1,011 (9.7%) |
| 30 to 34 Minutes | 1,782 (14.2%) | 1,527 (14.7%) |
| 35 to 39 Minutes | 919 (7.3%) | 683 (6.6%) |
| 40 to 44 Minutes | 763 (6.1%) | 398 (3.8%) |
| 45 to 59 Minutes | 1,734 (13.8%) | 1,367 (13.1%) |
| 60 to 89 Minutes | 764 (6.1%) | 444 (4.3%) |
| 90 or more Minutes | 294 (2.3%) | 97 (0.9%) |
Time of Departure to Work by Sex in Pickaway County
The most frequent times of departure to work in Pickaway County are 6:00 AM to 6:29 AM (2,042, 16.2%) for males and 7:00 AM to 7:29 AM (1,644, 15.8%) for females.
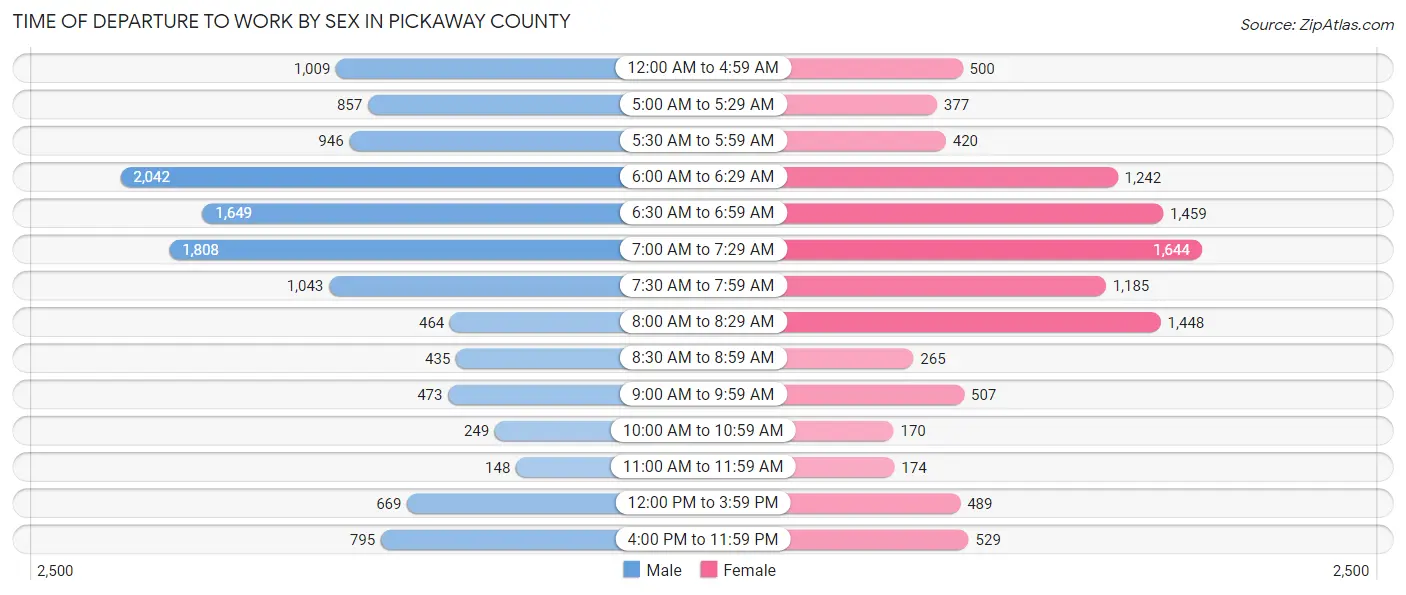
| Time of Departure | Male | Female |
| 12:00 AM to 4:59 AM | 1,009 (8.0%) | 500 (4.8%) |
| 5:00 AM to 5:29 AM | 857 (6.8%) | 377 (3.6%) |
| 5:30 AM to 5:59 AM | 946 (7.5%) | 420 (4.0%) |
| 6:00 AM to 6:29 AM | 2,042 (16.2%) | 1,242 (11.9%) |
| 6:30 AM to 6:59 AM | 1,649 (13.1%) | 1,459 (14.0%) |
| 7:00 AM to 7:29 AM | 1,808 (14.4%) | 1,644 (15.8%) |
| 7:30 AM to 7:59 AM | 1,043 (8.3%) | 1,185 (11.4%) |
| 8:00 AM to 8:29 AM | 464 (3.7%) | 1,448 (13.9%) |
| 8:30 AM to 8:59 AM | 435 (3.5%) | 265 (2.5%) |
| 9:00 AM to 9:59 AM | 473 (3.8%) | 507 (4.9%) |
| 10:00 AM to 10:59 AM | 249 (2.0%) | 170 (1.6%) |
| 11:00 AM to 11:59 AM | 148 (1.2%) | 174 (1.7%) |
| 12:00 PM to 3:59 PM | 669 (5.3%) | 489 (4.7%) |
| 4:00 PM to 11:59 PM | 795 (6.3%) | 529 (5.1%) |
| Total | 12,587 (100.0%) | 10,409 (100.0%) |
Housing Occupancy in Pickaway County
Occupancy by Ownership in Pickaway County
Of the total 21,074 dwellings in Pickaway County, owner-occupied units account for 15,350 (72.8%), while renter-occupied units make up 5,724 (27.2%).
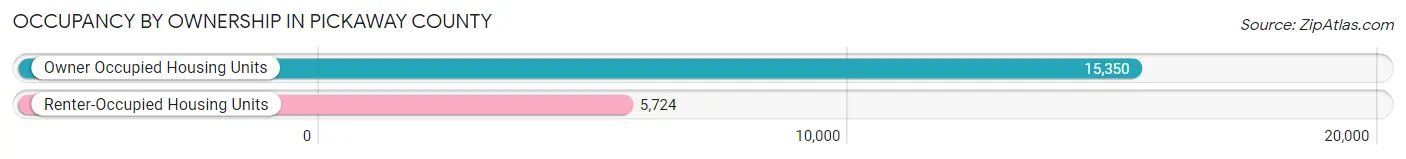
| Occupancy | # Housing Units | % Housing Units |
| Owner Occupied Housing Units | 15,350 | 72.8% |
| Renter-Occupied Housing Units | 5,724 | 27.2% |
| Total Occupied Housing Units | 21,074 | 100.0% |
Occupancy by Household Size in Pickaway County
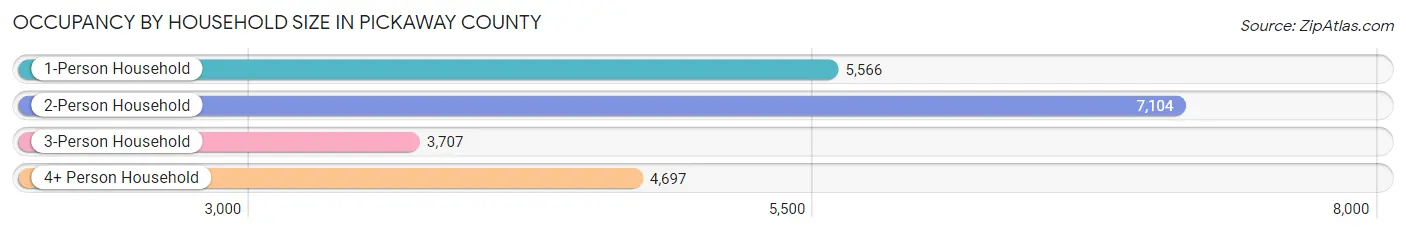
| Household Size | # Housing Units | % Housing Units |
| 1-Person Household | 5,566 | 26.4% |
| 2-Person Household | 7,104 | 33.7% |
| 3-Person Household | 3,707 | 17.6% |
| 4+ Person Household | 4,697 | 22.3% |
| Total Housing Units | 21,074 | 100.0% |
Occupancy by Ownership by Household Size in Pickaway County
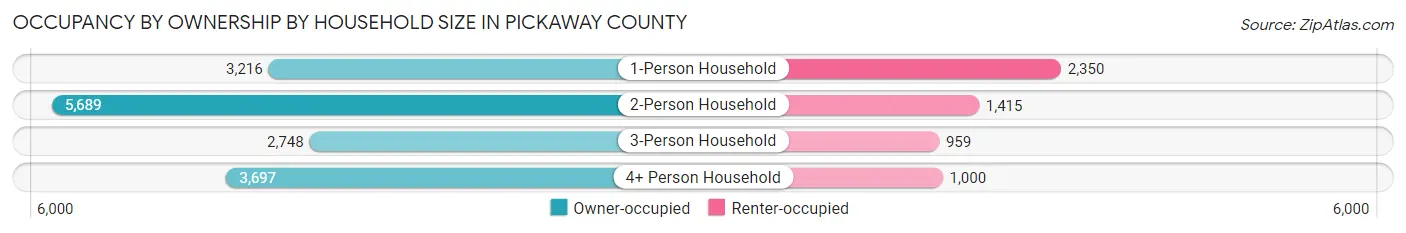
| Household Size | Owner-occupied | Renter-occupied |
| 1-Person Household | 3,216 (57.8%) | 2,350 (42.2%) |
| 2-Person Household | 5,689 (80.1%) | 1,415 (19.9%) |
| 3-Person Household | 2,748 (74.1%) | 959 (25.9%) |
| 4+ Person Household | 3,697 (78.7%) | 1,000 (21.3%) |
| Total Housing Units | 15,350 (72.8%) | 5,724 (27.2%) |
Occupancy by Educational Attainment in Pickaway County
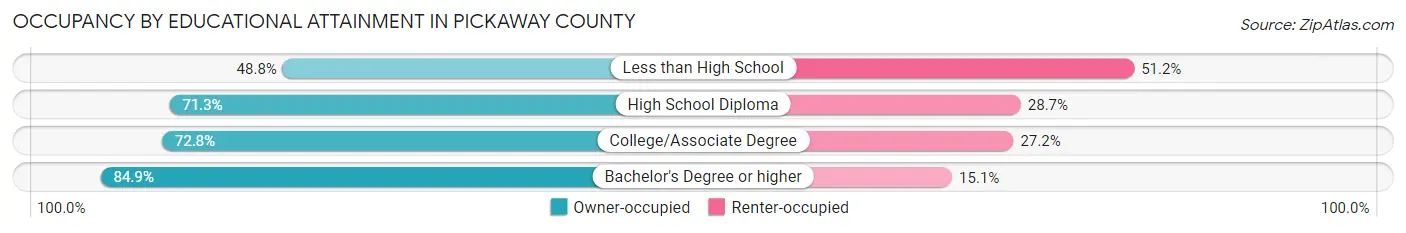
| Household Size | Owner-occupied | Renter-occupied |
| Less than High School | 993 (48.8%) | 1,040 (51.2%) |
| High School Diploma | 5,511 (71.3%) | 2,217 (28.7%) |
| College/Associate Degree | 4,564 (72.8%) | 1,707 (27.2%) |
| Bachelor's Degree or higher | 4,282 (84.9%) | 760 (15.1%) |
Occupancy by Age of Householder in Pickaway County
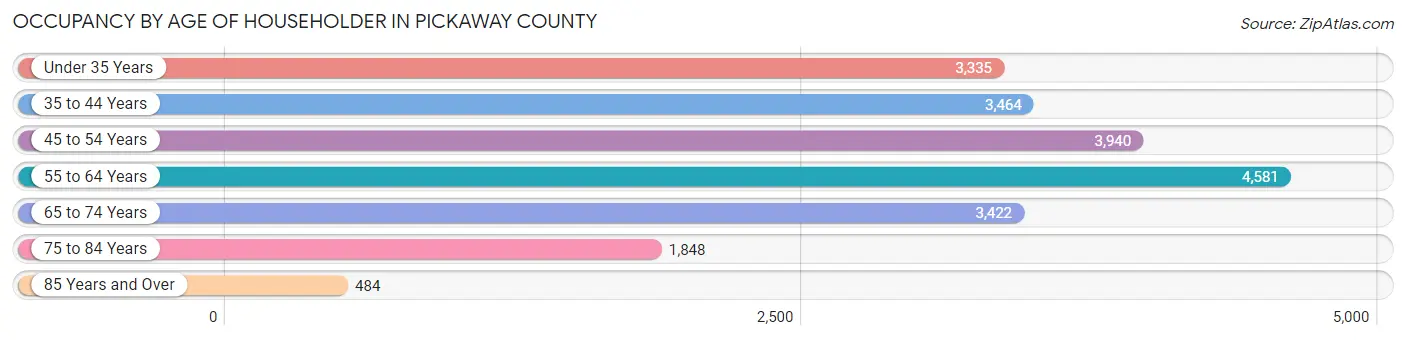
| Age Bracket | # Households | % Households |
| Under 35 Years | 3,335 | 15.8% |
| 35 to 44 Years | 3,464 | 16.4% |
| 45 to 54 Years | 3,940 | 18.7% |
| 55 to 64 Years | 4,581 | 21.7% |
| 65 to 74 Years | 3,422 | 16.2% |
| 75 to 84 Years | 1,848 | 8.8% |
| 85 Years and Over | 484 | 2.3% |
| Total | 21,074 | 100.0% |
Housing Finances in Pickaway County
Median Income by Occupancy in Pickaway County
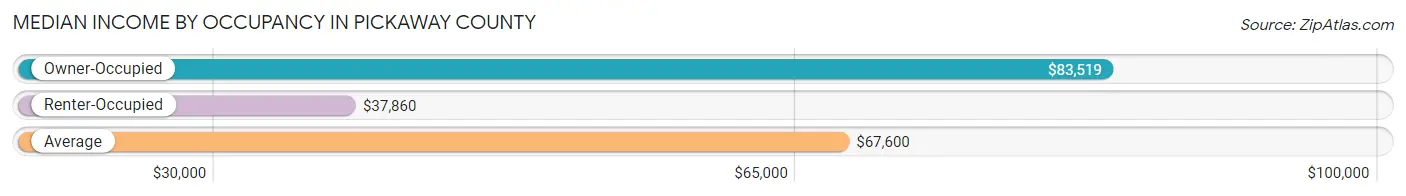
| Occupancy Type | # Households | Median Income |
| Owner-Occupied | 15,350 (72.8%) | $83,519 |
| Renter-Occupied | 5,724 (27.2%) | $37,860 |
| Average | 21,074 (100.0%) | $67,600 |
Occupancy by Householder Income Bracket in Pickaway County
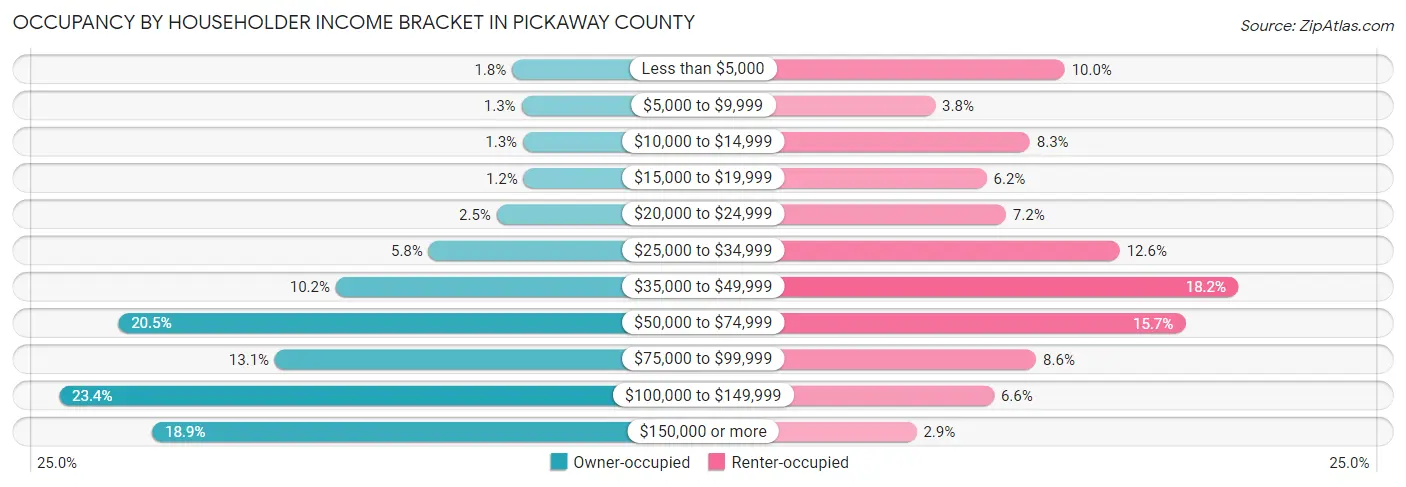
| Income Bracket | Owner-occupied | Renter-occupied |
| Less than $5,000 | 274 (1.8%) | 570 (10.0%) |
| $5,000 to $9,999 | 205 (1.3%) | 217 (3.8%) |
| $10,000 to $14,999 | 195 (1.3%) | 475 (8.3%) |
| $15,000 to $19,999 | 190 (1.2%) | 357 (6.2%) |
| $20,000 to $24,999 | 387 (2.5%) | 410 (7.2%) |
| $25,000 to $34,999 | 884 (5.8%) | 720 (12.6%) |
| $35,000 to $49,999 | 1,562 (10.2%) | 1,042 (18.2%) |
| $50,000 to $74,999 | 3,153 (20.5%) | 898 (15.7%) |
| $75,000 to $99,999 | 2,008 (13.1%) | 492 (8.6%) |
| $100,000 to $149,999 | 3,586 (23.4%) | 377 (6.6%) |
| $150,000 or more | 2,906 (18.9%) | 166 (2.9%) |
| Total | 15,350 (100.0%) | 5,724 (100.0%) |
Monthly Housing Cost Tiers in Pickaway County
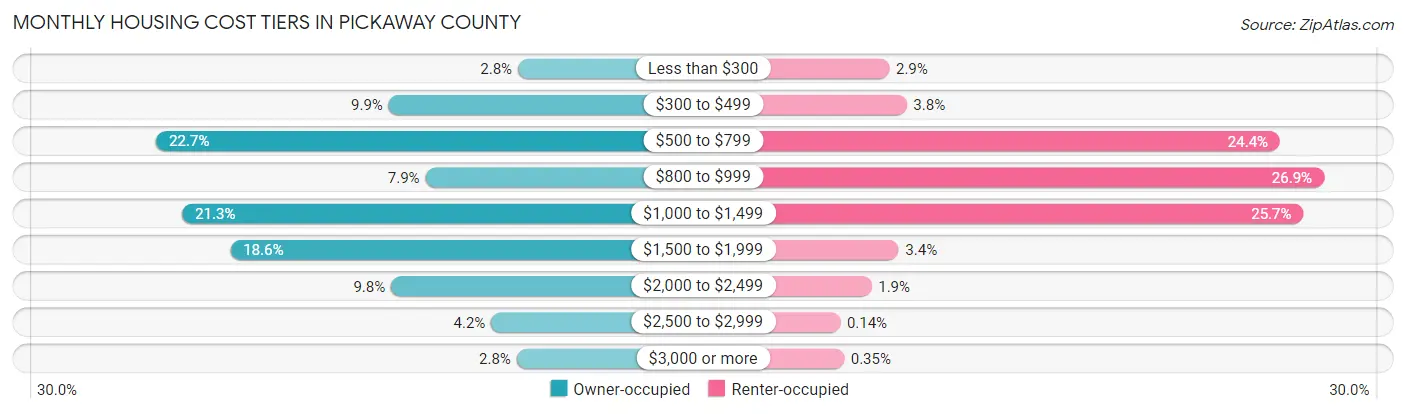
| Monthly Cost | Owner-occupied | Renter-occupied |
| Less than $300 | 422 (2.8%) | 163 (2.9%) |
| $300 to $499 | 1,518 (9.9%) | 218 (3.8%) |
| $500 to $799 | 3,491 (22.7%) | 1,399 (24.4%) |
| $800 to $999 | 1,207 (7.9%) | 1,538 (26.9%) |
| $1,000 to $1,499 | 3,270 (21.3%) | 1,473 (25.7%) |
| $1,500 to $1,999 | 2,861 (18.6%) | 193 (3.4%) |
| $2,000 to $2,499 | 1,498 (9.8%) | 107 (1.9%) |
| $2,500 to $2,999 | 650 (4.2%) | 8 (0.1%) |
| $3,000 or more | 433 (2.8%) | 20 (0.4%) |
| Total | 15,350 (100.0%) | 5,724 (100.0%) |
Physical Housing Characteristics in Pickaway County
Housing Structures in Pickaway County
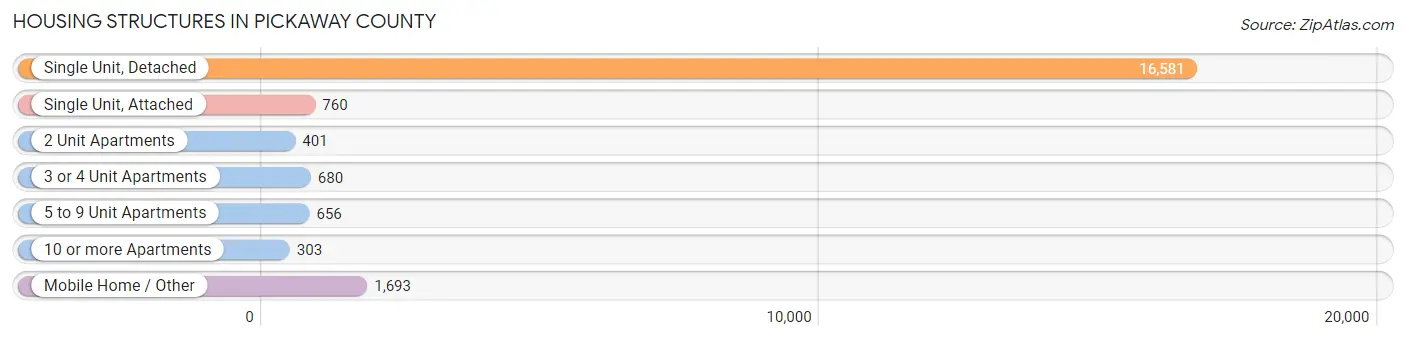
| Structure Type | # Housing Units | % Housing Units |
| Single Unit, Detached | 16,581 | 78.7% |
| Single Unit, Attached | 760 | 3.6% |
| 2 Unit Apartments | 401 | 1.9% |
| 3 or 4 Unit Apartments | 680 | 3.2% |
| 5 to 9 Unit Apartments | 656 | 3.1% |
| 10 or more Apartments | 303 | 1.4% |
| Mobile Home / Other | 1,693 | 8.0% |
| Total | 21,074 | 100.0% |
Housing Structures by Occupancy in Pickaway County
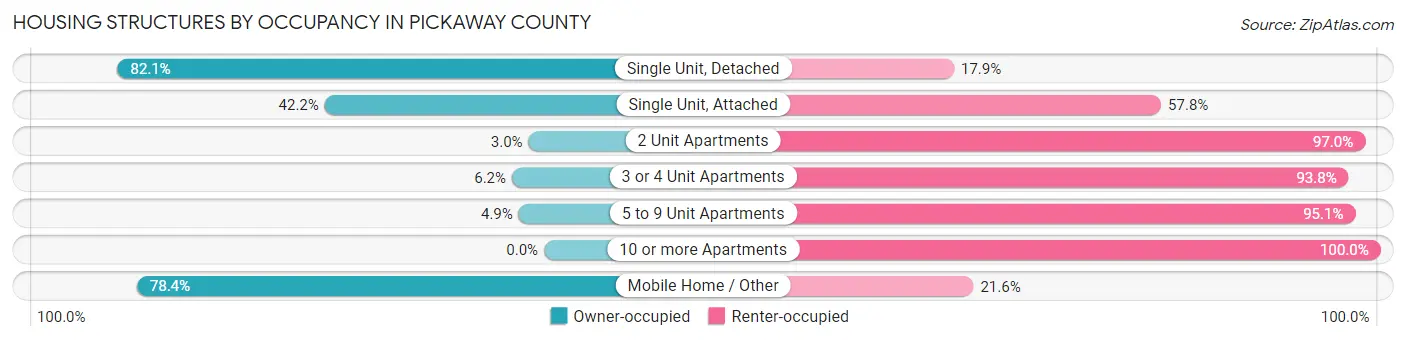
| Structure Type | Owner-occupied | Renter-occupied |
| Single Unit, Detached | 13,616 (82.1%) | 2,965 (17.9%) |
| Single Unit, Attached | 321 (42.2%) | 439 (57.8%) |
| 2 Unit Apartments | 12 (3.0%) | 389 (97.0%) |
| 3 or 4 Unit Apartments | 42 (6.2%) | 638 (93.8%) |
| 5 to 9 Unit Apartments | 32 (4.9%) | 624 (95.1%) |
| 10 or more Apartments | 0 (0.0%) | 303 (100.0%) |
| Mobile Home / Other | 1,327 (78.4%) | 366 (21.6%) |
| Total | 15,350 (72.8%) | 5,724 (27.2%) |
Housing Structures by Number of Rooms in Pickaway County
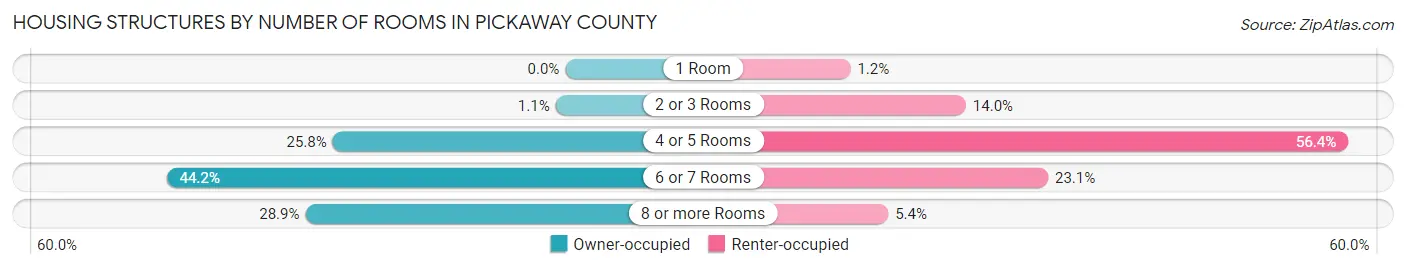
| Number of Rooms | Owner-occupied | Renter-occupied |
| 1 Room | 0 (0.0%) | 67 (1.2%) |
| 2 or 3 Rooms | 166 (1.1%) | 800 (14.0%) |
| 4 or 5 Rooms | 3,964 (25.8%) | 3,228 (56.4%) |
| 6 or 7 Rooms | 6,791 (44.2%) | 1,322 (23.1%) |
| 8 or more Rooms | 4,429 (28.8%) | 307 (5.4%) |
| Total | 15,350 (100.0%) | 5,724 (100.0%) |
Housing Structure by Heating Type in Pickaway County
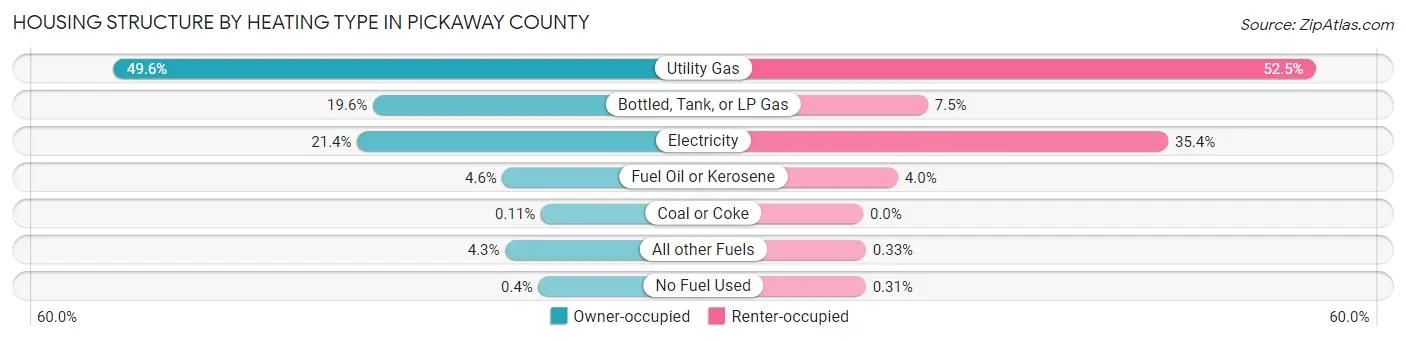
| Heating Type | Owner-occupied | Renter-occupied |
| Utility Gas | 7,620 (49.6%) | 3,002 (52.4%) |
| Bottled, Tank, or LP Gas | 3,007 (19.6%) | 430 (7.5%) |
| Electricity | 3,288 (21.4%) | 2,024 (35.4%) |
| Fuel Oil or Kerosene | 702 (4.6%) | 231 (4.0%) |
| Coal or Coke | 17 (0.1%) | 0 (0.0%) |
| All other Fuels | 654 (4.3%) | 19 (0.3%) |
| No Fuel Used | 62 (0.4%) | 18 (0.3%) |
| Total | 15,350 (100.0%) | 5,724 (100.0%) |
Household Vehicle Usage in Pickaway County
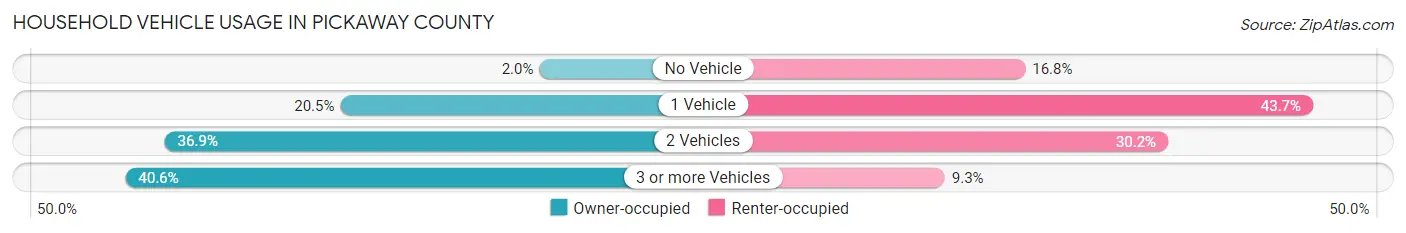
| Vehicles per Household | Owner-occupied | Renter-occupied |
| No Vehicle | 299 (1.9%) | 964 (16.8%) |
| 1 Vehicle | 3,151 (20.5%) | 2,500 (43.7%) |
| 2 Vehicles | 5,669 (36.9%) | 1,726 (30.1%) |
| 3 or more Vehicles | 6,231 (40.6%) | 534 (9.3%) |
| Total | 15,350 (100.0%) | 5,724 (100.0%) |
Real Estate & Mortgages in Pickaway County
Real Estate and Mortgage Overview in Pickaway County
| Characteristic | Without Mortgage | With Mortgage |
| Housing Units | 5,716 | 9,634 |
| Median Property Value | $172,100 | $240,200 |
| Median Household Income | $62,372 | $2,167 |
| Monthly Housing Costs | $573 | $433 |
| Real Estate Taxes | $1,977 | $224 |
Property Value by Mortgage Status in Pickaway County
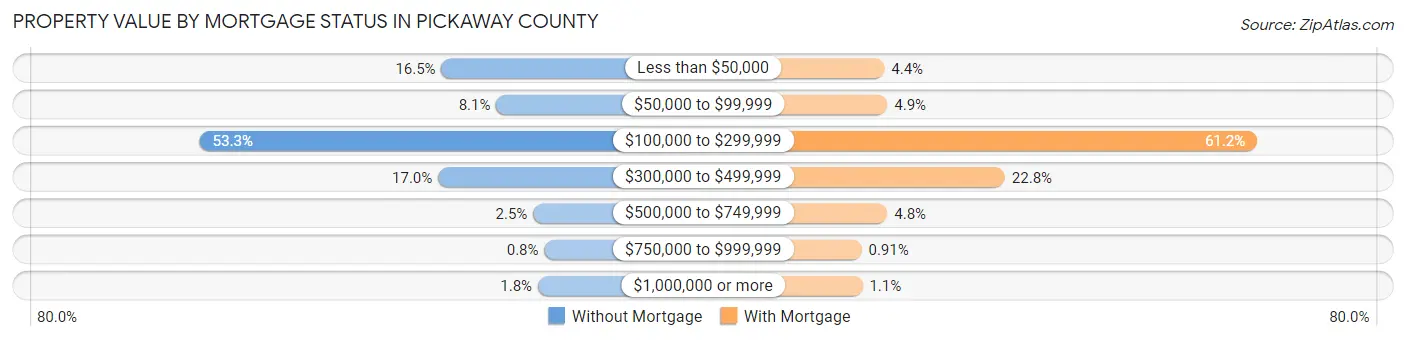
| Property Value | Without Mortgage | With Mortgage |
| Less than $50,000 | 942 (16.5%) | 423 (4.4%) |
| $50,000 to $99,999 | 464 (8.1%) | 467 (4.9%) |
| $100,000 to $299,999 | 3,048 (53.3%) | 5,896 (61.2%) |
| $300,000 to $499,999 | 971 (17.0%) | 2,193 (22.8%) |
| $500,000 to $749,999 | 143 (2.5%) | 466 (4.8%) |
| $750,000 to $999,999 | 46 (0.8%) | 88 (0.9%) |
| $1,000,000 or more | 102 (1.8%) | 101 (1.1%) |
| Total | 5,716 (100.0%) | 9,634 (100.0%) |
Household Income by Mortgage Status in Pickaway County
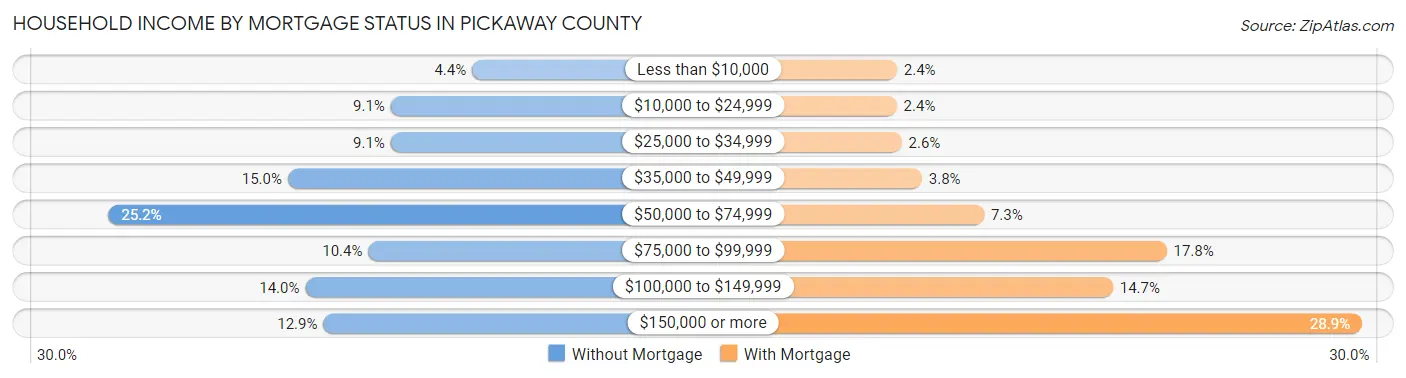
| Household Income | Without Mortgage | With Mortgage |
| Less than $10,000 | 253 (4.4%) | 227 (2.4%) |
| $10,000 to $24,999 | 519 (9.1%) | 226 (2.4%) |
| $25,000 to $34,999 | 519 (9.1%) | 253 (2.6%) |
| $35,000 to $49,999 | 855 (15.0%) | 365 (3.8%) |
| $50,000 to $74,999 | 1,441 (25.2%) | 707 (7.3%) |
| $75,000 to $99,999 | 592 (10.4%) | 1,712 (17.8%) |
| $100,000 to $149,999 | 798 (14.0%) | 1,416 (14.7%) |
| $150,000 or more | 739 (12.9%) | 2,788 (28.9%) |
| Total | 5,716 (100.0%) | 9,634 (100.0%) |
Property Value to Household Income Ratio in Pickaway County
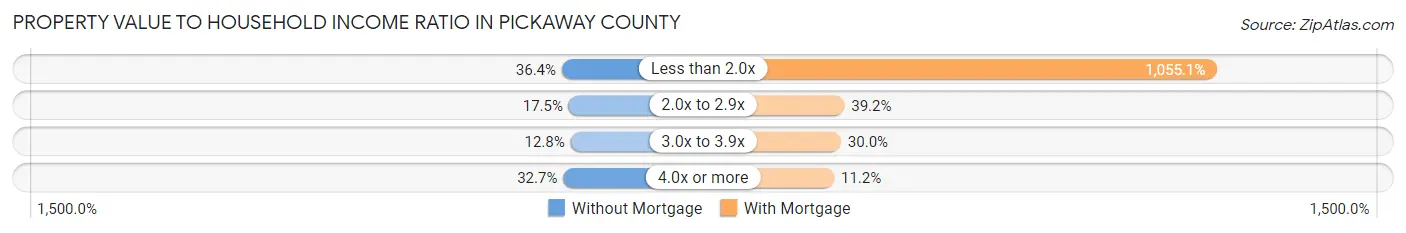
| Value-to-Income Ratio | Without Mortgage | With Mortgage |
| Less than 2.0x | 2,079 (36.4%) | 101,651 (1,055.1%) |
| 2.0x to 2.9x | 998 (17.5%) | 3,779 (39.2%) |
| 3.0x to 3.9x | 729 (12.8%) | 2,887 (30.0%) |
| 4.0x or more | 1,866 (32.7%) | 1,076 (11.2%) |
| Total | 5,716 (100.0%) | 9,634 (100.0%) |
Real Estate Taxes by Mortgage Status in Pickaway County
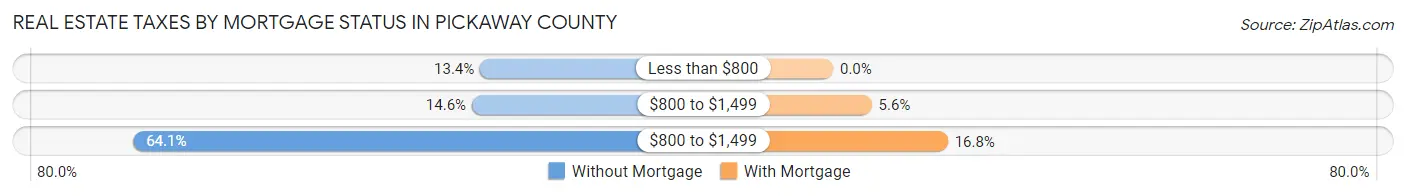
| Property Taxes | Without Mortgage | With Mortgage |
| Less than $800 | 768 (13.4%) | 0 (0.0%) |
| $800 to $1,499 | 837 (14.6%) | 542 (5.6%) |
| $800 to $1,499 | 3,665 (64.1%) | 1,614 (16.8%) |
| Total | 5,716 (100.0%) | 9,634 (100.0%) |
Health & Disability in Pickaway County
Health Insurance Coverage by Age in Pickaway County
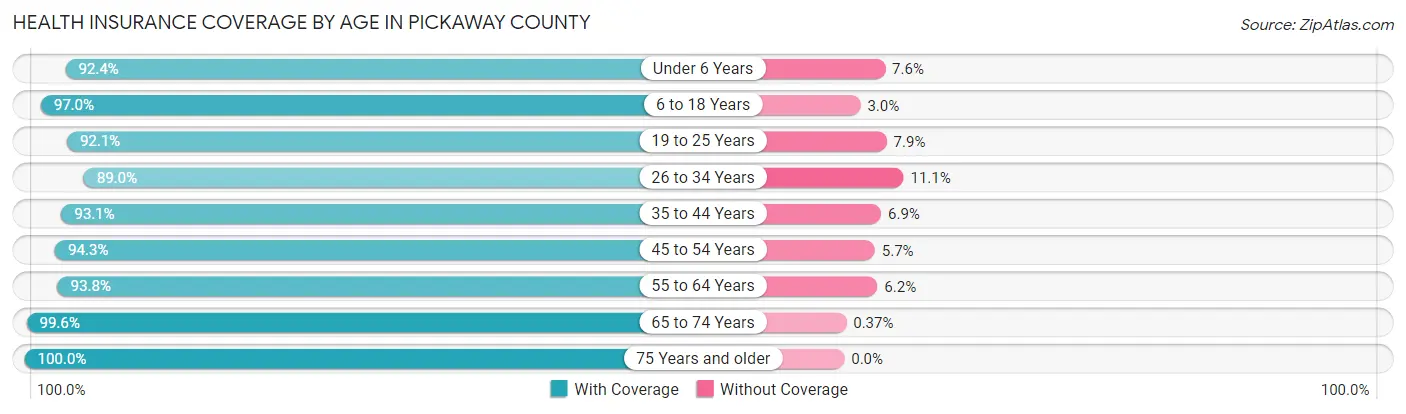
| Age Bracket | With Coverage | Without Coverage |
| Under 6 Years | 3,445 (92.4%) | 284 (7.6%) |
| 6 to 18 Years | 9,336 (97.0%) | 291 (3.0%) |
| 19 to 25 Years | 4,398 (92.1%) | 377 (7.9%) |
| 26 to 34 Years | 5,460 (88.9%) | 678 (11.1%) |
| 35 to 44 Years | 6,517 (93.1%) | 480 (6.9%) |
| 45 to 54 Years | 6,893 (94.3%) | 416 (5.7%) |
| 55 to 64 Years | 6,914 (93.8%) | 455 (6.2%) |
| 65 to 74 Years | 5,324 (99.6%) | 20 (0.4%) |
| 75 Years and older | 3,543 (100.0%) | 0 (0.0%) |
| Total | 51,830 (94.5%) | 3,001 (5.5%) |
Health Insurance Coverage by Citizenship Status in Pickaway County
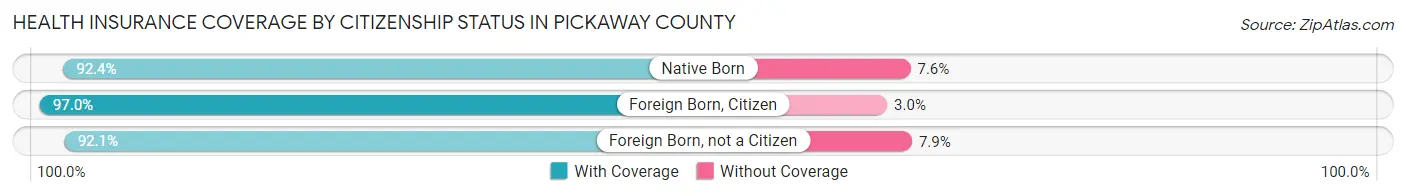
| Citizenship Status | With Coverage | Without Coverage |
| Native Born | 3,445 (92.4%) | 284 (7.6%) |
| Foreign Born, Citizen | 9,336 (97.0%) | 291 (3.0%) |
| Foreign Born, not a Citizen | 4,398 (92.1%) | 377 (7.9%) |
Health Insurance Coverage by Household Income in Pickaway County
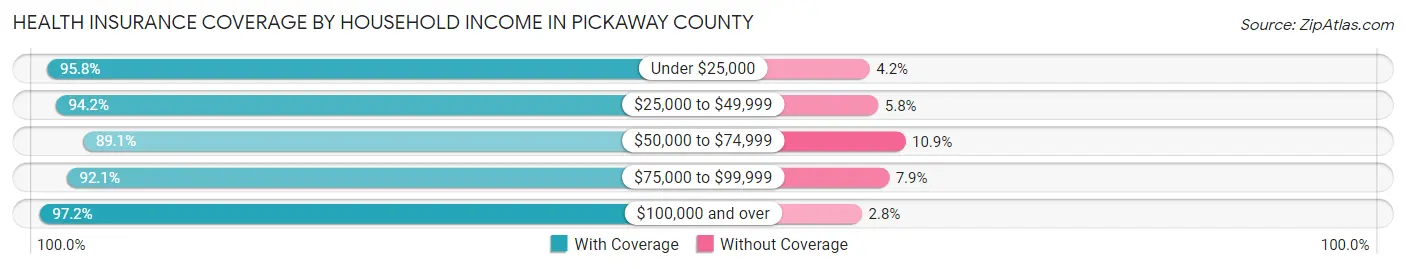
| Household Income | With Coverage | Without Coverage |
| Under $25,000 | 5,469 (95.8%) | 241 (4.2%) |
| $25,000 to $49,999 | 8,470 (94.2%) | 523 (5.8%) |
| $50,000 to $74,999 | 8,357 (89.1%) | 1,023 (10.9%) |
| $75,000 to $99,999 | 6,340 (92.1%) | 541 (7.9%) |
| $100,000 and over | 22,962 (97.2%) | 654 (2.8%) |
Public vs Private Health Insurance Coverage by Age in Pickaway County
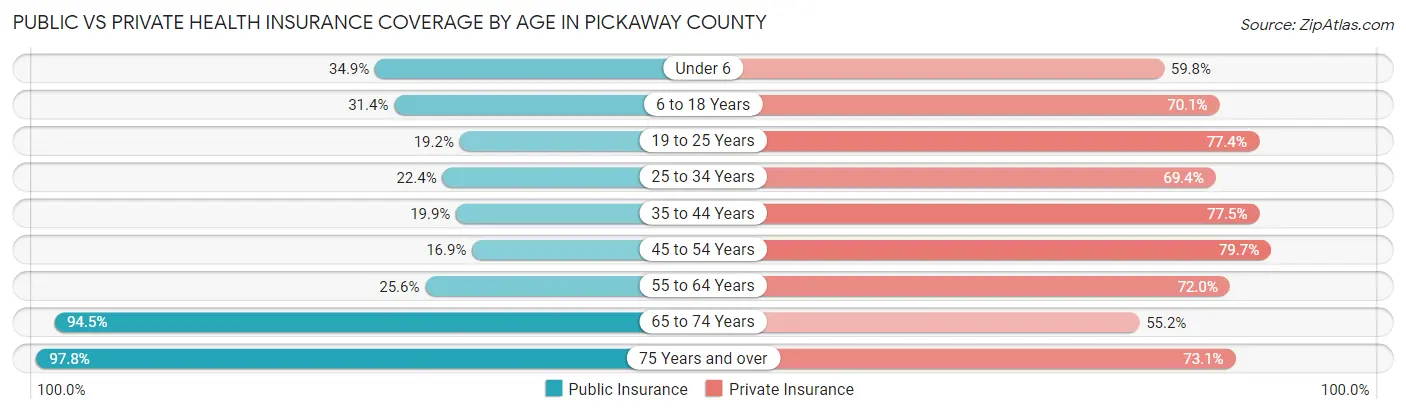
| Age Bracket | Public Insurance | Private Insurance |
| Under 6 | 1,303 (34.9%) | 2,229 (59.8%) |
| 6 to 18 Years | 3,022 (31.4%) | 6,748 (70.1%) |
| 19 to 25 Years | 918 (19.2%) | 3,695 (77.4%) |
| 25 to 34 Years | 1,377 (22.4%) | 4,258 (69.4%) |
| 35 to 44 Years | 1,392 (19.9%) | 5,421 (77.5%) |
| 45 to 54 Years | 1,236 (16.9%) | 5,822 (79.7%) |
| 55 to 64 Years | 1,888 (25.6%) | 5,306 (72.0%) |
| 65 to 74 Years | 5,052 (94.5%) | 2,950 (55.2%) |
| 75 Years and over | 3,465 (97.8%) | 2,588 (73.1%) |
| Total | 19,653 (35.8%) | 39,017 (71.2%) |
Disability Status by Sex by Age in Pickaway County
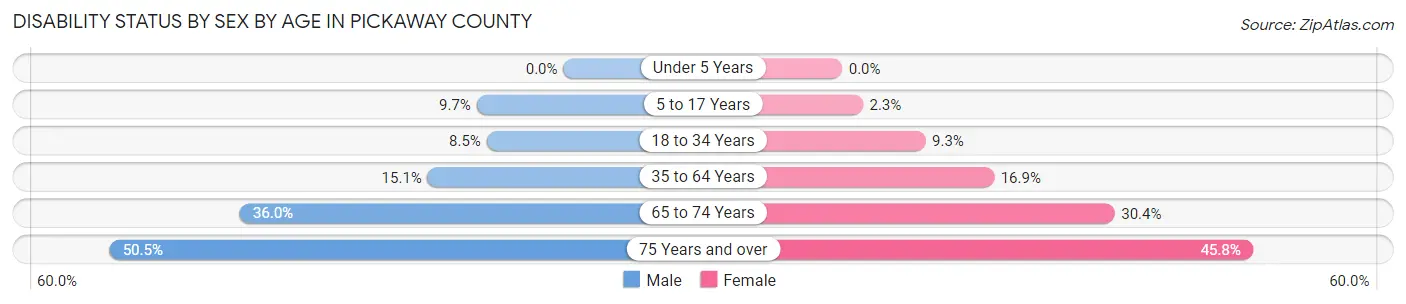
| Age Bracket | Male | Female |
| Under 5 Years | 0 (0.0%) | 0 (0.0%) |
| 5 to 17 Years | 457 (9.7%) | 107 (2.3%) |
| 18 to 34 Years | 533 (8.5%) | 517 (9.3%) |
| 35 to 64 Years | 1,650 (15.1%) | 1,820 (16.9%) |
| 65 to 74 Years | 884 (36.0%) | 877 (30.3%) |
| 75 Years and over | 772 (50.5%) | 922 (45.8%) |
Disability Class by Sex by Age in Pickaway County
Disability Class: Hearing Difficulty
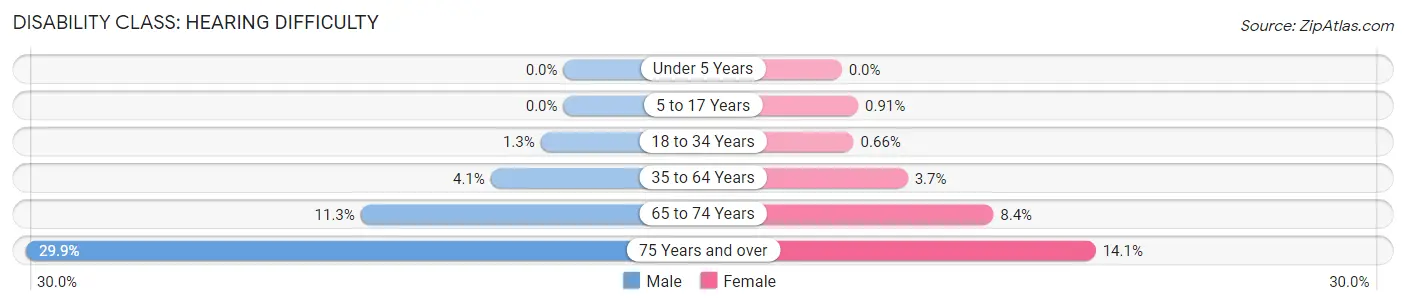
| Age Bracket | Male | Female |
| Under 5 Years | 0 (0.0%) | 0 (0.0%) |
| 5 to 17 Years | 0 (0.0%) | 42 (0.9%) |
| 18 to 34 Years | 79 (1.3%) | 37 (0.7%) |
| 35 to 64 Years | 442 (4.1%) | 395 (3.7%) |
| 65 to 74 Years | 277 (11.3%) | 244 (8.4%) |
| 75 Years and over | 457 (29.9%) | 285 (14.1%) |
Disability Class: Vision Difficulty
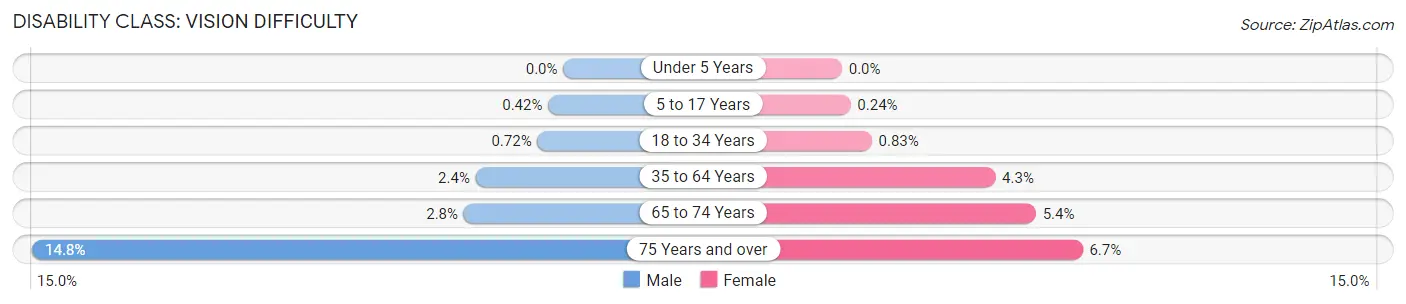
| Age Bracket | Male | Female |
| Under 5 Years | 0 (0.0%) | 0 (0.0%) |
| 5 to 17 Years | 20 (0.4%) | 11 (0.2%) |
| 18 to 34 Years | 45 (0.7%) | 46 (0.8%) |
| 35 to 64 Years | 266 (2.4%) | 459 (4.3%) |
| 65 to 74 Years | 68 (2.8%) | 156 (5.4%) |
| 75 Years and over | 226 (14.8%) | 135 (6.7%) |
Disability Class: Cognitive Difficulty
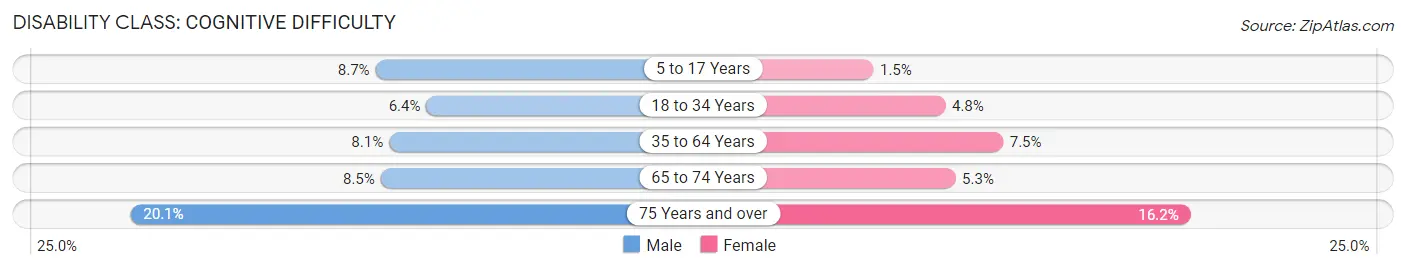
| Age Bracket | Male | Female |
| 5 to 17 Years | 413 (8.7%) | 67 (1.5%) |
| 18 to 34 Years | 397 (6.4%) | 267 (4.8%) |
| 35 to 64 Years | 883 (8.1%) | 803 (7.5%) |
| 65 to 74 Years | 208 (8.5%) | 152 (5.3%) |
| 75 Years and over | 307 (20.1%) | 326 (16.2%) |
Disability Class: Ambulatory Difficulty
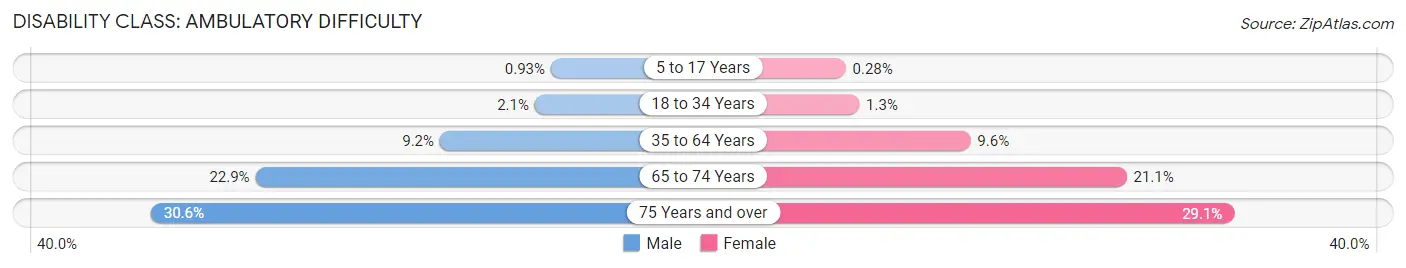
| Age Bracket | Male | Female |
| 5 to 17 Years | 44 (0.9%) | 13 (0.3%) |
| 18 to 34 Years | 132 (2.1%) | 72 (1.3%) |
| 35 to 64 Years | 1,001 (9.2%) | 1,027 (9.6%) |
| 65 to 74 Years | 561 (22.9%) | 611 (21.1%) |
| 75 Years and over | 468 (30.6%) | 587 (29.1%) |
Disability Class: Self-Care Difficulty
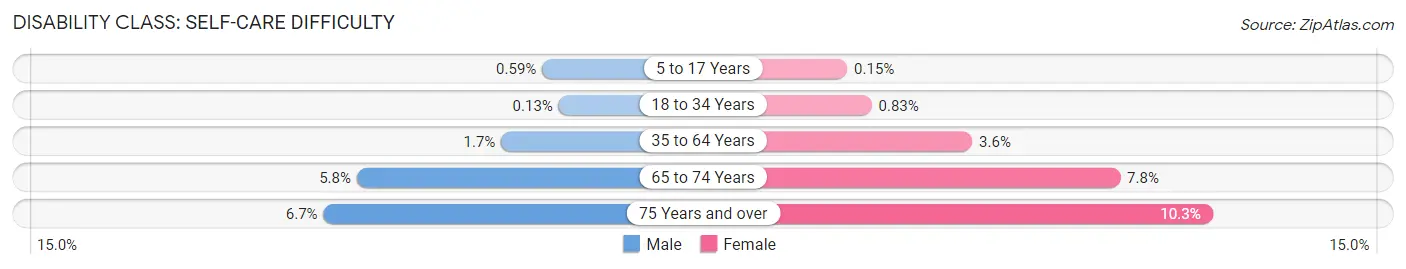
| Age Bracket | Male | Female |
| 5 to 17 Years | 28 (0.6%) | 7 (0.2%) |
| 18 to 34 Years | 8 (0.1%) | 46 (0.8%) |
| 35 to 64 Years | 189 (1.7%) | 390 (3.6%) |
| 65 to 74 Years | 141 (5.8%) | 224 (7.7%) |
| 75 Years and over | 102 (6.7%) | 208 (10.3%) |
Technology Access in Pickaway County
Computing Device Access in Pickaway County
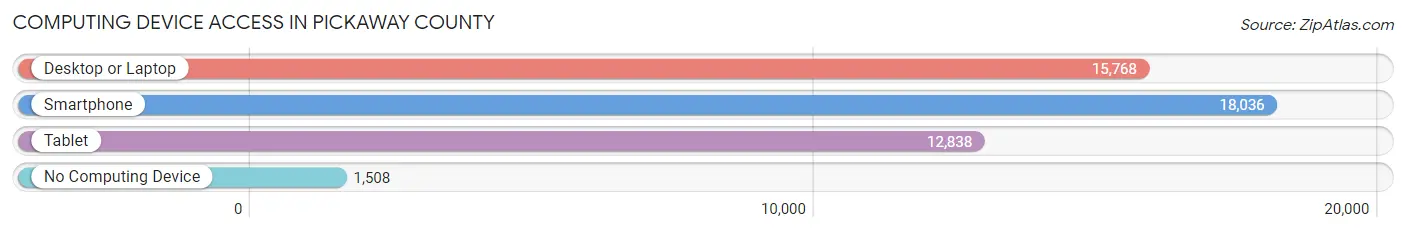
| Device Type | # Households | % Households |
| Desktop or Laptop | 15,768 | 74.8% |
| Smartphone | 18,036 | 85.6% |
| Tablet | 12,838 | 60.9% |
| No Computing Device | 1,508 | 7.2% |
| Total | 21,074 | 100.0% |
Internet Access in Pickaway County
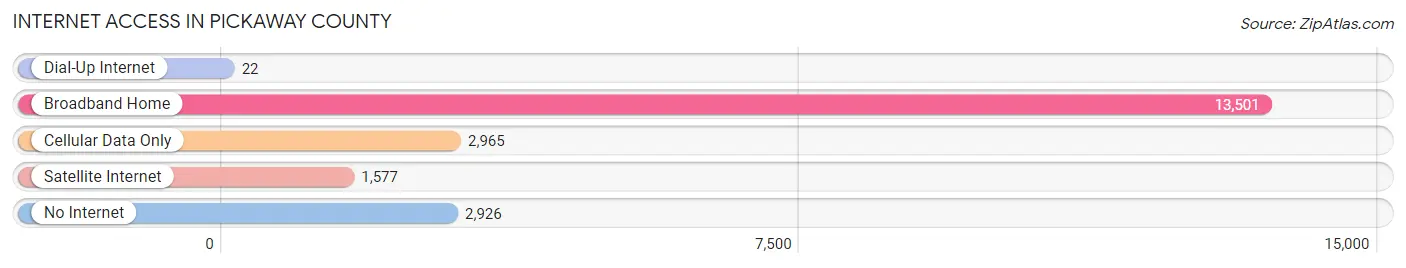
| Internet Type | # Households | % Households |
| Dial-Up Internet | 22 | 0.1% |
| Broadband Home | 13,501 | 64.1% |
| Cellular Data Only | 2,965 | 14.1% |
| Satellite Internet | 1,577 | 7.5% |
| No Internet | 2,926 | 13.9% |
| Total | 21,074 | 100.0% |
Pickaway County Summary
Pickaway County is located in the state of Ohio, in the United States of America. It is part of the Columbus, Ohio Metropolitan Statistical Area. The county seat is Circleville. As of the 2010 census, the population was 55,698.
Geography
Pickaway County is located in the central part of Ohio, and is bordered by Madison County to the north, Fairfield County to the east, Ross County to the south, and Fayette County to the west. The county has a total area of 519 square miles, of which 517 square miles is land and 2.2 square miles is water. The county is drained by the Scioto River and its tributaries. The highest point in the county is located in the northwest corner, at an elevation of 1,068 feet.
History
Pickaway County was formed in 1810 from parts of Ross and Fairfield counties. It was named for the Pekowi, a Native American tribe that once lived in the area. The county was originally divided into six townships: Circleville, Darby, Deer Creek, Madison, Monroe, and Walnut.
The first settlers in the county were Quakers, who arrived in 1806. The county was officially organized in 1810, and the first county seat was located in Circleville. The county was divided into two townships in 1812, and the first courthouse was built in 1813.
The county grew rapidly in the 19th century, and by the time of the Civil War, it had a population of over 20,000. During the war, the county was divided into two parts, with the northern part supporting the Union and the southern part supporting the Confederacy.
Economy
Pickaway County’s economy is largely based on agriculture and manufacturing. The county is home to several large farms, and the agricultural industry is the largest employer in the county. The county is also home to several manufacturing companies, including Honda of America Manufacturing, which has a large plant in Marysville.
The county also has a growing tourism industry, with several attractions, including the Ohio State Reformatory, the Pickaway County Historical Society, and the Pickaway County Fair.
Demographics
As of the 2010 census, the population of Pickaway County was 55,698. The racial makeup of the county was 94.2% White, 2.7% African American, 0.3% Native American, 0.5% Asian, 0.1% Pacific Islander, 0.7% from other races, and 1.5% from two or more races. Hispanic or Latino of any race were 2.2% of the population.
The median income for a household in the county was $45,945, and the median income for a family was $54,945. The per capita income for the county was $22,845. About 8.7% of families and 11.2% of the population were below the poverty line, including 15.2% of those under age 18 and 8.2% of those age 65 or over.
Pickaway County is served by the Pickaway County Public Library System, which consists of five branches located throughout the county. The county is also served by the Pickaway County Joint Vocational School District, which provides vocational and technical education to students in the county.
Common Questions
What is Per Capita Income in Pickaway County?
Per Capita income in Pickaway County is $32,689.
What is the Median Family Income in Pickaway County?
Median Family Income in Pickaway County is $84,187.
What is the Median Household income in Pickaway County?
Median Household Income in Pickaway County is $67,600.
What is Income or Wage Gap in Pickaway County?
Income or Wage Gap in Pickaway County is 22.5%.
Women in Pickaway County earn 77.5 cents for every dollar earned by a man.
What is Family Income Deficit in Pickaway County?
Family Income Deficit in Pickaway County is $11,959.
Families that are below poverty line in Pickaway County earn $11,959 less on average than the poverty threshold level.
What is Inequality or Gini Index in Pickaway County?
Inequality or Gini Index in Pickaway County is 0.43.
What is the Total Population of Pickaway County?
Total Population of Pickaway County is 58,809.
What is the Total Male Population of Pickaway County?
Total Male Population of Pickaway County is 31,103.
What is the Total Female Population of Pickaway County?
Total Female Population of Pickaway County is 27,706.
What is the Ratio of Males per 100 Females in Pickaway County?
There are 112.26 Males per 100 Females in Pickaway County.
What is the Ratio of Females per 100 Males in Pickaway County?
There are 89.08 Females per 100 Males in Pickaway County.
What is the Median Population Age in Pickaway County?
Median Population Age in Pickaway County is 39.5 Years.
What is the Average Family Size in Pickaway County
Average Family Size in Pickaway County is 3.1 People.
What is the Average Household Size in Pickaway County
Average Household Size in Pickaway County is 2.6 People.
How Large is the Labor Force in Pickaway County?
There are 27,020 People in the Labor Forcein in Pickaway County.
What is the Percentage of People in the Labor Force in Pickaway County?
56.6% of People are in the Labor Force in Pickaway County.
What is the Unemployment Rate in Pickaway County?
Unemployment Rate in Pickaway County is 4.1%.