Jackson County, OH Map & Demographics
Jackson County Map
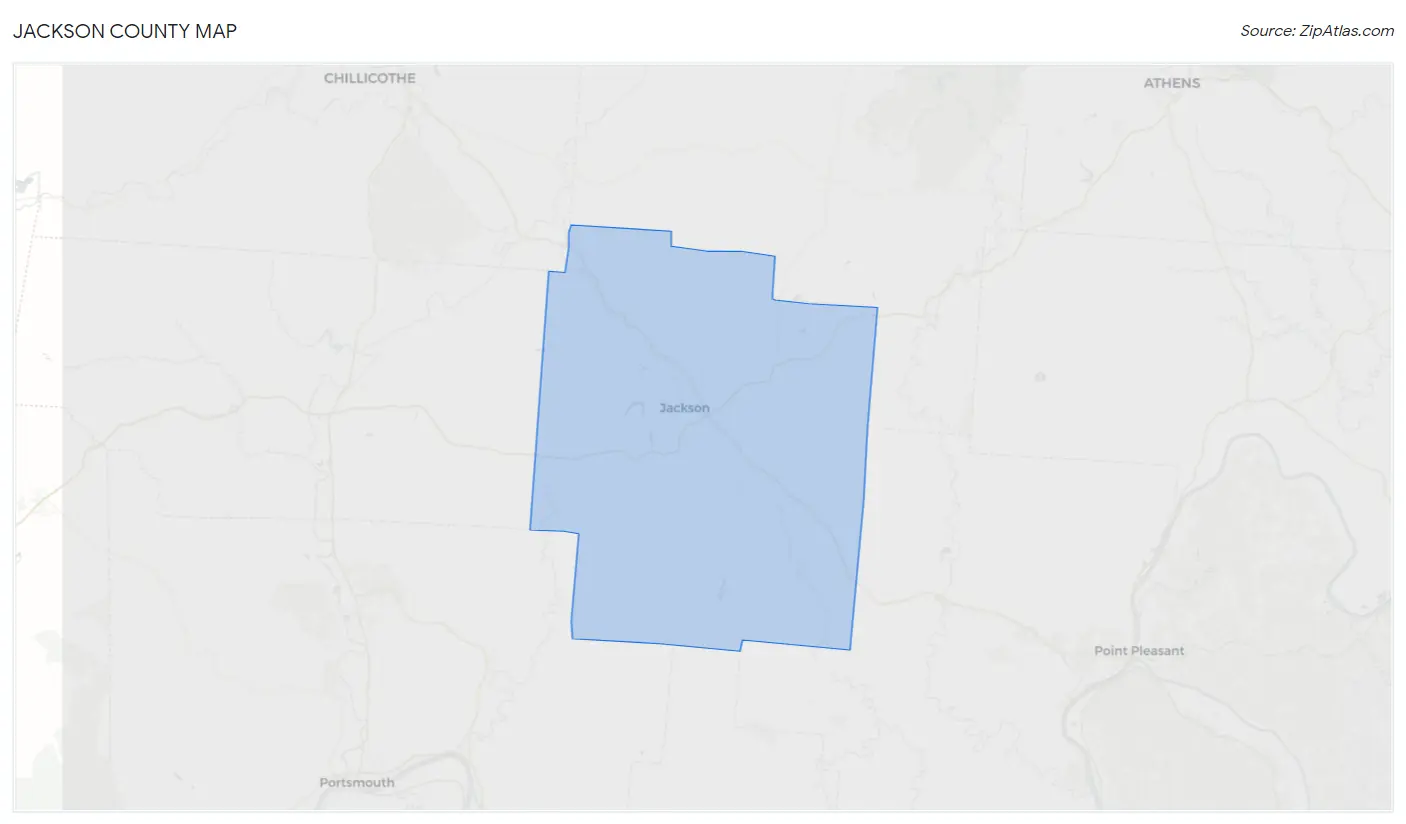
Jackson County Overview
$28,570
PER CAPITA INCOME
$69,172
AVG FAMILY INCOME
$56,549
AVG HOUSEHOLD INCOME
33.5%
WAGE / INCOME GAP [ % ]
66.5¢/ $1
WAGE / INCOME GAP [ $ ]
$9,281
FAMILY INCOME DEFICIT
0.46
INEQUALITY / GINI INDEX
32,563
TOTAL POPULATION
16,059
MALE POPULATION
16,504
FEMALE POPULATION
97.30
MALES / 100 FEMALES
102.77
FEMALES / 100 MALES
40.1
MEDIAN AGE
3.0
AVG FAMILY SIZE
2.6
AVG HOUSEHOLD SIZE
14,607
LABOR FORCE [ PEOPLE ]
56.7%
PERCENT IN LABOR FORCE
5.9%
UNEMPLOYMENT RATE
Jackson County Area Codes
Income in Jackson County
Income Overview in Jackson County
Per Capita Income in Jackson County is $28,570, while median incomes of families and households are $69,172 and $56,549 respectively.
| Characteristic | Number | Measure |
| Per Capita Income | 32,563 | $28,570 |
| Median Family Income | 8,676 | $69,172 |
| Mean Family Income | 8,676 | $88,887 |
| Median Household Income | 12,453 | $56,549 |
| Mean Household Income | 12,453 | $73,765 |
| Income Deficit | 8,676 | $9,281 |
| Wage / Income Gap (%) | 32,563 | 33.48% |
| Wage / Income Gap ($) | 32,563 | 66.52¢ per $1 |
| Gini / Inequality Index | 32,563 | 0.46 |
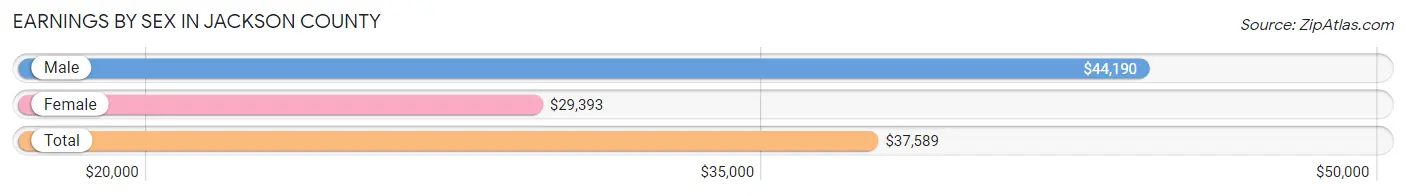
Earnings by Sex in Jackson County
Average Earnings in Jackson County are $37,589, $44,190 for men and $29,393 for women, a difference of 33.5%.
| Sex | Number | Average Earnings |
| Male | 8,103 (53.3%) | $44,190 |
| Female | 7,110 (46.7%) | $29,393 |
| Total | 15,213 (100.0%) | $37,589 |
Earnings by Sex by Income Bracket in Jackson County
The most common earnings brackets in Jackson County are $40,000 to $44,999 for men (852 | 10.5%) and $30,000 to $34,999 for women (601 | 8.5%).
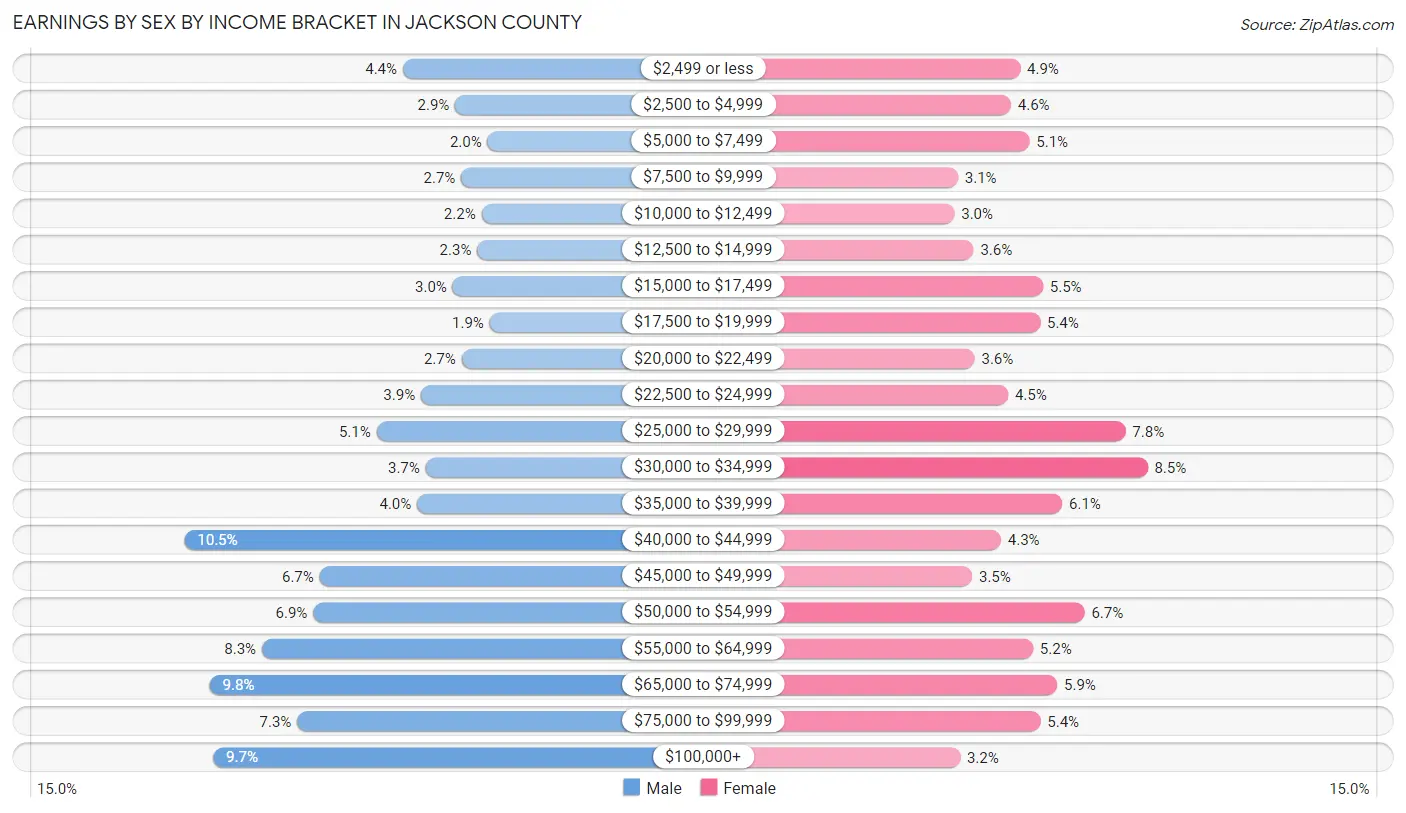
| Income | Male | Female |
| $2,499 or less | 354 (4.4%) | 346 (4.9%) |
| $2,500 to $4,999 | 235 (2.9%) | 328 (4.6%) |
| $5,000 to $7,499 | 161 (2.0%) | 365 (5.1%) |
| $7,500 to $9,999 | 221 (2.7%) | 222 (3.1%) |
| $10,000 to $12,499 | 175 (2.2%) | 215 (3.0%) |
| $12,500 to $14,999 | 185 (2.3%) | 253 (3.6%) |
| $15,000 to $17,499 | 241 (3.0%) | 392 (5.5%) |
| $17,500 to $19,999 | 156 (1.9%) | 386 (5.4%) |
| $20,000 to $22,499 | 220 (2.7%) | 255 (3.6%) |
| $22,500 to $24,999 | 313 (3.9%) | 322 (4.5%) |
| $25,000 to $29,999 | 414 (5.1%) | 557 (7.8%) |
| $30,000 to $34,999 | 302 (3.7%) | 601 (8.5%) |
| $35,000 to $39,999 | 322 (4.0%) | 430 (6.0%) |
| $40,000 to $44,999 | 852 (10.5%) | 308 (4.3%) |
| $45,000 to $49,999 | 544 (6.7%) | 250 (3.5%) |
| $50,000 to $54,999 | 558 (6.9%) | 475 (6.7%) |
| $55,000 to $64,999 | 675 (8.3%) | 372 (5.2%) |
| $65,000 to $74,999 | 794 (9.8%) | 420 (5.9%) |
| $75,000 to $99,999 | 595 (7.3%) | 387 (5.4%) |
| $100,000+ | 786 (9.7%) | 226 (3.2%) |
| Total | 8,103 (100.0%) | 7,110 (100.0%) |
Earnings by Sex by Educational Attainment in Jackson County
Average earnings in Jackson County are $48,122 for men and $33,189 for women, a difference of 31.0%. Men with an educational attainment of bachelor's degree enjoy the highest average annual earnings of $80,462, while those with less than high school education earn the least with $42,143. Women with an educational attainment of graduate degree earn the most with the average annual earnings of $69,981, while those with less than high school education have the smallest earnings of $21,149.
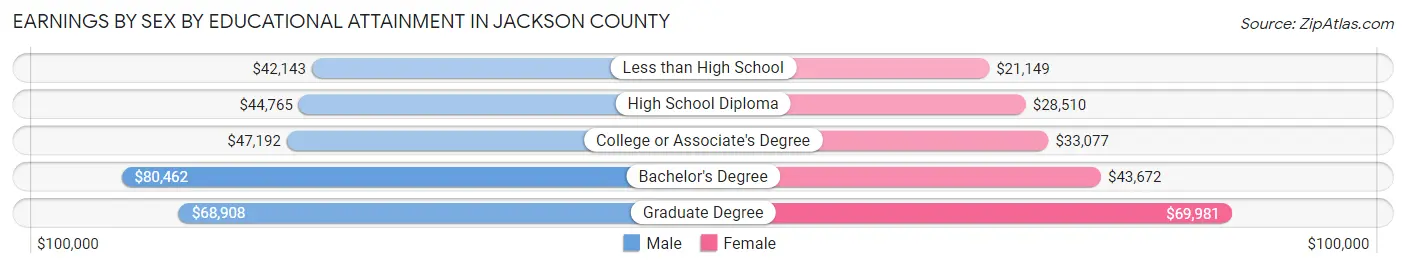
| Educational Attainment | Male Income | Female Income |
| Less than High School | $42,143 | $21,149 |
| High School Diploma | $44,765 | $28,510 |
| College or Associate's Degree | $47,192 | $33,077 |
| Bachelor's Degree | $80,462 | $43,672 |
| Graduate Degree | $68,908 | $69,981 |
| Total | $48,122 | $33,189 |
Family Income in Jackson County
Family Income Brackets in Jackson County
According to the Jackson County family income data, there are 2,152 families falling into the $50,000 to $74,999 income range, which is the most common income bracket and makes up 24.8% of all families. Conversely, the $10,000 to $14,999 income bracket is the least frequent group with only 139 families (1.6%) belonging to this category.
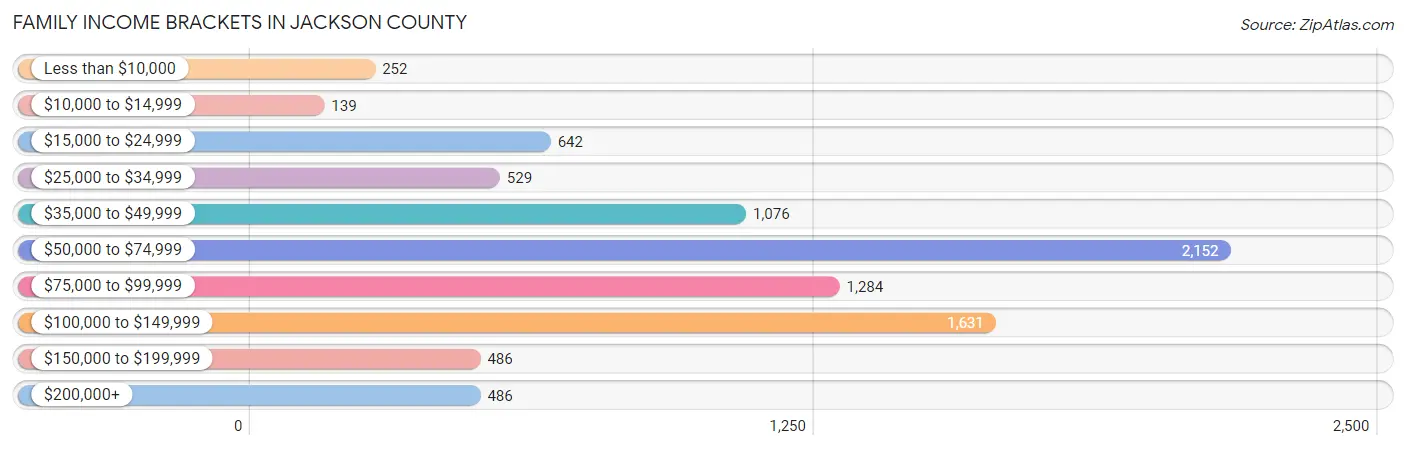
| Income Bracket | # Families | % Families |
| Less than $10,000 | 252 | 2.9% |
| $10,000 to $14,999 | 139 | 1.6% |
| $15,000 to $24,999 | 642 | 7.4% |
| $25,000 to $34,999 | 529 | 6.1% |
| $35,000 to $49,999 | 1,076 | 12.4% |
| $50,000 to $74,999 | 2,152 | 24.8% |
| $75,000 to $99,999 | 1,284 | 14.8% |
| $100,000 to $149,999 | 1,631 | 18.8% |
| $150,000 to $199,999 | 486 | 5.6% |
| $200,000+ | 486 | 5.6% |
Family Income by Famaliy Size in Jackson County
4-person families (1,598 | 18.4%) account for the highest median family income in Jackson County with $100,918 per family, while 2-person families (4,197 | 48.4%) have the highest median income of $30,256 per family member.
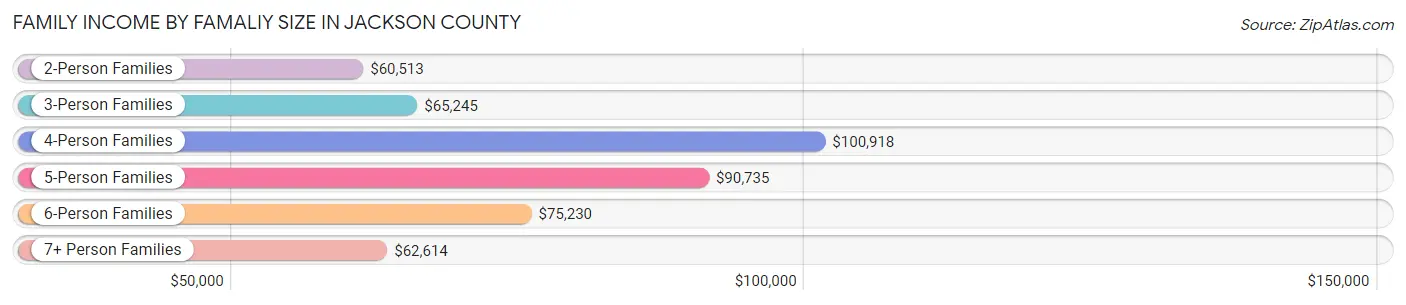
| Income Bracket | # Families | Median Income |
| 2-Person Families | 4,197 (48.4%) | $60,513 |
| 3-Person Families | 1,798 (20.7%) | $65,245 |
| 4-Person Families | 1,598 (18.4%) | $100,918 |
| 5-Person Families | 606 (7.0%) | $90,735 |
| 6-Person Families | 229 (2.6%) | $75,230 |
| 7+ Person Families | 248 (2.9%) | $62,614 |
| Total | 8,676 (100.0%) | $69,172 |
Family Income by Number of Earners in Jackson County
The median family income in Jackson County is $69,172, with families comprising 3+ earners (1,058) having the highest median family income of $128,615, while families with no earners (1,589) have the lowest median family income of $48,570, accounting for 12.2% and 18.3% of families, respectively.
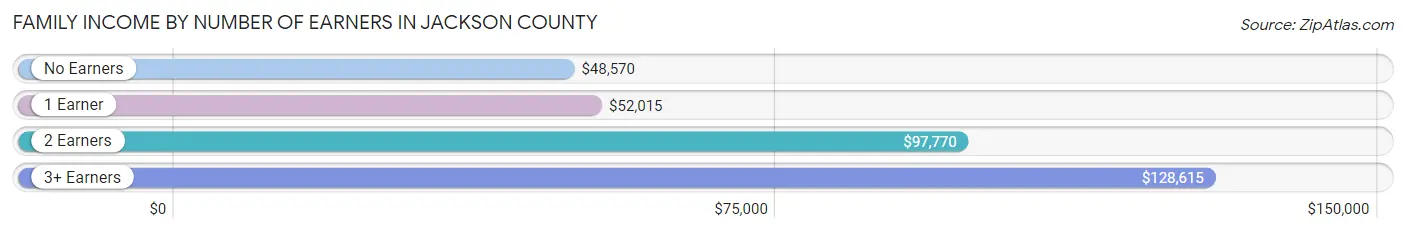
| Number of Earners | # Families | Median Income |
| No Earners | 1,589 (18.3%) | $48,570 |
| 1 Earner | 3,215 (37.1%) | $52,015 |
| 2 Earners | 2,814 (32.4%) | $97,770 |
| 3+ Earners | 1,058 (12.2%) | $128,615 |
| Total | 8,676 (100.0%) | $69,172 |
Household Income in Jackson County
Household Income Brackets in Jackson County
With 2,628 households falling in the category, the $50,000 to $74,999 income range is the most frequent in Jackson County, accounting for 21.1% of all households. In contrast, only 486 households (3.9%) fall into the $150,000 to $199,999 income bracket, making it the least populous group.
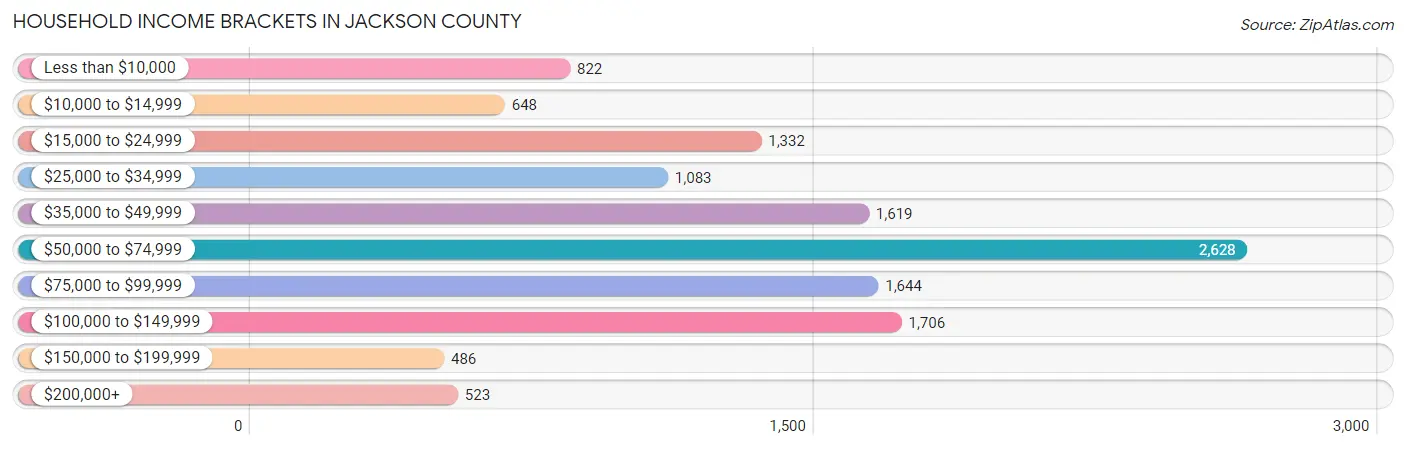
| Income Bracket | # Households | % Households |
| Less than $10,000 | 822 | 6.6% |
| $10,000 to $14,999 | 648 | 5.2% |
| $15,000 to $24,999 | 1,332 | 10.7% |
| $25,000 to $34,999 | 1,083 | 8.7% |
| $35,000 to $49,999 | 1,619 | 13.0% |
| $50,000 to $74,999 | 2,628 | 21.1% |
| $75,000 to $99,999 | 1,644 | 13.2% |
| $100,000 to $149,999 | 1,706 | 13.7% |
| $150,000 to $199,999 | 486 | 3.9% |
| $200,000+ | 523 | 4.2% |
Household Income by Householder Age in Jackson County
The median household income in Jackson County is $56,549, with the highest median household income of $65,926 found in the 25 to 44 years age bracket for the primary householder. A total of 3,626 households (29.1%) fall into this category. Meanwhile, the 15 to 24 years age bracket for the primary householder has the lowest median household income of $34,676, with 515 households (4.1%) in this group.
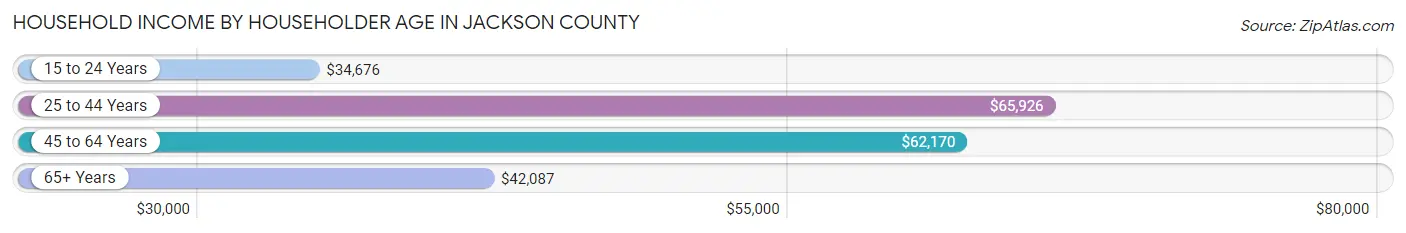
| Income Bracket | # Households | Median Income |
| 15 to 24 Years | 515 (4.1%) | $34,676 |
| 25 to 44 Years | 3,626 (29.1%) | $65,926 |
| 45 to 64 Years | 4,877 (39.2%) | $62,170 |
| 65+ Years | 3,435 (27.6%) | $42,087 |
| Total | 12,453 (100.0%) | $56,549 |
Poverty in Jackson County
Income Below Poverty by Sex and Age in Jackson County
With 16.2% poverty level for males and 18.6% for females among the residents of Jackson County, 5 year old males and 5 year old females are the most vulnerable to poverty, with 53 males (39.3%) and 80 females (46.0%) in their respective age groups living below the poverty level.
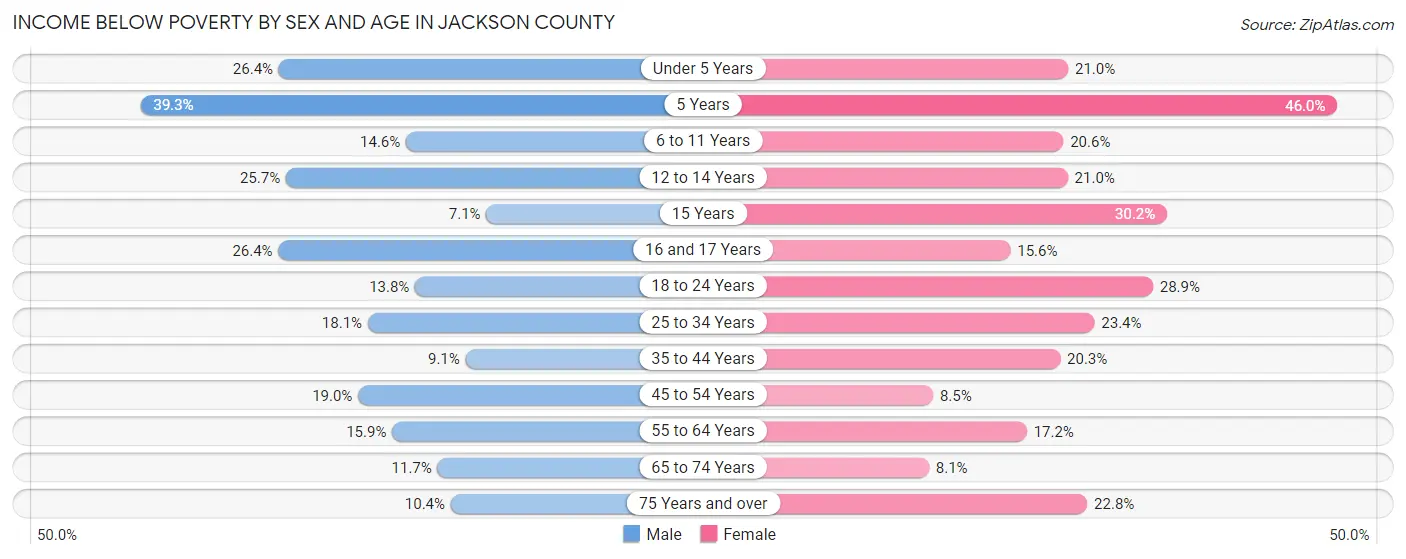
| Age Bracket | Male | Female |
| Under 5 Years | 250 (26.4%) | 214 (21.0%) |
| 5 Years | 53 (39.3%) | 80 (46.0%) |
| 6 to 11 Years | 190 (14.6%) | 278 (20.5%) |
| 12 to 14 Years | 148 (25.7%) | 92 (21.0%) |
| 15 Years | 16 (7.1%) | 93 (30.2%) |
| 16 and 17 Years | 133 (26.4%) | 56 (15.6%) |
| 18 to 24 Years | 178 (13.8%) | 366 (28.9%) |
| 25 to 34 Years | 369 (18.1%) | 454 (23.4%) |
| 35 to 44 Years | 176 (9.1%) | 410 (20.3%) |
| 45 to 54 Years | 405 (19.0%) | 176 (8.5%) |
| 55 to 64 Years | 338 (15.9%) | 391 (17.2%) |
| 65 to 74 Years | 189 (11.7%) | 152 (8.1%) |
| 75 Years and over | 85 (10.4%) | 263 (22.8%) |
| Total | 2,530 (16.2%) | 3,025 (18.6%) |
Income Above Poverty by Sex and Age in Jackson County
According to the poverty statistics in Jackson County, males aged 15 years and females aged 65 to 74 years are the age groups that are most secure financially, with 92.9% of males and 91.9% of females in these age groups living above the poverty line.
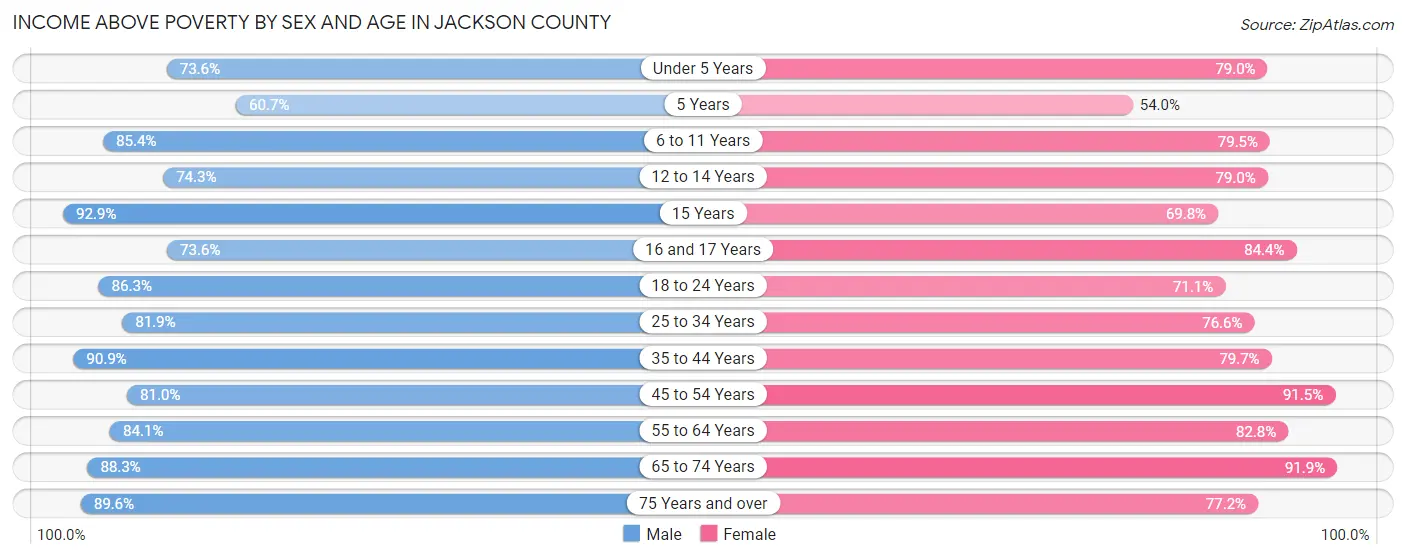
| Age Bracket | Male | Female |
| Under 5 Years | 697 (73.6%) | 805 (79.0%) |
| 5 Years | 82 (60.7%) | 94 (54.0%) |
| 6 to 11 Years | 1,112 (85.4%) | 1,075 (79.4%) |
| 12 to 14 Years | 427 (74.3%) | 347 (79.0%) |
| 15 Years | 208 (92.9%) | 215 (69.8%) |
| 16 and 17 Years | 370 (73.6%) | 302 (84.4%) |
| 18 to 24 Years | 1,117 (86.3%) | 902 (71.1%) |
| 25 to 34 Years | 1,665 (81.9%) | 1,483 (76.6%) |
| 35 to 44 Years | 1,765 (90.9%) | 1,614 (79.7%) |
| 45 to 54 Years | 1,722 (81.0%) | 1,904 (91.5%) |
| 55 to 64 Years | 1,791 (84.1%) | 1,888 (82.8%) |
| 65 to 74 Years | 1,430 (88.3%) | 1,730 (91.9%) |
| 75 Years and over | 729 (89.6%) | 892 (77.2%) |
| Total | 13,115 (83.8%) | 13,251 (81.4%) |
Income Below Poverty Among Married-Couple Families in Jackson County
The poverty statistics for married-couple families in Jackson County show that 7.5% or 500 of the total 6,647 families live below the poverty line. Families with 5 or more children have the highest poverty rate of 25.0%, comprising of 42 families. On the other hand, families with no children have the lowest poverty rate of 3.1%, which includes 132 families.
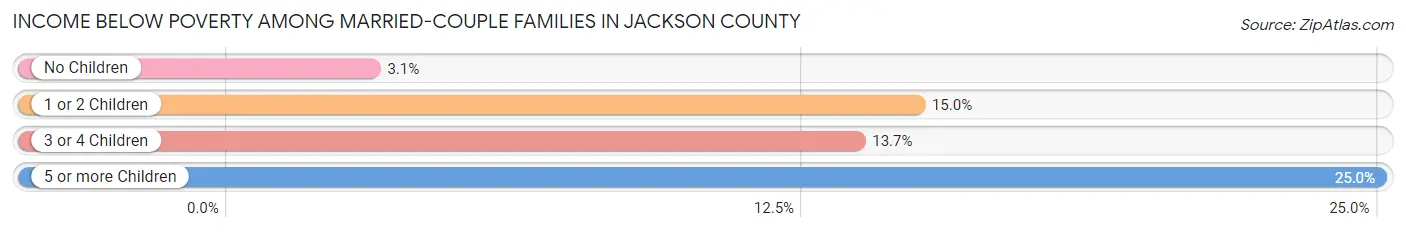
| Children | Above Poverty | Below Poverty |
| No Children | 4,124 (96.9%) | 132 (3.1%) |
| 1 or 2 Children | 1,473 (85.1%) | 259 (14.9%) |
| 3 or 4 Children | 424 (86.4%) | 67 (13.7%) |
| 5 or more Children | 126 (75.0%) | 42 (25.0%) |
| Total | 6,147 (92.5%) | 500 (7.5%) |
Income Below Poverty Among Single-Parent Households in Jackson County
According to the poverty data in Jackson County, 20.2% or 115 single-father households and 27.9% or 407 single-mother households are living below the poverty line. Among single-father households, those with 1 or 2 children have the highest poverty rate, with 82 households (28.8%) experiencing poverty. Likewise, among single-mother households, those with 3 or 4 children have the highest poverty rate, with 86 households (58.5%) falling below the poverty line.
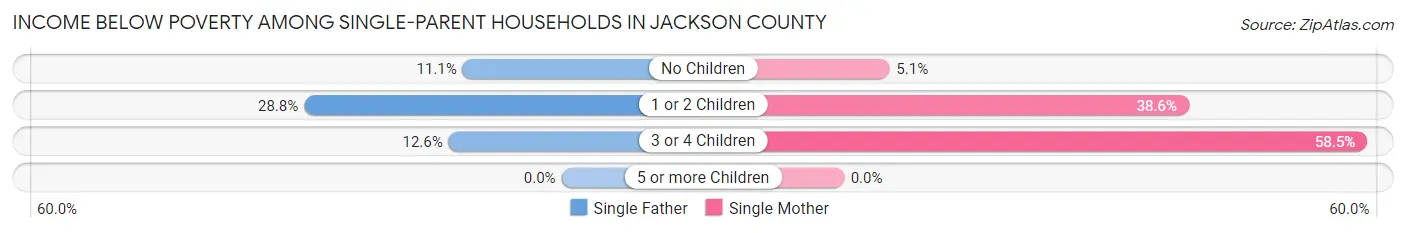
| Children | Single Father | Single Mother |
| No Children | 20 (11.1%) | 26 (5.1%) |
| 1 or 2 Children | 82 (28.8%) | 295 (38.6%) |
| 3 or 4 Children | 13 (12.6%) | 86 (58.5%) |
| 5 or more Children | 0 (0.0%) | 0 (0.0%) |
| Total | 115 (20.2%) | 407 (27.9%) |
Income Below Poverty Among Married-Couple vs Single-Parent Households in Jackson County
The poverty data for Jackson County shows that 500 of the married-couple family households (7.5%) and 522 of the single-parent households (25.7%) are living below the poverty level. Within the married-couple family households, those with 5 or more children have the highest poverty rate, with 42 households (25.0%) falling below the poverty line. Among the single-parent households, those with 3 or 4 children have the highest poverty rate, with 99 household (39.6%) living below poverty.
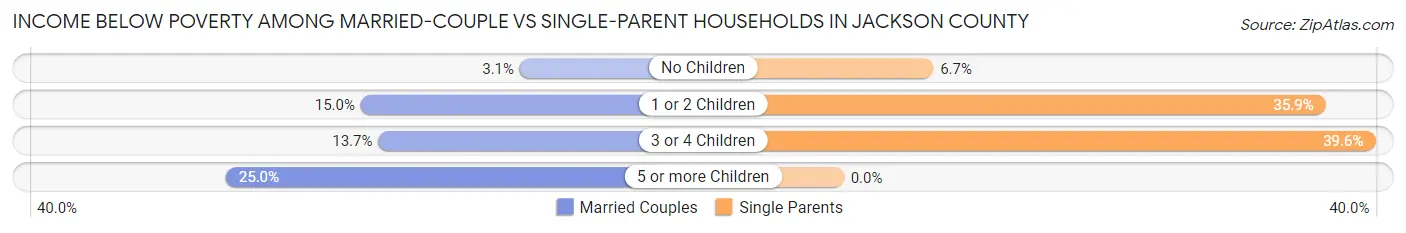
| Children | Married-Couple Families | Single-Parent Households |
| No Children | 132 (3.1%) | 46 (6.7%) |
| 1 or 2 Children | 259 (14.9%) | 377 (35.9%) |
| 3 or 4 Children | 67 (13.7%) | 99 (39.6%) |
| 5 or more Children | 42 (25.0%) | 0 (0.0%) |
| Total | 500 (7.5%) | 522 (25.7%) |
Race in Jackson County
The most populous races in Jackson County are White / Caucasian (31,321 | 96.2%), Two or more Races (673 | 2.1%), and Hispanic or Latino (367 | 1.1%).
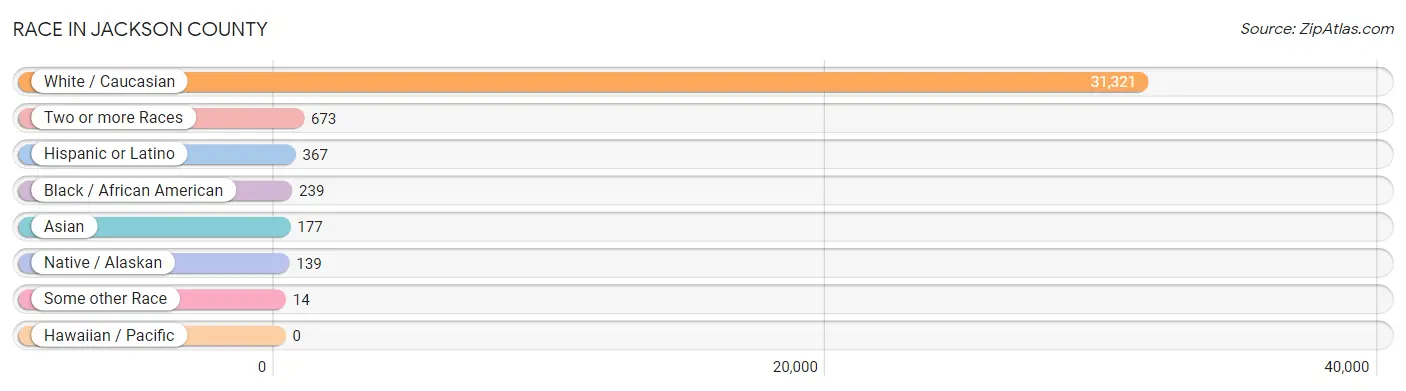
| Race | # Population | % Population |
| Asian | 177 | 0.5% |
| Black / African American | 239 | 0.7% |
| Hawaiian / Pacific | 0 | 0.0% |
| Hispanic or Latino | 367 | 1.1% |
| Native / Alaskan | 139 | 0.4% |
| White / Caucasian | 31,321 | 96.2% |
| Two or more Races | 673 | 2.1% |
| Some other Race | 14 | 0.0% |
| Total | 32,563 | 100.0% |
Ancestry in Jackson County
The most populous ancestries reported in Jackson County are German (4,275 | 13.1%), Irish (3,556 | 10.9%), English (3,403 | 10.4%), American (2,247 | 6.9%), and Welsh (1,039 | 3.2%), together accounting for 44.6% of all Jackson County residents.
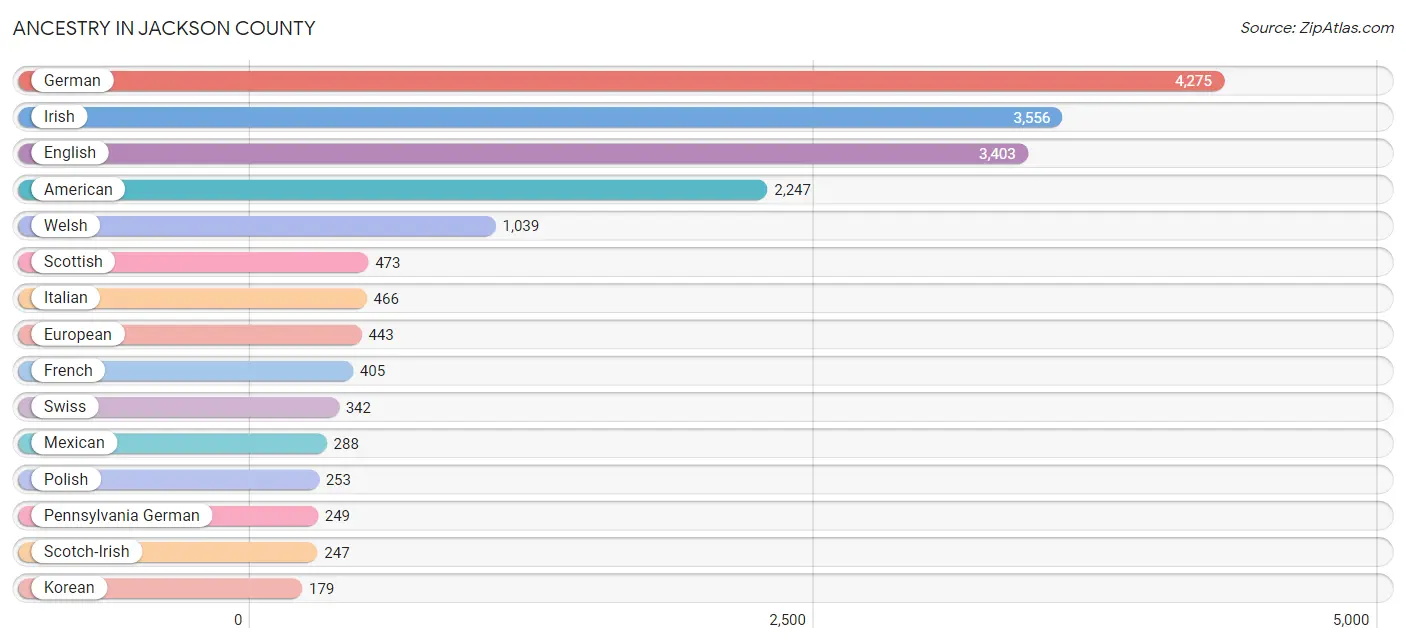
| Ancestry | # Population | % Population |
| African | 4 | 0.0% |
| American | 2,247 | 6.9% |
| Arab | 5 | 0.0% |
| Austrian | 4 | 0.0% |
| British | 109 | 0.3% |
| Canadian | 36 | 0.1% |
| Celtic | 7 | 0.0% |
| Cherokee | 53 | 0.2% |
| Choctaw | 84 | 0.3% |
| Cuban | 34 | 0.1% |
| Dutch | 165 | 0.5% |
| Eastern European | 42 | 0.1% |
| English | 3,403 | 10.4% |
| European | 443 | 1.4% |
| Finnish | 10 | 0.0% |
| French | 405 | 1.2% |
| French American Indian | 45 | 0.1% |
| French Canadian | 56 | 0.2% |
| German | 4,275 | 13.1% |
| Hungarian | 82 | 0.3% |
| Irish | 3,556 | 10.9% |
| Italian | 466 | 1.4% |
| Jamaican | 16 | 0.1% |
| Korean | 179 | 0.5% |
| Lebanese | 5 | 0.0% |
| Lithuanian | 14 | 0.0% |
| Mexican | 288 | 0.9% |
| Northern European | 30 | 0.1% |
| Norwegian | 45 | 0.1% |
| Pennsylvania German | 249 | 0.8% |
| Polish | 253 | 0.8% |
| Scandinavian | 114 | 0.4% |
| Scotch-Irish | 247 | 0.8% |
| Scottish | 473 | 1.5% |
| Spanish | 10 | 0.0% |
| Subsaharan African | 4 | 0.0% |
| Swedish | 81 | 0.3% |
| Swiss | 342 | 1.1% |
| Ukrainian | 16 | 0.1% |
| Welsh | 1,039 | 3.2% | View All 40 Rows |
Immigrants in Jackson County
The most numerous immigrant groups reported in Jackson County came from Asia (177 | 0.5%), South Central Asia (101 | 0.3%), Latin America (77 | 0.2%), Philippines (76 | 0.2%), and South Eastern Asia (76 | 0.2%), together accounting for 1.5% of all Jackson County residents.
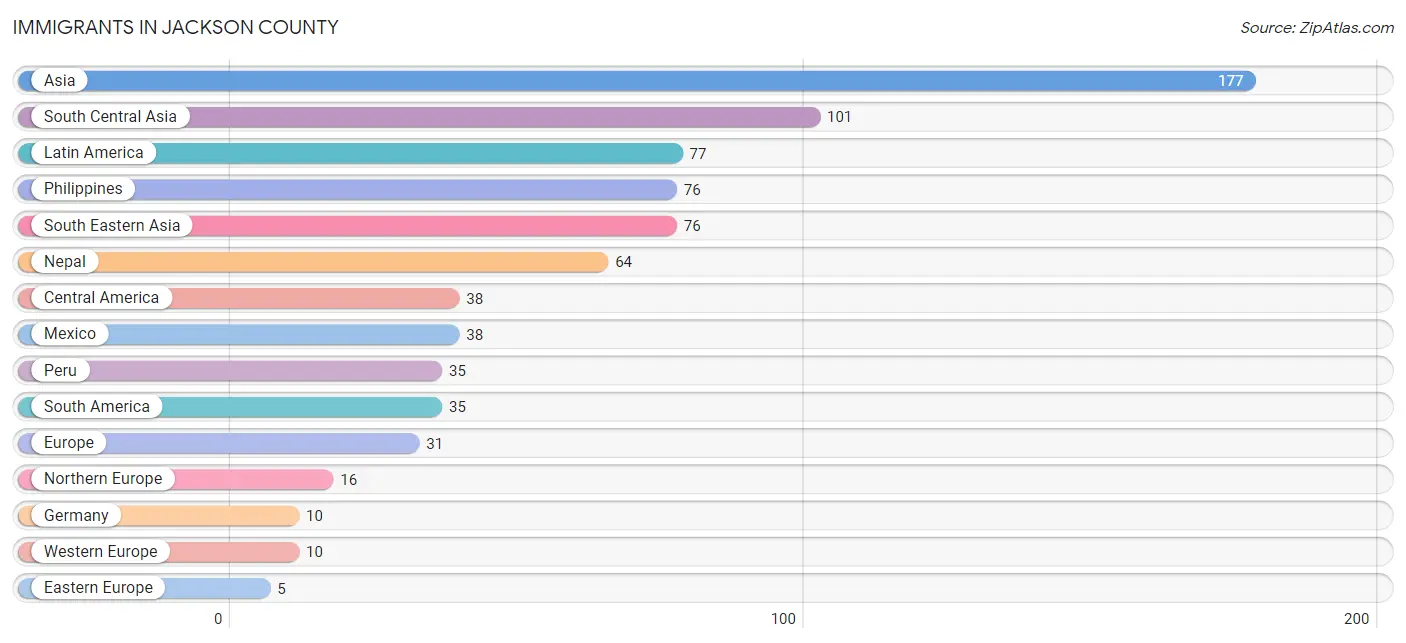
| Immigration Origin | # Population | % Population |
| Asia | 177 | 0.5% |
| Caribbean | 4 | 0.0% |
| Central America | 38 | 0.1% |
| Cuba | 4 | 0.0% |
| Eastern Europe | 5 | 0.0% |
| Europe | 31 | 0.1% |
| Germany | 10 | 0.0% |
| Latin America | 77 | 0.2% |
| Mexico | 38 | 0.1% |
| Nepal | 64 | 0.2% |
| Northern Europe | 16 | 0.1% |
| Peru | 35 | 0.1% |
| Philippines | 76 | 0.2% |
| South America | 35 | 0.1% |
| South Central Asia | 101 | 0.3% |
| South Eastern Asia | 76 | 0.2% |
| Western Europe | 10 | 0.0% | View All 17 Rows |
Sex and Age in Jackson County
Sex and Age in Jackson County
The most populous age groups in Jackson County are 5 to 9 Years (1,188 | 7.4%) for men and 55 to 59 Years (1,173 | 7.1%) for women.
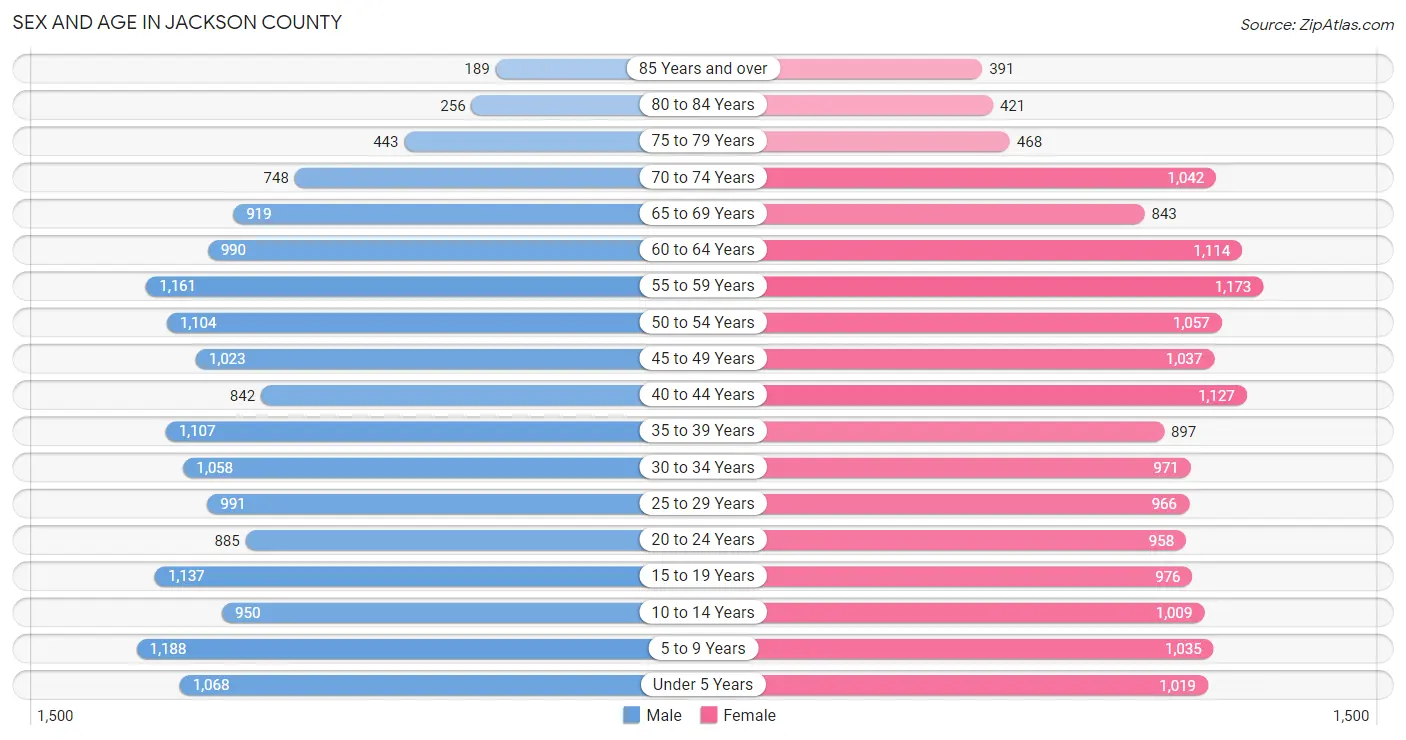
| Age Bracket | Male | Female |
| Under 5 Years | 1,068 (6.7%) | 1,019 (6.2%) |
| 5 to 9 Years | 1,188 (7.4%) | 1,035 (6.3%) |
| 10 to 14 Years | 950 (5.9%) | 1,009 (6.1%) |
| 15 to 19 Years | 1,137 (7.1%) | 976 (5.9%) |
| 20 to 24 Years | 885 (5.5%) | 958 (5.8%) |
| 25 to 29 Years | 991 (6.2%) | 966 (5.9%) |
| 30 to 34 Years | 1,058 (6.6%) | 971 (5.9%) |
| 35 to 39 Years | 1,107 (6.9%) | 897 (5.4%) |
| 40 to 44 Years | 842 (5.2%) | 1,127 (6.8%) |
| 45 to 49 Years | 1,023 (6.4%) | 1,037 (6.3%) |
| 50 to 54 Years | 1,104 (6.9%) | 1,057 (6.4%) |
| 55 to 59 Years | 1,161 (7.2%) | 1,173 (7.1%) |
| 60 to 64 Years | 990 (6.2%) | 1,114 (6.8%) |
| 65 to 69 Years | 919 (5.7%) | 843 (5.1%) |
| 70 to 74 Years | 748 (4.7%) | 1,042 (6.3%) |
| 75 to 79 Years | 443 (2.8%) | 468 (2.8%) |
| 80 to 84 Years | 256 (1.6%) | 421 (2.5%) |
| 85 Years and over | 189 (1.2%) | 391 (2.4%) |
| Total | 16,059 (100.0%) | 16,504 (100.0%) |
Families and Households in Jackson County
Median Family Size in Jackson County
The median family size in Jackson County is 3.05 persons per family, with single male/father families (569 | 6.6%) accounting for the largest median family size of 3.18 persons per family. On the other hand, single female/mother families (1,460 | 16.8%) represent the smallest median family size with 2.80 persons per family.
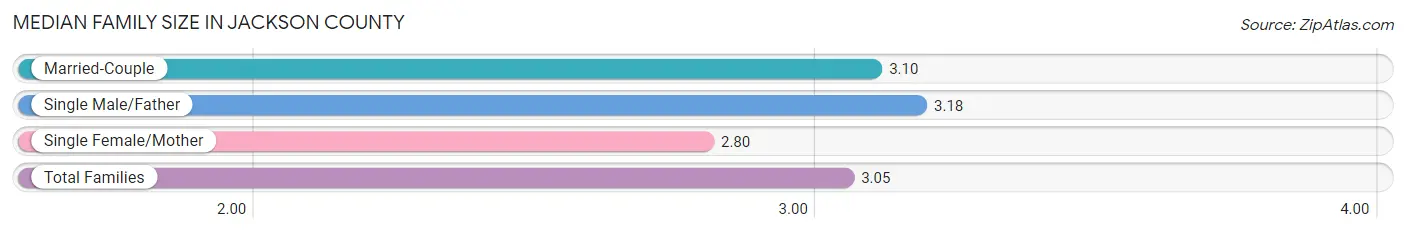
| Family Type | # Families | Family Size |
| Married-Couple | 6,647 (76.6%) | 3.10 |
| Single Male/Father | 569 (6.6%) | 3.18 |
| Single Female/Mother | 1,460 (16.8%) | 2.80 |
| Total Families | 8,676 (100.0%) | 3.05 |
Median Household Size in Jackson County
The median household size in Jackson County is 2.59 persons per household, with single male/father households (569 | 4.6%) accounting for the largest median household size of 4.02 persons per household. non-family households (3,777 | 30.3%) represent the smallest median household size with 1.27 persons per household.
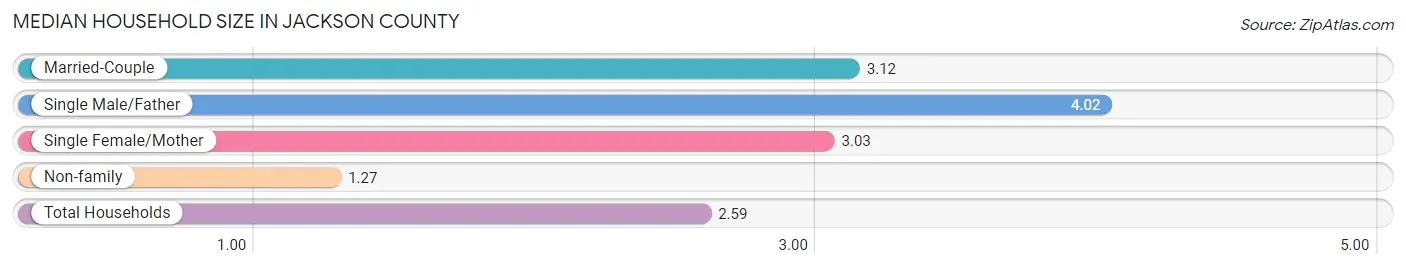
| Household Type | # Households | Household Size |
| Married-Couple | 6,647 (53.4%) | 3.12 |
| Single Male/Father | 569 (4.6%) | 4.02 |
| Single Female/Mother | 1,460 (11.7%) | 3.03 |
| Non-family | 3,777 (30.3%) | 1.27 |
| Total Households | 12,453 (100.0%) | 2.59 |
Household Size by Marriage Status in Jackson County
Out of a total of 12,453 households in Jackson County, 8,676 (69.7%) are family households, while 3,777 (30.3%) are nonfamily households. The most numerous type of family households are 2-person households, comprising 4,022, and the most common type of nonfamily households are 1-person households, comprising 3,025.
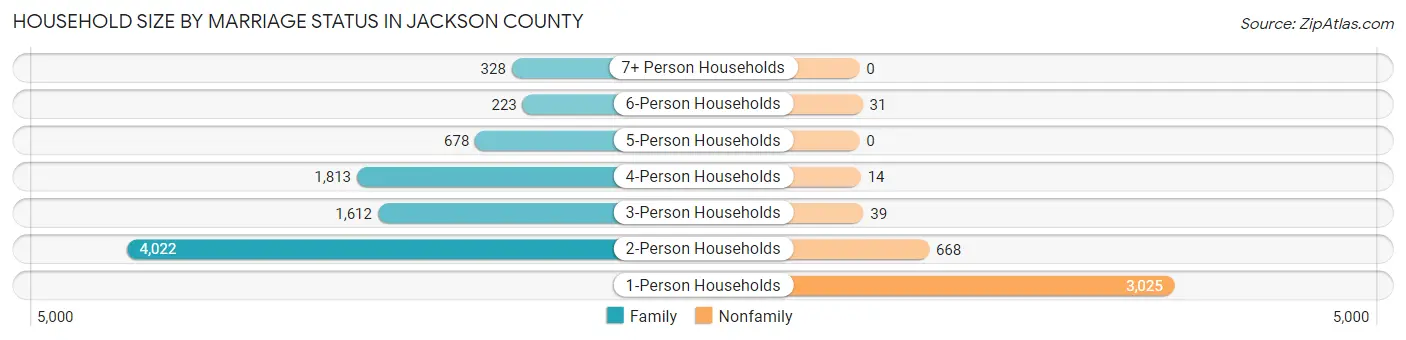
| Household Size | Family Households | Nonfamily Households |
| 1-Person Households | - | 3,025 (24.3%) |
| 2-Person Households | 4,022 (32.3%) | 668 (5.4%) |
| 3-Person Households | 1,612 (12.9%) | 39 (0.3%) |
| 4-Person Households | 1,813 (14.6%) | 14 (0.1%) |
| 5-Person Households | 678 (5.4%) | 0 (0.0%) |
| 6-Person Households | 223 (1.8%) | 31 (0.3%) |
| 7+ Person Households | 328 (2.6%) | 0 (0.0%) |
| Total | 8,676 (69.7%) | 3,777 (30.3%) |
Female Fertility in Jackson County
Fertility by Age in Jackson County
Average fertility rate in Jackson County is 46.0 births per 1,000 women. Women in the age bracket of 20 to 34 years have the highest fertility rate with 61.0 births per 1,000 women. Women in the age bracket of 20 to 34 years acount for 54.0% of all women with births.
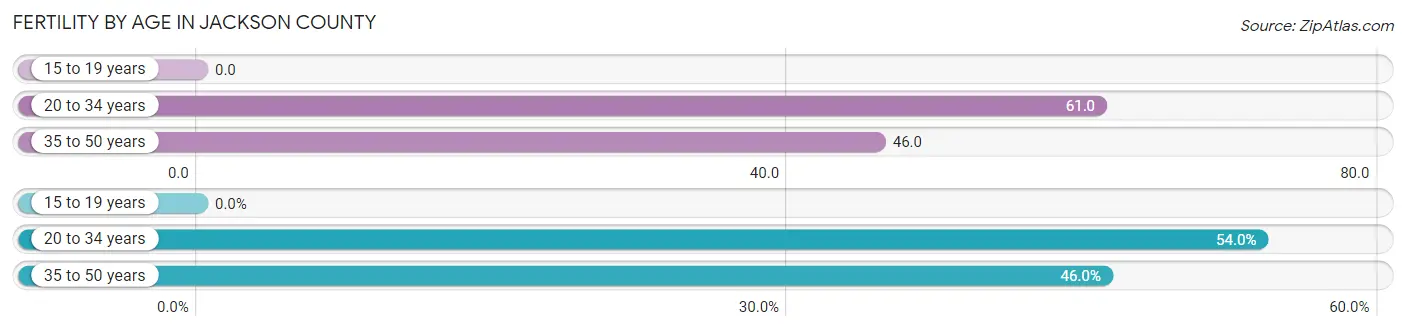
| Age Bracket | Women with Births | Births / 1,000 Women |
| 15 to 19 years | 0 (0.0%) | 0.0 |
| 20 to 34 years | 177 (54.0%) | 61.0 |
| 35 to 50 years | 151 (46.0%) | 46.0 |
| Total | 328 (100.0%) | 46.0 |
Fertility by Age by Marriage Status in Jackson County
50.6% of women with births (328) in Jackson County are married. The highest percentage of unmarried women with births falls into 20 to 34 years age bracket with 63.3% of them unmarried at the time of birth, while the lowest percentage of unmarried women with births belong to 35 to 50 years age bracket with 33.1% of them unmarried.
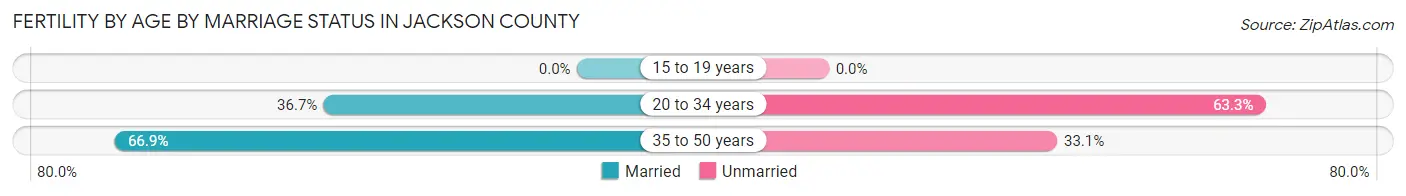
| Age Bracket | Married | Unmarried |
| 15 to 19 years | 0 (0.0%) | 0 (0.0%) |
| 20 to 34 years | 65 (36.7%) | 112 (63.3%) |
| 35 to 50 years | 101 (66.9%) | 50 (33.1%) |
| Total | 166 (50.6%) | 162 (49.4%) |
Fertility by Education in Jackson County
Average fertility rate in Jackson County is 46.0 births per 1,000 women. Women with the education attainment of high school diploma have the highest fertility rate of 61.0 births per 1,000 women, while women with the education attainment of bachelor's degree have the lowest fertility at 23.0 births per 1,000 women. Women with the education attainment of high school diploma represent 48.2% of all women with births.
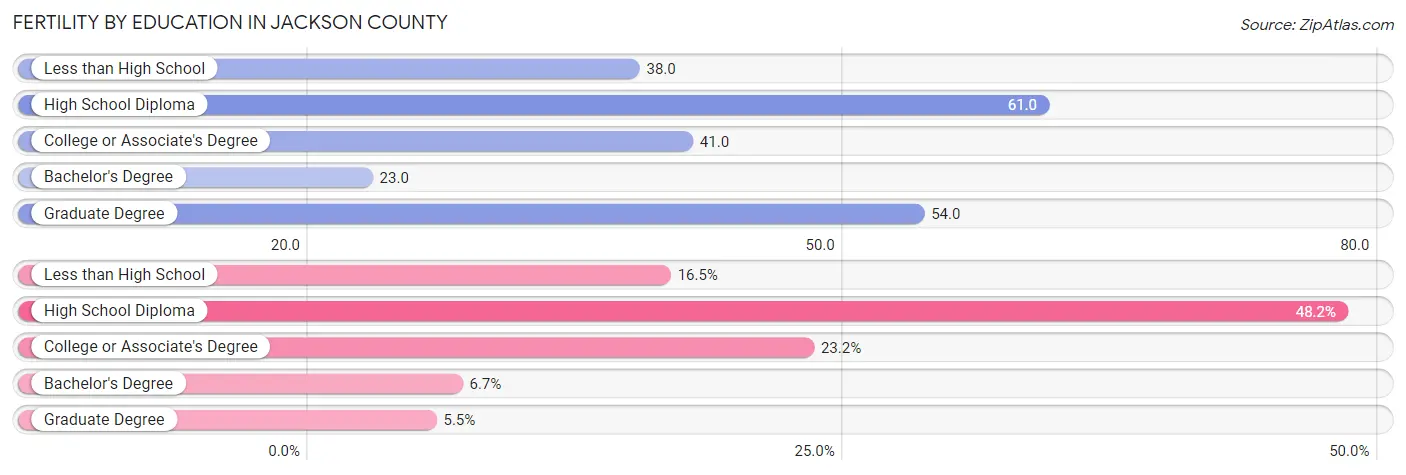
| Educational Attainment | Women with Births | Births / 1,000 Women |
| Less than High School | 54 (16.5%) | 38.0 |
| High School Diploma | 158 (48.2%) | 61.0 |
| College or Associate's Degree | 76 (23.2%) | 41.0 |
| Bachelor's Degree | 22 (6.7%) | 23.0 |
| Graduate Degree | 18 (5.5%) | 54.0 |
| Total | 328 (100.0%) | 46.0 |
Fertility by Education by Marriage Status in Jackson County
49.4% of women with births in Jackson County are unmarried. Women with the educational attainment of graduate degree are most likely to be married with 100.0% of them married at childbirth, while women with the educational attainment of bachelor's degree are least likely to be married with 100.0% of them unmarried at childbirth.
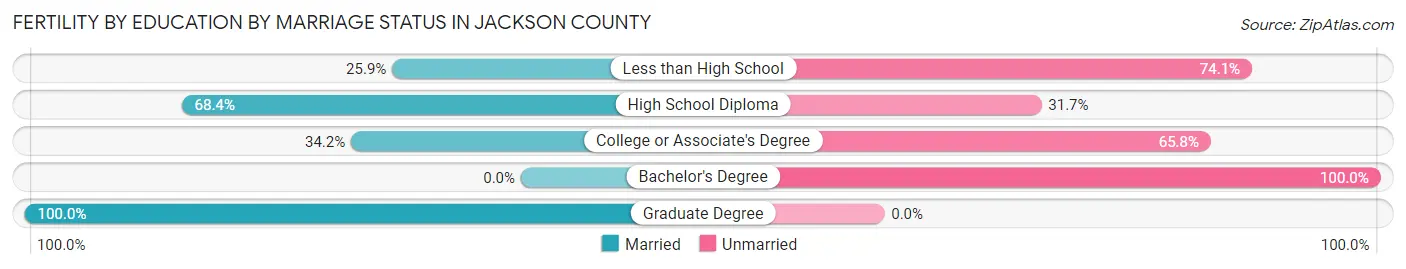
| Educational Attainment | Married | Unmarried |
| Less than High School | 14 (25.9%) | 40 (74.1%) |
| High School Diploma | 108 (68.3%) | 50 (31.7%) |
| College or Associate's Degree | 26 (34.2%) | 50 (65.8%) |
| Bachelor's Degree | 0 (0.0%) | 22 (100.0%) |
| Graduate Degree | 18 (100.0%) | 0 (0.0%) |
| Total | 166 (50.6%) | 162 (49.4%) |
Employment Characteristics in Jackson County
Employment by Class of Employer in Jackson County
Among the 13,433 employed individuals in Jackson County, private company employees (9,652 | 71.9%), local government employees (1,090 | 8.1%), and not-for-profit organizations (968 | 7.2%) make up the most common classes of employment.
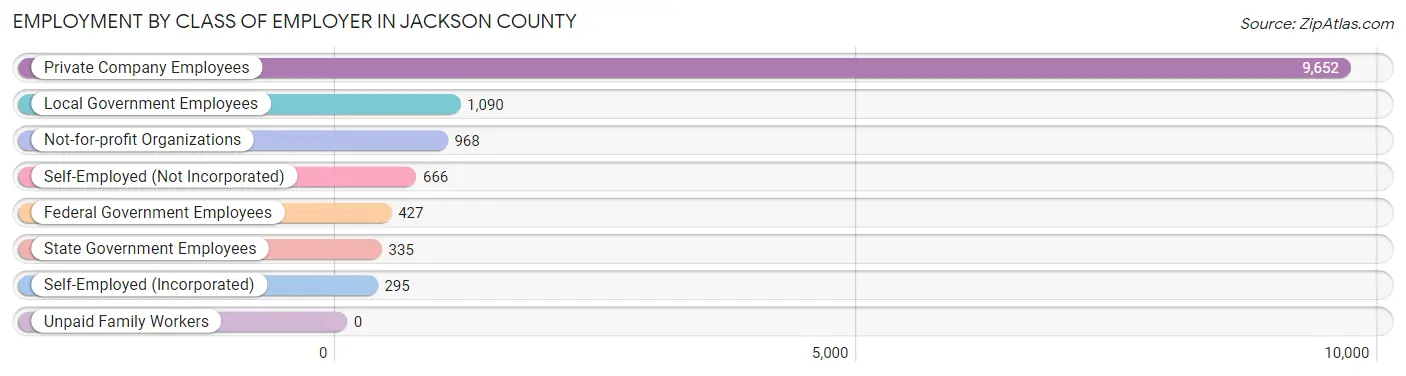
| Employer Class | # Employees | % Employees |
| Private Company Employees | 9,652 | 71.9% |
| Self-Employed (Incorporated) | 295 | 2.2% |
| Self-Employed (Not Incorporated) | 666 | 5.0% |
| Not-for-profit Organizations | 968 | 7.2% |
| Local Government Employees | 1,090 | 8.1% |
| State Government Employees | 335 | 2.5% |
| Federal Government Employees | 427 | 3.2% |
| Unpaid Family Workers | 0 | 0.0% |
| Total | 13,433 | 100.0% |
Employment Status by Age in Jackson County
According to the labor force statistics for Jackson County, out of the total population over 16 years of age (25,762), 56.7% or 14,607 individuals are in the labor force, with 5.9% or 862 of them unemployed. The age group with the highest labor force participation rate is 30 to 34 years, with 85.4% or 1,733 individuals in the labor force. Within the labor force, the 75 years and over age range has the highest percentage of unemployed individuals, with 14.5% or 16 of them being unemployed.
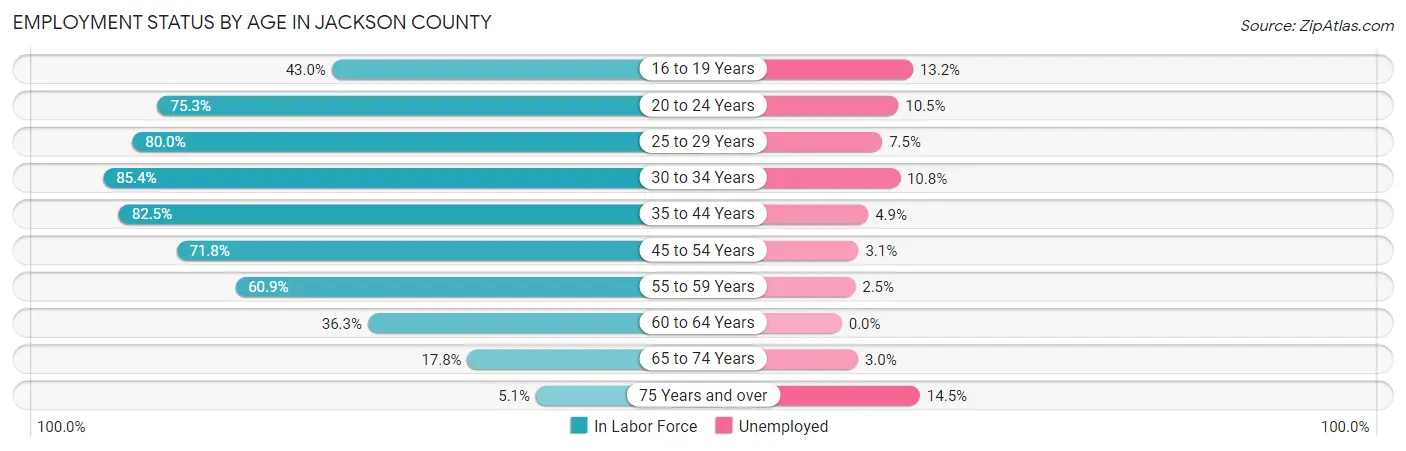
| Age Bracket | In Labor Force | Unemployed |
| 16 to 19 Years | 680 (43.0%) | 90 (13.2%) |
| 20 to 24 Years | 1,388 (75.3%) | 146 (10.5%) |
| 25 to 29 Years | 1,566 (80.0%) | 117 (7.5%) |
| 30 to 34 Years | 1,733 (85.4%) | 187 (10.8%) |
| 35 to 44 Years | 3,278 (82.5%) | 161 (4.9%) |
| 45 to 54 Years | 3,031 (71.8%) | 94 (3.1%) |
| 55 to 59 Years | 1,421 (60.9%) | 36 (2.5%) |
| 60 to 64 Years | 764 (36.3%) | 0 (0.0%) |
| 65 to 74 Years | 632 (17.8%) | 19 (3.0%) |
| 75 Years and over | 111 (5.1%) | 16 (14.5%) |
| Total | 14,607 (56.7%) | 862 (5.9%) |
Employment Status by Educational Attainment in Jackson County
According to labor force statistics for Jackson County, 71.0% of individuals (11,799) out of the total population between 25 and 64 years of age (16,618) are in the labor force, with 5.0% or 590 of them being unemployed. The group with the highest labor force participation rate are those with the educational attainment of college / associate degree, with 79.1% or 3,560 individuals in the labor force. Within the labor force, individuals with high school diploma education have the highest percentage of unemployment, with 6.7% or 354 of them being unemployed.
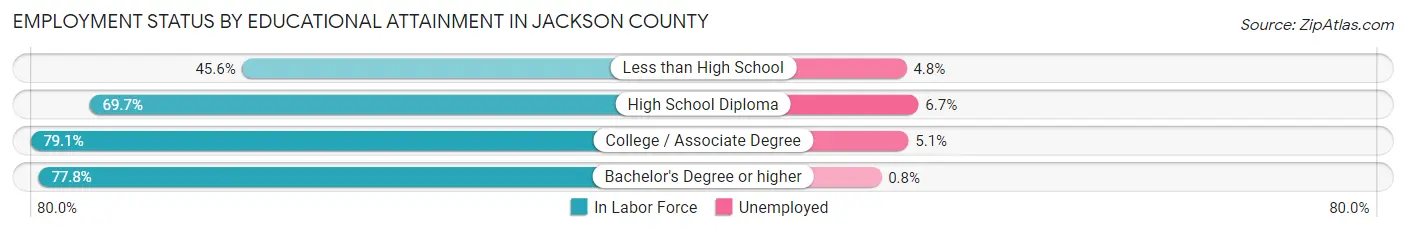
| Educational Attainment | In Labor Force | Unemployed |
| Less than High School | 821 (45.6%) | 86 (4.8%) |
| High School Diploma | 5,289 (69.7%) | 508 (6.7%) |
| College / Associate Degree | 3,560 (79.1%) | 230 (5.1%) |
| Bachelor's Degree or higher | 2,124 (77.8%) | 22 (0.8%) |
| Total | 11,799 (71.0%) | 831 (5.0%) |
Employment Occupations by Sex in Jackson County
Management, Business, Science and Arts Occupations
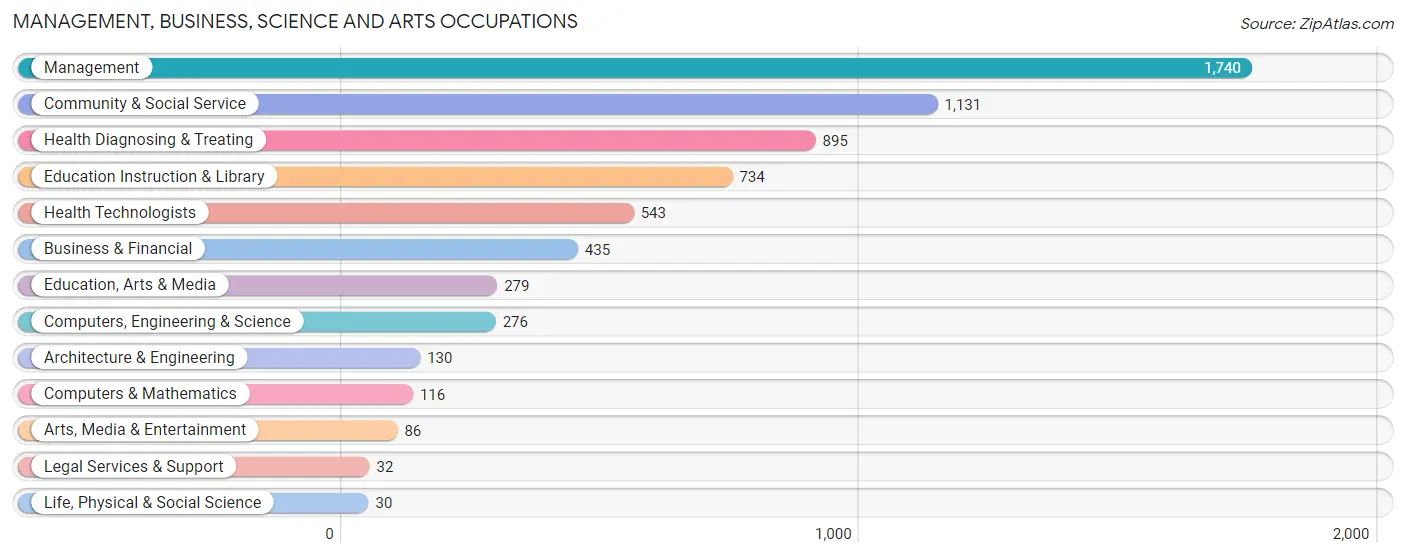
The most common Management, Business, Science and Arts occupations in Jackson County are Management (1,740 | 12.7%), Community & Social Service (1,131 | 8.2%), Health Diagnosing & Treating (895 | 6.5%), Education Instruction & Library (734 | 5.3%), and Health Technologists (543 | 4.0%).
Management, Business, Science and Arts Occupations by Sex
Within the Management, Business, Science and Arts occupations in Jackson County, the most male-oriented occupations are Architecture & Engineering (100.0%), Legal Services & Support (100.0%), and Computers, Engineering & Science (80.4%), while the most female-oriented occupations are Life, Physical & Social Science (90.0%), Education Instruction & Library (80.8%), and Health Diagnosing & Treating (77.9%).
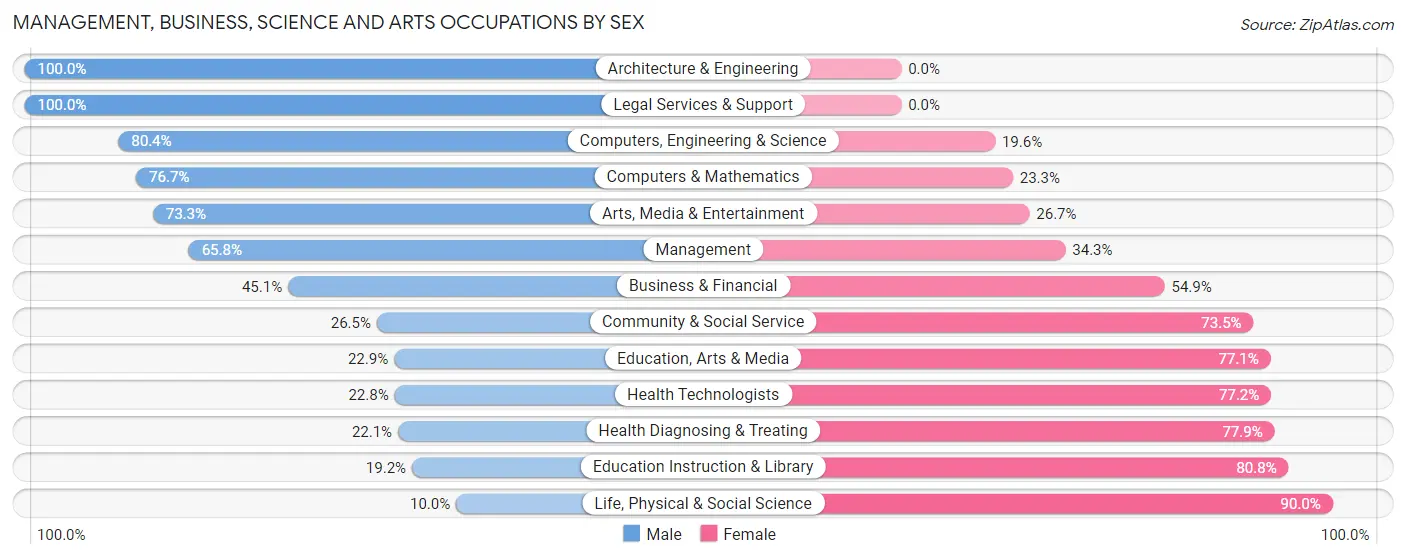
| Occupation | Male | Female |
| Management | 1,144 (65.7%) | 596 (34.3%) |
| Business & Financial | 196 (45.1%) | 239 (54.9%) |
| Computers, Engineering & Science | 222 (80.4%) | 54 (19.6%) |
| Computers & Mathematics | 89 (76.7%) | 27 (23.3%) |
| Architecture & Engineering | 130 (100.0%) | 0 (0.0%) |
| Life, Physical & Social Science | 3 (10.0%) | 27 (90.0%) |
| Community & Social Service | 300 (26.5%) | 831 (73.5%) |
| Education, Arts & Media | 64 (22.9%) | 215 (77.1%) |
| Legal Services & Support | 32 (100.0%) | 0 (0.0%) |
| Education Instruction & Library | 141 (19.2%) | 593 (80.8%) |
| Arts, Media & Entertainment | 63 (73.3%) | 23 (26.7%) |
| Health Diagnosing & Treating | 198 (22.1%) | 697 (77.9%) |
| Health Technologists | 124 (22.8%) | 419 (77.2%) |
| Total (Category) | 2,060 (46.0%) | 2,417 (54.0%) |
| Total (Overall) | 7,232 (52.6%) | 6,504 (47.3%) |
Services Occupations
The most common Services occupations in Jackson County are Healthcare Support (606 | 4.4%), Food Preparation & Serving (525 | 3.8%), Cleaning & Maintenance (462 | 3.4%), Security & Protection (240 | 1.8%), and Personal Care & Service (188 | 1.4%).
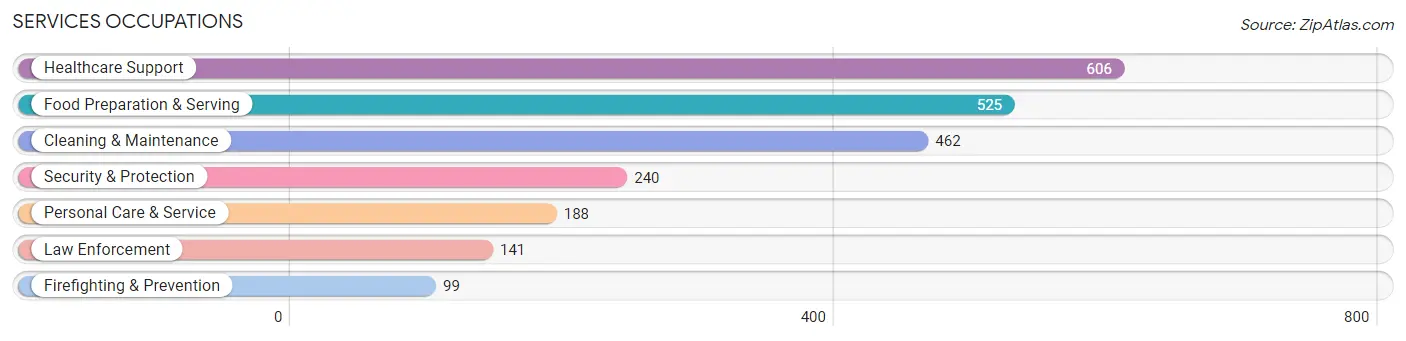
Services Occupations by Sex
Within the Services occupations in Jackson County, the most male-oriented occupations are Law Enforcement (97.2%), Security & Protection (90.4%), and Firefighting & Prevention (80.8%), while the most female-oriented occupations are Healthcare Support (89.9%), Food Preparation & Serving (74.1%), and Cleaning & Maintenance (47.4%).
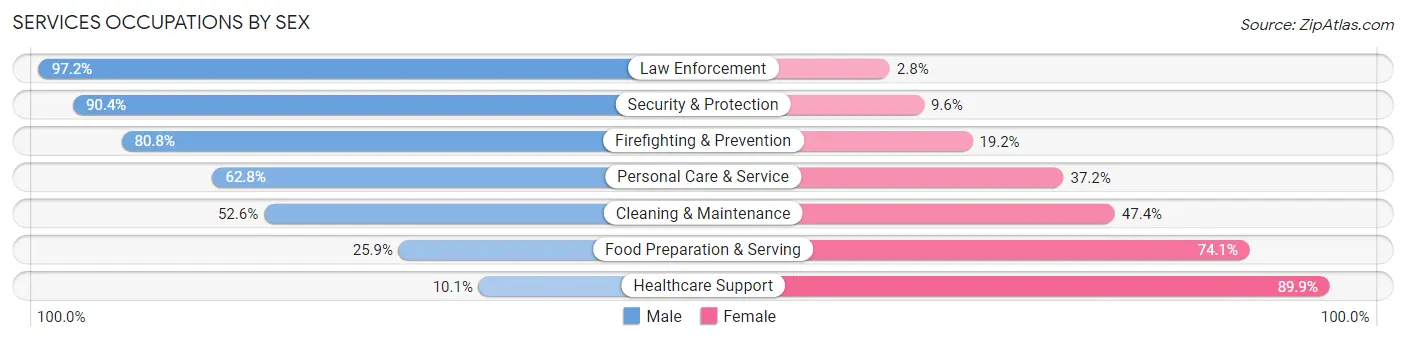
| Occupation | Male | Female |
| Healthcare Support | 61 (10.1%) | 545 (89.9%) |
| Security & Protection | 217 (90.4%) | 23 (9.6%) |
| Firefighting & Prevention | 80 (80.8%) | 19 (19.2%) |
| Law Enforcement | 137 (97.2%) | 4 (2.8%) |
| Food Preparation & Serving | 136 (25.9%) | 389 (74.1%) |
| Cleaning & Maintenance | 243 (52.6%) | 219 (47.4%) |
| Personal Care & Service | 118 (62.8%) | 70 (37.2%) |
| Total (Category) | 775 (38.4%) | 1,246 (61.7%) |
| Total (Overall) | 7,232 (52.6%) | 6,504 (47.3%) |
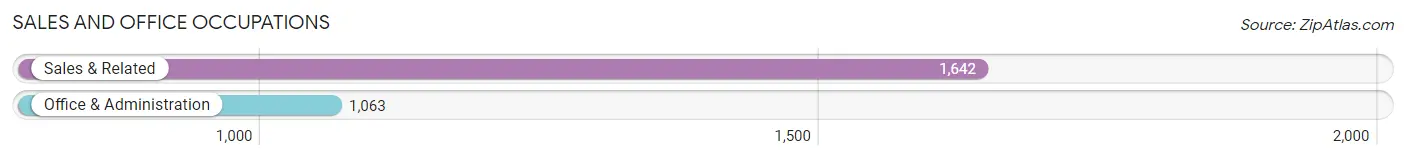
Sales and Office Occupations
The most common Sales and Office occupations in Jackson County are Sales & Related (1,642 | 11.9%), and Office & Administration (1,063 | 7.7%).
Sales and Office Occupations by Sex
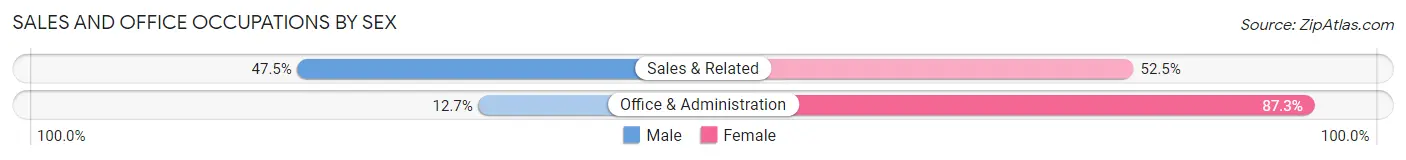
| Occupation | Male | Female |
| Sales & Related | 780 (47.5%) | 862 (52.5%) |
| Office & Administration | 135 (12.7%) | 928 (87.3%) |
| Total (Category) | 915 (33.8%) | 1,790 (66.2%) |
| Total (Overall) | 7,232 (52.6%) | 6,504 (47.3%) |
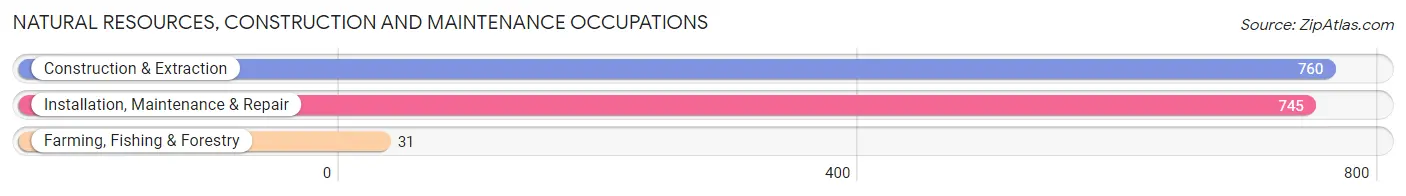
Natural Resources, Construction and Maintenance Occupations
The most common Natural Resources, Construction and Maintenance occupations in Jackson County are Construction & Extraction (760 | 5.5%), Installation, Maintenance & Repair (745 | 5.4%), and Farming, Fishing & Forestry (31 | 0.2%).
Natural Resources, Construction and Maintenance Occupations by Sex
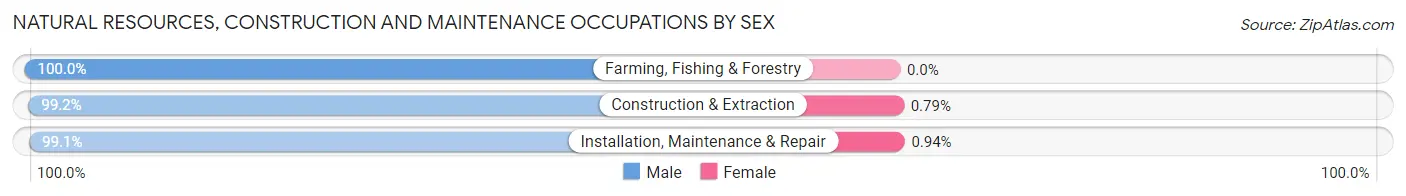
| Occupation | Male | Female |
| Farming, Fishing & Forestry | 31 (100.0%) | 0 (0.0%) |
| Construction & Extraction | 754 (99.2%) | 6 (0.8%) |
| Installation, Maintenance & Repair | 738 (99.1%) | 7 (0.9%) |
| Total (Category) | 1,523 (99.2%) | 13 (0.9%) |
| Total (Overall) | 7,232 (52.6%) | 6,504 (47.3%) |
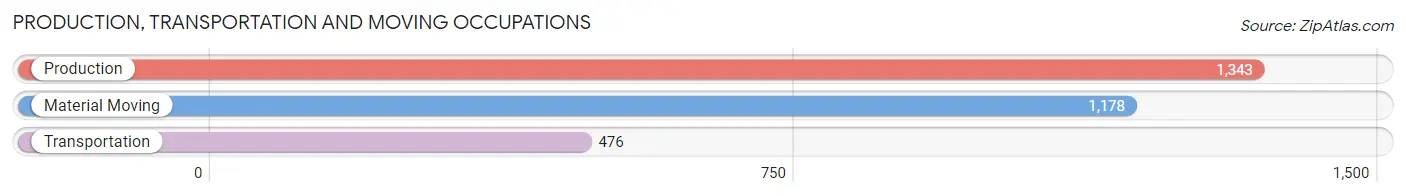
Production, Transportation and Moving Occupations
The most common Production, Transportation and Moving occupations in Jackson County are Production (1,343 | 9.8%), Material Moving (1,178 | 8.6%), and Transportation (476 | 3.5%).
Production, Transportation and Moving Occupations by Sex
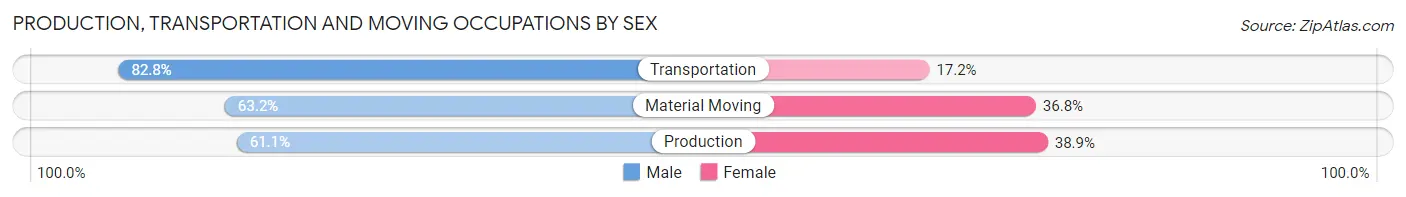
| Occupation | Male | Female |
| Production | 820 (61.1%) | 523 (38.9%) |
| Transportation | 394 (82.8%) | 82 (17.2%) |
| Material Moving | 745 (63.2%) | 433 (36.8%) |
| Total (Category) | 1,959 (65.4%) | 1,038 (34.6%) |
| Total (Overall) | 7,232 (52.6%) | 6,504 (47.3%) |
Employment Industries by Sex in Jackson County
Employment Industries in Jackson County
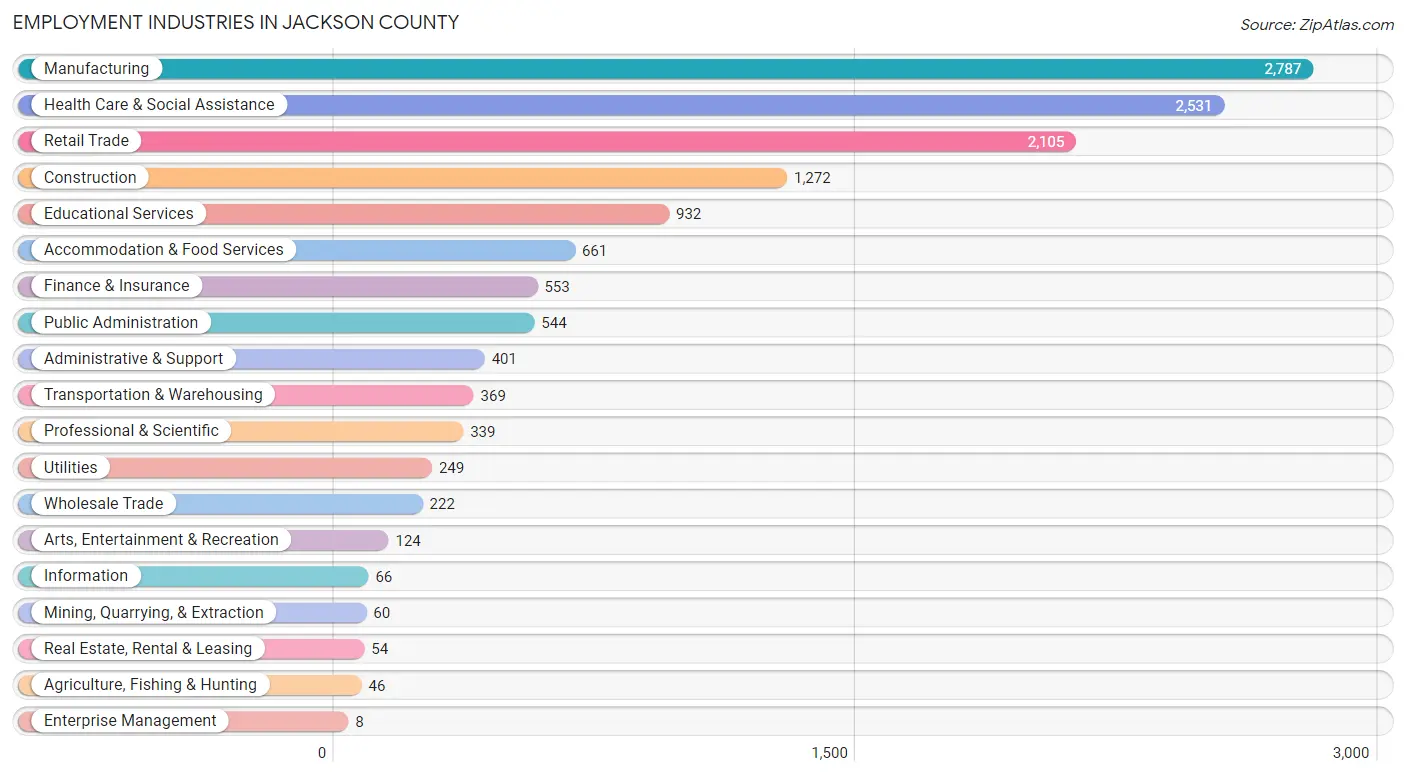
The major employment industries in Jackson County include Manufacturing (2,787 | 20.3%), Health Care & Social Assistance (2,531 | 18.4%), Retail Trade (2,105 | 15.3%), Construction (1,272 | 9.3%), and Educational Services (932 | 6.8%).
Employment Industries by Sex in Jackson County
The Jackson County industries that see more men than women are Agriculture, Fishing & Hunting (100.0%), Construction (93.3%), and Utilities (91.6%), whereas the industries that tend to have a higher number of women are Enterprise Management (100.0%), Health Care & Social Assistance (78.3%), and Accommodation & Food Services (76.8%).
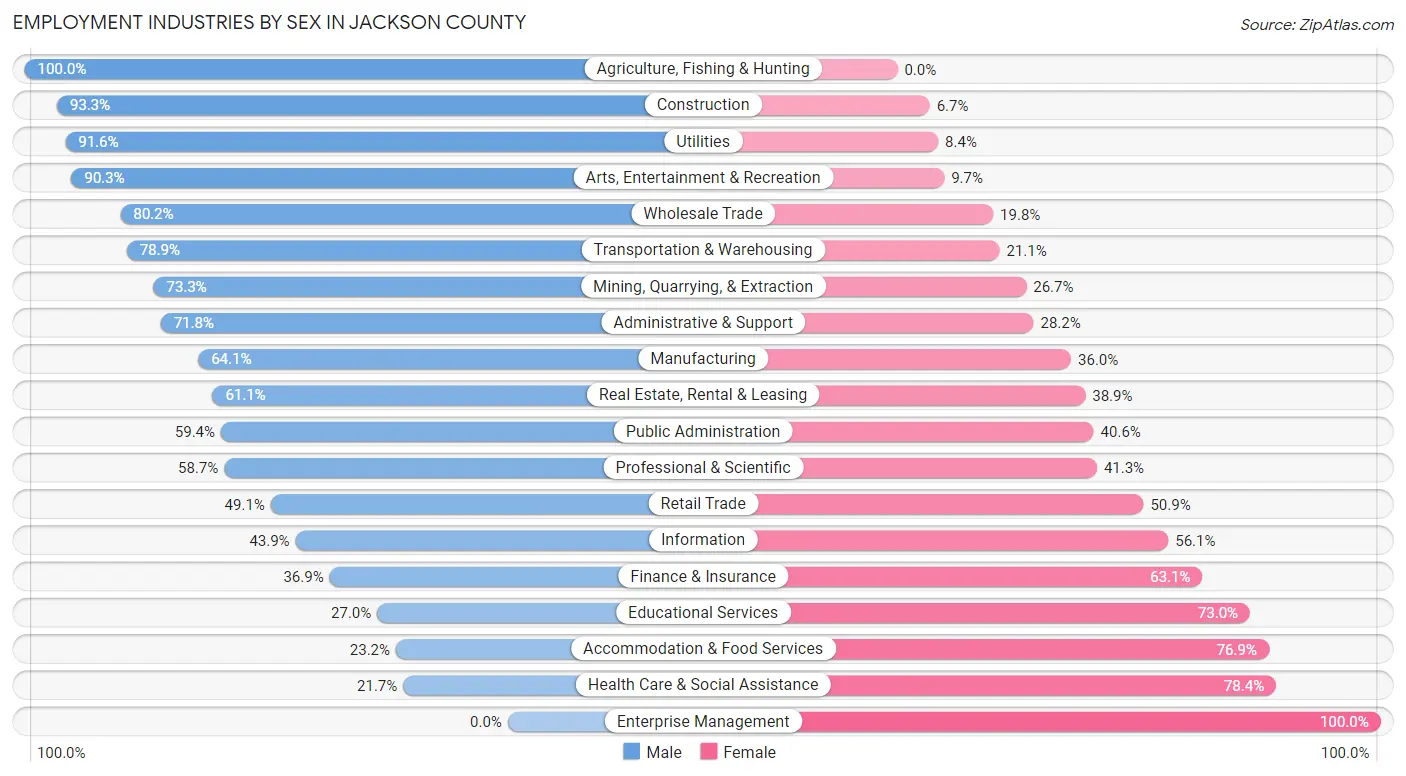
| Industry | Male | Female |
| Agriculture, Fishing & Hunting | 46 (100.0%) | 0 (0.0%) |
| Mining, Quarrying, & Extraction | 44 (73.3%) | 16 (26.7%) |
| Construction | 1,187 (93.3%) | 85 (6.7%) |
| Manufacturing | 1,785 (64.0%) | 1,002 (35.9%) |
| Wholesale Trade | 178 (80.2%) | 44 (19.8%) |
| Retail Trade | 1,033 (49.1%) | 1,072 (50.9%) |
| Transportation & Warehousing | 291 (78.9%) | 78 (21.1%) |
| Utilities | 228 (91.6%) | 21 (8.4%) |
| Information | 29 (43.9%) | 37 (56.1%) |
| Finance & Insurance | 204 (36.9%) | 349 (63.1%) |
| Real Estate, Rental & Leasing | 33 (61.1%) | 21 (38.9%) |
| Professional & Scientific | 199 (58.7%) | 140 (41.3%) |
| Enterprise Management | 0 (0.0%) | 8 (100.0%) |
| Administrative & Support | 288 (71.8%) | 113 (28.2%) |
| Educational Services | 252 (27.0%) | 680 (73.0%) |
| Health Care & Social Assistance | 548 (21.6%) | 1,983 (78.3%) |
| Arts, Entertainment & Recreation | 112 (90.3%) | 12 (9.7%) |
| Accommodation & Food Services | 153 (23.2%) | 508 (76.8%) |
| Public Administration | 323 (59.4%) | 221 (40.6%) |
| Total | 7,232 (52.6%) | 6,504 (47.3%) |
Education in Jackson County
School Enrollment in Jackson County
The most common levels of schooling among the 6,381 students in Jackson County are elementary school (1,972 | 30.9%), high school (1,802 | 28.2%), and middle school (1,335 | 20.9%).
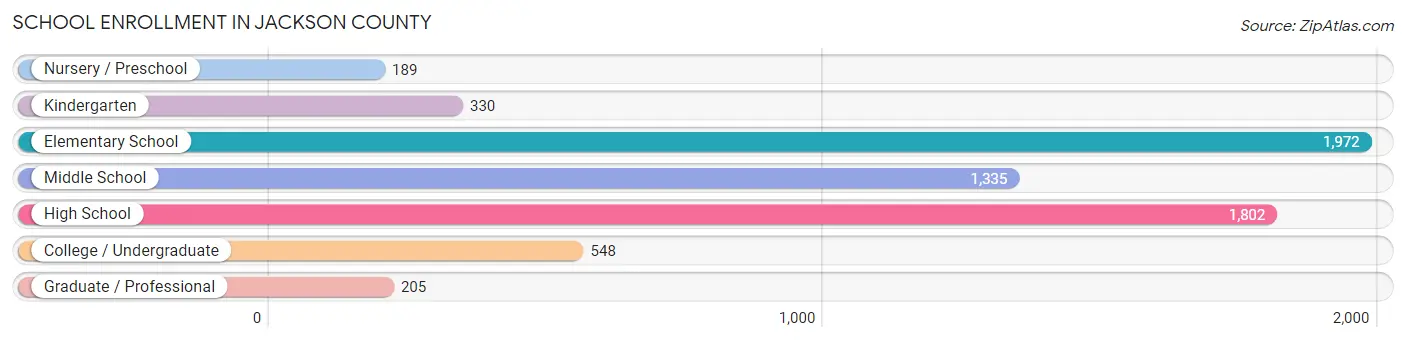
| School Level | # Students | % Students |
| Nursery / Preschool | 189 | 3.0% |
| Kindergarten | 330 | 5.2% |
| Elementary School | 1,972 | 30.9% |
| Middle School | 1,335 | 20.9% |
| High School | 1,802 | 28.2% |
| College / Undergraduate | 548 | 8.6% |
| Graduate / Professional | 205 | 3.2% |
| Total | 6,381 | 100.0% |
School Enrollment by Age by Funding Source in Jackson County
Out of a total of 6,381 students who are enrolled in schools in Jackson County, 1,078 (16.9%) attend a private institution, while the remaining 5,303 (83.1%) are enrolled in public schools. The age group of 35 years and over has the highest likelihood of being enrolled in private schools, with 109 (49.5% in the age bracket) enrolled. Conversely, the age group of 18 to 19 year olds has the lowest likelihood of being enrolled in a private school, with 301 (94.7% in the age bracket) attending a public institution.
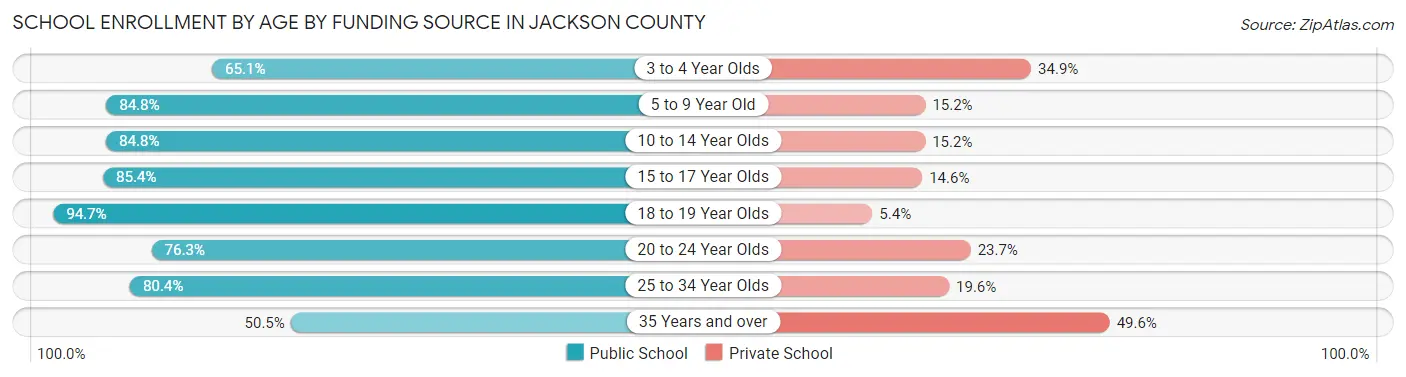
| Age Bracket | Public School | Private School |
| 3 to 4 Year Olds | 123 (65.1%) | 66 (34.9%) |
| 5 to 9 Year Old | 1,625 (84.8%) | 292 (15.2%) |
| 10 to 14 Year Olds | 1,630 (84.8%) | 292 (15.2%) |
| 15 to 17 Year Olds | 1,120 (85.4%) | 192 (14.6%) |
| 18 to 19 Year Olds | 301 (94.7%) | 17 (5.3%) |
| 20 to 24 Year Olds | 213 (76.3%) | 66 (23.7%) |
| 25 to 34 Year Olds | 180 (80.4%) | 44 (19.6%) |
| 35 Years and over | 111 (50.4%) | 109 (49.5%) |
| Total | 5,303 (83.1%) | 1,078 (16.9%) |
Educational Attainment by Field of Study in Jackson County
Education (971 | 26.3%), science & technology (550 | 14.9%), business (459 | 12.4%), arts & humanities (376 | 10.2%), and communications (244 | 6.6%) are the most common fields of study among 3,699 individuals in Jackson County who have obtained a bachelor's degree or higher.
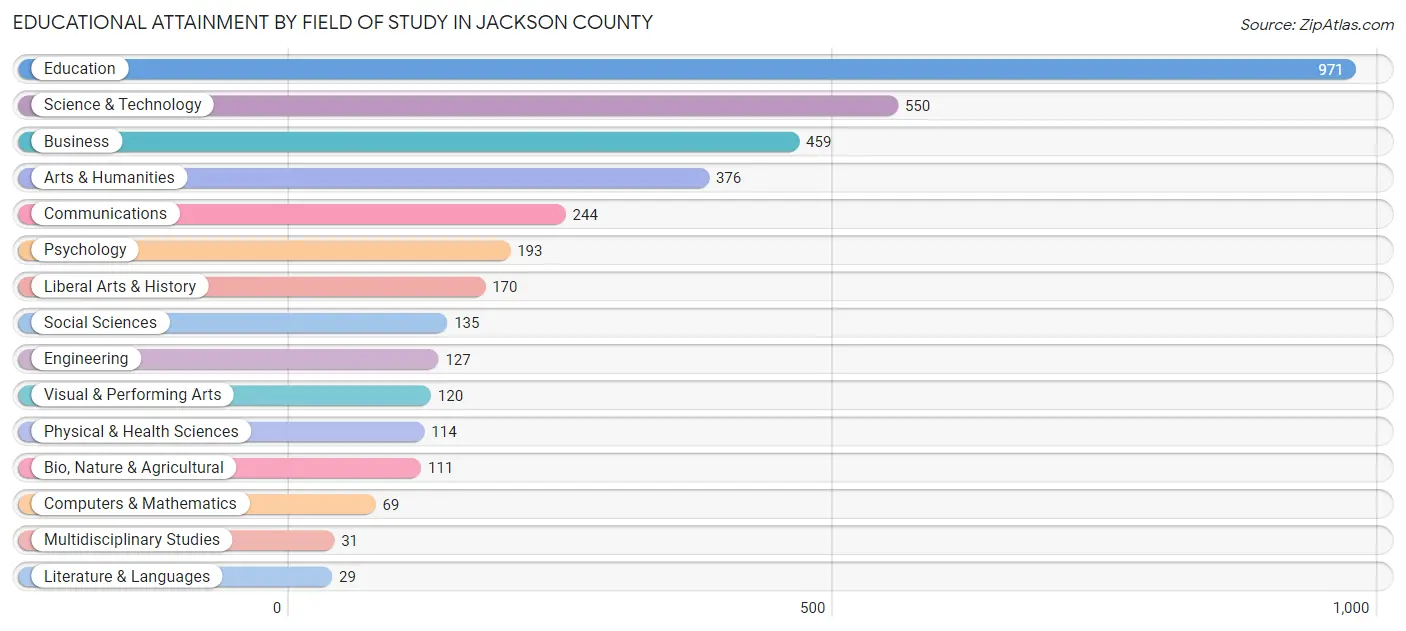
| Field of Study | # Graduates | % Graduates |
| Computers & Mathematics | 69 | 1.9% |
| Bio, Nature & Agricultural | 111 | 3.0% |
| Physical & Health Sciences | 114 | 3.1% |
| Psychology | 193 | 5.2% |
| Social Sciences | 135 | 3.6% |
| Engineering | 127 | 3.4% |
| Multidisciplinary Studies | 31 | 0.8% |
| Science & Technology | 550 | 14.9% |
| Business | 459 | 12.4% |
| Education | 971 | 26.3% |
| Literature & Languages | 29 | 0.8% |
| Liberal Arts & History | 170 | 4.6% |
| Visual & Performing Arts | 120 | 3.2% |
| Communications | 244 | 6.6% |
| Arts & Humanities | 376 | 10.2% |
| Total | 3,699 | 100.0% |
Transportation & Commute in Jackson County
Vehicle Availability by Sex in Jackson County
The most prevalent vehicle ownership categories in Jackson County are males with 2 vehicles (2,751, accounting for 38.9%) and females with 2 vehicles (2,468, making up 43.2%).
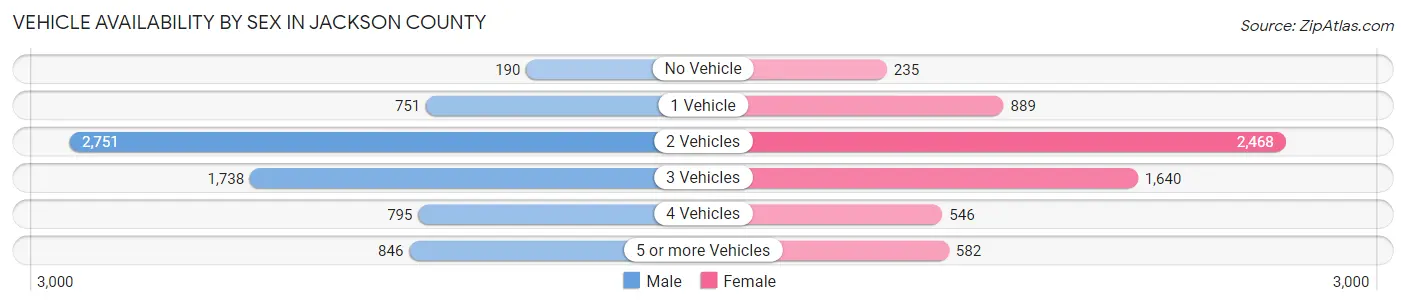
| Vehicles Available | Male | Female |
| No Vehicle | 190 (2.7%) | 235 (3.7%) |
| 1 Vehicle | 751 (10.6%) | 889 (14.0%) |
| 2 Vehicles | 2,751 (38.9%) | 2,468 (38.8%) |
| 3 Vehicles | 1,738 (24.6%) | 1,640 (25.8%) |
| 4 Vehicles | 795 (11.2%) | 546 (8.6%) |
| 5 or more Vehicles | 846 (12.0%) | 582 (9.1%) |
| Total | 7,071 (100.0%) | 6,360 (100.0%) |
Commute Time in Jackson County
The most frequently occuring commute durations in Jackson County are 15 to 19 minutes (2,254 commuters, 17.7%), 10 to 14 minutes (1,668 commuters, 13.1%), and 5 to 9 minutes (1,458 commuters, 11.4%).
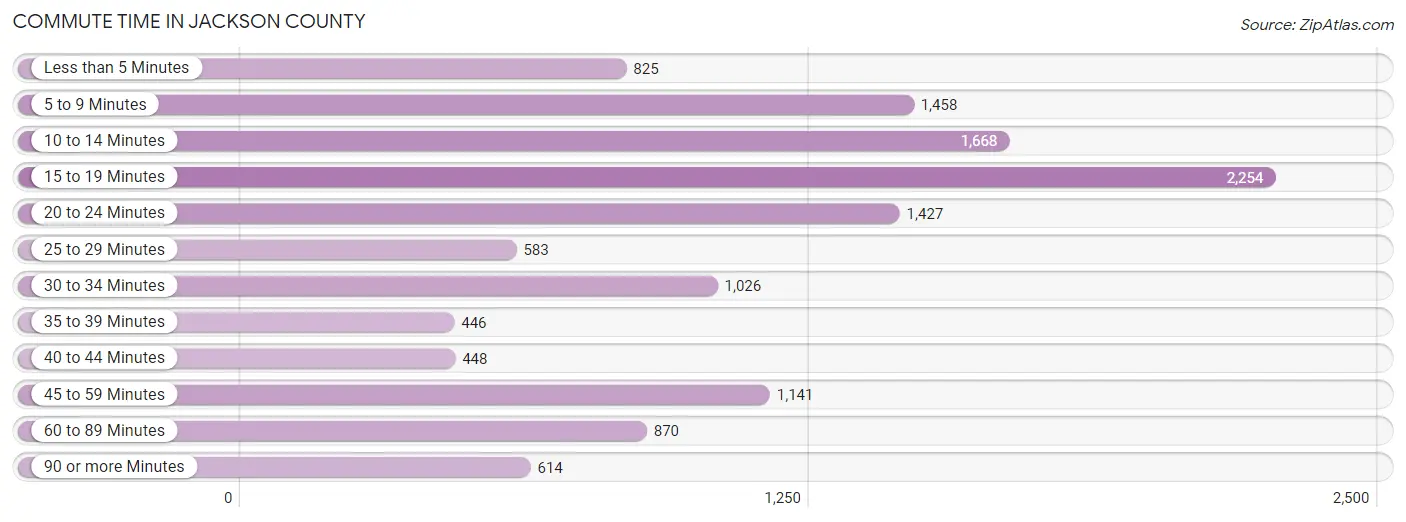
| Commute Time | # Commuters | % Commuters |
| Less than 5 Minutes | 825 | 6.5% |
| 5 to 9 Minutes | 1,458 | 11.4% |
| 10 to 14 Minutes | 1,668 | 13.1% |
| 15 to 19 Minutes | 2,254 | 17.7% |
| 20 to 24 Minutes | 1,427 | 11.2% |
| 25 to 29 Minutes | 583 | 4.6% |
| 30 to 34 Minutes | 1,026 | 8.0% |
| 35 to 39 Minutes | 446 | 3.5% |
| 40 to 44 Minutes | 448 | 3.5% |
| 45 to 59 Minutes | 1,141 | 8.9% |
| 60 to 89 Minutes | 870 | 6.8% |
| 90 or more Minutes | 614 | 4.8% |
Commute Time by Sex in Jackson County
The most common commute times in Jackson County are 15 to 19 minutes (1,116 commuters, 16.4%) for males and 15 to 19 minutes (1,138 commuters, 19.1%) for females.
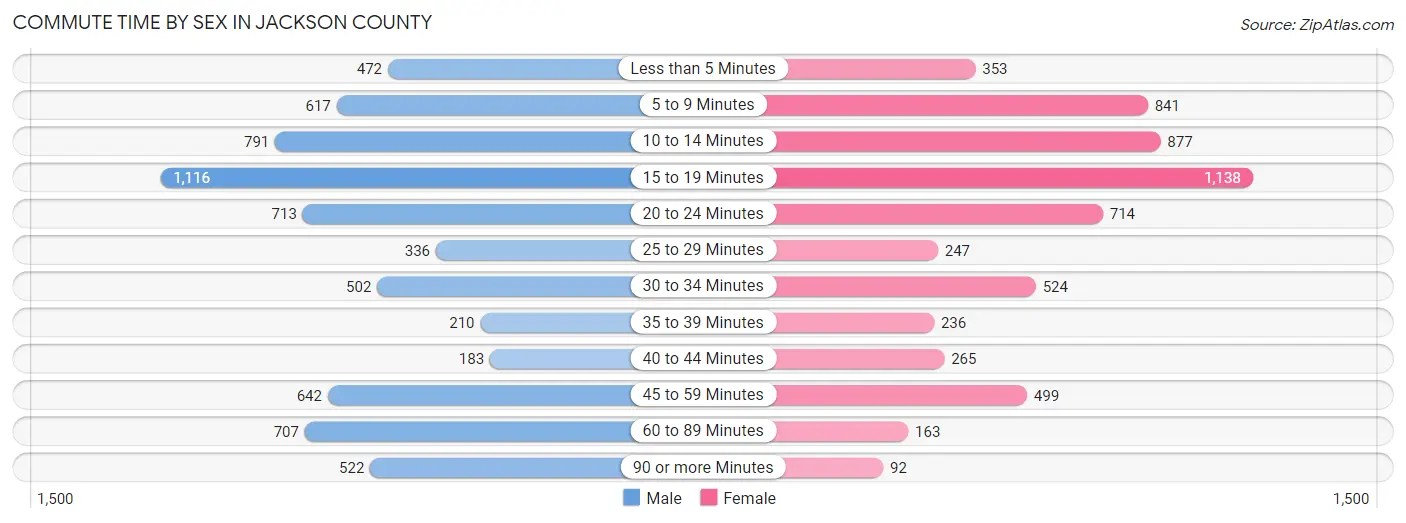
| Commute Time | Male | Female |
| Less than 5 Minutes | 472 (6.9%) | 353 (5.9%) |
| 5 to 9 Minutes | 617 (9.1%) | 841 (14.1%) |
| 10 to 14 Minutes | 791 (11.6%) | 877 (14.7%) |
| 15 to 19 Minutes | 1,116 (16.4%) | 1,138 (19.1%) |
| 20 to 24 Minutes | 713 (10.5%) | 714 (12.0%) |
| 25 to 29 Minutes | 336 (4.9%) | 247 (4.2%) |
| 30 to 34 Minutes | 502 (7.4%) | 524 (8.8%) |
| 35 to 39 Minutes | 210 (3.1%) | 236 (4.0%) |
| 40 to 44 Minutes | 183 (2.7%) | 265 (4.4%) |
| 45 to 59 Minutes | 642 (9.4%) | 499 (8.4%) |
| 60 to 89 Minutes | 707 (10.4%) | 163 (2.7%) |
| 90 or more Minutes | 522 (7.7%) | 92 (1.5%) |
Time of Departure to Work by Sex in Jackson County
The most frequent times of departure to work in Jackson County are 7:30 AM to 7:59 AM (912, 13.4%) for males and 7:30 AM to 7:59 AM (999, 16.8%) for females.
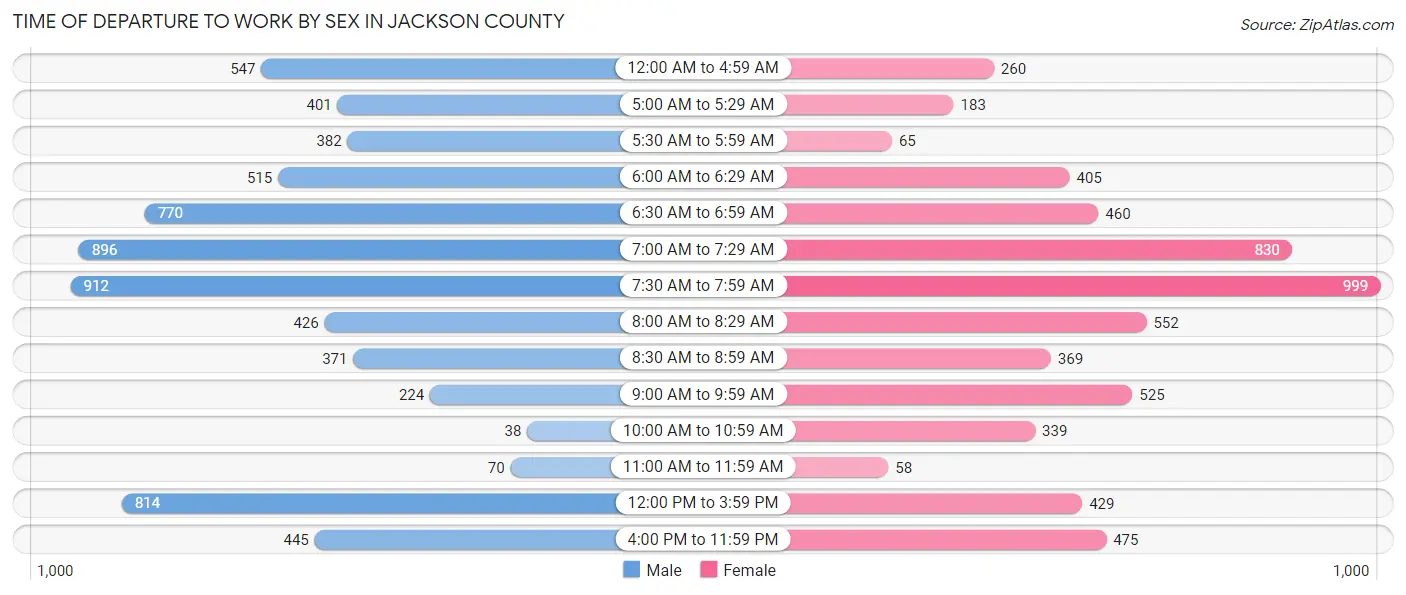
| Time of Departure | Male | Female |
| 12:00 AM to 4:59 AM | 547 (8.0%) | 260 (4.4%) |
| 5:00 AM to 5:29 AM | 401 (5.9%) | 183 (3.1%) |
| 5:30 AM to 5:59 AM | 382 (5.6%) | 65 (1.1%) |
| 6:00 AM to 6:29 AM | 515 (7.6%) | 405 (6.8%) |
| 6:30 AM to 6:59 AM | 770 (11.3%) | 460 (7.7%) |
| 7:00 AM to 7:29 AM | 896 (13.2%) | 830 (14.0%) |
| 7:30 AM to 7:59 AM | 912 (13.4%) | 999 (16.8%) |
| 8:00 AM to 8:29 AM | 426 (6.2%) | 552 (9.3%) |
| 8:30 AM to 8:59 AM | 371 (5.4%) | 369 (6.2%) |
| 9:00 AM to 9:59 AM | 224 (3.3%) | 525 (8.8%) |
| 10:00 AM to 10:59 AM | 38 (0.6%) | 339 (5.7%) |
| 11:00 AM to 11:59 AM | 70 (1.0%) | 58 (1.0%) |
| 12:00 PM to 3:59 PM | 814 (11.9%) | 429 (7.2%) |
| 4:00 PM to 11:59 PM | 445 (6.5%) | 475 (8.0%) |
| Total | 6,811 (100.0%) | 5,949 (100.0%) |
Housing Occupancy in Jackson County
Occupancy by Ownership in Jackson County
Of the total 12,453 dwellings in Jackson County, owner-occupied units account for 9,261 (74.4%), while renter-occupied units make up 3,192 (25.6%).
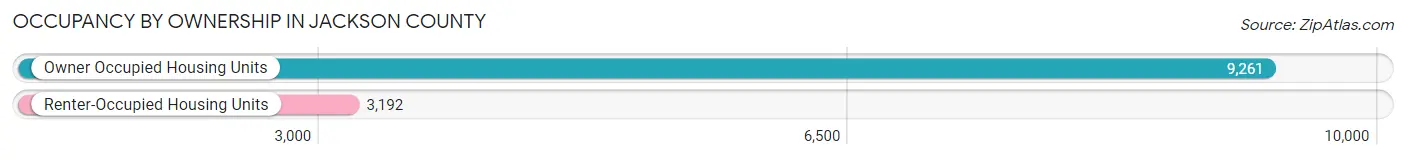
| Occupancy | # Housing Units | % Housing Units |
| Owner Occupied Housing Units | 9,261 | 74.4% |
| Renter-Occupied Housing Units | 3,192 | 25.6% |
| Total Occupied Housing Units | 12,453 | 100.0% |
Occupancy by Household Size in Jackson County
| Household Size | # Housing Units | % Housing Units |
| 1-Person Household | 3,025 | 24.3% |
| 2-Person Household | 4,690 | 37.7% |
| 3-Person Household | 1,651 | 13.3% |
| 4+ Person Household | 3,087 | 24.8% |
| Total Housing Units | 12,453 | 100.0% |
Occupancy by Ownership by Household Size in Jackson County
| Household Size | Owner-occupied | Renter-occupied |
| 1-Person Household | 1,759 (58.2%) | 1,266 (41.8%) |
| 2-Person Household | 3,596 (76.7%) | 1,094 (23.3%) |
| 3-Person Household | 1,219 (73.8%) | 432 (26.2%) |
| 4+ Person Household | 2,687 (87.0%) | 400 (13.0%) |
| Total Housing Units | 9,261 (74.4%) | 3,192 (25.6%) |
Occupancy by Educational Attainment in Jackson County
| Household Size | Owner-occupied | Renter-occupied |
| Less than High School | 947 (67.4%) | 458 (32.6%) |
| High School Diploma | 4,036 (69.5%) | 1,772 (30.5%) |
| College/Associate Degree | 2,668 (76.9%) | 799 (23.1%) |
| Bachelor's Degree or higher | 1,610 (90.8%) | 163 (9.2%) |
Occupancy by Age of Householder in Jackson County
| Age Bracket | # Households | % Households |
| Under 35 Years | 2,174 | 17.5% |
| 35 to 44 Years | 1,967 | 15.8% |
| 45 to 54 Years | 2,224 | 17.9% |
| 55 to 64 Years | 2,653 | 21.3% |
| 65 to 74 Years | 2,086 | 16.8% |
| 75 to 84 Years | 993 | 8.0% |
| 85 Years and Over | 356 | 2.9% |
| Total | 12,453 | 100.0% |
Housing Finances in Jackson County
Median Income by Occupancy in Jackson County
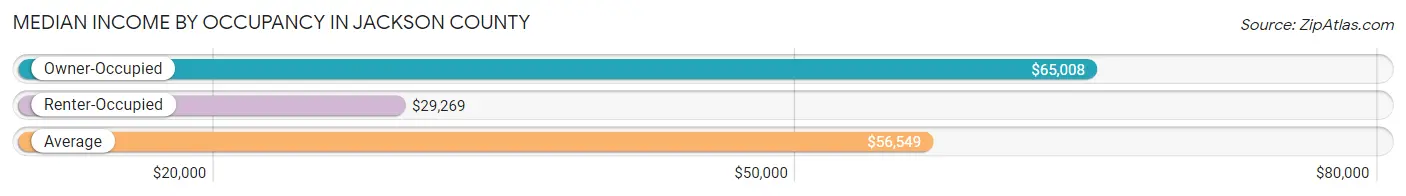
| Occupancy Type | # Households | Median Income |
| Owner-Occupied | 9,261 (74.4%) | $65,008 |
| Renter-Occupied | 3,192 (25.6%) | $29,269 |
| Average | 12,453 (100.0%) | $56,549 |
Occupancy by Householder Income Bracket in Jackson County
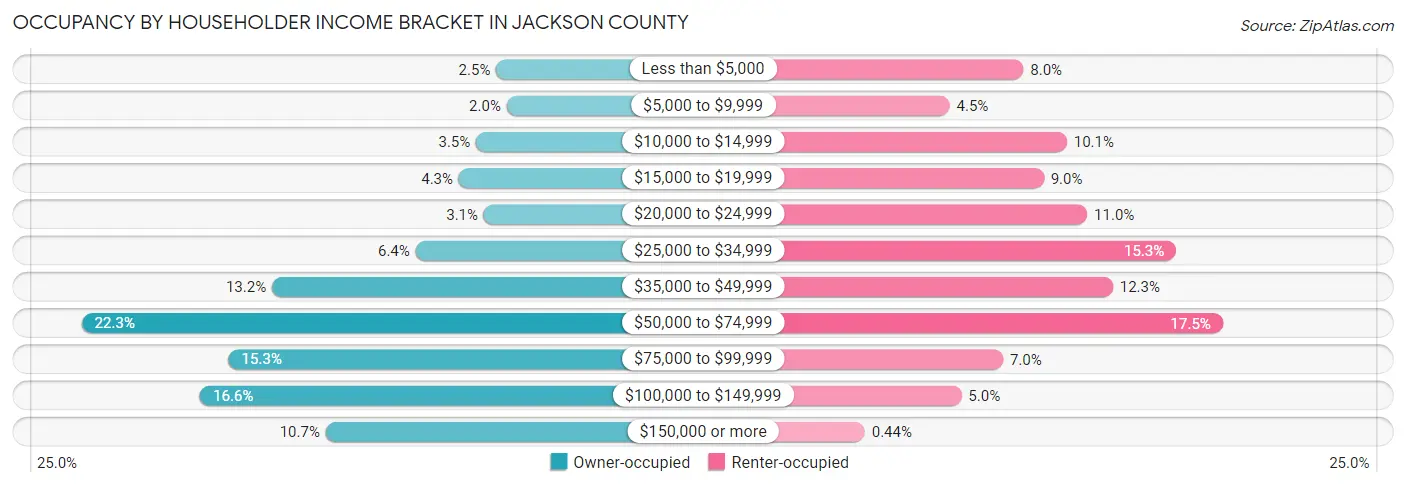
| Income Bracket | Owner-occupied | Renter-occupied |
| Less than $5,000 | 235 (2.5%) | 255 (8.0%) |
| $5,000 to $9,999 | 189 (2.0%) | 143 (4.5%) |
| $10,000 to $14,999 | 324 (3.5%) | 321 (10.1%) |
| $15,000 to $19,999 | 400 (4.3%) | 286 (9.0%) |
| $20,000 to $24,999 | 290 (3.1%) | 352 (11.0%) |
| $25,000 to $34,999 | 591 (6.4%) | 487 (15.3%) |
| $35,000 to $49,999 | 1,224 (13.2%) | 391 (12.2%) |
| $50,000 to $74,999 | 2,064 (22.3%) | 558 (17.5%) |
| $75,000 to $99,999 | 1,416 (15.3%) | 224 (7.0%) |
| $100,000 to $149,999 | 1,541 (16.6%) | 161 (5.0%) |
| $150,000 or more | 987 (10.7%) | 14 (0.4%) |
| Total | 9,261 (100.0%) | 3,192 (100.0%) |
Monthly Housing Cost Tiers in Jackson County
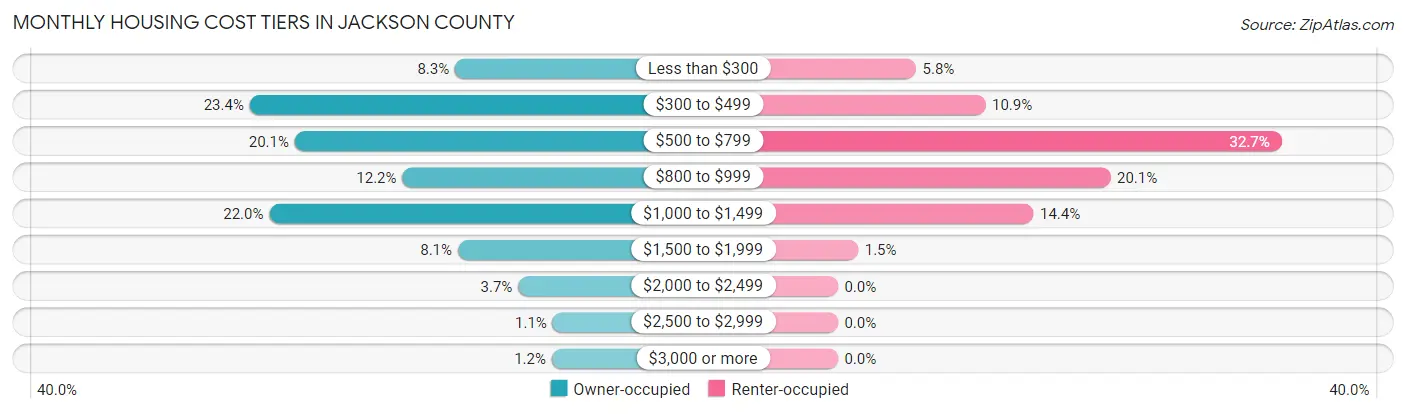
| Monthly Cost | Owner-occupied | Renter-occupied |
| Less than $300 | 769 (8.3%) | 184 (5.8%) |
| $300 to $499 | 2,169 (23.4%) | 347 (10.9%) |
| $500 to $799 | 1,861 (20.1%) | 1,044 (32.7%) |
| $800 to $999 | 1,128 (12.2%) | 641 (20.1%) |
| $1,000 to $1,499 | 2,036 (22.0%) | 460 (14.4%) |
| $1,500 to $1,999 | 749 (8.1%) | 48 (1.5%) |
| $2,000 to $2,499 | 338 (3.6%) | 0 (0.0%) |
| $2,500 to $2,999 | 103 (1.1%) | 0 (0.0%) |
| $3,000 or more | 108 (1.2%) | 0 (0.0%) |
| Total | 9,261 (100.0%) | 3,192 (100.0%) |
Physical Housing Characteristics in Jackson County
Housing Structures in Jackson County
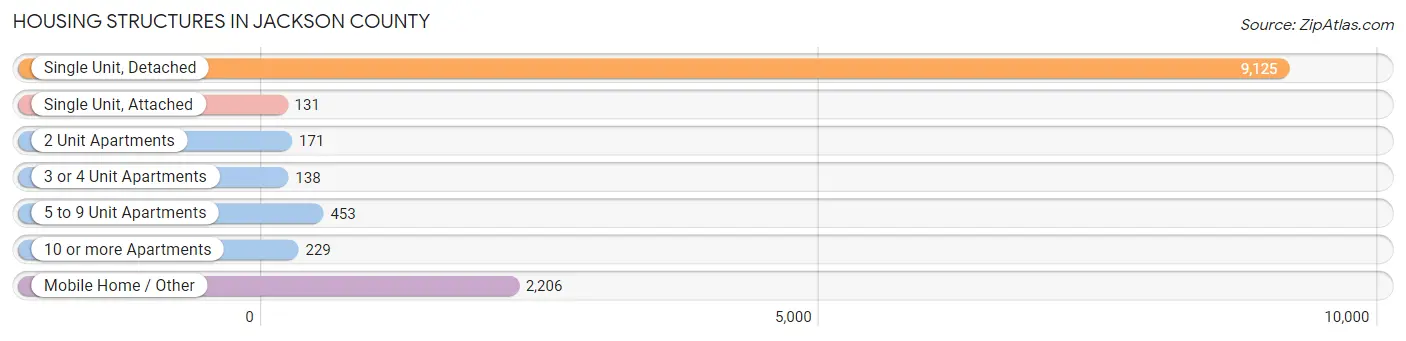
| Structure Type | # Housing Units | % Housing Units |
| Single Unit, Detached | 9,125 | 73.3% |
| Single Unit, Attached | 131 | 1.1% |
| 2 Unit Apartments | 171 | 1.4% |
| 3 or 4 Unit Apartments | 138 | 1.1% |
| 5 to 9 Unit Apartments | 453 | 3.6% |
| 10 or more Apartments | 229 | 1.8% |
| Mobile Home / Other | 2,206 | 17.7% |
| Total | 12,453 | 100.0% |
Housing Structures by Occupancy in Jackson County
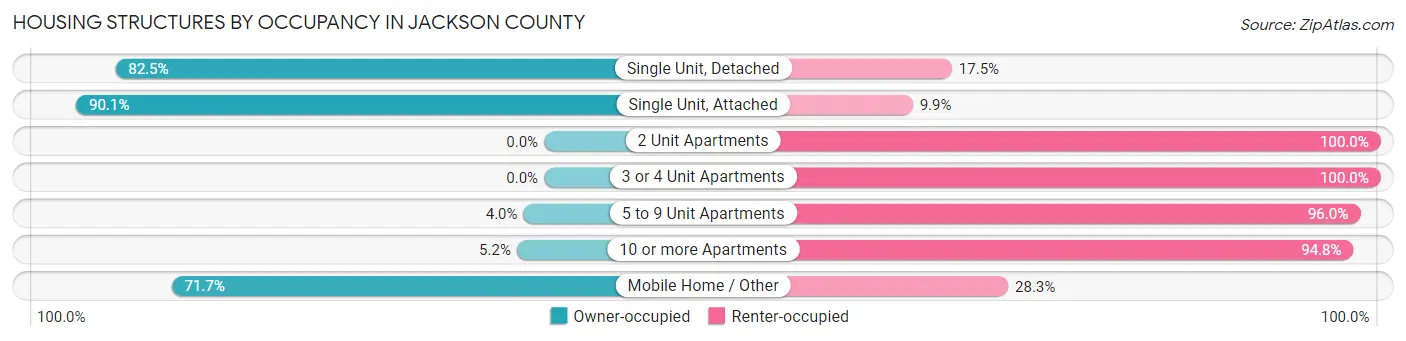
| Structure Type | Owner-occupied | Renter-occupied |
| Single Unit, Detached | 7,531 (82.5%) | 1,594 (17.5%) |
| Single Unit, Attached | 118 (90.1%) | 13 (9.9%) |
| 2 Unit Apartments | 0 (0.0%) | 171 (100.0%) |
| 3 or 4 Unit Apartments | 0 (0.0%) | 138 (100.0%) |
| 5 to 9 Unit Apartments | 18 (4.0%) | 435 (96.0%) |
| 10 or more Apartments | 12 (5.2%) | 217 (94.8%) |
| Mobile Home / Other | 1,582 (71.7%) | 624 (28.3%) |
| Total | 9,261 (74.4%) | 3,192 (25.6%) |
Housing Structures by Number of Rooms in Jackson County
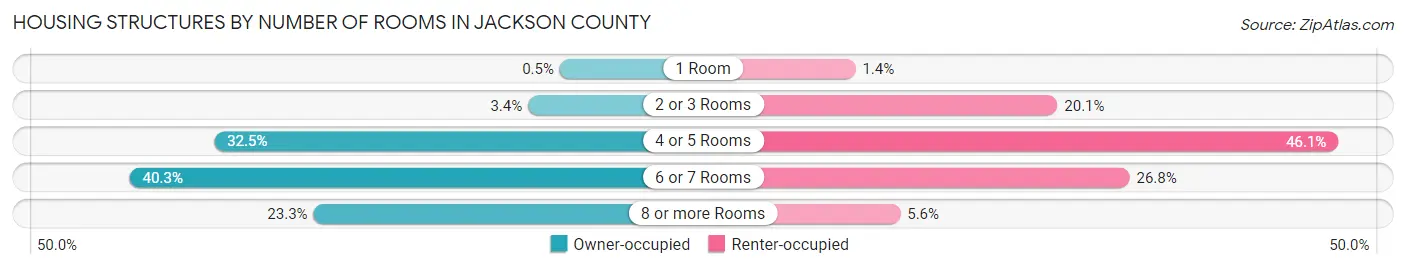
| Number of Rooms | Owner-occupied | Renter-occupied |
| 1 Room | 46 (0.5%) | 46 (1.4%) |
| 2 or 3 Rooms | 319 (3.4%) | 642 (20.1%) |
| 4 or 5 Rooms | 3,008 (32.5%) | 1,471 (46.1%) |
| 6 or 7 Rooms | 3,731 (40.3%) | 855 (26.8%) |
| 8 or more Rooms | 2,157 (23.3%) | 178 (5.6%) |
| Total | 9,261 (100.0%) | 3,192 (100.0%) |
Housing Structure by Heating Type in Jackson County
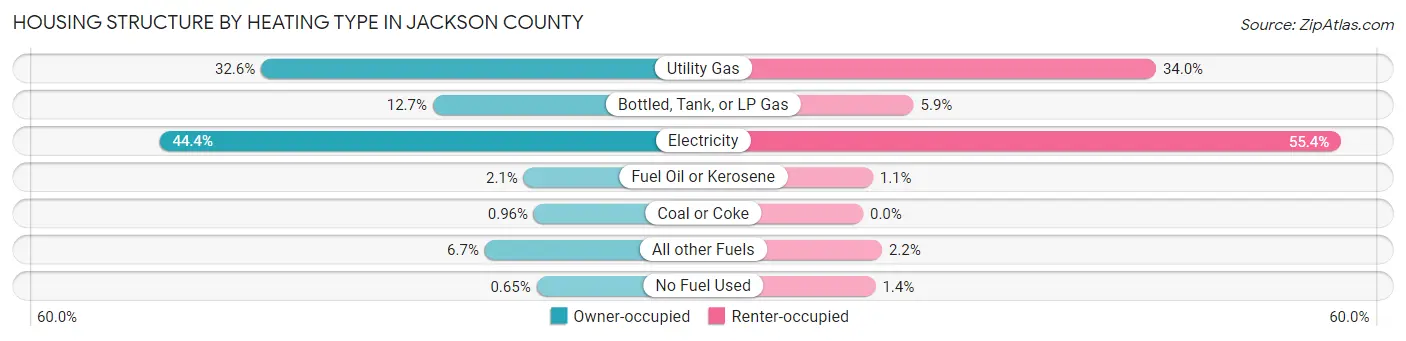
| Heating Type | Owner-occupied | Renter-occupied |
| Utility Gas | 3,018 (32.6%) | 1,084 (34.0%) |
| Bottled, Tank, or LP Gas | 1,173 (12.7%) | 187 (5.9%) |
| Electricity | 4,107 (44.4%) | 1,769 (55.4%) |
| Fuel Oil or Kerosene | 198 (2.1%) | 36 (1.1%) |
| Coal or Coke | 89 (1.0%) | 0 (0.0%) |
| All other Fuels | 616 (6.7%) | 70 (2.2%) |
| No Fuel Used | 60 (0.6%) | 46 (1.4%) |
| Total | 9,261 (100.0%) | 3,192 (100.0%) |
Household Vehicle Usage in Jackson County
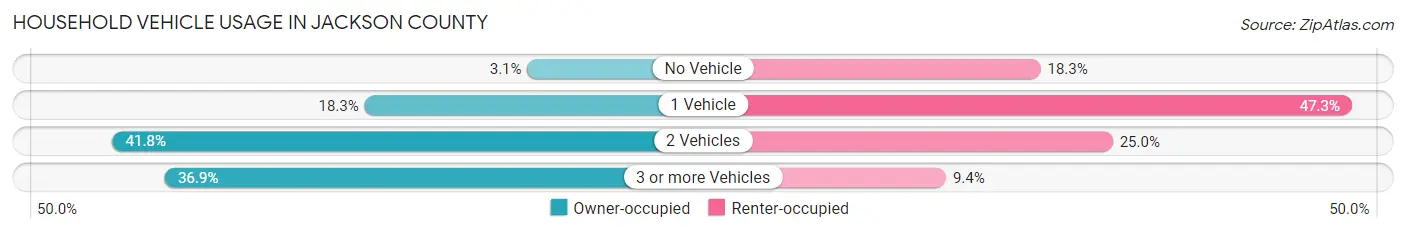
| Vehicles per Household | Owner-occupied | Renter-occupied |
| No Vehicle | 284 (3.1%) | 583 (18.3%) |
| 1 Vehicle | 1,692 (18.3%) | 1,510 (47.3%) |
| 2 Vehicles | 3,869 (41.8%) | 798 (25.0%) |
| 3 or more Vehicles | 3,416 (36.9%) | 301 (9.4%) |
| Total | 9,261 (100.0%) | 3,192 (100.0%) |
Real Estate & Mortgages in Jackson County
Real Estate and Mortgage Overview in Jackson County
| Characteristic | Without Mortgage | With Mortgage |
| Housing Units | 4,598 | 4,663 |
| Median Property Value | $99,000 | $151,000 |
| Median Household Income | $53,776 | $634 |
| Monthly Housing Costs | $458 | $54 |
| Real Estate Taxes | $1,232 | $175 |
Property Value by Mortgage Status in Jackson County
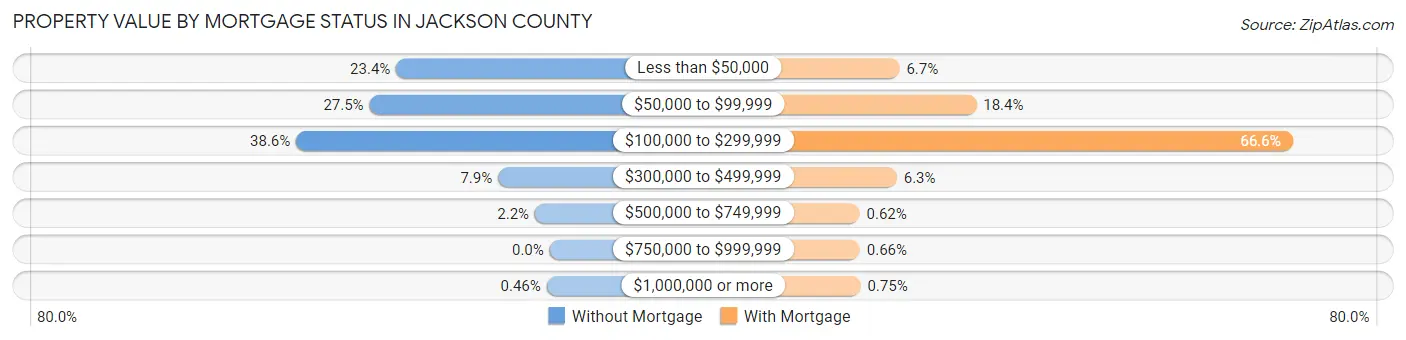
| Property Value | Without Mortgage | With Mortgage |
| Less than $50,000 | 1,075 (23.4%) | 312 (6.7%) |
| $50,000 to $99,999 | 1,262 (27.5%) | 858 (18.4%) |
| $100,000 to $299,999 | 1,776 (38.6%) | 3,105 (66.6%) |
| $300,000 to $499,999 | 361 (7.9%) | 293 (6.3%) |
| $500,000 to $749,999 | 103 (2.2%) | 29 (0.6%) |
| $750,000 to $999,999 | 0 (0.0%) | 31 (0.7%) |
| $1,000,000 or more | 21 (0.5%) | 35 (0.7%) |
| Total | 4,598 (100.0%) | 4,663 (100.0%) |
Household Income by Mortgage Status in Jackson County
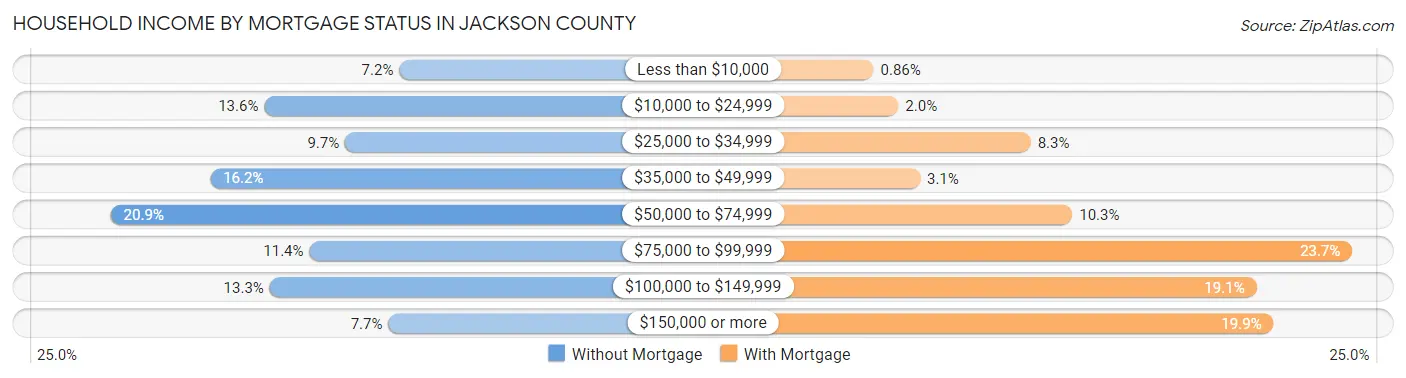
| Household Income | Without Mortgage | With Mortgage |
| Less than $10,000 | 329 (7.2%) | 40 (0.9%) |
| $10,000 to $24,999 | 625 (13.6%) | 95 (2.0%) |
| $25,000 to $34,999 | 448 (9.7%) | 389 (8.3%) |
| $35,000 to $49,999 | 743 (16.2%) | 143 (3.1%) |
| $50,000 to $74,999 | 961 (20.9%) | 481 (10.3%) |
| $75,000 to $99,999 | 526 (11.4%) | 1,103 (23.6%) |
| $100,000 to $149,999 | 613 (13.3%) | 890 (19.1%) |
| $150,000 or more | 353 (7.7%) | 928 (19.9%) |
| Total | 4,598 (100.0%) | 4,663 (100.0%) |
Property Value to Household Income Ratio in Jackson County
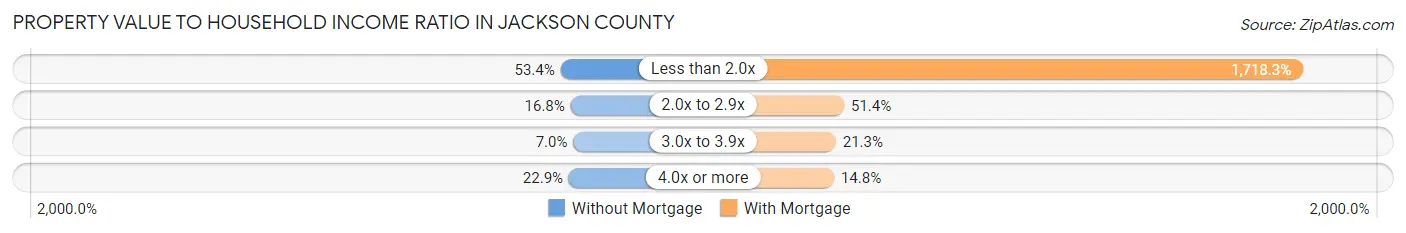
| Value-to-Income Ratio | Without Mortgage | With Mortgage |
| Less than 2.0x | 2,453 (53.3%) | 80,126 (1,718.3%) |
| 2.0x to 2.9x | 771 (16.8%) | 2,396 (51.4%) |
| 3.0x to 3.9x | 321 (7.0%) | 994 (21.3%) |
| 4.0x or more | 1,053 (22.9%) | 688 (14.7%) |
| Total | 4,598 (100.0%) | 4,663 (100.0%) |
Real Estate Taxes by Mortgage Status in Jackson County
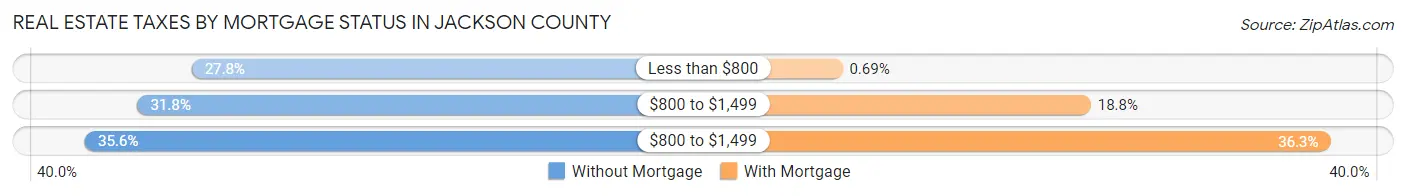
| Property Taxes | Without Mortgage | With Mortgage |
| Less than $800 | 1,278 (27.8%) | 32 (0.7%) |
| $800 to $1,499 | 1,460 (31.8%) | 878 (18.8%) |
| $800 to $1,499 | 1,636 (35.6%) | 1,694 (36.3%) |
| Total | 4,598 (100.0%) | 4,663 (100.0%) |
Health & Disability in Jackson County
Health Insurance Coverage by Age in Jackson County
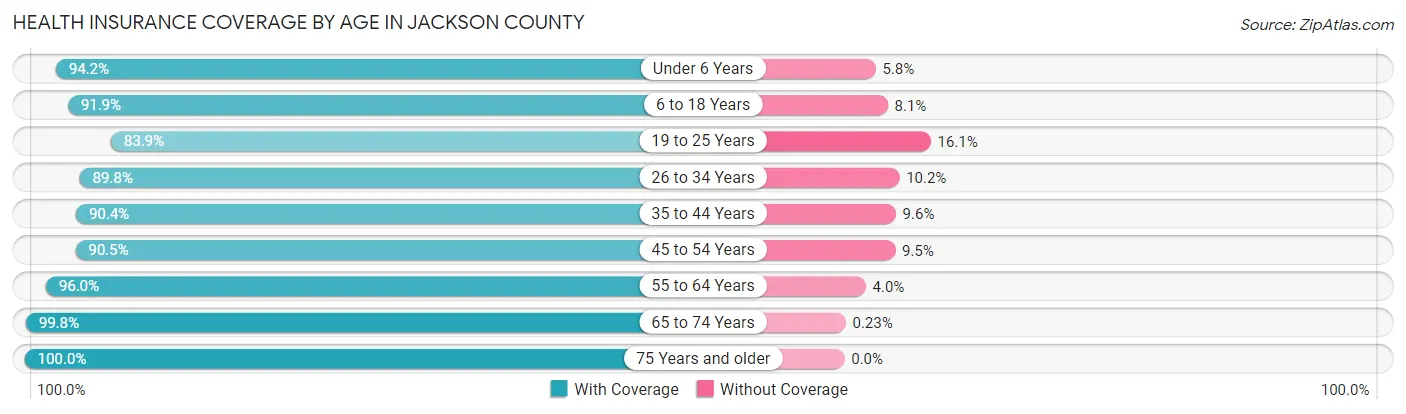
| Age Bracket | With Coverage | Without Coverage |
| Under 6 Years | 2,282 (94.2%) | 141 (5.8%) |
| 6 to 18 Years | 5,105 (91.9%) | 448 (8.1%) |
| 19 to 25 Years | 2,170 (83.9%) | 416 (16.1%) |
| 26 to 34 Years | 3,262 (89.8%) | 372 (10.2%) |
| 35 to 44 Years | 3,585 (90.4%) | 380 (9.6%) |
| 45 to 54 Years | 3,809 (90.5%) | 398 (9.5%) |
| 55 to 64 Years | 4,233 (96.0%) | 175 (4.0%) |
| 65 to 74 Years | 3,493 (99.8%) | 8 (0.2%) |
| 75 Years and older | 1,969 (100.0%) | 0 (0.0%) |
| Total | 29,908 (92.7%) | 2,338 (7.2%) |
Health Insurance Coverage by Citizenship Status in Jackson County
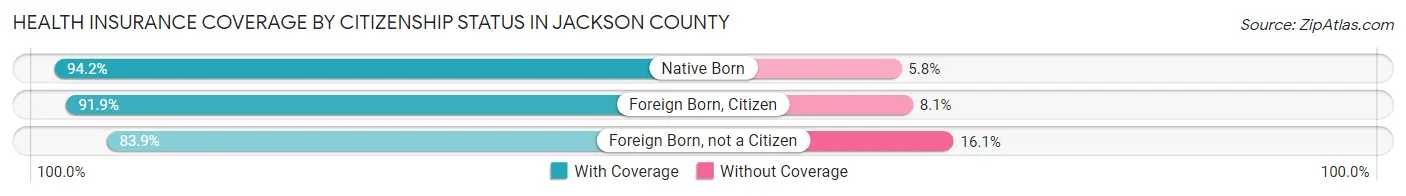
| Citizenship Status | With Coverage | Without Coverage |
| Native Born | 2,282 (94.2%) | 141 (5.8%) |
| Foreign Born, Citizen | 5,105 (91.9%) | 448 (8.1%) |
| Foreign Born, not a Citizen | 2,170 (83.9%) | 416 (16.1%) |
Health Insurance Coverage by Household Income in Jackson County
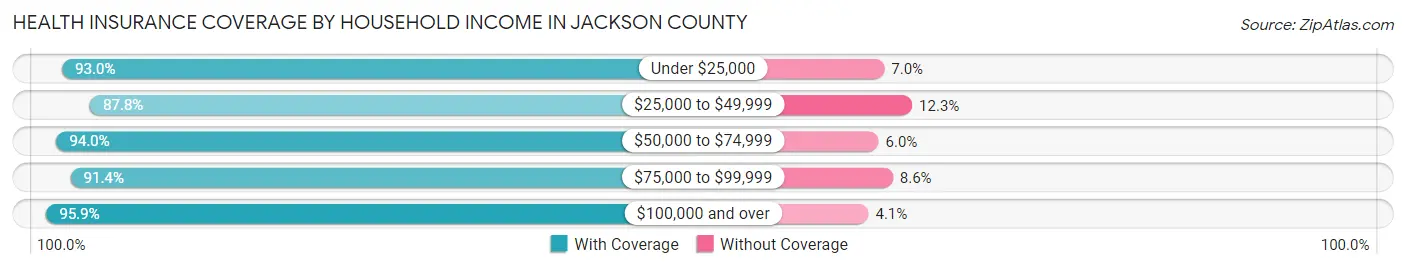
| Household Income | With Coverage | Without Coverage |
| Under $25,000 | 4,467 (93.0%) | 338 (7.0%) |
| $25,000 to $49,999 | 5,575 (87.7%) | 778 (12.2%) |
| $50,000 to $74,999 | 6,056 (94.0%) | 384 (6.0%) |
| $75,000 to $99,999 | 4,857 (91.4%) | 459 (8.6%) |
| $100,000 and over | 8,931 (95.9%) | 379 (4.1%) |
Public vs Private Health Insurance Coverage by Age in Jackson County
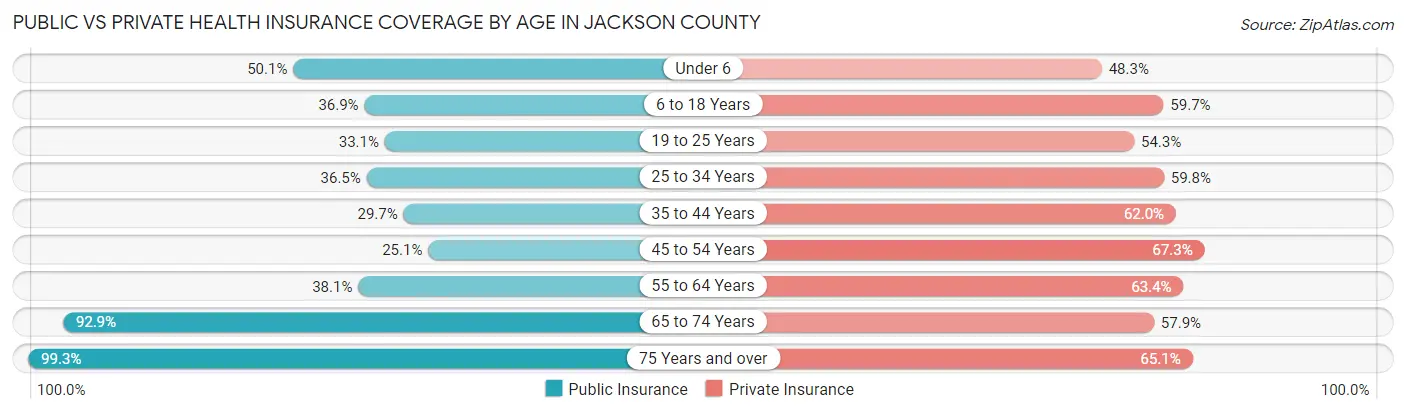
| Age Bracket | Public Insurance | Private Insurance |
| Under 6 | 1,215 (50.1%) | 1,169 (48.2%) |
| 6 to 18 Years | 2,050 (36.9%) | 3,315 (59.7%) |
| 19 to 25 Years | 857 (33.1%) | 1,403 (54.2%) |
| 25 to 34 Years | 1,327 (36.5%) | 2,172 (59.8%) |
| 35 to 44 Years | 1,176 (29.7%) | 2,459 (62.0%) |
| 45 to 54 Years | 1,055 (25.1%) | 2,832 (67.3%) |
| 55 to 64 Years | 1,678 (38.1%) | 2,795 (63.4%) |
| 65 to 74 Years | 3,252 (92.9%) | 2,028 (57.9%) |
| 75 Years and over | 1,956 (99.3%) | 1,282 (65.1%) |
| Total | 14,566 (45.2%) | 19,455 (60.3%) |
Disability Status by Sex by Age in Jackson County

| Age Bracket | Male | Female |
| Under 5 Years | 0 (0.0%) | 0 (0.0%) |
| 5 to 17 Years | 168 (5.9%) | 149 (5.5%) |
| 18 to 34 Years | 505 (15.2%) | 457 (14.3%) |
| 35 to 64 Years | 1,600 (25.8%) | 1,690 (26.5%) |
| 65 to 74 Years | 601 (37.1%) | 702 (37.3%) |
| 75 Years and over | 448 (55.0%) | 649 (56.2%) |
Disability Class by Sex by Age in Jackson County
Disability Class: Hearing Difficulty
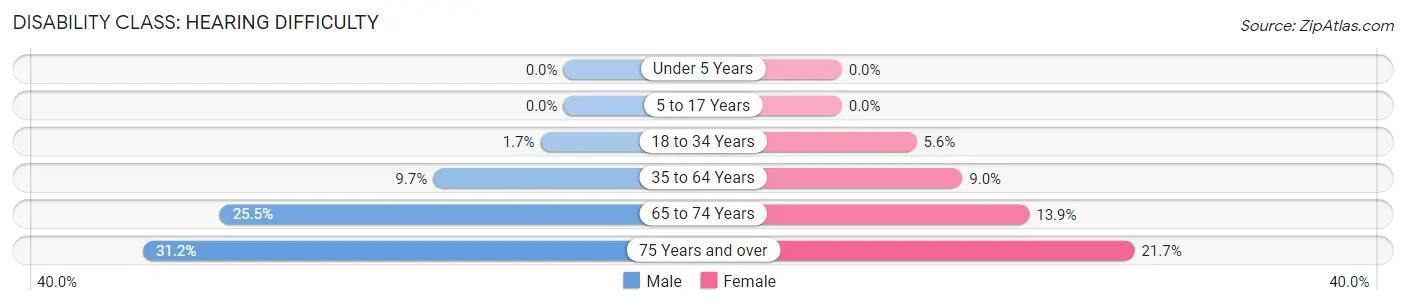
| Age Bracket | Male | Female |
| Under 5 Years | 0 (0.0%) | 0 (0.0%) |
| 5 to 17 Years | 0 (0.0%) | 0 (0.0%) |
| 18 to 34 Years | 57 (1.7%) | 178 (5.6%) |
| 35 to 64 Years | 600 (9.7%) | 571 (8.9%) |
| 65 to 74 Years | 413 (25.5%) | 262 (13.9%) |
| 75 Years and over | 254 (31.2%) | 251 (21.7%) |
Disability Class: Vision Difficulty
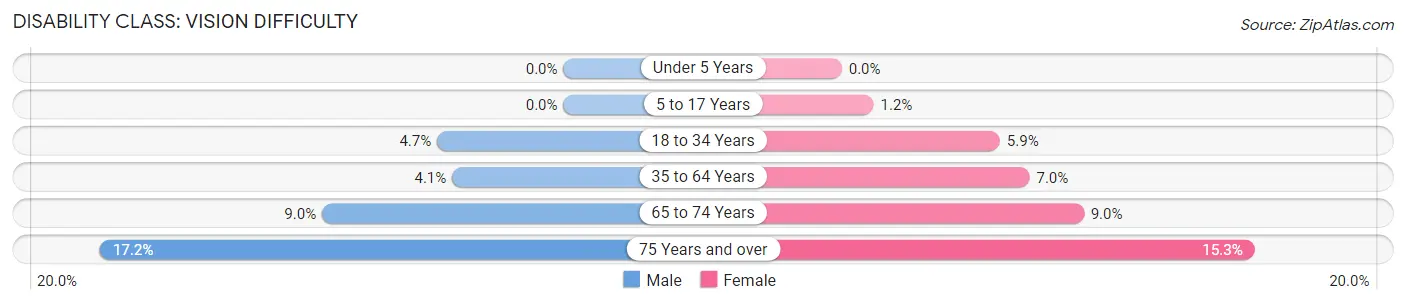
| Age Bracket | Male | Female |
| Under 5 Years | 0 (0.0%) | 0 (0.0%) |
| 5 to 17 Years | 0 (0.0%) | 32 (1.2%) |
| 18 to 34 Years | 156 (4.7%) | 188 (5.9%) |
| 35 to 64 Years | 256 (4.1%) | 445 (7.0%) |
| 65 to 74 Years | 145 (9.0%) | 169 (9.0%) |
| 75 Years and over | 140 (17.2%) | 177 (15.3%) |
Disability Class: Cognitive Difficulty
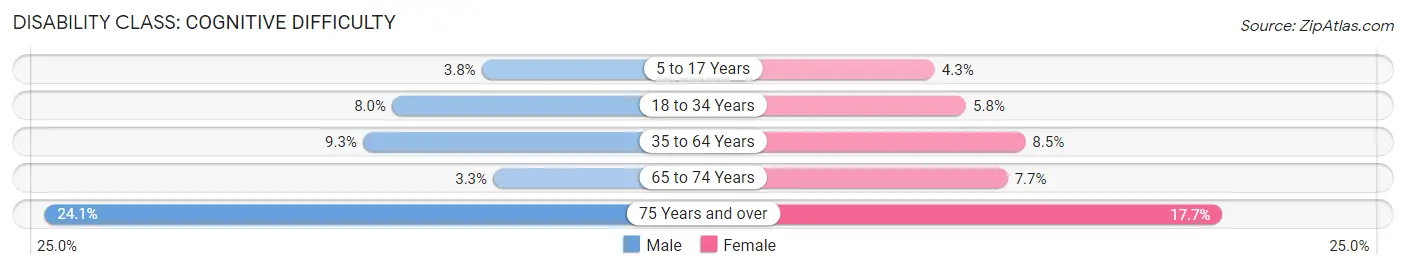
| Age Bracket | Male | Female |
| 5 to 17 Years | 109 (3.8%) | 117 (4.3%) |
| 18 to 34 Years | 265 (8.0%) | 185 (5.8%) |
| 35 to 64 Years | 577 (9.3%) | 544 (8.5%) |
| 65 to 74 Years | 53 (3.3%) | 145 (7.7%) |
| 75 Years and over | 196 (24.1%) | 204 (17.7%) |
Disability Class: Ambulatory Difficulty
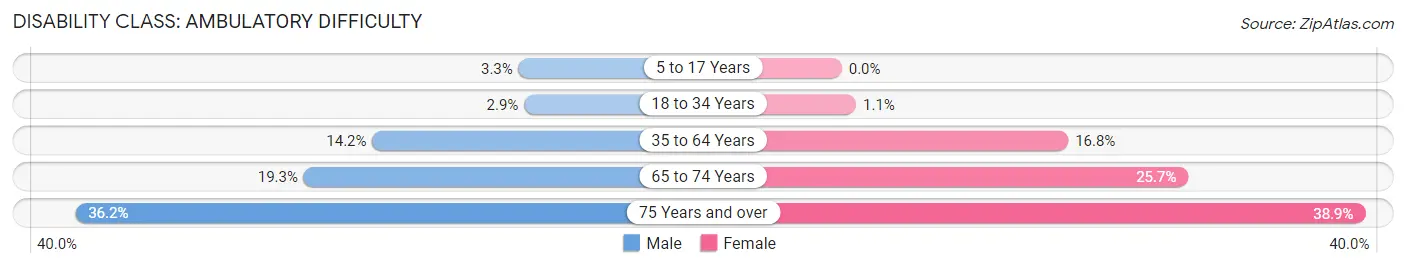
| Age Bracket | Male | Female |
| 5 to 17 Years | 95 (3.3%) | 0 (0.0%) |
| 18 to 34 Years | 97 (2.9%) | 34 (1.1%) |
| 35 to 64 Years | 879 (14.2%) | 1,073 (16.8%) |
| 65 to 74 Years | 312 (19.3%) | 484 (25.7%) |
| 75 Years and over | 295 (36.2%) | 449 (38.9%) |
Disability Class: Self-Care Difficulty
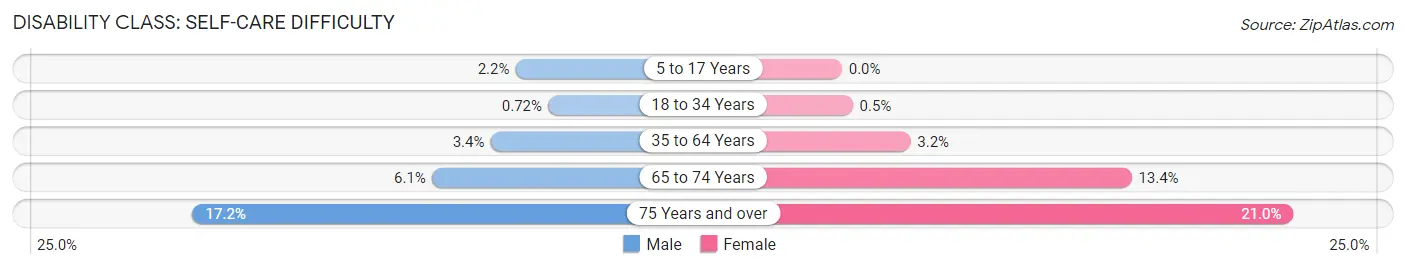
| Age Bracket | Male | Female |
| 5 to 17 Years | 64 (2.2%) | 0 (0.0%) |
| 18 to 34 Years | 24 (0.7%) | 16 (0.5%) |
| 35 to 64 Years | 210 (3.4%) | 203 (3.2%) |
| 65 to 74 Years | 99 (6.1%) | 253 (13.4%) |
| 75 Years and over | 140 (17.2%) | 242 (20.9%) |
Technology Access in Jackson County
Computing Device Access in Jackson County
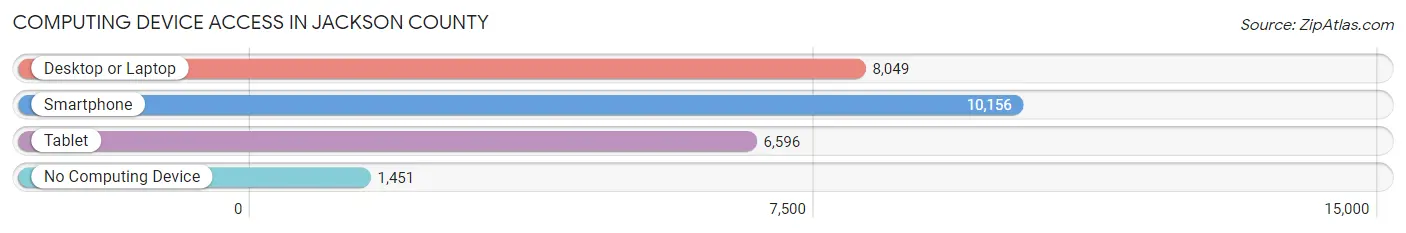
| Device Type | # Households | % Households |
| Desktop or Laptop | 8,049 | 64.6% |
| Smartphone | 10,156 | 81.6% |
| Tablet | 6,596 | 53.0% |
| No Computing Device | 1,451 | 11.7% |
| Total | 12,453 | 100.0% |
Internet Access in Jackson County
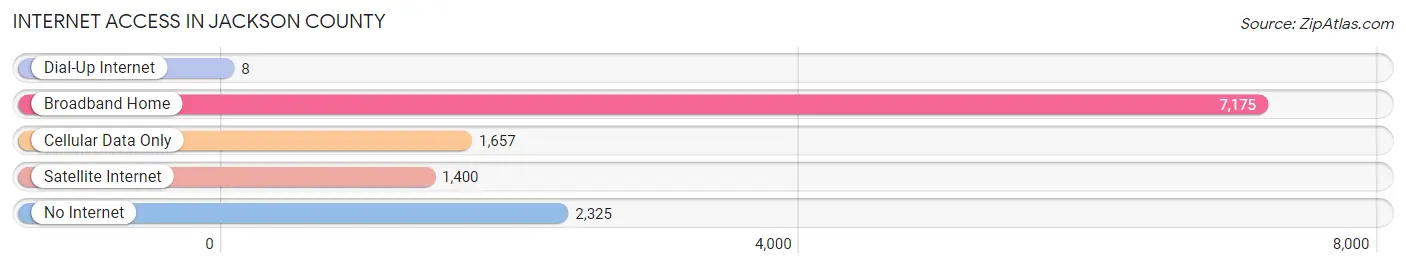
| Internet Type | # Households | % Households |
| Dial-Up Internet | 8 | 0.1% |
| Broadband Home | 7,175 | 57.6% |
| Cellular Data Only | 1,657 | 13.3% |
| Satellite Internet | 1,400 | 11.2% |
| No Internet | 2,325 | 18.7% |
| Total | 12,453 | 100.0% |
Jackson County Summary
Jackson County is located in the southeastern corner of Ohio, and is part of the Appalachian region. It is bordered by Vinton County to the north, Lawrence County to the east, and Scioto County to the south. The county seat is Jackson, and the county was named after Andrew Jackson, the seventh president of the United States.
Geography
Jackson County is located in the Appalachian Plateau region of Ohio, and is characterized by rolling hills and valleys. The county is mostly rural, with a few small towns and villages scattered throughout. The county is home to several state parks, including Lake Hope State Park, Tar Hollow State Park, and Zaleski State Forest. The county is also home to the Jackson County Fairgrounds, which hosts a variety of events throughout the year.
The county has a total area of 437 square miles, of which 434 square miles is land and 3 square miles is water. The highest point in the county is located at the intersection of State Route 327 and State Route 32, at an elevation of 1,541 feet. The county is drained by the Scioto River, which flows through the county from north to south.
Demographics
As of the 2010 census, Jackson County had a population of 33,225. The racial makeup of the county was 95.3% White, 2.2% African American, 0.3% Native American, 0.4% Asian, 0.2% from other races, and 1.6% from two or more races. Hispanic or Latino of any race were 0.7% of the population.
The median income for a household in the county was $37,945, and the median income for a family was $45,945. The per capita income for the county was $18,845. About 13.2% of families and 16.2% of the population were below the poverty line, including 22.2% of those under age 18 and 11.2% of those age 65 or over.
Economy
Jackson County is largely rural, and the economy is largely based on agriculture. The county is home to several large farms, and the county is a major producer of corn, soybeans, and wheat. The county is also home to several small businesses, including manufacturing, retail, and service industries.
The county is home to several large employers, including the Jackson County Board of Education, Jackson County Hospital, and the Jackson County Sheriff's Office. The county is also home to several small businesses, including restaurants, retail stores, and service providers.
The county is served by two major highways, State Route 32 and State Route 327. The county is also served by several smaller roads, including State Route 93, State Route 124, and State Route 775. The county is served by the Jackson County Airport, which is located in Jackson.
Conclusion
Jackson County is a rural county located in the Appalachian region of Ohio. The county is home to several state parks, and is a major producer of corn, soybeans, and wheat. The county is served by two major highways, and is home to several large employers, as well as small businesses. The county has a population of 33,225, and the median income for a household is $37,945. Jackson County is a great place to live and work, and offers a variety of activities and attractions for residents and visitors alike.
Common Questions
What is Per Capita Income in Jackson County?
Per Capita income in Jackson County is $28,570.
What is the Median Family Income in Jackson County?
Median Family Income in Jackson County is $69,172.
What is the Median Household income in Jackson County?
Median Household Income in Jackson County is $56,549.
What is Income or Wage Gap in Jackson County?
Income or Wage Gap in Jackson County is 33.5%.
Women in Jackson County earn 66.5 cents for every dollar earned by a man.
What is Family Income Deficit in Jackson County?
Family Income Deficit in Jackson County is $9,281.
Families that are below poverty line in Jackson County earn $9,281 less on average than the poverty threshold level.
What is Inequality or Gini Index in Jackson County?
Inequality or Gini Index in Jackson County is 0.46.
What is the Total Population of Jackson County?
Total Population of Jackson County is 32,563.
What is the Total Male Population of Jackson County?
Total Male Population of Jackson County is 16,059.
What is the Total Female Population of Jackson County?
Total Female Population of Jackson County is 16,504.
What is the Ratio of Males per 100 Females in Jackson County?
There are 97.30 Males per 100 Females in Jackson County.
What is the Ratio of Females per 100 Males in Jackson County?
There are 102.77 Females per 100 Males in Jackson County.
What is the Median Population Age in Jackson County?
Median Population Age in Jackson County is 40.1 Years.
What is the Average Family Size in Jackson County
Average Family Size in Jackson County is 3.0 People.
What is the Average Household Size in Jackson County
Average Household Size in Jackson County is 2.6 People.
How Large is the Labor Force in Jackson County?
There are 14,607 People in the Labor Forcein in Jackson County.
What is the Percentage of People in the Labor Force in Jackson County?
56.7% of People are in the Labor Force in Jackson County.
What is the Unemployment Rate in Jackson County?
Unemployment Rate in Jackson County is 5.9%.