Highland County, OH Map & Demographics
Highland County Map
Highland County Overview
$27,971
PER CAPITA INCOME
$70,651
AVG FAMILY INCOME
$60,522
AVG HOUSEHOLD INCOME
25.4%
WAGE / INCOME GAP [ % ]
74.6¢/ $1
WAGE / INCOME GAP [ $ ]
$9,416
FAMILY INCOME DEFICIT
0.40
INEQUALITY / GINI INDEX
43,285
TOTAL POPULATION
21,303
MALE POPULATION
21,982
FEMALE POPULATION
96.91
MALES / 100 FEMALES
103.19
FEMALES / 100 MALES
40.8
MEDIAN AGE
3.0
AVG FAMILY SIZE
2.6
AVG HOUSEHOLD SIZE
19,909
LABOR FORCE [ PEOPLE ]
58.3%
PERCENT IN LABOR FORCE
4.4%
UNEMPLOYMENT RATE
Highland County Area Codes
Income in Highland County
Income Overview in Highland County
Per Capita Income in Highland County is $27,971, while median incomes of families and households are $70,651 and $60,522 respectively.
| Characteristic | Number | Measure |
| Per Capita Income | 43,285 | $27,971 |
| Median Family Income | 11,604 | $70,651 |
| Mean Family Income | 11,604 | $82,781 |
| Median Household Income | 16,688 | $60,522 |
| Mean Household Income | 16,688 | $71,753 |
| Income Deficit | 11,604 | $9,416 |
| Wage / Income Gap (%) | 43,285 | 25.44% |
| Wage / Income Gap ($) | 43,285 | 74.56¢ per $1 |
| Gini / Inequality Index | 43,285 | 0.40 |
Earnings by Sex in Highland County
Average Earnings in Highland County are $37,063, $43,313 for men and $32,293 for women, a difference of 25.4%.
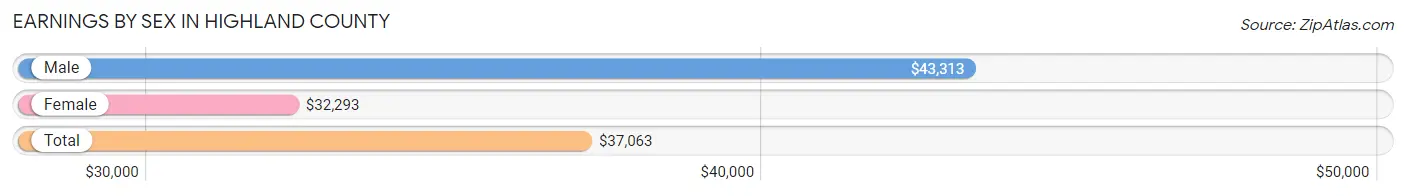
| Sex | Number | Average Earnings |
| Male | 10,939 (52.5%) | $43,313 |
| Female | 9,887 (47.5%) | $32,293 |
| Total | 20,826 (100.0%) | $37,063 |
Earnings by Sex by Income Bracket in Highland County
The most common earnings brackets in Highland County are $55,000 to $64,999 for men (1,367 | 12.5%) and $30,000 to $34,999 for women (939 | 9.5%).
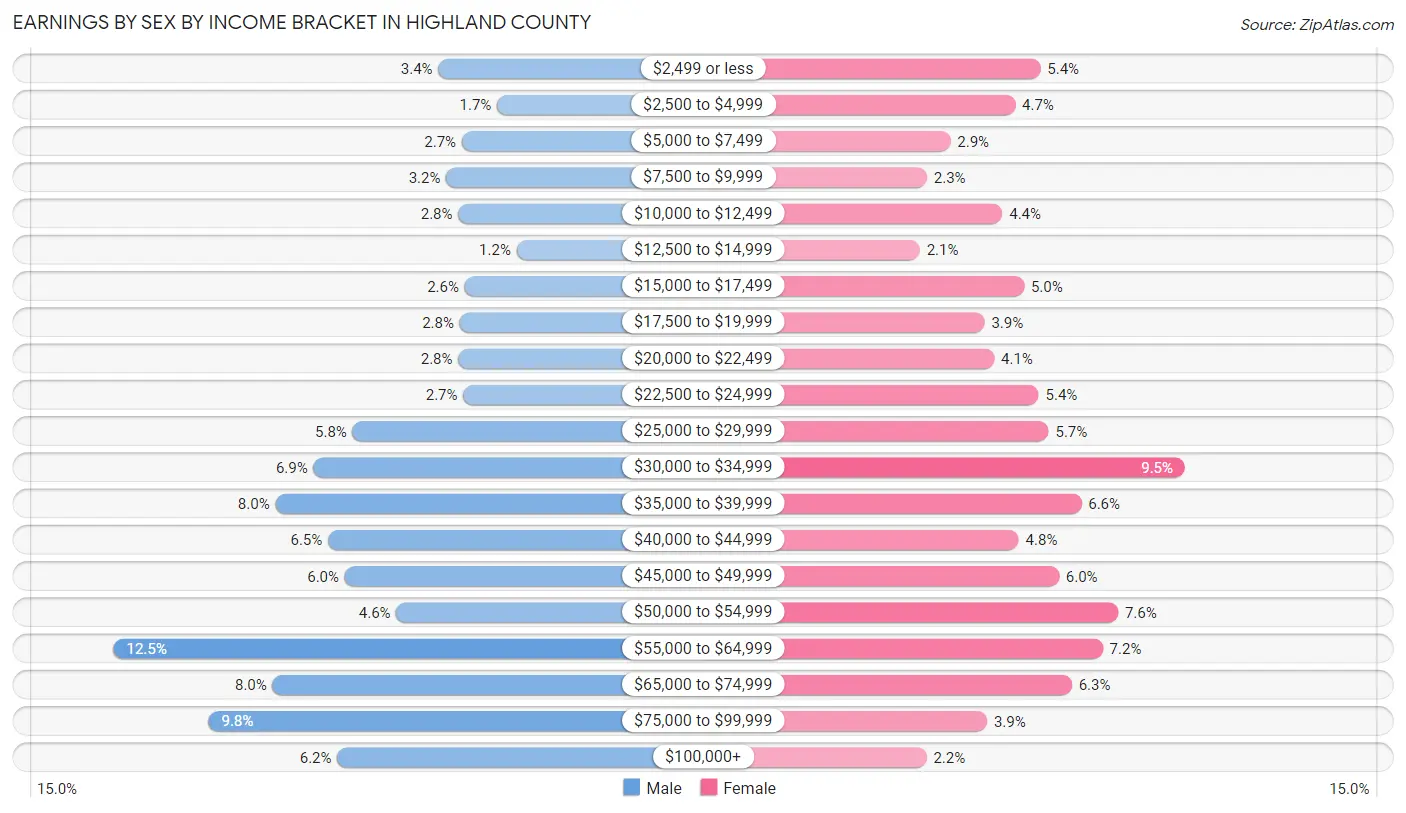
| Income | Male | Female |
| $2,499 or less | 369 (3.4%) | 538 (5.4%) |
| $2,500 to $4,999 | 188 (1.7%) | 468 (4.7%) |
| $5,000 to $7,499 | 296 (2.7%) | 288 (2.9%) |
| $7,500 to $9,999 | 345 (3.2%) | 222 (2.2%) |
| $10,000 to $12,499 | 307 (2.8%) | 432 (4.4%) |
| $12,500 to $14,999 | 128 (1.2%) | 203 (2.1%) |
| $15,000 to $17,499 | 288 (2.6%) | 492 (5.0%) |
| $17,500 to $19,999 | 303 (2.8%) | 383 (3.9%) |
| $20,000 to $22,499 | 307 (2.8%) | 409 (4.1%) |
| $22,500 to $24,999 | 292 (2.7%) | 533 (5.4%) |
| $25,000 to $29,999 | 632 (5.8%) | 561 (5.7%) |
| $30,000 to $34,999 | 753 (6.9%) | 939 (9.5%) |
| $35,000 to $39,999 | 870 (8.0%) | 652 (6.6%) |
| $40,000 to $44,999 | 708 (6.5%) | 478 (4.8%) |
| $45,000 to $49,999 | 656 (6.0%) | 589 (6.0%) |
| $50,000 to $54,999 | 498 (4.5%) | 753 (7.6%) |
| $55,000 to $64,999 | 1,367 (12.5%) | 711 (7.2%) |
| $65,000 to $74,999 | 878 (8.0%) | 625 (6.3%) |
| $75,000 to $99,999 | 1,075 (9.8%) | 390 (3.9%) |
| $100,000+ | 679 (6.2%) | 221 (2.2%) |
| Total | 10,939 (100.0%) | 9,887 (100.0%) |
Earnings by Sex by Educational Attainment in Highland County
Average earnings in Highland County are $47,326 for men and $35,608 for women, a difference of 24.8%. Men with an educational attainment of bachelor's degree enjoy the highest average annual earnings of $72,636, while those with less than high school education earn the least with $37,099. Women with an educational attainment of graduate degree earn the most with the average annual earnings of $66,429, while those with less than high school education have the smallest earnings of $23,685.
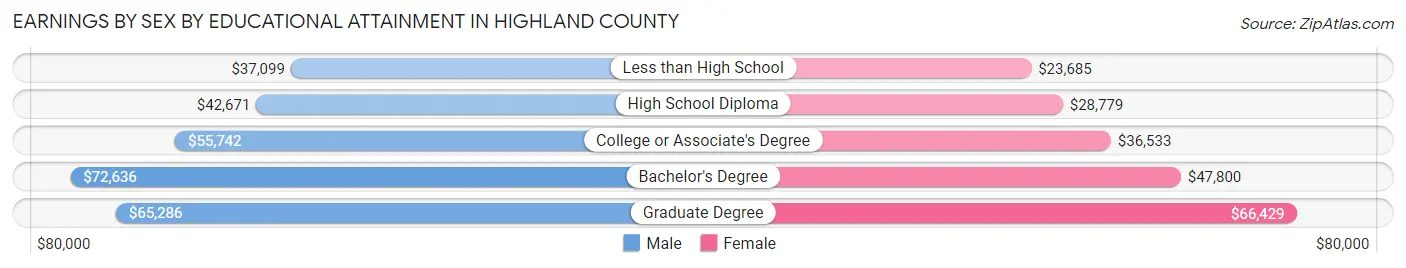
| Educational Attainment | Male Income | Female Income |
| Less than High School | $37,099 | $23,685 |
| High School Diploma | $42,671 | $28,779 |
| College or Associate's Degree | $55,742 | $36,533 |
| Bachelor's Degree | $72,636 | $47,800 |
| Graduate Degree | $65,286 | $66,429 |
| Total | $47,326 | $35,608 |
Family Income in Highland County
Family Income Brackets in Highland County
According to the Highland County family income data, there are 2,715 families falling into the $50,000 to $74,999 income range, which is the most common income bracket and makes up 23.4% of all families. Conversely, the $10,000 to $14,999 income bracket is the least frequent group with only 232 families (2.0%) belonging to this category.
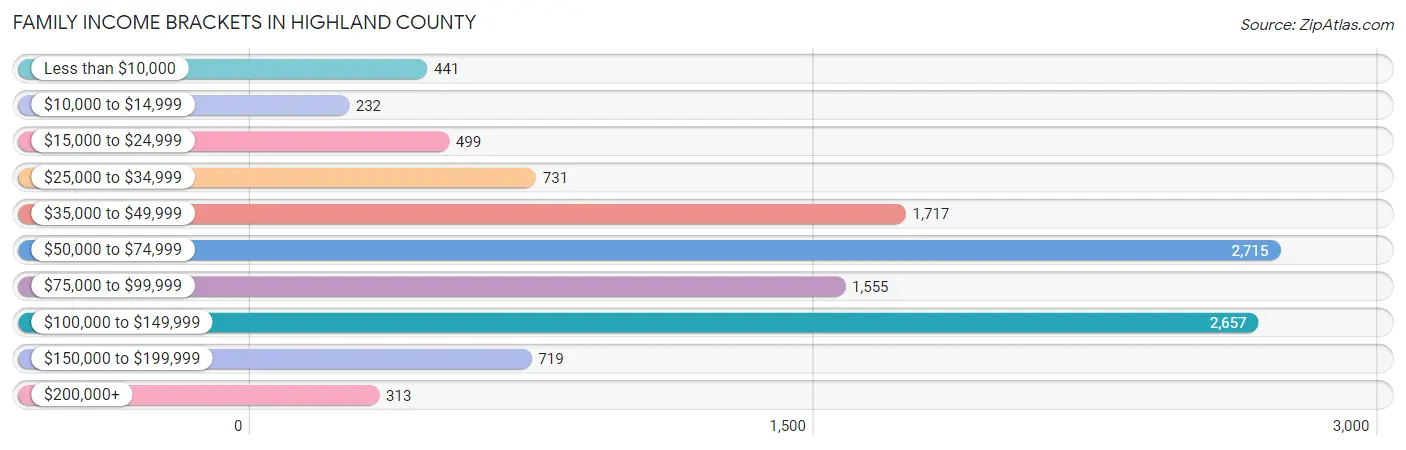
| Income Bracket | # Families | % Families |
| Less than $10,000 | 441 | 3.8% |
| $10,000 to $14,999 | 232 | 2.0% |
| $15,000 to $24,999 | 499 | 4.3% |
| $25,000 to $34,999 | 731 | 6.3% |
| $35,000 to $49,999 | 1,717 | 14.8% |
| $50,000 to $74,999 | 2,715 | 23.4% |
| $75,000 to $99,999 | 1,555 | 13.4% |
| $100,000 to $149,999 | 2,657 | 22.9% |
| $150,000 to $199,999 | 719 | 6.2% |
| $200,000+ | 313 | 2.7% |
Family Income by Famaliy Size in Highland County
7+ person families (259 | 2.2%) account for the highest median family income in Highland County with $111,563 per family, while 2-person families (5,659 | 48.8%) have the highest median income of $31,726 per family member.
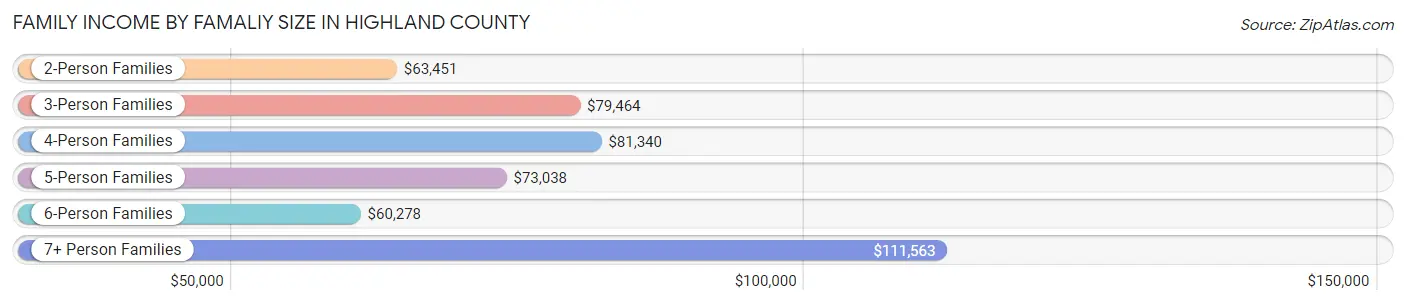
| Income Bracket | # Families | Median Income |
| 2-Person Families | 5,659 (48.8%) | $63,451 |
| 3-Person Families | 2,644 (22.8%) | $79,464 |
| 4-Person Families | 1,777 (15.3%) | $81,340 |
| 5-Person Families | 1,021 (8.8%) | $73,038 |
| 6-Person Families | 244 (2.1%) | $60,278 |
| 7+ Person Families | 259 (2.2%) | $111,563 |
| Total | 11,604 (100.0%) | $70,651 |
Family Income by Number of Earners in Highland County
The median family income in Highland County is $70,651, with families comprising 3+ earners (1,095) having the highest median family income of $138,274, while families with no earners (2,138) have the lowest median family income of $43,197, accounting for 9.4% and 18.4% of families, respectively.
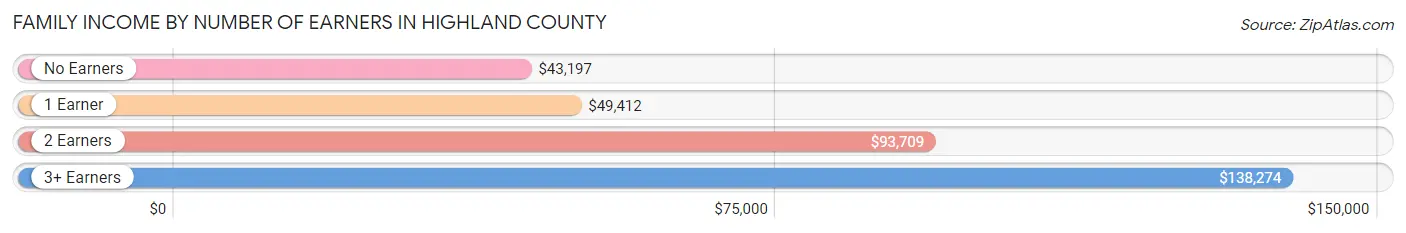
| Number of Earners | # Families | Median Income |
| No Earners | 2,138 (18.4%) | $43,197 |
| 1 Earner | 3,536 (30.5%) | $49,412 |
| 2 Earners | 4,835 (41.7%) | $93,709 |
| 3+ Earners | 1,095 (9.4%) | $138,274 |
| Total | 11,604 (100.0%) | $70,651 |
Household Income in Highland County
Household Income Brackets in Highland County
With 3,638 households falling in the category, the $50,000 to $74,999 income range is the most frequent in Highland County, accounting for 21.8% of all households. In contrast, only 334 households (2.0%) fall into the $200,000+ income bracket, making it the least populous group.
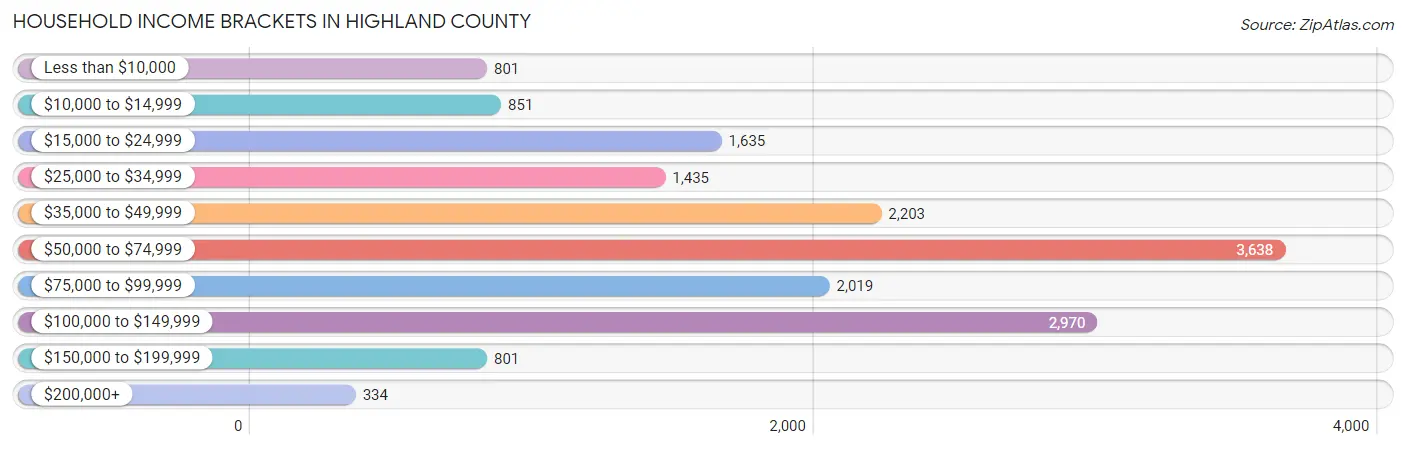
| Income Bracket | # Households | % Households |
| Less than $10,000 | 801 | 4.8% |
| $10,000 to $14,999 | 851 | 5.1% |
| $15,000 to $24,999 | 1,635 | 9.8% |
| $25,000 to $34,999 | 1,435 | 8.6% |
| $35,000 to $49,999 | 2,203 | 13.2% |
| $50,000 to $74,999 | 3,638 | 21.8% |
| $75,000 to $99,999 | 2,019 | 12.1% |
| $100,000 to $149,999 | 2,970 | 17.8% |
| $150,000 to $199,999 | 801 | 4.8% |
| $200,000+ | 334 | 2.0% |
Household Income by Householder Age in Highland County
The median household income in Highland County is $60,522, with the highest median household income of $72,723 found in the 25 to 44 years age bracket for the primary householder. A total of 4,579 households (27.4%) fall into this category. Meanwhile, the 65+ years age bracket for the primary householder has the lowest median household income of $41,833, with 5,066 households (30.4%) in this group.
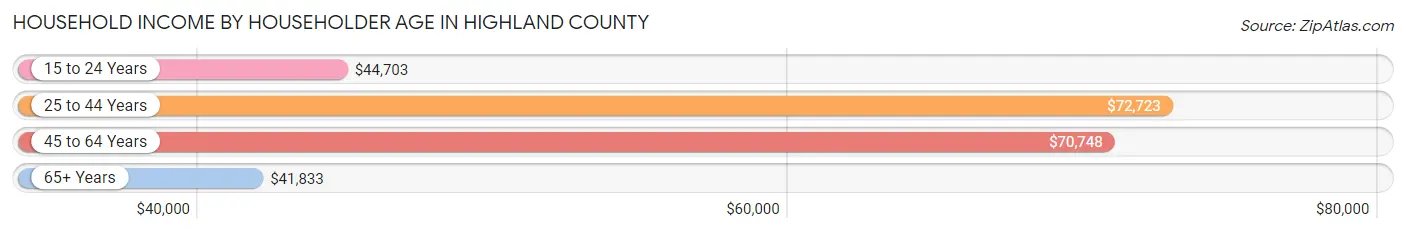
| Income Bracket | # Households | Median Income |
| 15 to 24 Years | 743 (4.4%) | $44,703 |
| 25 to 44 Years | 4,579 (27.4%) | $72,723 |
| 45 to 64 Years | 6,300 (37.8%) | $70,748 |
| 65+ Years | 5,066 (30.4%) | $41,833 |
| Total | 16,688 (100.0%) | $60,522 |
Poverty in Highland County
Income Below Poverty by Sex and Age in Highland County
With 13.0% poverty level for males and 16.6% for females among the residents of Highland County, 5 year old males and 18 to 24 year old females are the most vulnerable to poverty, with 76 males (36.4%) and 394 females (23.8%) in their respective age groups living below the poverty level.
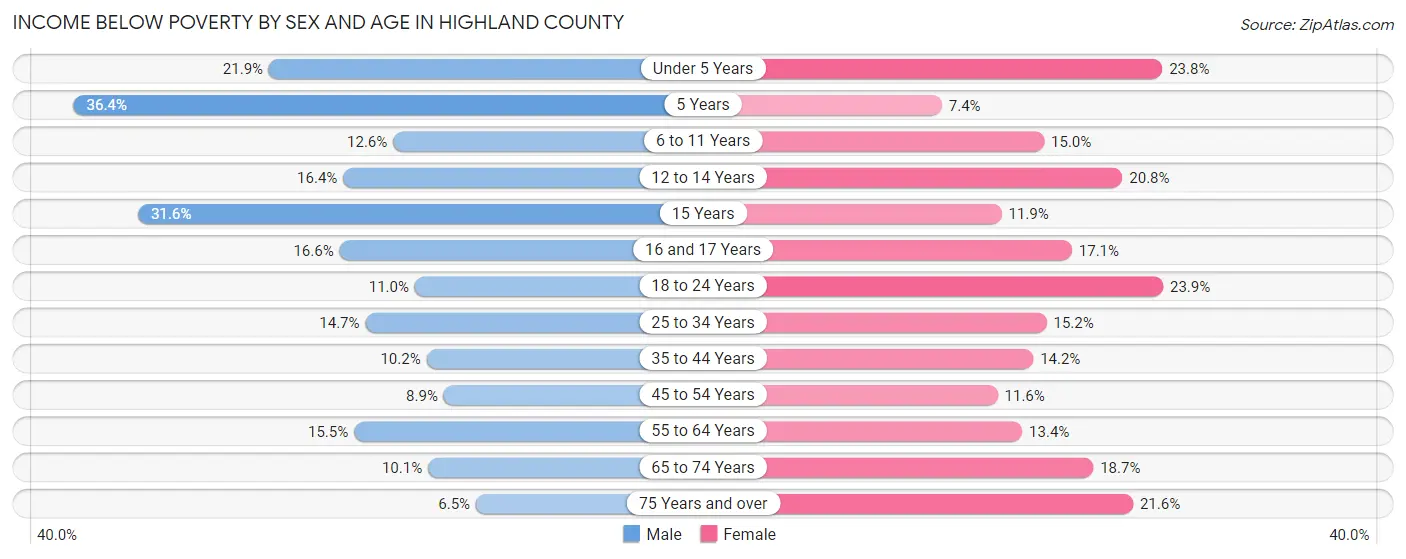
| Age Bracket | Male | Female |
| Under 5 Years | 294 (21.9%) | 305 (23.8%) |
| 5 Years | 76 (36.4%) | 13 (7.4%) |
| 6 to 11 Years | 244 (12.6%) | 244 (15.0%) |
| 12 to 14 Years | 120 (16.4%) | 221 (20.8%) |
| 15 Years | 90 (31.6%) | 46 (11.9%) |
| 16 and 17 Years | 109 (16.6%) | 90 (17.1%) |
| 18 to 24 Years | 190 (11.0%) | 394 (23.8%) |
| 25 to 34 Years | 352 (14.7%) | 362 (15.2%) |
| 35 to 44 Years | 262 (10.2%) | 364 (14.2%) |
| 45 to 54 Years | 249 (8.9%) | 318 (11.6%) |
| 55 to 64 Years | 450 (15.5%) | 414 (13.4%) |
| 65 to 74 Years | 221 (10.1%) | 447 (18.7%) |
| 75 Years and over | 85 (6.5%) | 382 (21.6%) |
| Total | 2,742 (13.0%) | 3,600 (16.6%) |
Income Above Poverty by Sex and Age in Highland County
According to the poverty statistics in Highland County, males aged 75 years and over and females aged 5 years are the age groups that are most secure financially, with 93.5% of males and 92.6% of females in these age groups living above the poverty line.
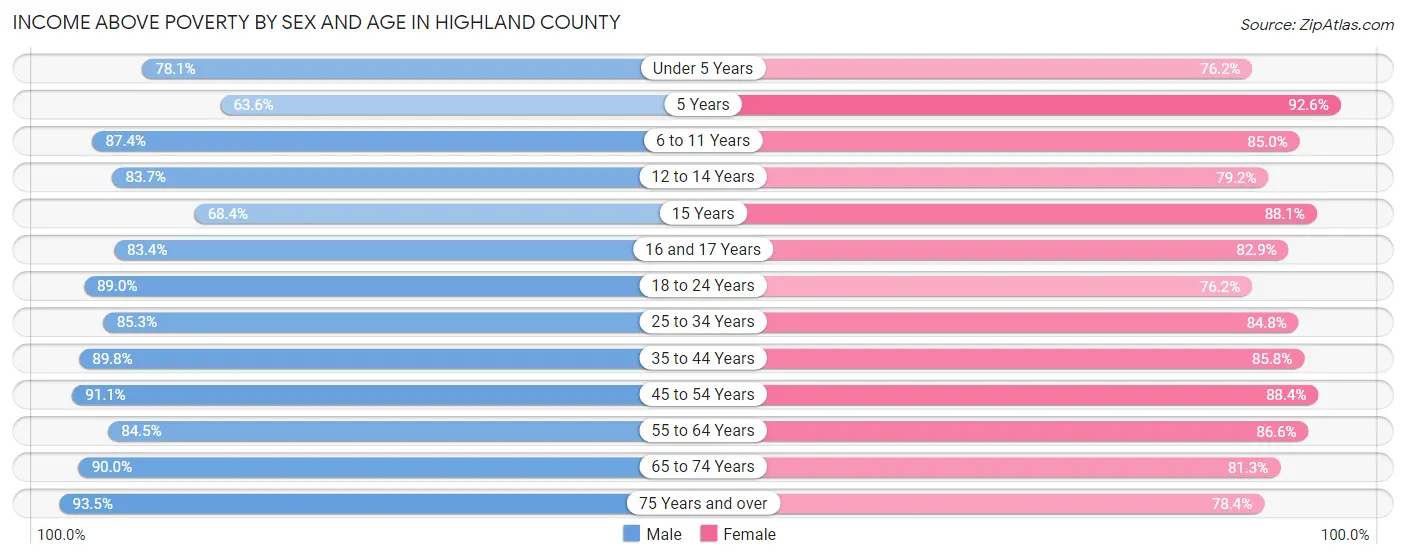
| Age Bracket | Male | Female |
| Under 5 Years | 1,051 (78.1%) | 977 (76.2%) |
| 5 Years | 133 (63.6%) | 162 (92.6%) |
| 6 to 11 Years | 1,686 (87.4%) | 1,380 (85.0%) |
| 12 to 14 Years | 614 (83.7%) | 840 (79.2%) |
| 15 Years | 195 (68.4%) | 342 (88.1%) |
| 16 and 17 Years | 547 (83.4%) | 437 (82.9%) |
| 18 to 24 Years | 1,532 (89.0%) | 1,258 (76.1%) |
| 25 to 34 Years | 2,042 (85.3%) | 2,019 (84.8%) |
| 35 to 44 Years | 2,316 (89.8%) | 2,197 (85.8%) |
| 45 to 54 Years | 2,554 (91.1%) | 2,430 (88.4%) |
| 55 to 64 Years | 2,446 (84.5%) | 2,677 (86.6%) |
| 65 to 74 Years | 1,978 (89.9%) | 1,947 (81.3%) |
| 75 Years and over | 1,224 (93.5%) | 1,385 (78.4%) |
| Total | 18,318 (87.0%) | 18,051 (83.4%) |
Income Below Poverty Among Married-Couple Families in Highland County
The poverty statistics for married-couple families in Highland County show that 5.9% or 519 of the total 8,815 families live below the poverty line. Families with 3 or 4 children have the highest poverty rate of 8.7%, comprising of 66 families. On the other hand, families with 5 or more children have the lowest poverty rate of 3.7%, which includes 6 families.
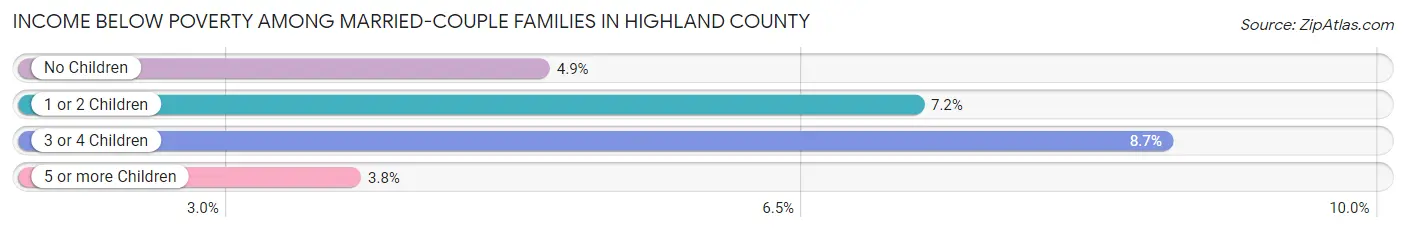
| Children | Above Poverty | Below Poverty |
| No Children | 5,006 (95.1%) | 258 (4.9%) |
| 1 or 2 Children | 2,443 (92.8%) | 189 (7.2%) |
| 3 or 4 Children | 693 (91.3%) | 66 (8.7%) |
| 5 or more Children | 154 (96.3%) | 6 (3.7%) |
| Total | 8,296 (94.1%) | 519 (5.9%) |
Income Below Poverty Among Single-Parent Households in Highland County
According to the poverty data in Highland County, 17.2% or 159 single-father households and 30.8% or 575 single-mother households are living below the poverty line. Among single-father households, those with 5 or more children have the highest poverty rate, with 20 households (62.5%) experiencing poverty. Likewise, among single-mother households, those with 1 or 2 children have the highest poverty rate, with 357 households (49.2%) falling below the poverty line.
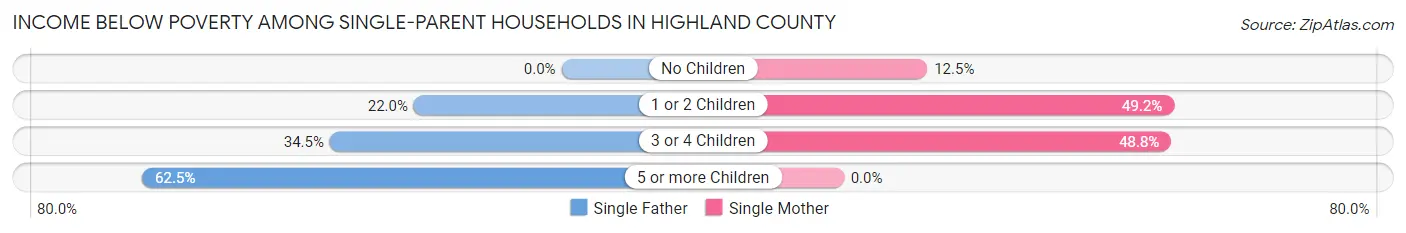
| Children | Single Father | Single Mother |
| No Children | 0 (0.0%) | 116 (12.4%) |
| 1 or 2 Children | 110 (22.0%) | 357 (49.2%) |
| 3 or 4 Children | 29 (34.5%) | 102 (48.8%) |
| 5 or more Children | 20 (62.5%) | 0 (0.0%) |
| Total | 159 (17.2%) | 575 (30.8%) |
Income Below Poverty Among Married-Couple vs Single-Parent Households in Highland County
The poverty data for Highland County shows that 519 of the married-couple family households (5.9%) and 734 of the single-parent households (26.3%) are living below the poverty level. Within the married-couple family households, those with 3 or 4 children have the highest poverty rate, with 66 households (8.7%) falling below the poverty line. Among the single-parent households, those with 5 or more children have the highest poverty rate, with 20 household (62.5%) living below poverty.
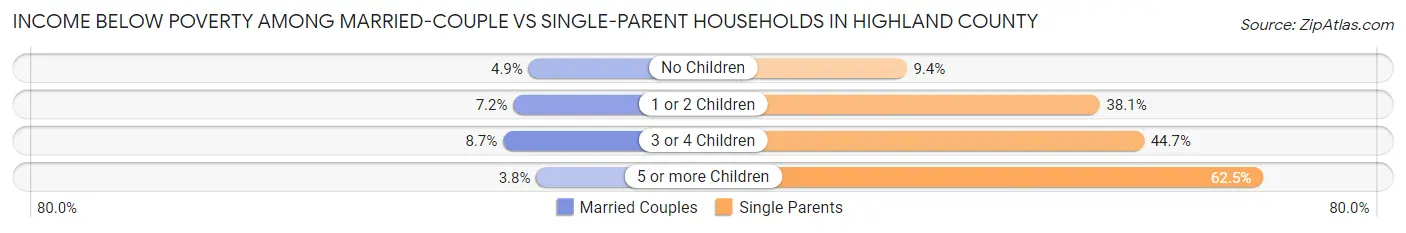
| Children | Married-Couple Families | Single-Parent Households |
| No Children | 258 (4.9%) | 116 (9.4%) |
| 1 or 2 Children | 189 (7.2%) | 467 (38.1%) |
| 3 or 4 Children | 66 (8.7%) | 131 (44.7%) |
| 5 or more Children | 6 (3.7%) | 20 (62.5%) |
| Total | 519 (5.9%) | 734 (26.3%) |
Race in Highland County
The most populous races in Highland County are White / Caucasian (41,206 | 95.2%), Two or more Races (1,091 | 2.5%), and Black / African American (740 | 1.7%).
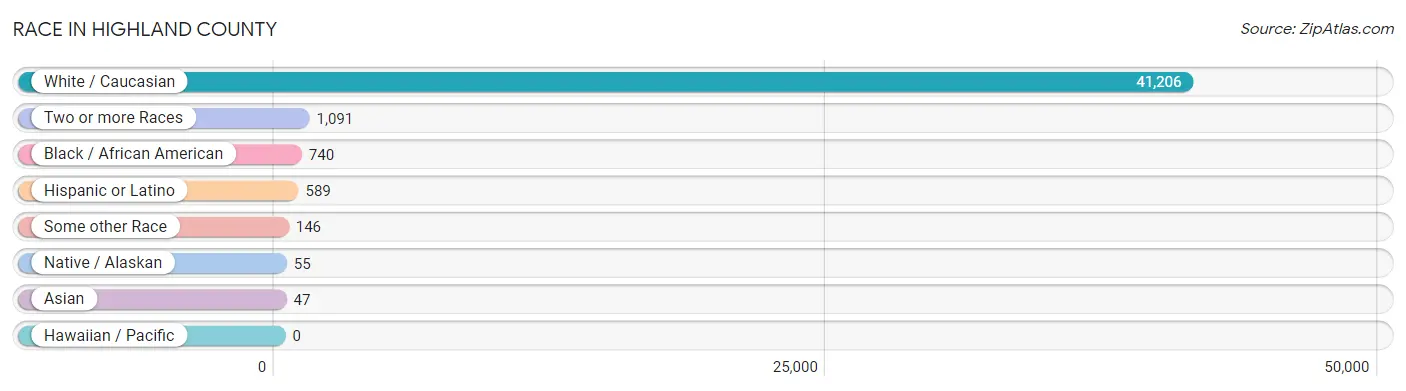
| Race | # Population | % Population |
| Asian | 47 | 0.1% |
| Black / African American | 740 | 1.7% |
| Hawaiian / Pacific | 0 | 0.0% |
| Hispanic or Latino | 589 | 1.4% |
| Native / Alaskan | 55 | 0.1% |
| White / Caucasian | 41,206 | 95.2% |
| Two or more Races | 1,091 | 2.5% |
| Some other Race | 146 | 0.3% |
| Total | 43,285 | 100.0% |
Ancestry in Highland County
The most populous ancestries reported in Highland County are German (7,579 | 17.5%), Irish (4,938 | 11.4%), American (4,885 | 11.3%), English (4,539 | 10.5%), and Scottish (761 | 1.8%), together accounting for 52.5% of all Highland County residents.
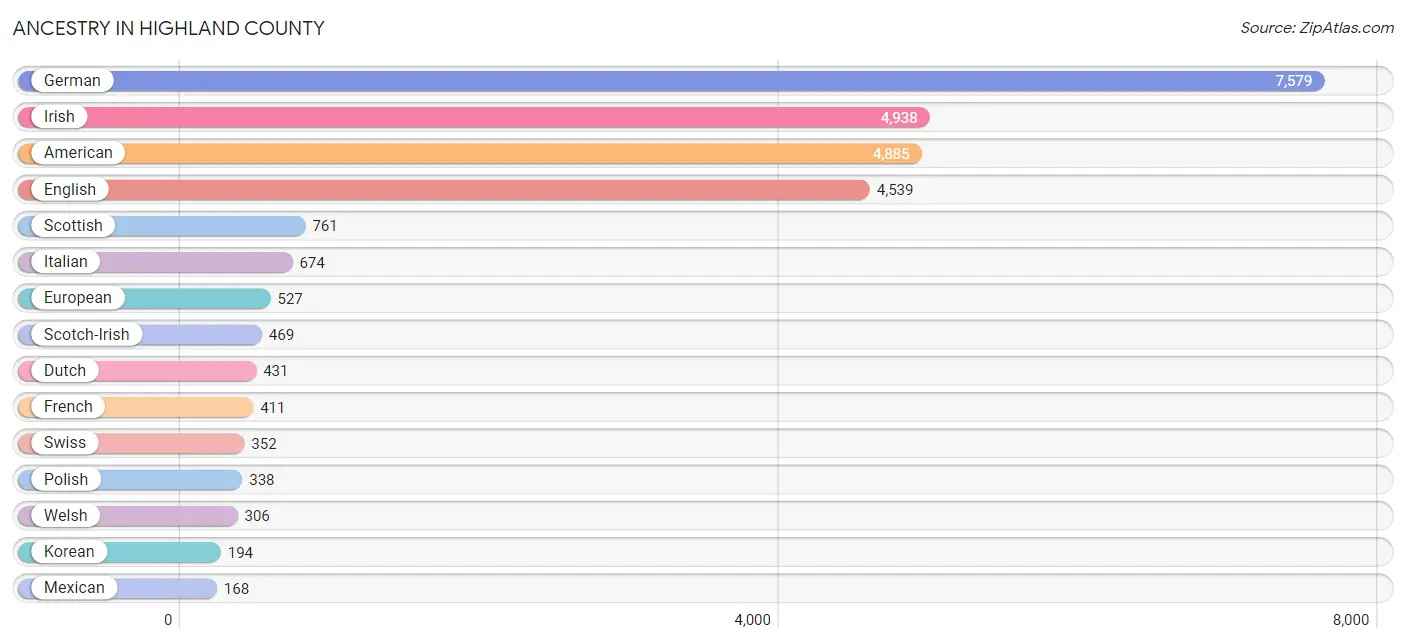
| Ancestry | # Population | % Population |
| African | 36 | 0.1% |
| Alsatian | 12 | 0.0% |
| American | 4,885 | 11.3% |
| Arab | 35 | 0.1% |
| Belgian | 16 | 0.0% |
| Blackfeet | 28 | 0.1% |
| British | 164 | 0.4% |
| Burmese | 5 | 0.0% |
| Canadian | 40 | 0.1% |
| Cherokee | 159 | 0.4% |
| Chippewa | 5 | 0.0% |
| Creek | 13 | 0.0% |
| Croatian | 61 | 0.1% |
| Crow | 24 | 0.1% |
| Cuban | 38 | 0.1% |
| Danish | 33 | 0.1% |
| Dutch | 431 | 1.0% |
| Eastern European | 82 | 0.2% |
| English | 4,539 | 10.5% |
| European | 527 | 1.2% |
| Finnish | 16 | 0.0% |
| French | 411 | 0.9% |
| French Canadian | 16 | 0.0% |
| German | 7,579 | 17.5% |
| Greek | 57 | 0.1% |
| Hungarian | 66 | 0.2% |
| Indian (Asian) | 53 | 0.1% |
| Irish | 4,938 | 11.4% |
| Iroquois | 3 | 0.0% |
| Italian | 674 | 1.6% |
| Japanese | 5 | 0.0% |
| Korean | 194 | 0.4% |
| Lebanese | 30 | 0.1% |
| Mexican | 168 | 0.4% |
| Navajo | 3 | 0.0% |
| Northern European | 25 | 0.1% |
| Norwegian | 69 | 0.2% |
| Pakistani | 10 | 0.0% |
| Pennsylvania German | 60 | 0.1% |
| Peruvian | 11 | 0.0% |
| Polish | 338 | 0.8% |
| Portuguese | 12 | 0.0% |
| Puerto Rican | 143 | 0.3% |
| Romanian | 35 | 0.1% |
| Russian | 67 | 0.2% |
| Samoan | 30 | 0.1% |
| Scandinavian | 48 | 0.1% |
| Scotch-Irish | 469 | 1.1% |
| Scottish | 761 | 1.8% |
| Sioux | 3 | 0.0% |
| Slavic | 7 | 0.0% |
| Slovak | 29 | 0.1% |
| Slovene | 5 | 0.0% |
| South American | 116 | 0.3% |
| Spanish | 7 | 0.0% |
| Subsaharan African | 36 | 0.1% |
| Swedish | 104 | 0.2% |
| Swiss | 352 | 0.8% |
| Syrian | 5 | 0.0% |
| Ukrainian | 17 | 0.0% |
| Venezuelan | 105 | 0.2% |
| Welsh | 306 | 0.7% | View All 62 Rows |
Immigrants in Highland County
The most numerous immigrant groups reported in Highland County came from Latin America (119 | 0.3%), South America (100 | 0.2%), Europe (91 | 0.2%), Venezuela (89 | 0.2%), and Asia (47 | 0.1%), together accounting for 1.0% of all Highland County residents.
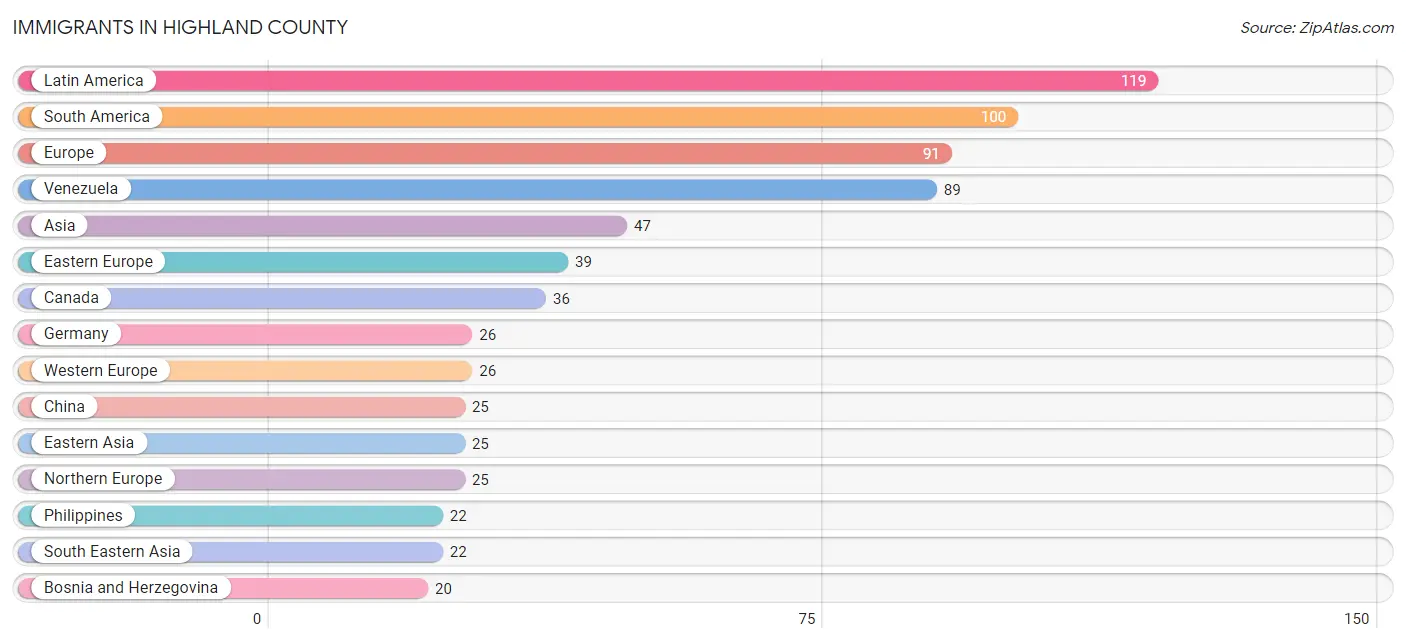
| Immigration Origin | # Population | % Population |
| Asia | 47 | 0.1% |
| Bosnia and Herzegovina | 20 | 0.1% |
| Canada | 36 | 0.1% |
| Central America | 19 | 0.0% |
| China | 25 | 0.1% |
| Croatia | 19 | 0.0% |
| Eastern Asia | 25 | 0.1% |
| Eastern Europe | 39 | 0.1% |
| Europe | 91 | 0.2% |
| Germany | 26 | 0.1% |
| Italy | 1 | 0.0% |
| Latin America | 119 | 0.3% |
| Mexico | 19 | 0.0% |
| Northern Europe | 25 | 0.1% |
| Peru | 11 | 0.0% |
| Philippines | 22 | 0.1% |
| Scotland | 16 | 0.0% |
| South America | 100 | 0.2% |
| South Eastern Asia | 22 | 0.1% |
| Southern Europe | 1 | 0.0% |
| Venezuela | 89 | 0.2% |
| Western Europe | 26 | 0.1% | View All 22 Rows |
Sex and Age in Highland County
Sex and Age in Highland County
The most populous age groups in Highland County are 60 to 64 Years (1,526 | 7.2%) for men and 60 to 64 Years (1,714 | 7.8%) for women.
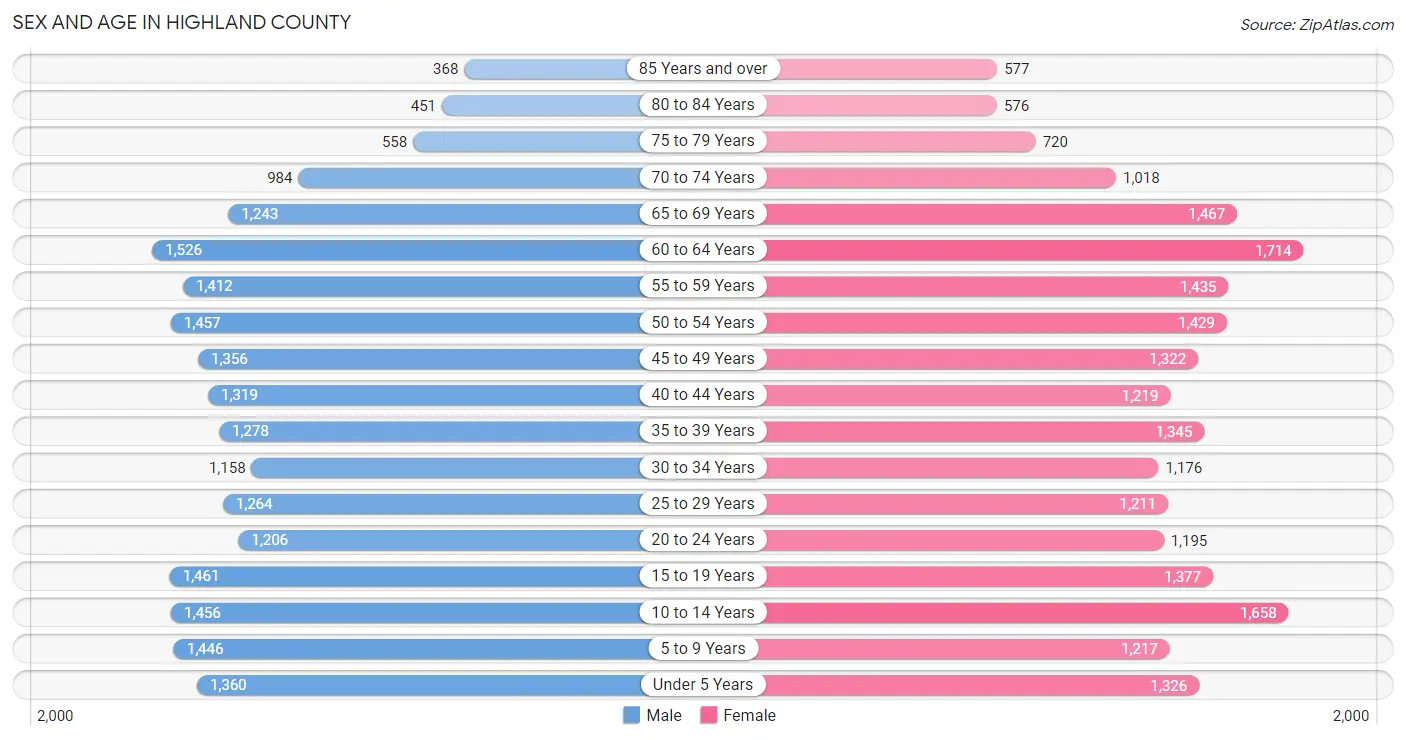
| Age Bracket | Male | Female |
| Under 5 Years | 1,360 (6.4%) | 1,326 (6.0%) |
| 5 to 9 Years | 1,446 (6.8%) | 1,217 (5.5%) |
| 10 to 14 Years | 1,456 (6.8%) | 1,658 (7.5%) |
| 15 to 19 Years | 1,461 (6.9%) | 1,377 (6.3%) |
| 20 to 24 Years | 1,206 (5.7%) | 1,195 (5.4%) |
| 25 to 29 Years | 1,264 (5.9%) | 1,211 (5.5%) |
| 30 to 34 Years | 1,158 (5.4%) | 1,176 (5.3%) |
| 35 to 39 Years | 1,278 (6.0%) | 1,345 (6.1%) |
| 40 to 44 Years | 1,319 (6.2%) | 1,219 (5.6%) |
| 45 to 49 Years | 1,356 (6.4%) | 1,322 (6.0%) |
| 50 to 54 Years | 1,457 (6.8%) | 1,429 (6.5%) |
| 55 to 59 Years | 1,412 (6.6%) | 1,435 (6.5%) |
| 60 to 64 Years | 1,526 (7.2%) | 1,714 (7.8%) |
| 65 to 69 Years | 1,243 (5.8%) | 1,467 (6.7%) |
| 70 to 74 Years | 984 (4.6%) | 1,018 (4.6%) |
| 75 to 79 Years | 558 (2.6%) | 720 (3.3%) |
| 80 to 84 Years | 451 (2.1%) | 576 (2.6%) |
| 85 Years and over | 368 (1.7%) | 577 (2.6%) |
| Total | 21,303 (100.0%) | 21,982 (100.0%) |
Families and Households in Highland County
Median Family Size in Highland County
The median family size in Highland County is 3.05 persons per family, with married-couple families (8,815 | 76.0%) accounting for the largest median family size of 3.13 persons per family. On the other hand, single male/father families (923 | 8.0%) represent the smallest median family size with 2.67 persons per family.
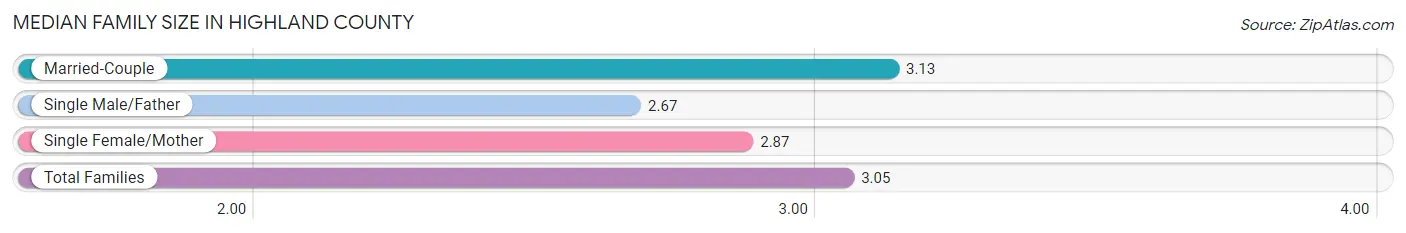
| Family Type | # Families | Family Size |
| Married-Couple | 8,815 (76.0%) | 3.13 |
| Single Male/Father | 923 (8.0%) | 2.67 |
| Single Female/Mother | 1,866 (16.1%) | 2.87 |
| Total Families | 11,604 (100.0%) | 3.05 |
Median Household Size in Highland County
The median household size in Highland County is 2.56 persons per household, with married-couple households (8,815 | 52.8%) accounting for the largest median household size of 3.16 persons per household. non-family households (5,084 | 30.5%) represent the smallest median household size with 1.21 persons per household.
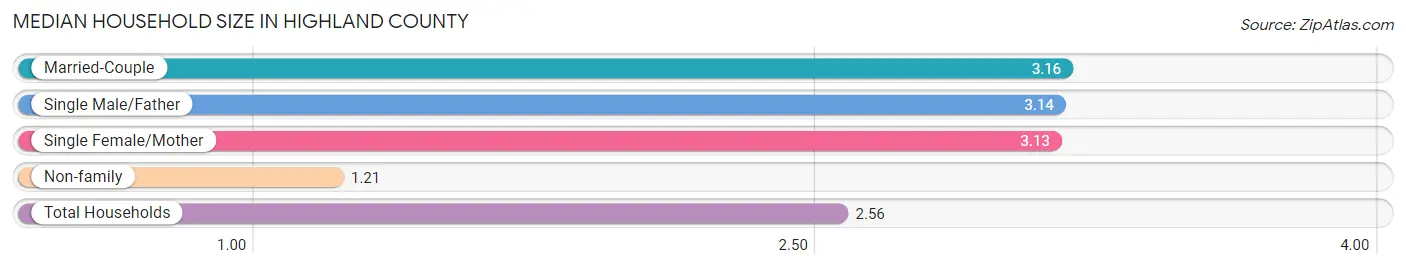
| Household Type | # Households | Household Size |
| Married-Couple | 8,815 (52.8%) | 3.16 |
| Single Male/Father | 923 (5.5%) | 3.14 |
| Single Female/Mother | 1,866 (11.2%) | 3.13 |
| Non-family | 5,084 (30.5%) | 1.21 |
| Total Households | 16,688 (100.0%) | 2.56 |
Household Size by Marriage Status in Highland County
Out of a total of 16,688 households in Highland County, 11,604 (69.5%) are family households, while 5,084 (30.5%) are nonfamily households. The most numerous type of family households are 2-person households, comprising 5,240, and the most common type of nonfamily households are 1-person households, comprising 4,099.
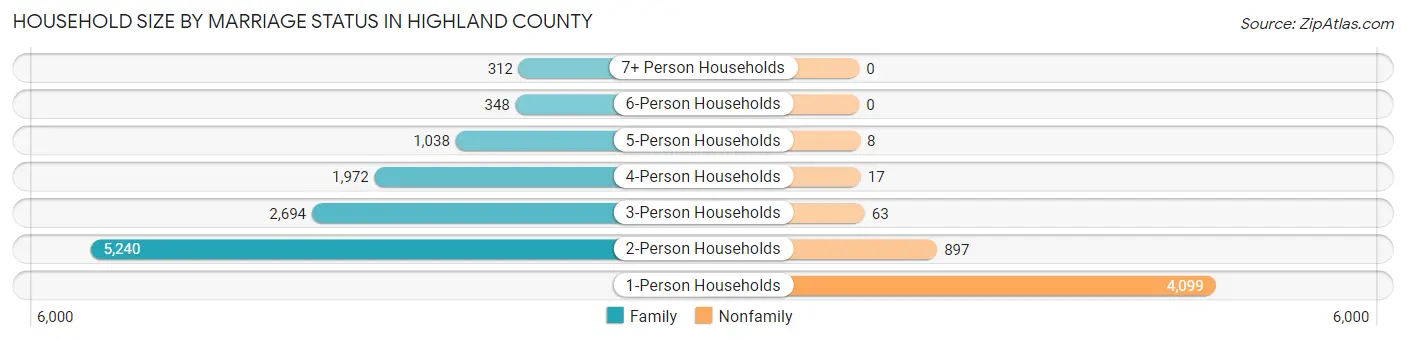
| Household Size | Family Households | Nonfamily Households |
| 1-Person Households | - | 4,099 (24.6%) |
| 2-Person Households | 5,240 (31.4%) | 897 (5.4%) |
| 3-Person Households | 2,694 (16.1%) | 63 (0.4%) |
| 4-Person Households | 1,972 (11.8%) | 17 (0.1%) |
| 5-Person Households | 1,038 (6.2%) | 8 (0.1%) |
| 6-Person Households | 348 (2.1%) | 0 (0.0%) |
| 7+ Person Households | 312 (1.9%) | 0 (0.0%) |
| Total | 11,604 (69.5%) | 5,084 (30.5%) |
Female Fertility in Highland County
Fertility by Age in Highland County
Average fertility rate in Highland County is 77.0 births per 1,000 women. Women in the age bracket of 20 to 34 years have the highest fertility rate with 164.0 births per 1,000 women. Women in the age bracket of 20 to 34 years acount for 82.4% of all women with births.
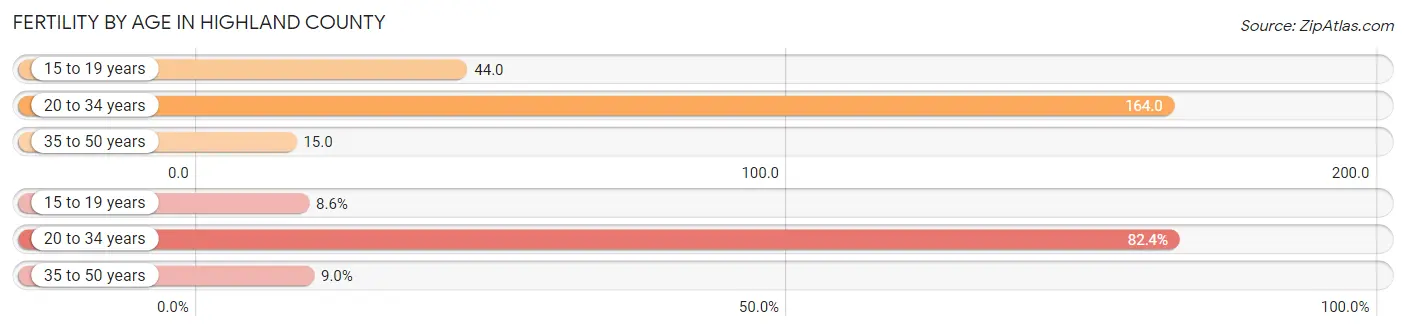
| Age Bracket | Women with Births | Births / 1,000 Women |
| 15 to 19 years | 61 (8.6%) | 44.0 |
| 20 to 34 years | 587 (82.4%) | 164.0 |
| 35 to 50 years | 64 (9.0%) | 15.0 |
| Total | 712 (100.0%) | 77.0 |
Fertility by Age by Marriage Status in Highland County
56.6% of women with births (712) in Highland County are married. The highest percentage of unmarried women with births falls into 15 to 19 years age bracket with 100.0% of them unmarried at the time of birth, while the lowest percentage of unmarried women with births belong to 35 to 50 years age bracket with 20.3% of them unmarried.
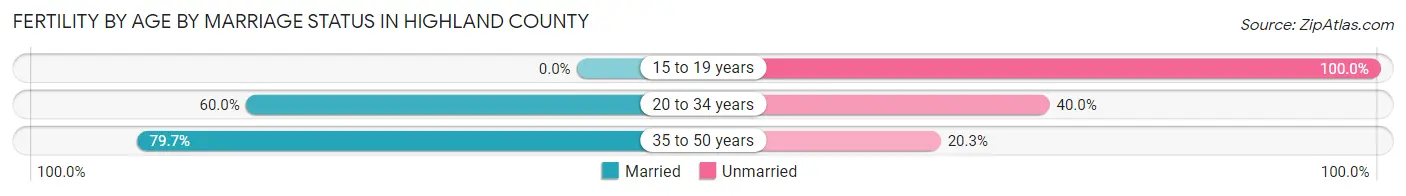
| Age Bracket | Married | Unmarried |
| 15 to 19 years | 0 (0.0%) | 61 (100.0%) |
| 20 to 34 years | 352 (60.0%) | 235 (40.0%) |
| 35 to 50 years | 51 (79.7%) | 13 (20.3%) |
| Total | 403 (56.6%) | 309 (43.4%) |
Fertility by Education in Highland County
Average fertility rate in Highland County is 77.0 births per 1,000 women. Women with the education attainment of less than high school have the highest fertility rate of 127.0 births per 1,000 women, while women with the education attainment of bachelor's degree have the lowest fertility at 11.0 births per 1,000 women. Women with the education attainment of less than high school represent 39.5% of all women with births.
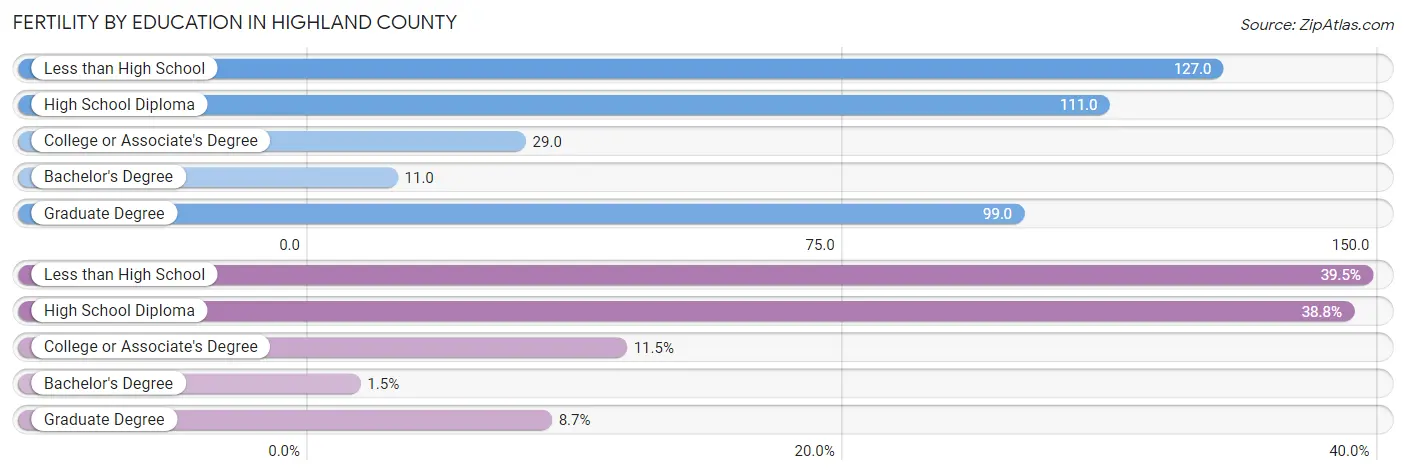
| Educational Attainment | Women with Births | Births / 1,000 Women |
| Less than High School | 281 (39.5%) | 127.0 |
| High School Diploma | 276 (38.8%) | 111.0 |
| College or Associate's Degree | 82 (11.5%) | 29.0 |
| Bachelor's Degree | 11 (1.5%) | 11.0 |
| Graduate Degree | 62 (8.7%) | 99.0 |
| Total | 712 (100.0%) | 77.0 |
Fertility by Education by Marriage Status in Highland County
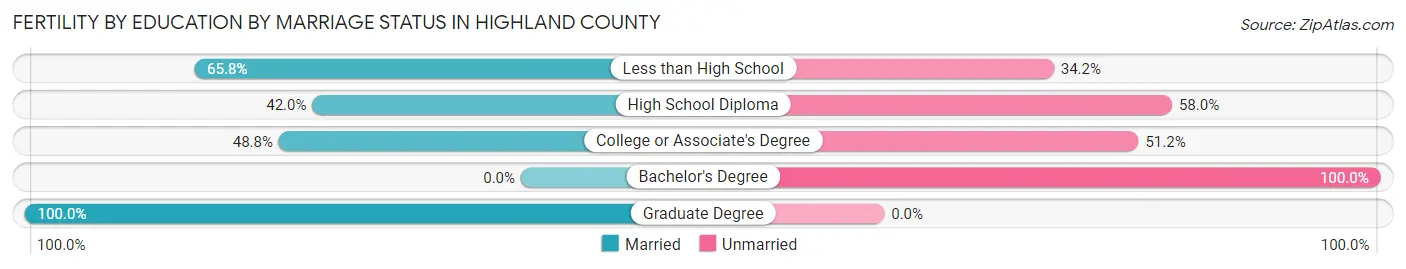
43.4% of women with births in Highland County are unmarried. Women with the educational attainment of graduate degree are most likely to be married with 100.0% of them married at childbirth, while women with the educational attainment of bachelor's degree are least likely to be married with 100.0% of them unmarried at childbirth.
| Educational Attainment | Married | Unmarried |
| Less than High School | 185 (65.8%) | 96 (34.2%) |
| High School Diploma | 116 (42.0%) | 160 (58.0%) |
| College or Associate's Degree | 40 (48.8%) | 42 (51.2%) |
| Bachelor's Degree | 0 (0.0%) | 11 (100.0%) |
| Graduate Degree | 62 (100.0%) | 0 (0.0%) |
| Total | 403 (56.6%) | 309 (43.4%) |
Employment Characteristics in Highland County
Employment by Class of Employer in Highland County
Among the 18,581 employed individuals in Highland County, private company employees (13,072 | 70.4%), not-for-profit organizations (1,563 | 8.4%), and local government employees (1,506 | 8.1%) make up the most common classes of employment.
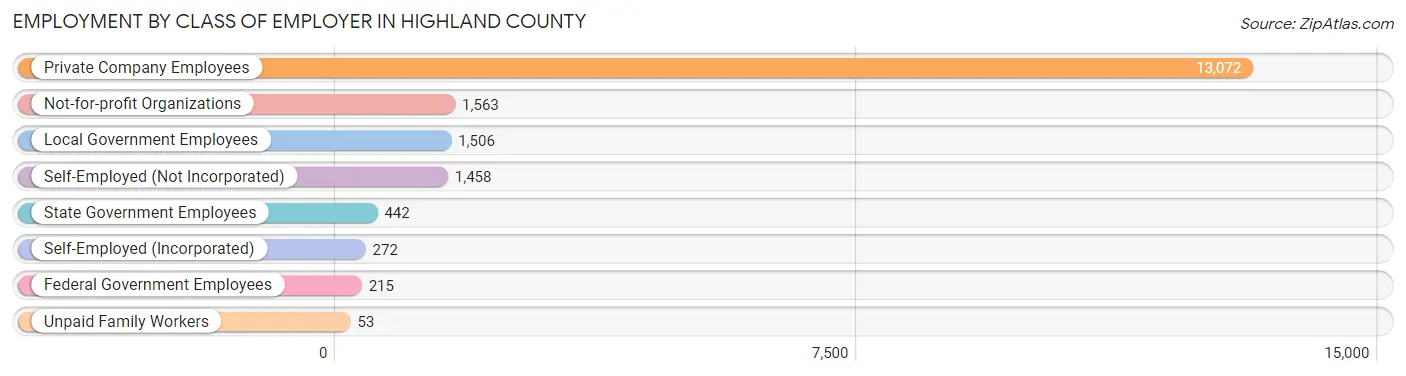
| Employer Class | # Employees | % Employees |
| Private Company Employees | 13,072 | 70.4% |
| Self-Employed (Incorporated) | 272 | 1.5% |
| Self-Employed (Not Incorporated) | 1,458 | 7.9% |
| Not-for-profit Organizations | 1,563 | 8.4% |
| Local Government Employees | 1,506 | 8.1% |
| State Government Employees | 442 | 2.4% |
| Federal Government Employees | 215 | 1.2% |
| Unpaid Family Workers | 53 | 0.3% |
| Total | 18,581 | 100.0% |
Employment Status by Age in Highland County
According to the labor force statistics for Highland County, out of the total population over 16 years of age (34,149), 58.3% or 19,909 individuals are in the labor force, with 4.4% or 876 of them unemployed. The age group with the highest labor force participation rate is 30 to 34 years, with 85.0% or 1,984 individuals in the labor force. Within the labor force, the 16 to 19 years age range has the highest percentage of unemployed individuals, with 20.2% or 194 of them being unemployed.
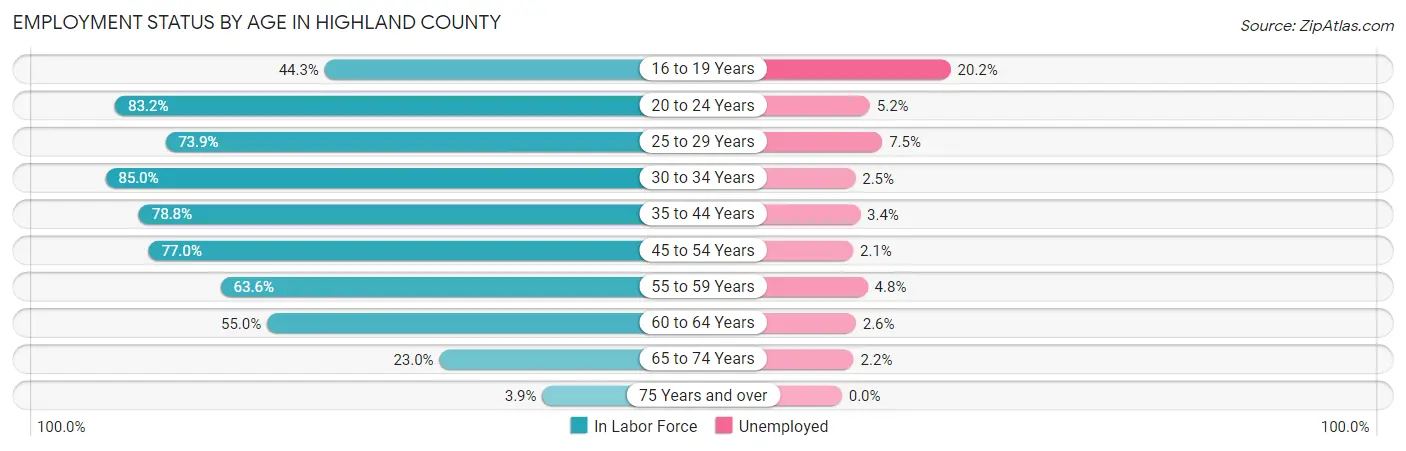
| Age Bracket | In Labor Force | Unemployed |
| 16 to 19 Years | 959 (44.3%) | 194 (20.2%) |
| 20 to 24 Years | 1,998 (83.2%) | 104 (5.2%) |
| 25 to 29 Years | 1,829 (73.9%) | 137 (7.5%) |
| 30 to 34 Years | 1,984 (85.0%) | 50 (2.5%) |
| 35 to 44 Years | 4,067 (78.8%) | 138 (3.4%) |
| 45 to 54 Years | 4,284 (77.0%) | 90 (2.1%) |
| 55 to 59 Years | 1,811 (63.6%) | 87 (4.8%) |
| 60 to 64 Years | 1,782 (55.0%) | 46 (2.6%) |
| 65 to 74 Years | 1,084 (23.0%) | 24 (2.2%) |
| 75 Years and over | 127 (3.9%) | 0 (0.0%) |
| Total | 19,909 (58.3%) | 876 (4.4%) |
Employment Status by Educational Attainment in Highland County
According to labor force statistics for Highland County, 72.9% of individuals (15,762) out of the total population between 25 and 64 years of age (21,621) are in the labor force, with 3.5% or 552 of them being unemployed. The group with the highest labor force participation rate are those with the educational attainment of bachelor's degree or higher, with 88.9% or 3,113 individuals in the labor force. Within the labor force, individuals with less than high school education have the highest percentage of unemployment, with 3.8% or 52 of them being unemployed.
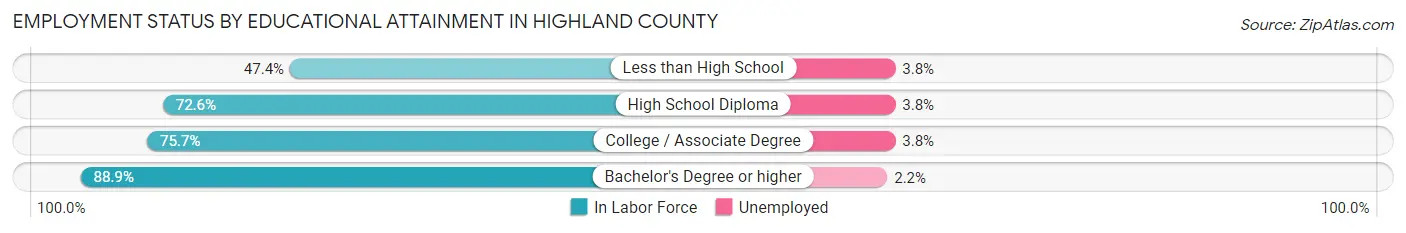
| Educational Attainment | In Labor Force | Unemployed |
| Less than High School | 1,361 (47.4%) | 109 (3.8%) |
| High School Diploma | 6,354 (72.6%) | 333 (3.8%) |
| College / Associate Degree | 4,917 (75.7%) | 247 (3.8%) |
| Bachelor's Degree or higher | 3,113 (88.9%) | 77 (2.2%) |
| Total | 15,762 (72.9%) | 757 (3.5%) |
Employment Occupations by Sex in Highland County
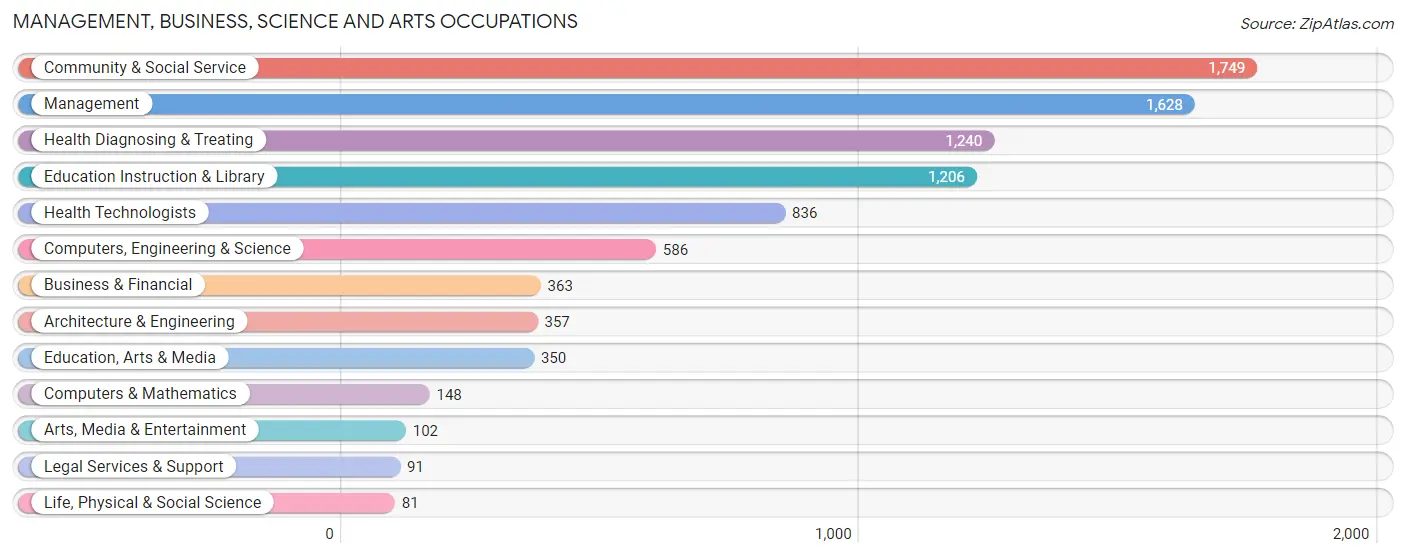
Management, Business, Science and Arts Occupations
The most common Management, Business, Science and Arts occupations in Highland County are Community & Social Service (1,749 | 9.2%), Management (1,628 | 8.6%), Health Diagnosing & Treating (1,240 | 6.5%), Education Instruction & Library (1,206 | 6.3%), and Health Technologists (836 | 4.4%).
Management, Business, Science and Arts Occupations by Sex
Within the Management, Business, Science and Arts occupations in Highland County, the most male-oriented occupations are Architecture & Engineering (100.0%), Computers, Engineering & Science (83.1%), and Arts, Media & Entertainment (72.6%), while the most female-oriented occupations are Health Technologists (90.7%), Health Diagnosing & Treating (89.1%), and Business & Financial (82.4%).
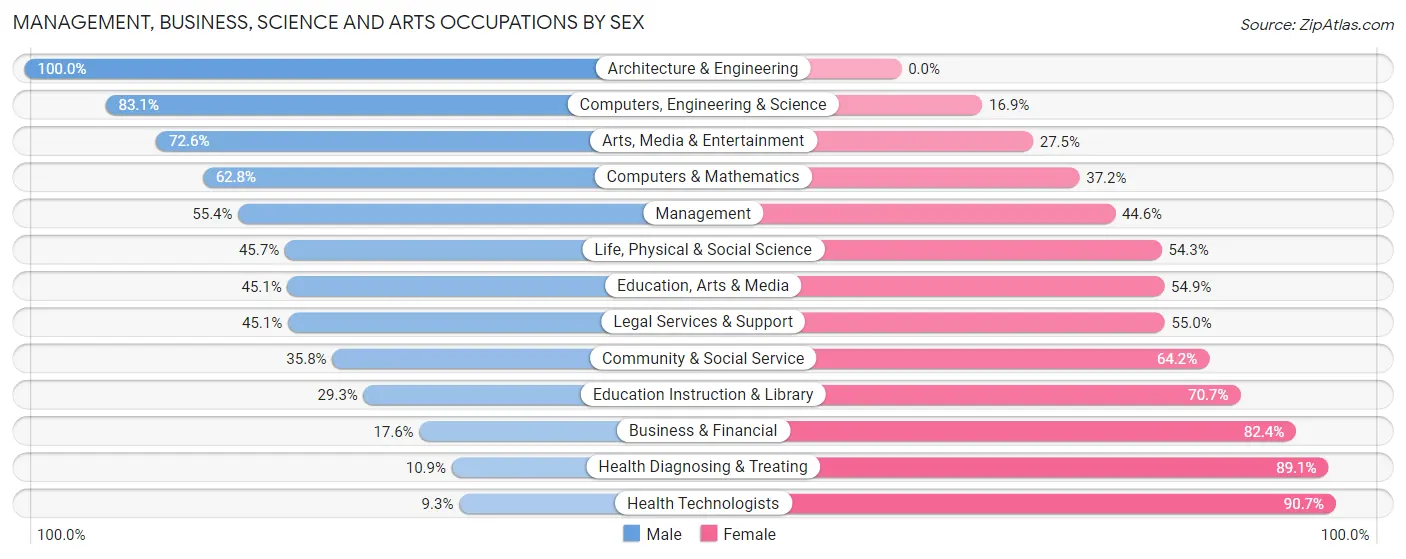
| Occupation | Male | Female |
| Management | 902 (55.4%) | 726 (44.6%) |
| Business & Financial | 64 (17.6%) | 299 (82.4%) |
| Computers, Engineering & Science | 487 (83.1%) | 99 (16.9%) |
| Computers & Mathematics | 93 (62.8%) | 55 (37.2%) |
| Architecture & Engineering | 357 (100.0%) | 0 (0.0%) |
| Life, Physical & Social Science | 37 (45.7%) | 44 (54.3%) |
| Community & Social Service | 626 (35.8%) | 1,123 (64.2%) |
| Education, Arts & Media | 158 (45.1%) | 192 (54.9%) |
| Legal Services & Support | 41 (45.1%) | 50 (54.9%) |
| Education Instruction & Library | 353 (29.3%) | 853 (70.7%) |
| Arts, Media & Entertainment | 74 (72.6%) | 28 (27.5%) |
| Health Diagnosing & Treating | 135 (10.9%) | 1,105 (89.1%) |
| Health Technologists | 78 (9.3%) | 758 (90.7%) |
| Total (Category) | 2,214 (39.8%) | 3,352 (60.2%) |
| Total (Overall) | 10,041 (52.7%) | 9,004 (47.3%) |
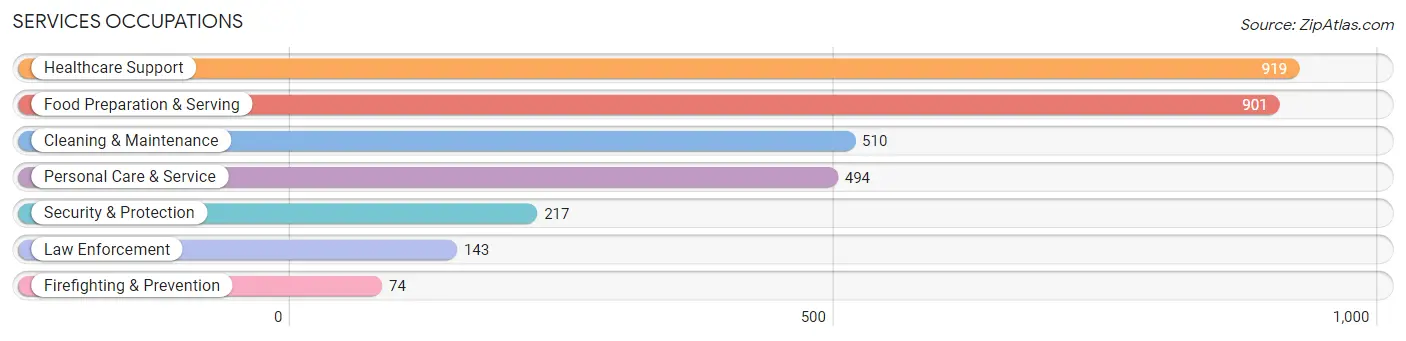
Services Occupations
The most common Services occupations in Highland County are Healthcare Support (919 | 4.8%), Food Preparation & Serving (901 | 4.7%), Cleaning & Maintenance (510 | 2.7%), Personal Care & Service (494 | 2.6%), and Security & Protection (217 | 1.1%).
Services Occupations by Sex
Within the Services occupations in Highland County, the most male-oriented occupations are Firefighting & Prevention (100.0%), Security & Protection (75.1%), and Cleaning & Maintenance (63.5%), while the most female-oriented occupations are Healthcare Support (88.5%), Food Preparation & Serving (68.5%), and Personal Care & Service (63.2%).
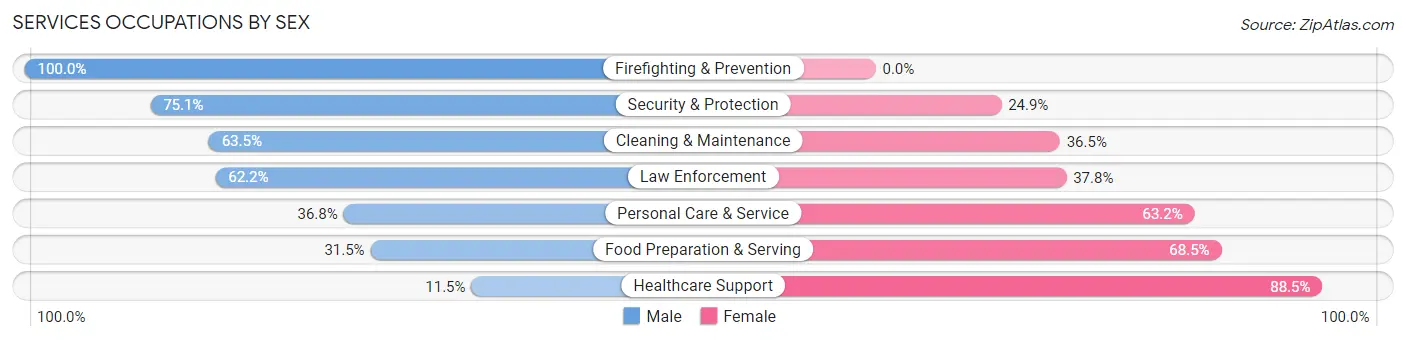
| Occupation | Male | Female |
| Healthcare Support | 106 (11.5%) | 813 (88.5%) |
| Security & Protection | 163 (75.1%) | 54 (24.9%) |
| Firefighting & Prevention | 74 (100.0%) | 0 (0.0%) |
| Law Enforcement | 89 (62.2%) | 54 (37.8%) |
| Food Preparation & Serving | 284 (31.5%) | 617 (68.5%) |
| Cleaning & Maintenance | 324 (63.5%) | 186 (36.5%) |
| Personal Care & Service | 182 (36.8%) | 312 (63.2%) |
| Total (Category) | 1,059 (34.8%) | 1,982 (65.2%) |
| Total (Overall) | 10,041 (52.7%) | 9,004 (47.3%) |
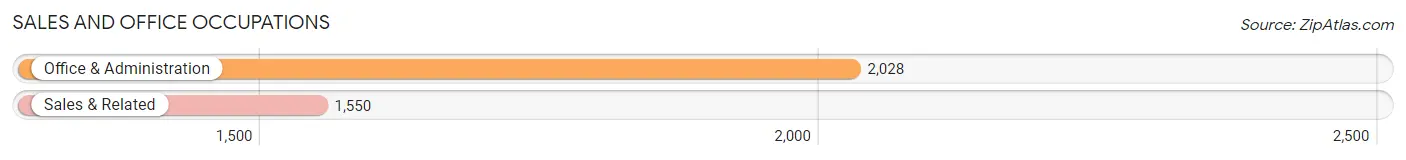
Sales and Office Occupations
The most common Sales and Office occupations in Highland County are Office & Administration (2,028 | 10.6%), and Sales & Related (1,550 | 8.1%).
Sales and Office Occupations by Sex
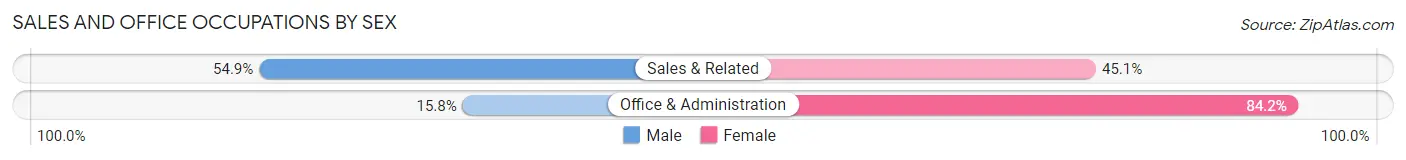
| Occupation | Male | Female |
| Sales & Related | 851 (54.9%) | 699 (45.1%) |
| Office & Administration | 320 (15.8%) | 1,708 (84.2%) |
| Total (Category) | 1,171 (32.7%) | 2,407 (67.3%) |
| Total (Overall) | 10,041 (52.7%) | 9,004 (47.3%) |
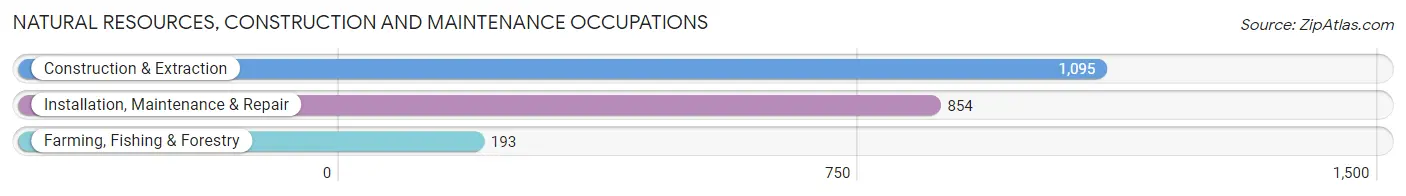
Natural Resources, Construction and Maintenance Occupations
The most common Natural Resources, Construction and Maintenance occupations in Highland County are Construction & Extraction (1,095 | 5.8%), Installation, Maintenance & Repair (854 | 4.5%), and Farming, Fishing & Forestry (193 | 1.0%).
Natural Resources, Construction and Maintenance Occupations by Sex
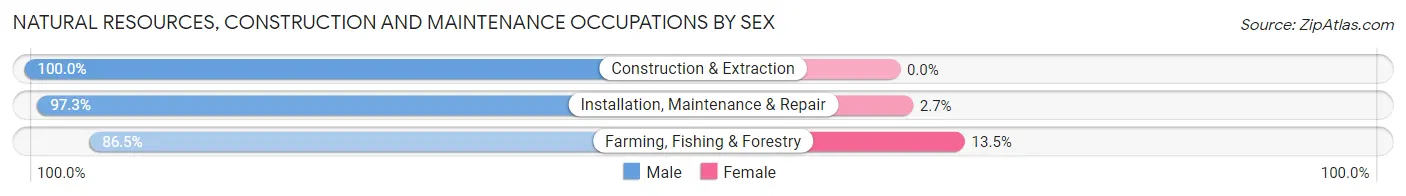
| Occupation | Male | Female |
| Farming, Fishing & Forestry | 167 (86.5%) | 26 (13.5%) |
| Construction & Extraction | 1,095 (100.0%) | 0 (0.0%) |
| Installation, Maintenance & Repair | 831 (97.3%) | 23 (2.7%) |
| Total (Category) | 2,093 (97.7%) | 49 (2.3%) |
| Total (Overall) | 10,041 (52.7%) | 9,004 (47.3%) |
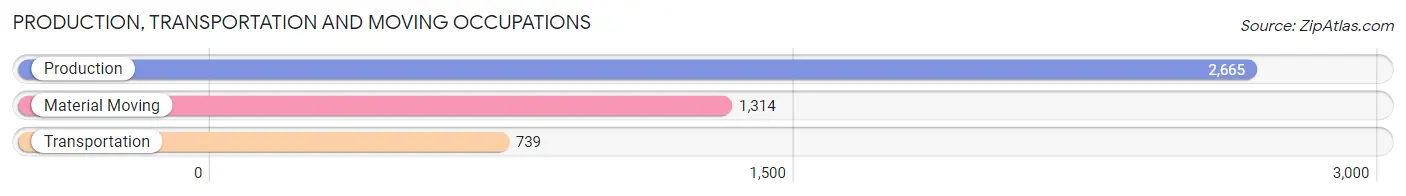
Production, Transportation and Moving Occupations
The most common Production, Transportation and Moving occupations in Highland County are Production (2,665 | 14.0%), Material Moving (1,314 | 6.9%), and Transportation (739 | 3.9%).
Production, Transportation and Moving Occupations by Sex
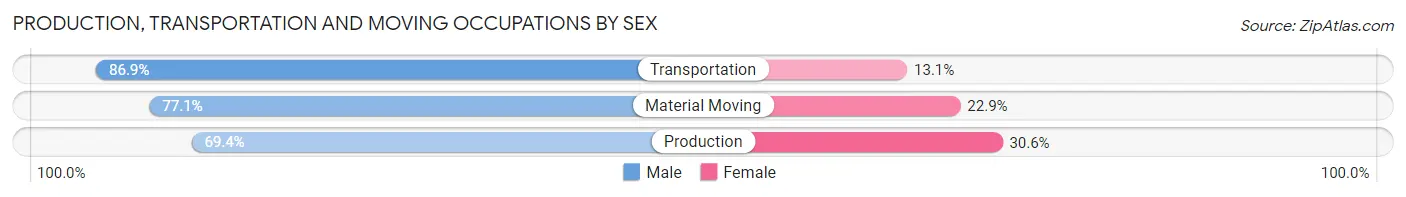
| Occupation | Male | Female |
| Production | 1,849 (69.4%) | 816 (30.6%) |
| Transportation | 642 (86.9%) | 97 (13.1%) |
| Material Moving | 1,013 (77.1%) | 301 (22.9%) |
| Total (Category) | 3,504 (74.3%) | 1,214 (25.7%) |
| Total (Overall) | 10,041 (52.7%) | 9,004 (47.3%) |
Employment Industries by Sex in Highland County
Employment Industries in Highland County
The major employment industries in Highland County include Manufacturing (3,774 | 19.8%), Health Care & Social Assistance (3,412 | 17.9%), Retail Trade (2,168 | 11.4%), Educational Services (1,556 | 8.2%), and Construction (1,435 | 7.5%).
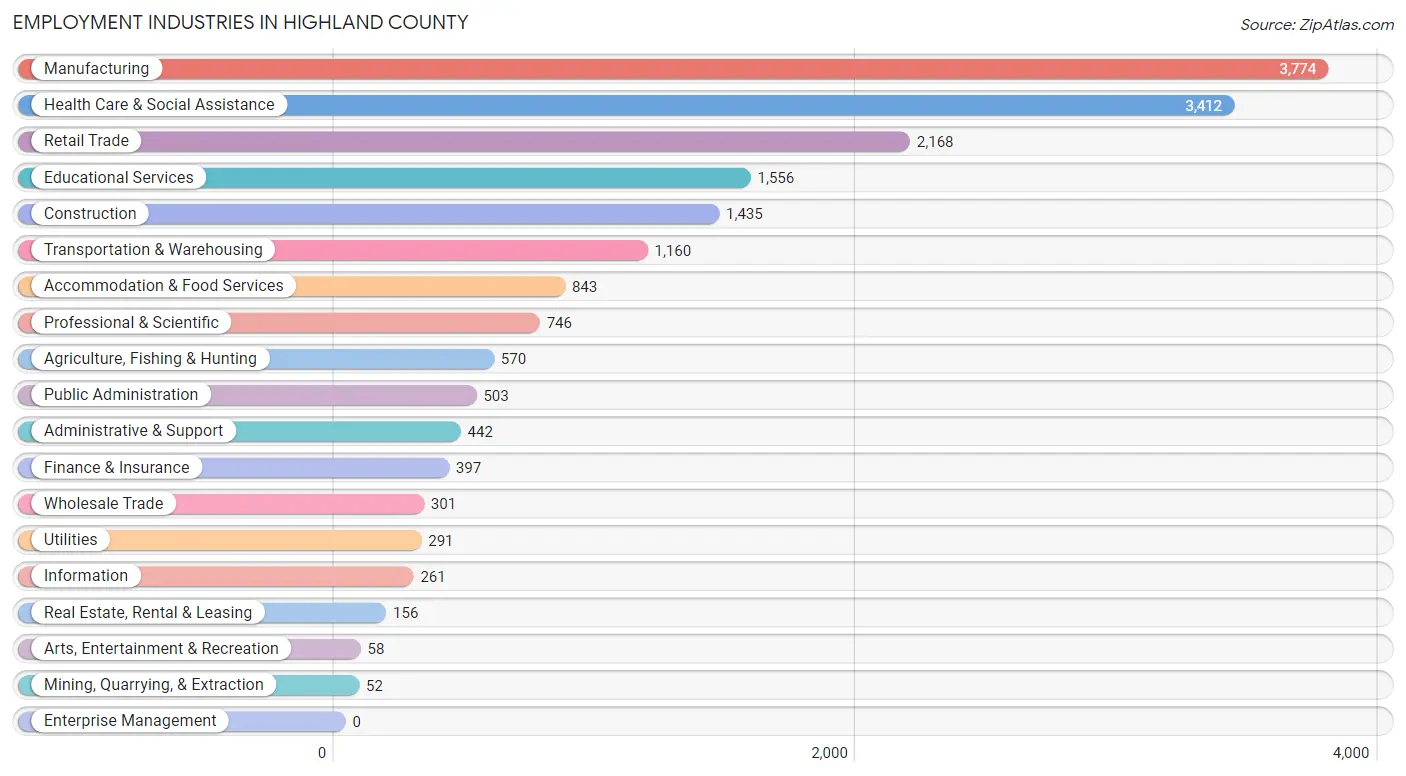
Employment Industries by Sex in Highland County
The Highland County industries that see more men than women are Mining, Quarrying, & Extraction (100.0%), Construction (92.5%), and Agriculture, Fishing & Hunting (87.4%), whereas the industries that tend to have a higher number of women are Health Care & Social Assistance (87.0%), Accommodation & Food Services (68.1%), and Educational Services (67.9%).
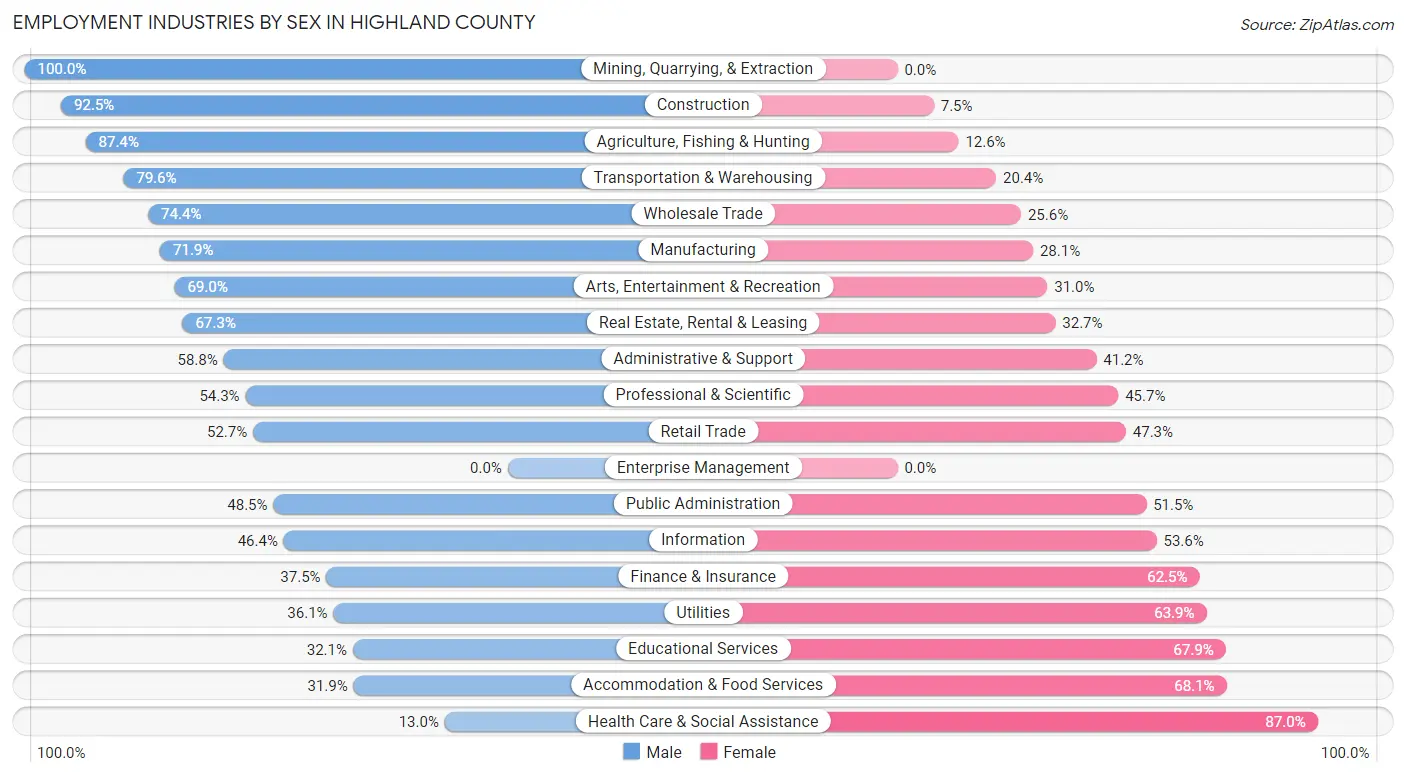
| Industry | Male | Female |
| Agriculture, Fishing & Hunting | 498 (87.4%) | 72 (12.6%) |
| Mining, Quarrying, & Extraction | 52 (100.0%) | 0 (0.0%) |
| Construction | 1,327 (92.5%) | 108 (7.5%) |
| Manufacturing | 2,715 (71.9%) | 1,059 (28.1%) |
| Wholesale Trade | 224 (74.4%) | 77 (25.6%) |
| Retail Trade | 1,143 (52.7%) | 1,025 (47.3%) |
| Transportation & Warehousing | 923 (79.6%) | 237 (20.4%) |
| Utilities | 105 (36.1%) | 186 (63.9%) |
| Information | 121 (46.4%) | 140 (53.6%) |
| Finance & Insurance | 149 (37.5%) | 248 (62.5%) |
| Real Estate, Rental & Leasing | 105 (67.3%) | 51 (32.7%) |
| Professional & Scientific | 405 (54.3%) | 341 (45.7%) |
| Enterprise Management | 0 (0.0%) | 0 (0.0%) |
| Administrative & Support | 260 (58.8%) | 182 (41.2%) |
| Educational Services | 499 (32.1%) | 1,057 (67.9%) |
| Health Care & Social Assistance | 445 (13.0%) | 2,967 (87.0%) |
| Arts, Entertainment & Recreation | 40 (69.0%) | 18 (31.0%) |
| Accommodation & Food Services | 269 (31.9%) | 574 (68.1%) |
| Public Administration | 244 (48.5%) | 259 (51.5%) |
| Total | 10,041 (52.7%) | 9,004 (47.3%) |
Education in Highland County
School Enrollment in Highland County
The most common levels of schooling among the 8,984 students in Highland County are middle school (2,468 | 27.5%), elementary school (2,313 | 25.8%), and high school (2,098 | 23.4%).
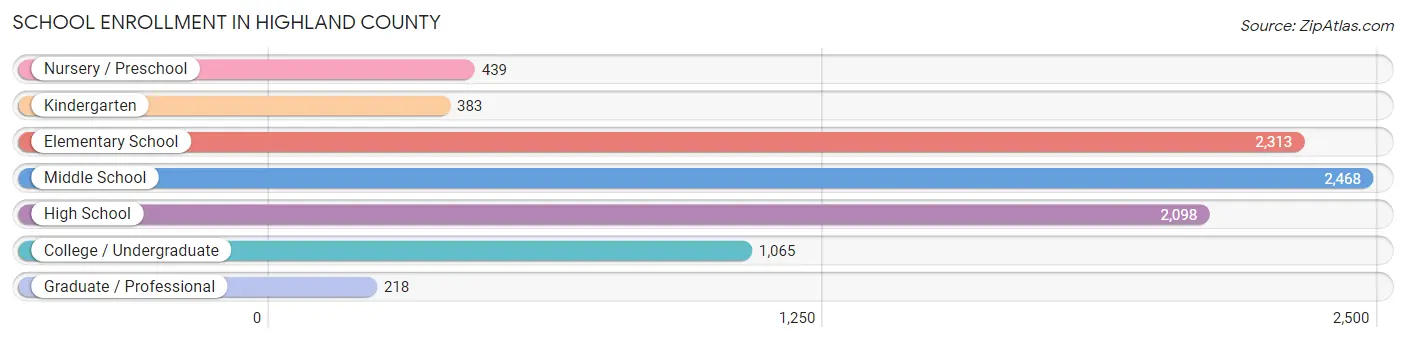
| School Level | # Students | % Students |
| Nursery / Preschool | 439 | 4.9% |
| Kindergarten | 383 | 4.3% |
| Elementary School | 2,313 | 25.8% |
| Middle School | 2,468 | 27.5% |
| High School | 2,098 | 23.4% |
| College / Undergraduate | 1,065 | 11.8% |
| Graduate / Professional | 218 | 2.4% |
| Total | 8,984 | 100.0% |
School Enrollment by Age by Funding Source in Highland County
Out of a total of 8,984 students who are enrolled in schools in Highland County, 1,141 (12.7%) attend a private institution, while the remaining 7,843 (87.3%) are enrolled in public schools. The age group of 25 to 34 year olds has the highest likelihood of being enrolled in private schools, with 108 (40.5% in the age bracket) enrolled. Conversely, the age group of 15 to 17 year olds has the lowest likelihood of being enrolled in a private school, with 1,531 (93.3% in the age bracket) attending a public institution.
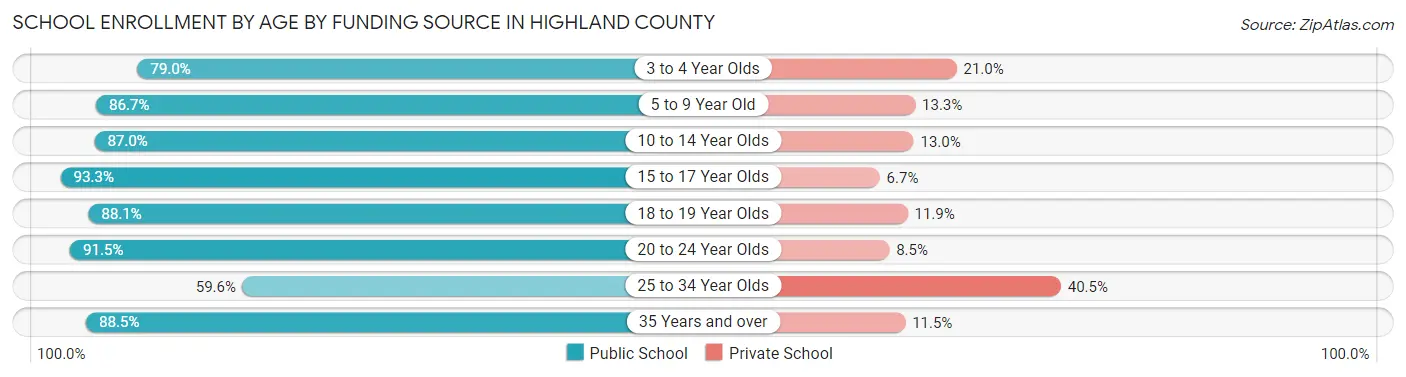
| Age Bracket | Public School | Private School |
| 3 to 4 Year Olds | 278 (79.0%) | 74 (21.0%) |
| 5 to 9 Year Old | 2,038 (86.7%) | 313 (13.3%) |
| 10 to 14 Year Olds | 2,638 (87.0%) | 395 (13.0%) |
| 15 to 17 Year Olds | 1,531 (93.3%) | 110 (6.7%) |
| 18 to 19 Year Olds | 415 (88.1%) | 56 (11.9%) |
| 20 to 24 Year Olds | 356 (91.5%) | 33 (8.5%) |
| 25 to 34 Year Olds | 159 (59.6%) | 108 (40.5%) |
| 35 Years and over | 425 (88.5%) | 55 (11.5%) |
| Total | 7,843 (87.3%) | 1,141 (12.7%) |
Educational Attainment by Field of Study in Highland County
Education (1,169 | 23.2%), business (755 | 15.0%), science & technology (593 | 11.8%), bio, nature & agricultural (524 | 10.4%), and arts & humanities (457 | 9.1%) are the most common fields of study among 5,033 individuals in Highland County who have obtained a bachelor's degree or higher.
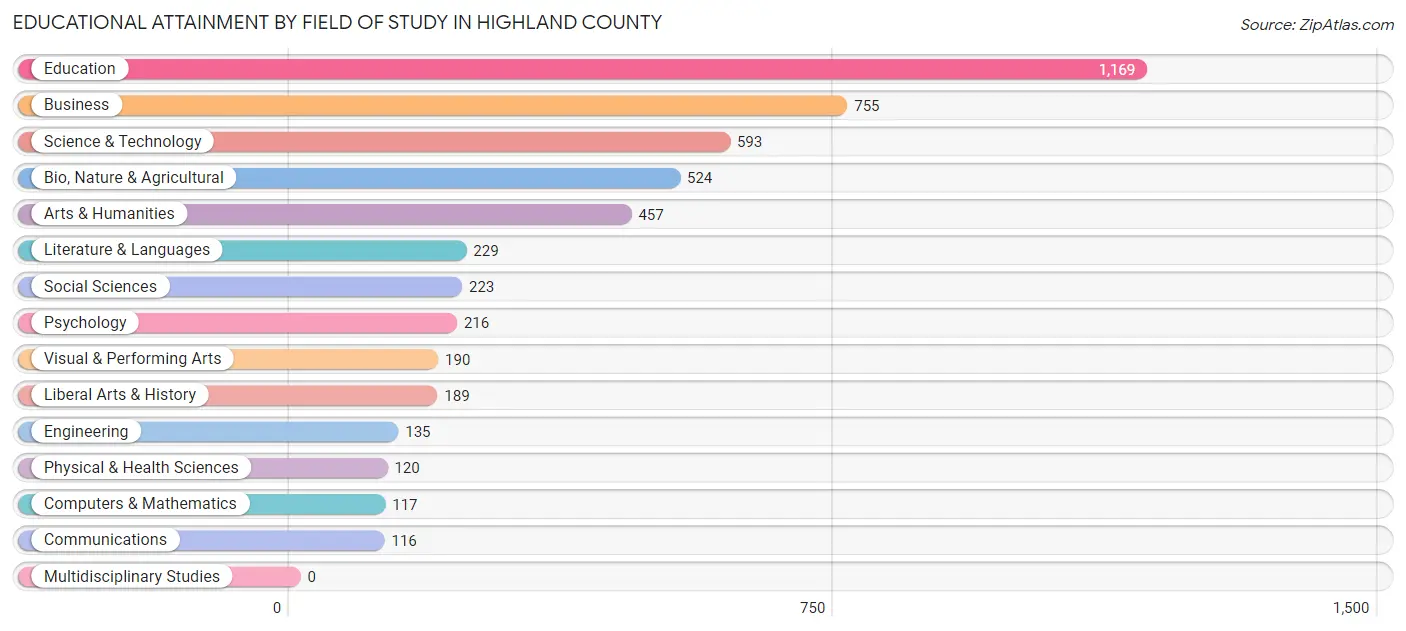
| Field of Study | # Graduates | % Graduates |
| Computers & Mathematics | 117 | 2.3% |
| Bio, Nature & Agricultural | 524 | 10.4% |
| Physical & Health Sciences | 120 | 2.4% |
| Psychology | 216 | 4.3% |
| Social Sciences | 223 | 4.4% |
| Engineering | 135 | 2.7% |
| Multidisciplinary Studies | 0 | 0.0% |
| Science & Technology | 593 | 11.8% |
| Business | 755 | 15.0% |
| Education | 1,169 | 23.2% |
| Literature & Languages | 229 | 4.5% |
| Liberal Arts & History | 189 | 3.8% |
| Visual & Performing Arts | 190 | 3.8% |
| Communications | 116 | 2.3% |
| Arts & Humanities | 457 | 9.1% |
| Total | 5,033 | 100.0% |
Transportation & Commute in Highland County
Vehicle Availability by Sex in Highland County
The most prevalent vehicle ownership categories in Highland County are males with 2 vehicles (3,886, accounting for 39.5%) and females with 2 vehicles (3,034, making up 44.5%).
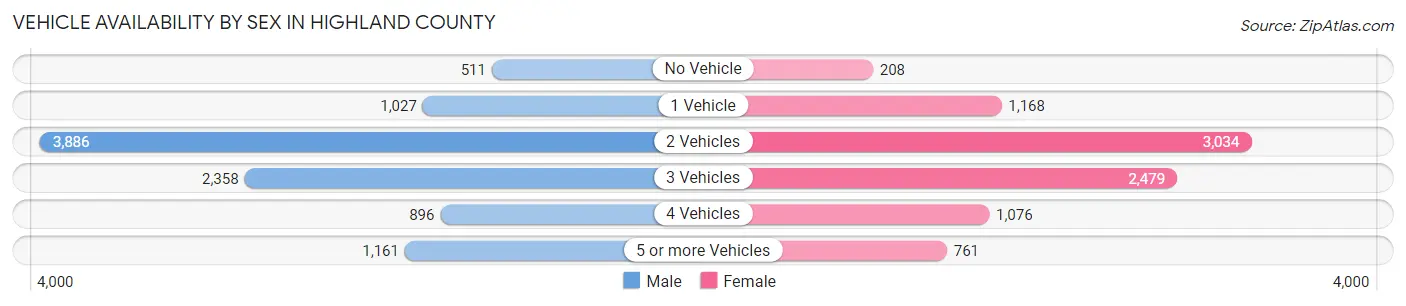
| Vehicles Available | Male | Female |
| No Vehicle | 511 (5.2%) | 208 (2.4%) |
| 1 Vehicle | 1,027 (10.4%) | 1,168 (13.4%) |
| 2 Vehicles | 3,886 (39.5%) | 3,034 (34.8%) |
| 3 Vehicles | 2,358 (24.0%) | 2,479 (28.4%) |
| 4 Vehicles | 896 (9.1%) | 1,076 (12.3%) |
| 5 or more Vehicles | 1,161 (11.8%) | 761 (8.7%) |
| Total | 9,839 (100.0%) | 8,726 (100.0%) |
Commute Time in Highland County
The most frequently occuring commute durations in Highland County are 5 to 9 minutes (2,409 commuters, 13.8%), 15 to 19 minutes (2,030 commuters, 11.6%), and 30 to 34 minutes (1,945 commuters, 11.1%).
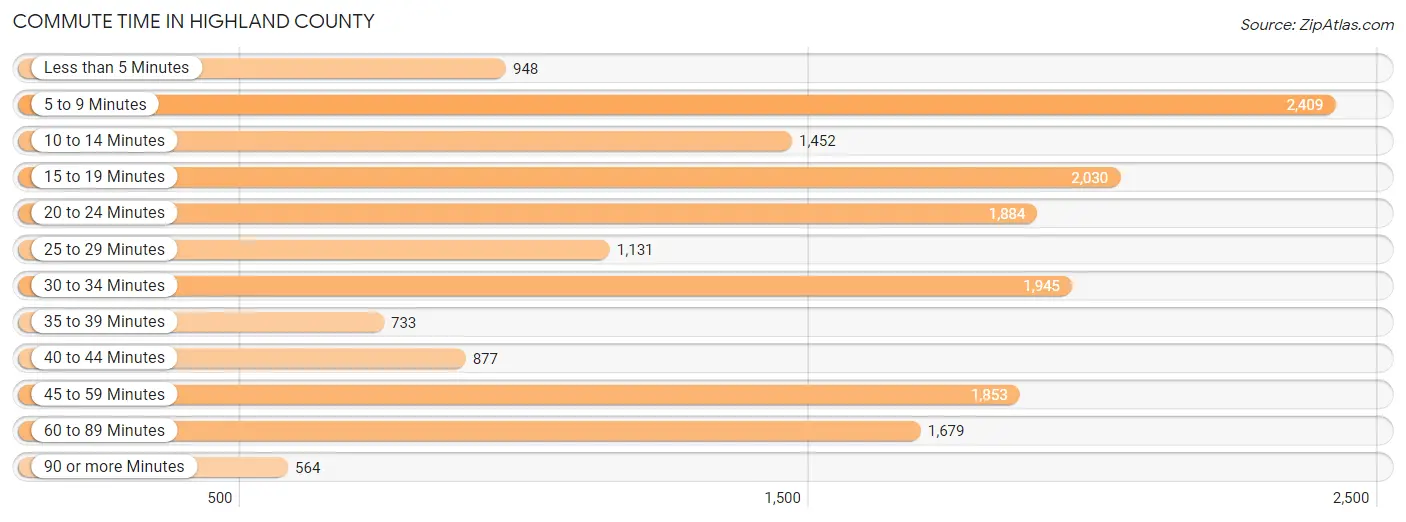
| Commute Time | # Commuters | % Commuters |
| Less than 5 Minutes | 948 | 5.4% |
| 5 to 9 Minutes | 2,409 | 13.8% |
| 10 to 14 Minutes | 1,452 | 8.3% |
| 15 to 19 Minutes | 2,030 | 11.6% |
| 20 to 24 Minutes | 1,884 | 10.8% |
| 25 to 29 Minutes | 1,131 | 6.5% |
| 30 to 34 Minutes | 1,945 | 11.1% |
| 35 to 39 Minutes | 733 | 4.2% |
| 40 to 44 Minutes | 877 | 5.0% |
| 45 to 59 Minutes | 1,853 | 10.6% |
| 60 to 89 Minutes | 1,679 | 9.6% |
| 90 or more Minutes | 564 | 3.2% |
Commute Time by Sex in Highland County
The most common commute times in Highland County are 60 to 89 minutes (1,183 commuters, 12.8%) for males and 5 to 9 minutes (1,240 commuters, 15.0%) for females.
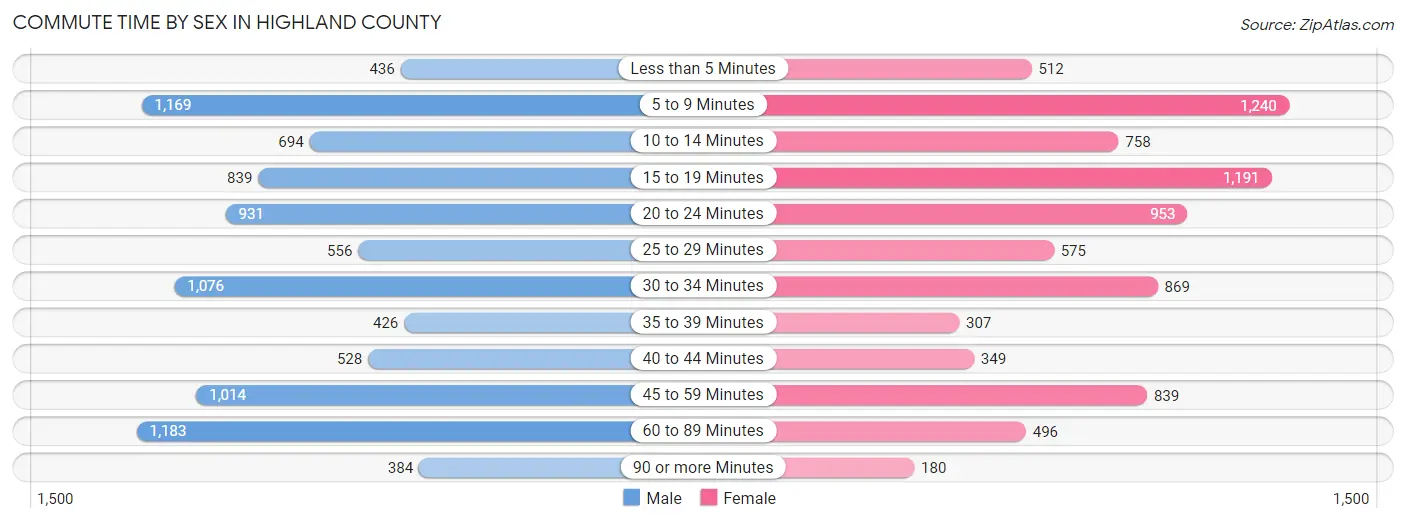
| Commute Time | Male | Female |
| Less than 5 Minutes | 436 (4.7%) | 512 (6.2%) |
| 5 to 9 Minutes | 1,169 (12.7%) | 1,240 (15.0%) |
| 10 to 14 Minutes | 694 (7.5%) | 758 (9.2%) |
| 15 to 19 Minutes | 839 (9.1%) | 1,191 (14.4%) |
| 20 to 24 Minutes | 931 (10.1%) | 953 (11.5%) |
| 25 to 29 Minutes | 556 (6.0%) | 575 (7.0%) |
| 30 to 34 Minutes | 1,076 (11.7%) | 869 (10.5%) |
| 35 to 39 Minutes | 426 (4.6%) | 307 (3.7%) |
| 40 to 44 Minutes | 528 (5.7%) | 349 (4.2%) |
| 45 to 59 Minutes | 1,014 (11.0%) | 839 (10.2%) |
| 60 to 89 Minutes | 1,183 (12.8%) | 496 (6.0%) |
| 90 or more Minutes | 384 (4.2%) | 180 (2.2%) |
Time of Departure to Work by Sex in Highland County
The most frequent times of departure to work in Highland County are 7:00 AM to 7:29 AM (1,411, 15.3%) for males and 7:00 AM to 7:29 AM (1,156, 14.0%) for females.
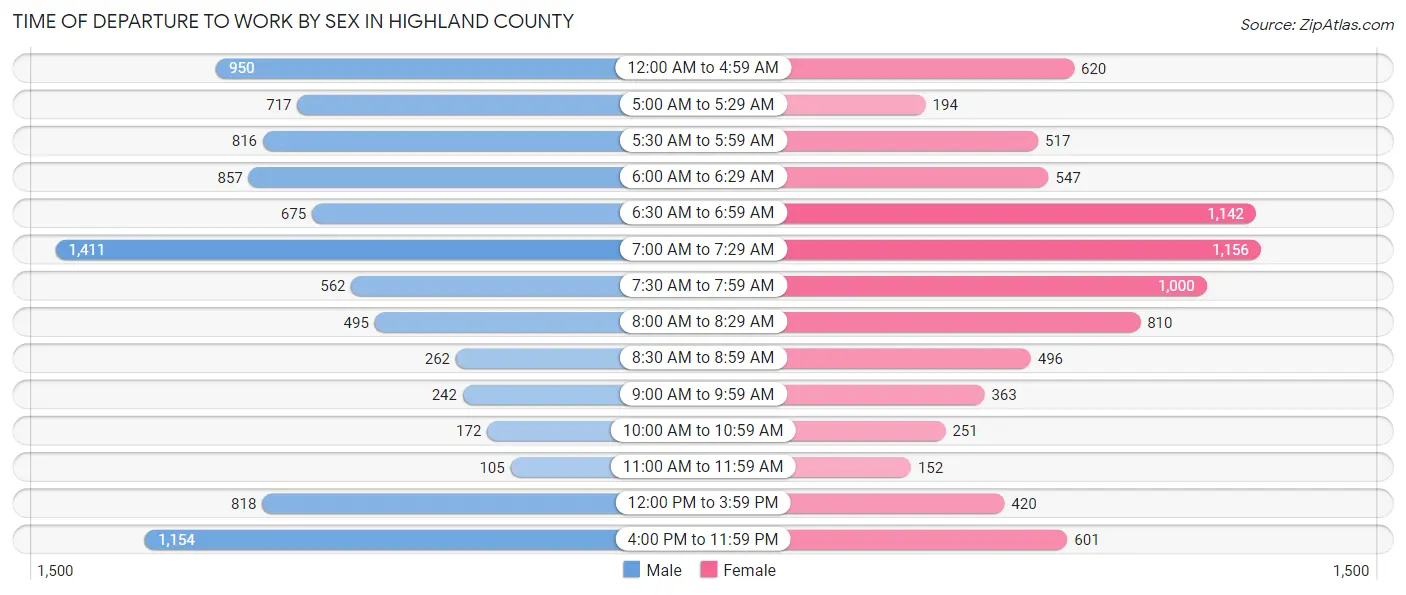
| Time of Departure | Male | Female |
| 12:00 AM to 4:59 AM | 950 (10.3%) | 620 (7.5%) |
| 5:00 AM to 5:29 AM | 717 (7.8%) | 194 (2.4%) |
| 5:30 AM to 5:59 AM | 816 (8.8%) | 517 (6.2%) |
| 6:00 AM to 6:29 AM | 857 (9.3%) | 547 (6.6%) |
| 6:30 AM to 6:59 AM | 675 (7.3%) | 1,142 (13.8%) |
| 7:00 AM to 7:29 AM | 1,411 (15.3%) | 1,156 (14.0%) |
| 7:30 AM to 7:59 AM | 562 (6.1%) | 1,000 (12.1%) |
| 8:00 AM to 8:29 AM | 495 (5.4%) | 810 (9.8%) |
| 8:30 AM to 8:59 AM | 262 (2.8%) | 496 (6.0%) |
| 9:00 AM to 9:59 AM | 242 (2.6%) | 363 (4.4%) |
| 10:00 AM to 10:59 AM | 172 (1.9%) | 251 (3.0%) |
| 11:00 AM to 11:59 AM | 105 (1.1%) | 152 (1.8%) |
| 12:00 PM to 3:59 PM | 818 (8.9%) | 420 (5.1%) |
| 4:00 PM to 11:59 PM | 1,154 (12.5%) | 601 (7.3%) |
| Total | 9,236 (100.0%) | 8,269 (100.0%) |
Housing Occupancy in Highland County
Occupancy by Ownership in Highland County
Of the total 16,688 dwellings in Highland County, owner-occupied units account for 12,150 (72.8%), while renter-occupied units make up 4,538 (27.2%).
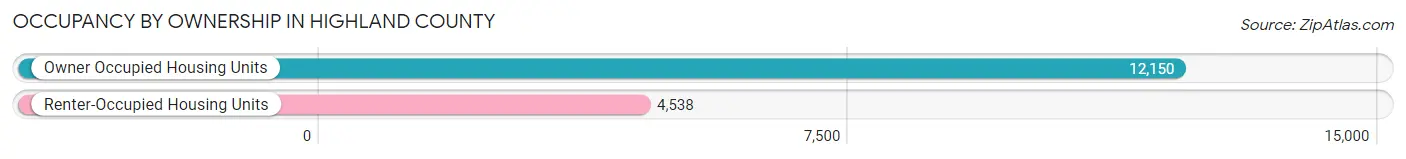
| Occupancy | # Housing Units | % Housing Units |
| Owner Occupied Housing Units | 12,150 | 72.8% |
| Renter-Occupied Housing Units | 4,538 | 27.2% |
| Total Occupied Housing Units | 16,688 | 100.0% |
Occupancy by Household Size in Highland County
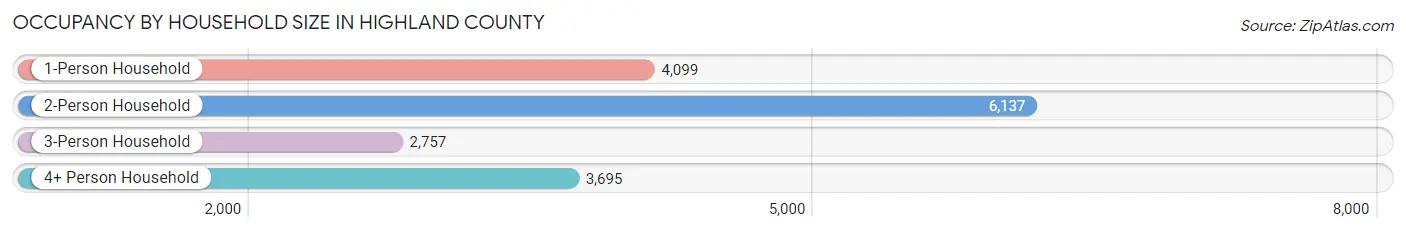
| Household Size | # Housing Units | % Housing Units |
| 1-Person Household | 4,099 | 24.6% |
| 2-Person Household | 6,137 | 36.8% |
| 3-Person Household | 2,757 | 16.5% |
| 4+ Person Household | 3,695 | 22.1% |
| Total Housing Units | 16,688 | 100.0% |
Occupancy by Ownership by Household Size in Highland County
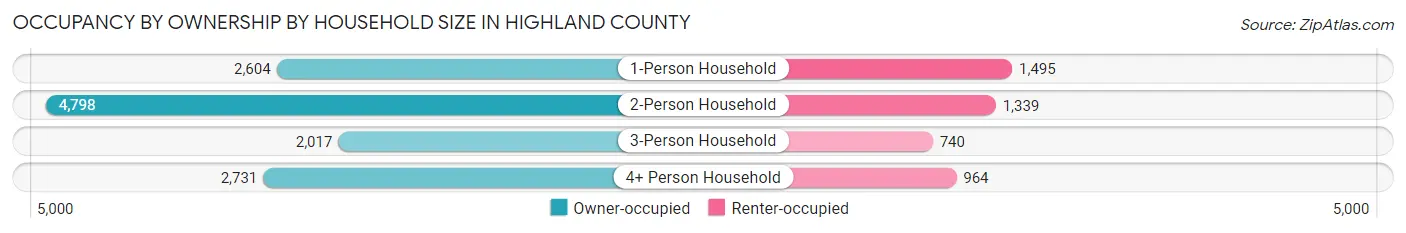
| Household Size | Owner-occupied | Renter-occupied |
| 1-Person Household | 2,604 (63.5%) | 1,495 (36.5%) |
| 2-Person Household | 4,798 (78.2%) | 1,339 (21.8%) |
| 3-Person Household | 2,017 (73.2%) | 740 (26.8%) |
| 4+ Person Household | 2,731 (73.9%) | 964 (26.1%) |
| Total Housing Units | 12,150 (72.8%) | 4,538 (27.2%) |
Occupancy by Educational Attainment in Highland County
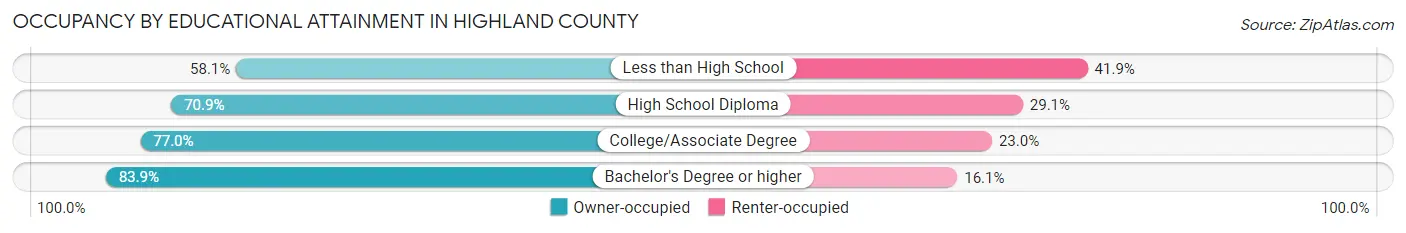
| Household Size | Owner-occupied | Renter-occupied |
| Less than High School | 1,461 (58.1%) | 1,055 (41.9%) |
| High School Diploma | 4,808 (70.9%) | 1,971 (29.1%) |
| College/Associate Degree | 3,613 (77.0%) | 1,077 (23.0%) |
| Bachelor's Degree or higher | 2,268 (83.9%) | 435 (16.1%) |
Occupancy by Age of Householder in Highland County
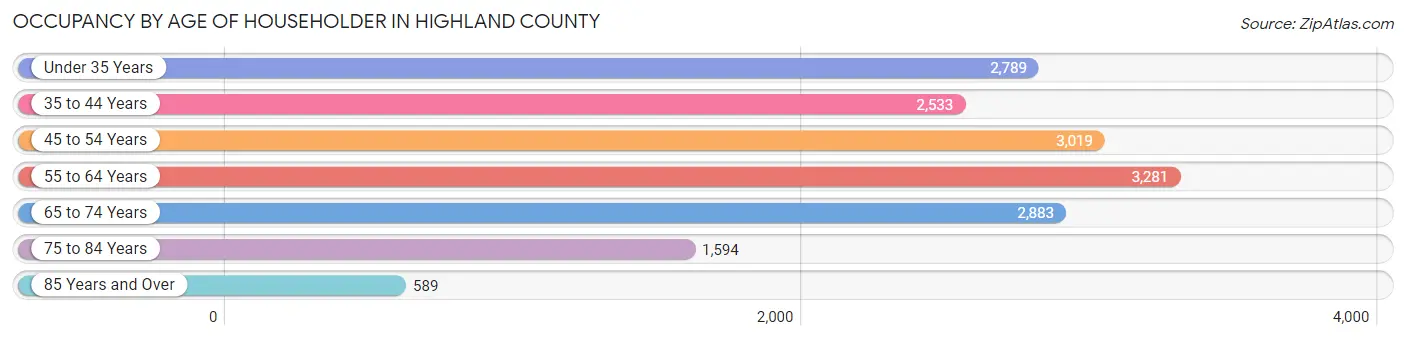
| Age Bracket | # Households | % Households |
| Under 35 Years | 2,789 | 16.7% |
| 35 to 44 Years | 2,533 | 15.2% |
| 45 to 54 Years | 3,019 | 18.1% |
| 55 to 64 Years | 3,281 | 19.7% |
| 65 to 74 Years | 2,883 | 17.3% |
| 75 to 84 Years | 1,594 | 9.6% |
| 85 Years and Over | 589 | 3.5% |
| Total | 16,688 | 100.0% |
Housing Finances in Highland County
Median Income by Occupancy in Highland County
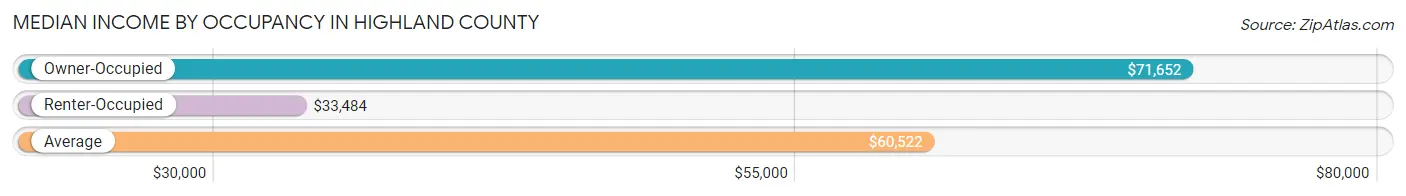
| Occupancy Type | # Households | Median Income |
| Owner-Occupied | 12,150 (72.8%) | $71,652 |
| Renter-Occupied | 4,538 (27.2%) | $33,484 |
| Average | 16,688 (100.0%) | $60,522 |
Occupancy by Householder Income Bracket in Highland County
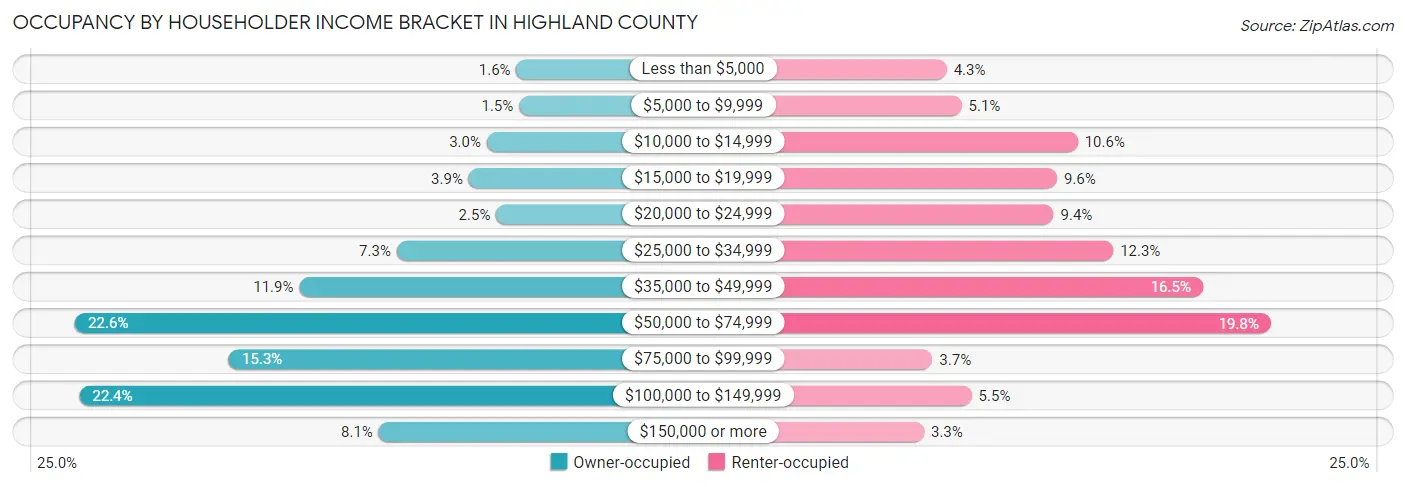
| Income Bracket | Owner-occupied | Renter-occupied |
| Less than $5,000 | 192 (1.6%) | 197 (4.3%) |
| $5,000 to $9,999 | 176 (1.5%) | 229 (5.1%) |
| $10,000 to $14,999 | 363 (3.0%) | 480 (10.6%) |
| $15,000 to $19,999 | 468 (3.8%) | 435 (9.6%) |
| $20,000 to $24,999 | 309 (2.5%) | 428 (9.4%) |
| $25,000 to $34,999 | 884 (7.3%) | 557 (12.3%) |
| $35,000 to $49,999 | 1,448 (11.9%) | 750 (16.5%) |
| $50,000 to $74,999 | 2,746 (22.6%) | 897 (19.8%) |
| $75,000 to $99,999 | 1,855 (15.3%) | 166 (3.7%) |
| $100,000 to $149,999 | 2,720 (22.4%) | 251 (5.5%) |
| $150,000 or more | 989 (8.1%) | 148 (3.3%) |
| Total | 12,150 (100.0%) | 4,538 (100.0%) |
Monthly Housing Cost Tiers in Highland County
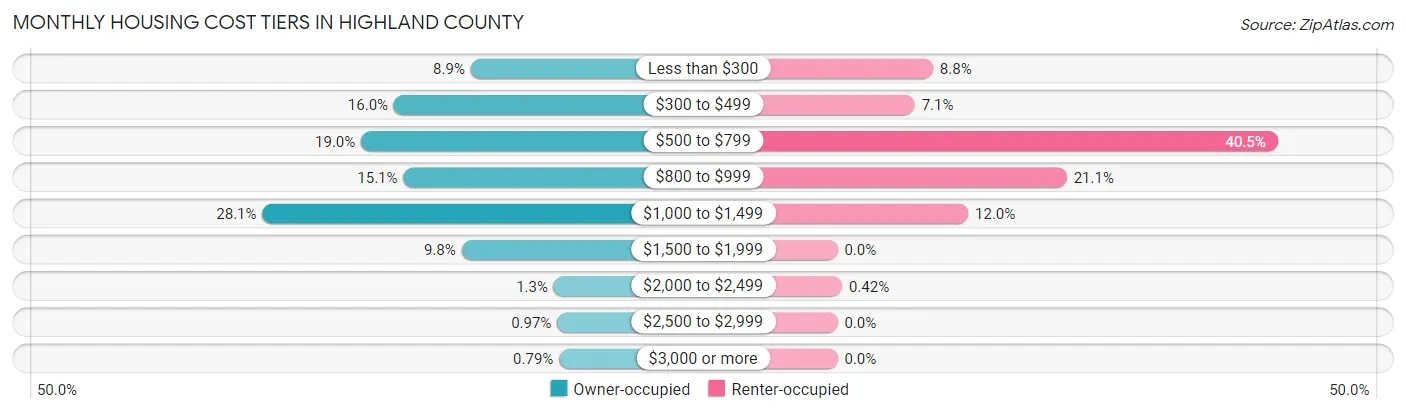
| Monthly Cost | Owner-occupied | Renter-occupied |
| Less than $300 | 1,085 (8.9%) | 399 (8.8%) |
| $300 to $499 | 1,944 (16.0%) | 323 (7.1%) |
| $500 to $799 | 2,311 (19.0%) | 1,839 (40.5%) |
| $800 to $999 | 1,838 (15.1%) | 958 (21.1%) |
| $1,000 to $1,499 | 3,415 (28.1%) | 546 (12.0%) |
| $1,500 to $1,999 | 1,187 (9.8%) | 0 (0.0%) |
| $2,000 to $2,499 | 156 (1.3%) | 19 (0.4%) |
| $2,500 to $2,999 | 118 (1.0%) | 0 (0.0%) |
| $3,000 or more | 96 (0.8%) | 0 (0.0%) |
| Total | 12,150 (100.0%) | 4,538 (100.0%) |
Physical Housing Characteristics in Highland County
Housing Structures in Highland County
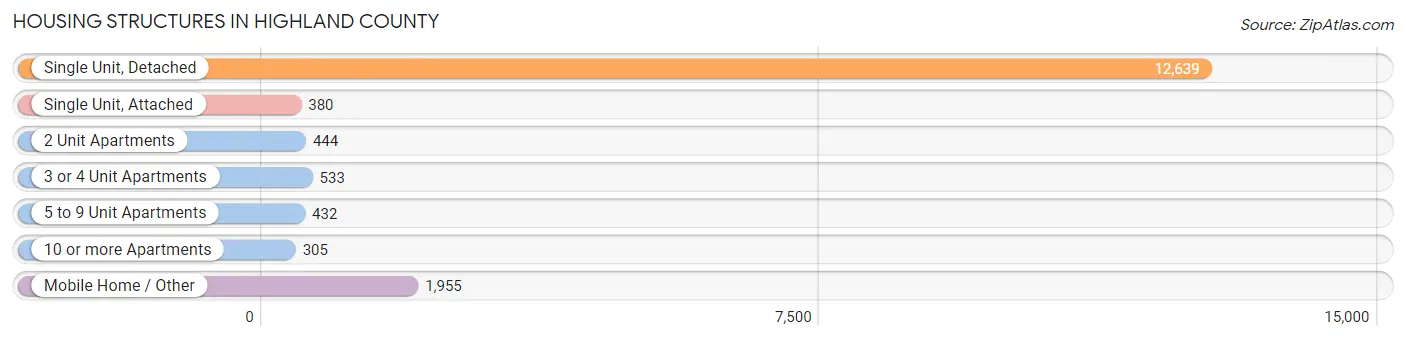
| Structure Type | # Housing Units | % Housing Units |
| Single Unit, Detached | 12,639 | 75.7% |
| Single Unit, Attached | 380 | 2.3% |
| 2 Unit Apartments | 444 | 2.7% |
| 3 or 4 Unit Apartments | 533 | 3.2% |
| 5 to 9 Unit Apartments | 432 | 2.6% |
| 10 or more Apartments | 305 | 1.8% |
| Mobile Home / Other | 1,955 | 11.7% |
| Total | 16,688 | 100.0% |
Housing Structures by Occupancy in Highland County
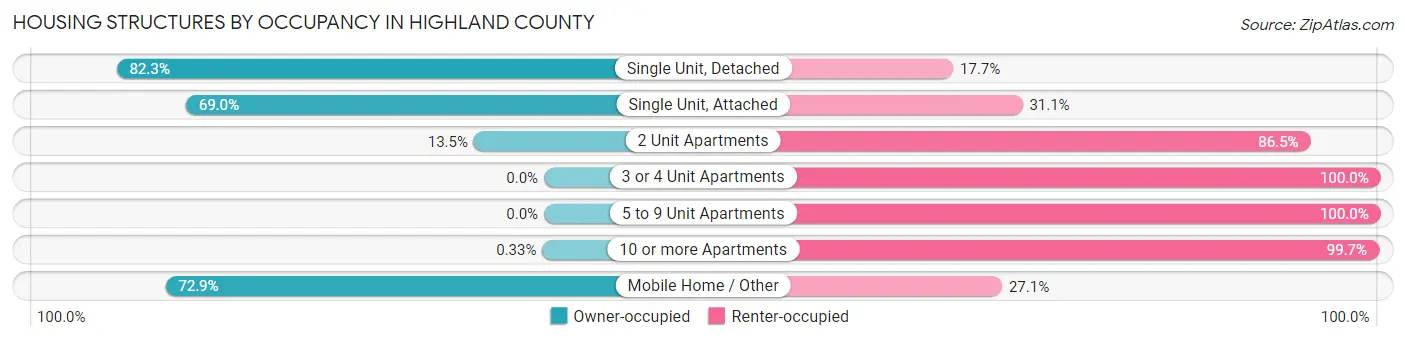
| Structure Type | Owner-occupied | Renter-occupied |
| Single Unit, Detached | 10,402 (82.3%) | 2,237 (17.7%) |
| Single Unit, Attached | 262 (69.0%) | 118 (31.0%) |
| 2 Unit Apartments | 60 (13.5%) | 384 (86.5%) |
| 3 or 4 Unit Apartments | 0 (0.0%) | 533 (100.0%) |
| 5 to 9 Unit Apartments | 0 (0.0%) | 432 (100.0%) |
| 10 or more Apartments | 1 (0.3%) | 304 (99.7%) |
| Mobile Home / Other | 1,425 (72.9%) | 530 (27.1%) |
| Total | 12,150 (72.8%) | 4,538 (27.2%) |
Housing Structures by Number of Rooms in Highland County
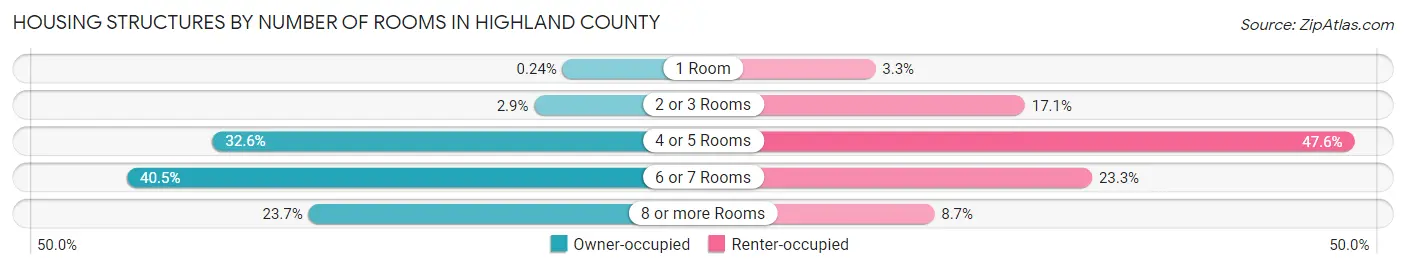
| Number of Rooms | Owner-occupied | Renter-occupied |
| 1 Room | 29 (0.2%) | 149 (3.3%) |
| 2 or 3 Rooms | 348 (2.9%) | 776 (17.1%) |
| 4 or 5 Rooms | 3,965 (32.6%) | 2,159 (47.6%) |
| 6 or 7 Rooms | 4,923 (40.5%) | 1,058 (23.3%) |
| 8 or more Rooms | 2,885 (23.7%) | 396 (8.7%) |
| Total | 12,150 (100.0%) | 4,538 (100.0%) |
Housing Structure by Heating Type in Highland County
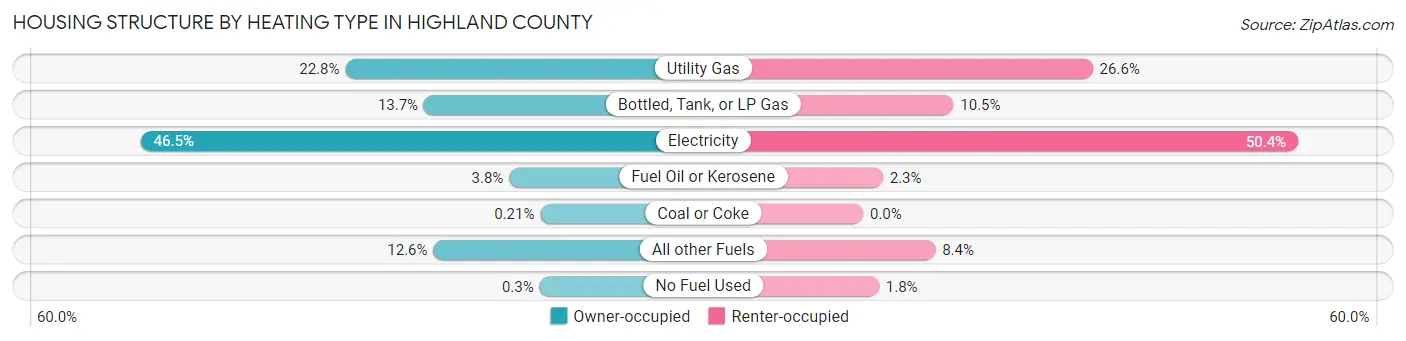
| Heating Type | Owner-occupied | Renter-occupied |
| Utility Gas | 2,773 (22.8%) | 1,208 (26.6%) |
| Bottled, Tank, or LP Gas | 1,664 (13.7%) | 475 (10.5%) |
| Electricity | 5,655 (46.5%) | 2,288 (50.4%) |
| Fuel Oil or Kerosene | 464 (3.8%) | 104 (2.3%) |
| Coal or Coke | 26 (0.2%) | 0 (0.0%) |
| All other Fuels | 1,532 (12.6%) | 380 (8.4%) |
| No Fuel Used | 36 (0.3%) | 83 (1.8%) |
| Total | 12,150 (100.0%) | 4,538 (100.0%) |
Household Vehicle Usage in Highland County
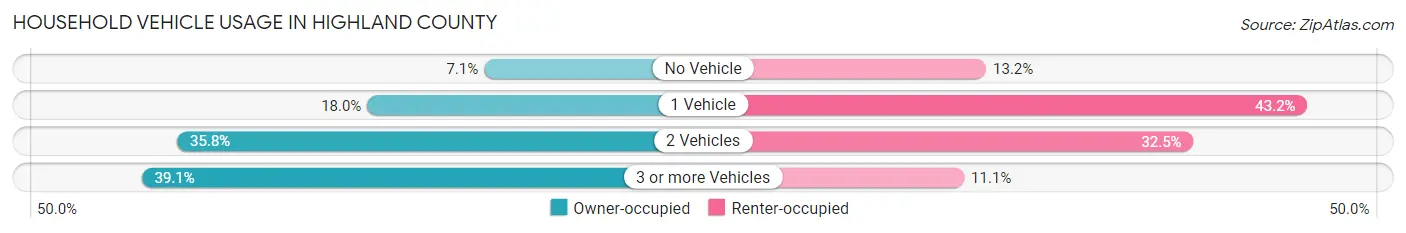
| Vehicles per Household | Owner-occupied | Renter-occupied |
| No Vehicle | 864 (7.1%) | 598 (13.2%) |
| 1 Vehicle | 2,189 (18.0%) | 1,959 (43.2%) |
| 2 Vehicles | 4,347 (35.8%) | 1,476 (32.5%) |
| 3 or more Vehicles | 4,750 (39.1%) | 505 (11.1%) |
| Total | 12,150 (100.0%) | 4,538 (100.0%) |
Real Estate & Mortgages in Highland County
Real Estate and Mortgage Overview in Highland County
| Characteristic | Without Mortgage | With Mortgage |
| Housing Units | 4,640 | 7,510 |
| Median Property Value | $123,000 | $154,700 |
| Median Household Income | $51,946 | $723 |
| Monthly Housing Costs | $431 | $96 |
| Real Estate Taxes | $1,288 | $149 |
Property Value by Mortgage Status in Highland County
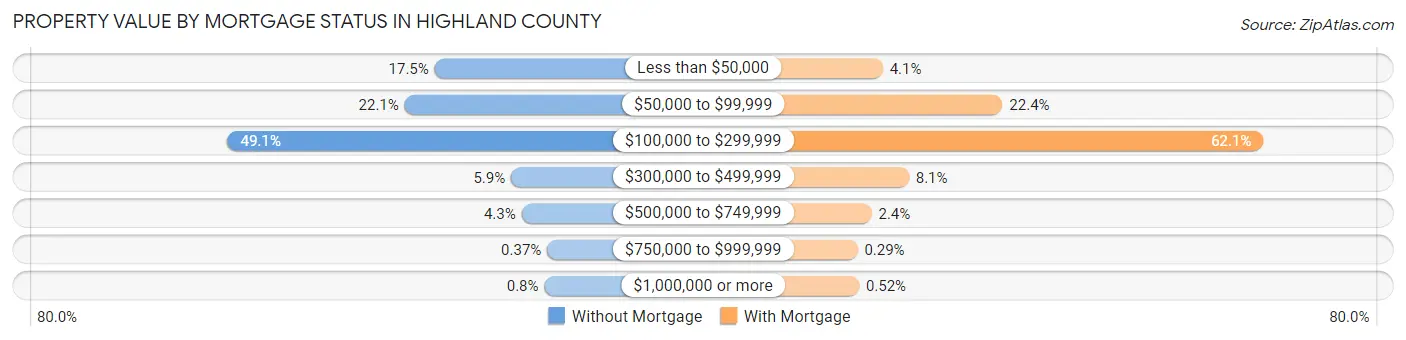
| Property Value | Without Mortgage | With Mortgage |
| Less than $50,000 | 813 (17.5%) | 311 (4.1%) |
| $50,000 to $99,999 | 1,025 (22.1%) | 1,681 (22.4%) |
| $100,000 to $299,999 | 2,277 (49.1%) | 4,665 (62.1%) |
| $300,000 to $499,999 | 273 (5.9%) | 609 (8.1%) |
| $500,000 to $749,999 | 198 (4.3%) | 183 (2.4%) |
| $750,000 to $999,999 | 17 (0.4%) | 22 (0.3%) |
| $1,000,000 or more | 37 (0.8%) | 39 (0.5%) |
| Total | 4,640 (100.0%) | 7,510 (100.0%) |
Household Income by Mortgage Status in Highland County
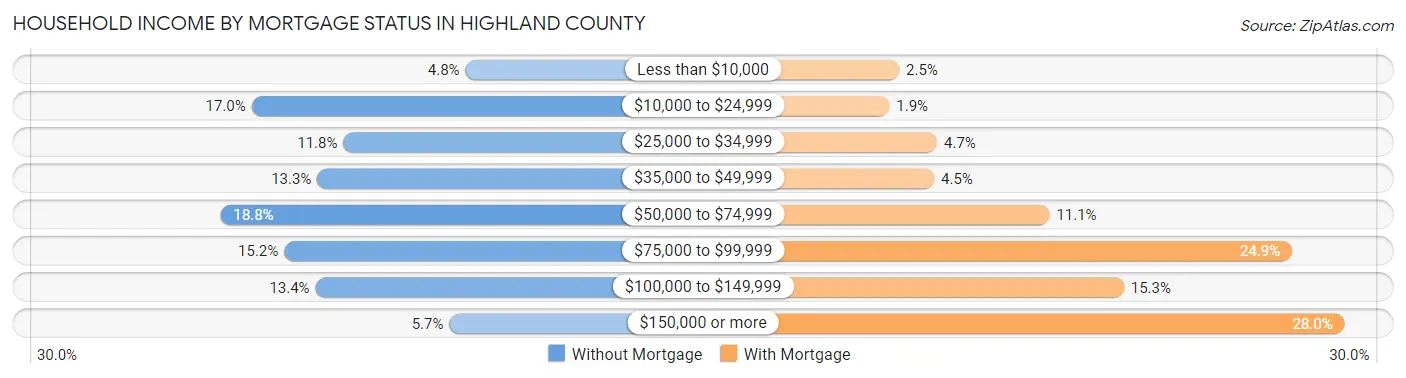
| Household Income | Without Mortgage | With Mortgage |
| Less than $10,000 | 223 (4.8%) | 187 (2.5%) |
| $10,000 to $24,999 | 790 (17.0%) | 145 (1.9%) |
| $25,000 to $34,999 | 547 (11.8%) | 350 (4.7%) |
| $35,000 to $49,999 | 616 (13.3%) | 337 (4.5%) |
| $50,000 to $74,999 | 873 (18.8%) | 832 (11.1%) |
| $75,000 to $99,999 | 704 (15.2%) | 1,873 (24.9%) |
| $100,000 to $149,999 | 621 (13.4%) | 1,151 (15.3%) |
| $150,000 or more | 266 (5.7%) | 2,099 (28.0%) |
| Total | 4,640 (100.0%) | 7,510 (100.0%) |
Property Value to Household Income Ratio in Highland County
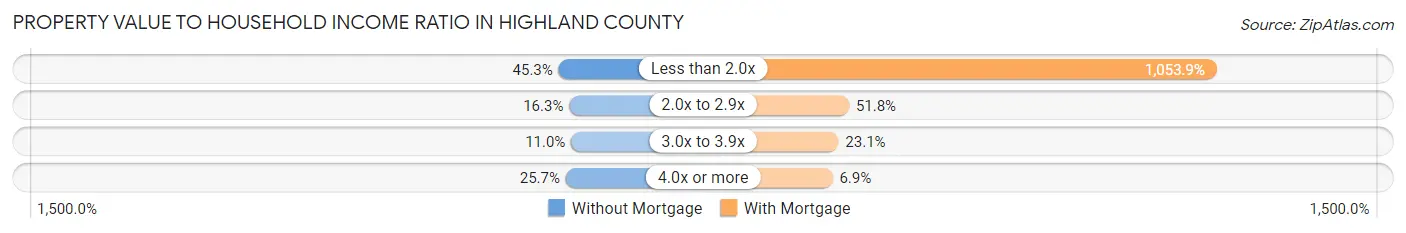
| Value-to-Income Ratio | Without Mortgage | With Mortgage |
| Less than 2.0x | 2,103 (45.3%) | 79,148 (1,053.9%) |
| 2.0x to 2.9x | 756 (16.3%) | 3,888 (51.8%) |
| 3.0x to 3.9x | 510 (11.0%) | 1,737 (23.1%) |
| 4.0x or more | 1,193 (25.7%) | 521 (6.9%) |
| Total | 4,640 (100.0%) | 7,510 (100.0%) |
Real Estate Taxes by Mortgage Status in Highland County
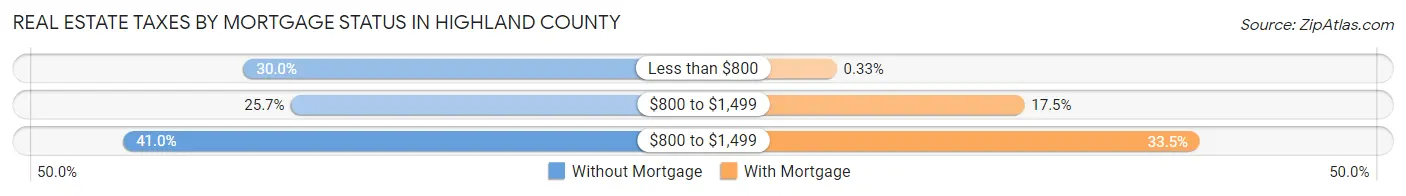
| Property Taxes | Without Mortgage | With Mortgage |
| Less than $800 | 1,392 (30.0%) | 25 (0.3%) |
| $800 to $1,499 | 1,194 (25.7%) | 1,312 (17.5%) |
| $800 to $1,499 | 1,902 (41.0%) | 2,516 (33.5%) |
| Total | 4,640 (100.0%) | 7,510 (100.0%) |
Health & Disability in Highland County
Health Insurance Coverage by Age in Highland County
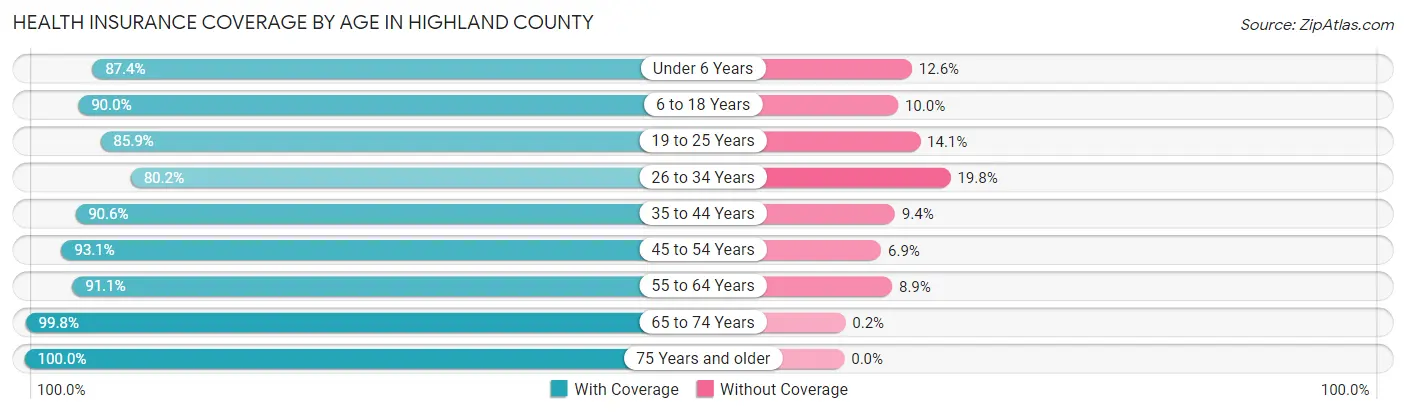
| Age Bracket | With Coverage | Without Coverage |
| Under 6 Years | 2,695 (87.4%) | 389 (12.6%) |
| 6 to 18 Years | 6,906 (90.0%) | 768 (10.0%) |
| 19 to 25 Years | 2,921 (85.9%) | 481 (14.1%) |
| 26 to 34 Years | 3,450 (80.2%) | 852 (19.8%) |
| 35 to 44 Years | 4,654 (90.6%) | 485 (9.4%) |
| 45 to 54 Years | 5,170 (93.1%) | 381 (6.9%) |
| 55 to 64 Years | 5,454 (91.1%) | 533 (8.9%) |
| 65 to 74 Years | 4,584 (99.8%) | 9 (0.2%) |
| 75 Years and older | 3,076 (100.0%) | 0 (0.0%) |
| Total | 38,910 (90.9%) | 3,898 (9.1%) |
Health Insurance Coverage by Citizenship Status in Highland County
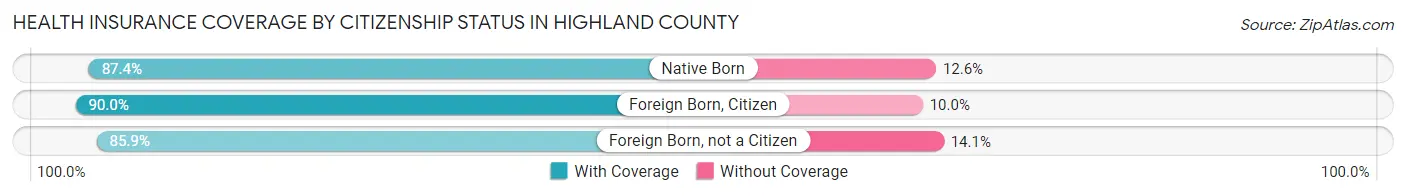
| Citizenship Status | With Coverage | Without Coverage |
| Native Born | 2,695 (87.4%) | 389 (12.6%) |
| Foreign Born, Citizen | 6,906 (90.0%) | 768 (10.0%) |
| Foreign Born, not a Citizen | 2,921 (85.9%) | 481 (14.1%) |
Health Insurance Coverage by Household Income in Highland County
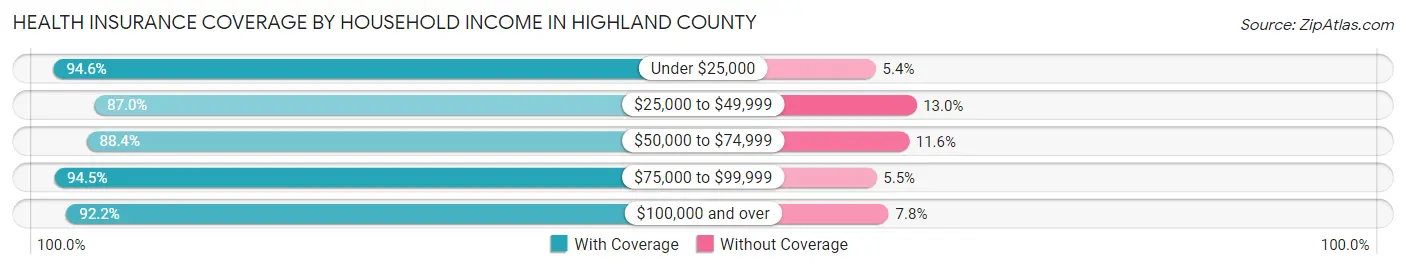
| Household Income | With Coverage | Without Coverage |
| Under $25,000 | 5,075 (94.6%) | 290 (5.4%) |
| $25,000 to $49,999 | 7,384 (87.0%) | 1,103 (13.0%) |
| $50,000 to $74,999 | 8,833 (88.4%) | 1,161 (11.6%) |
| $75,000 to $99,999 | 5,572 (94.5%) | 326 (5.5%) |
| $100,000 and over | 11,960 (92.2%) | 1,018 (7.8%) |
Public vs Private Health Insurance Coverage by Age in Highland County
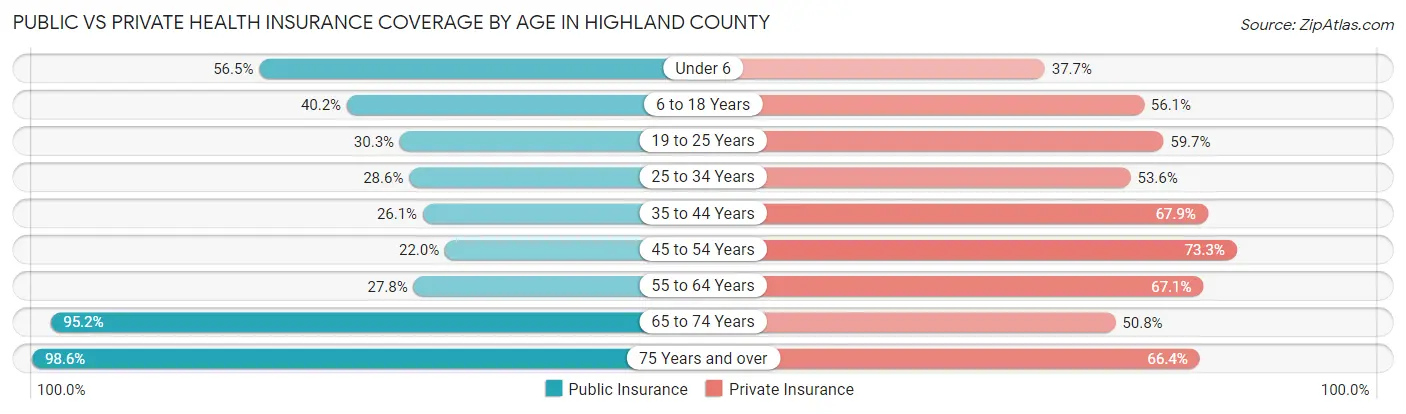
| Age Bracket | Public Insurance | Private Insurance |
| Under 6 | 1,741 (56.5%) | 1,162 (37.7%) |
| 6 to 18 Years | 3,083 (40.2%) | 4,303 (56.1%) |
| 19 to 25 Years | 1,032 (30.3%) | 2,030 (59.7%) |
| 25 to 34 Years | 1,231 (28.6%) | 2,306 (53.6%) |
| 35 to 44 Years | 1,339 (26.1%) | 3,490 (67.9%) |
| 45 to 54 Years | 1,219 (22.0%) | 4,069 (73.3%) |
| 55 to 64 Years | 1,665 (27.8%) | 4,018 (67.1%) |
| 65 to 74 Years | 4,374 (95.2%) | 2,333 (50.8%) |
| 75 Years and over | 3,034 (98.6%) | 2,043 (66.4%) |
| Total | 18,718 (43.7%) | 25,754 (60.2%) |
Disability Status by Sex by Age in Highland County
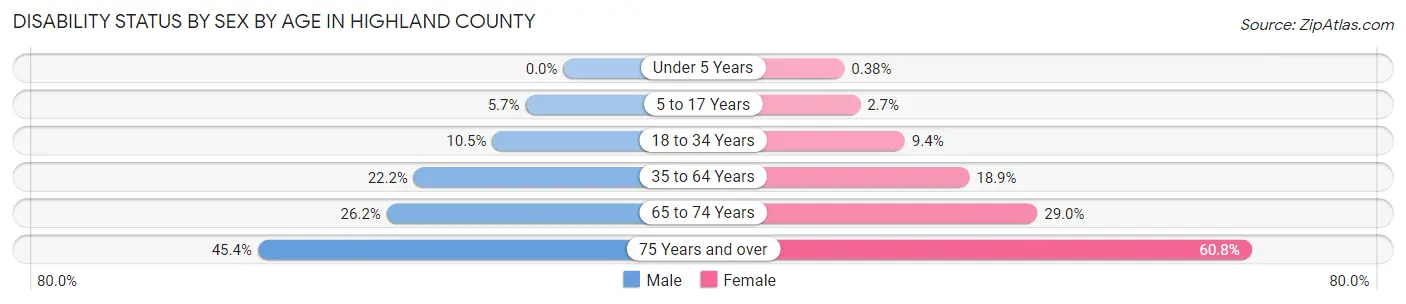
| Age Bracket | Male | Female |
| Under 5 Years | 0 (0.0%) | 5 (0.4%) |
| 5 to 17 Years | 217 (5.7%) | 104 (2.7%) |
| 18 to 34 Years | 433 (10.5%) | 378 (9.4%) |
| 35 to 64 Years | 1,839 (22.2%) | 1,591 (18.9%) |
| 65 to 74 Years | 577 (26.2%) | 695 (29.0%) |
| 75 Years and over | 594 (45.4%) | 1,075 (60.8%) |
Disability Class by Sex by Age in Highland County
Disability Class: Hearing Difficulty
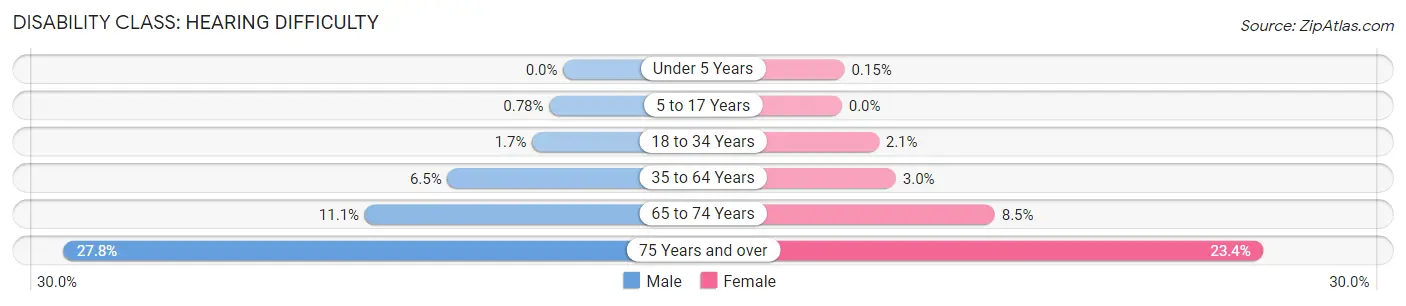
| Age Bracket | Male | Female |
| Under 5 Years | 0 (0.0%) | 2 (0.2%) |
| 5 to 17 Years | 30 (0.8%) | 0 (0.0%) |
| 18 to 34 Years | 71 (1.7%) | 83 (2.1%) |
| 35 to 64 Years | 534 (6.5%) | 253 (3.0%) |
| 65 to 74 Years | 243 (11.1%) | 204 (8.5%) |
| 75 Years and over | 364 (27.8%) | 414 (23.4%) |
Disability Class: Vision Difficulty
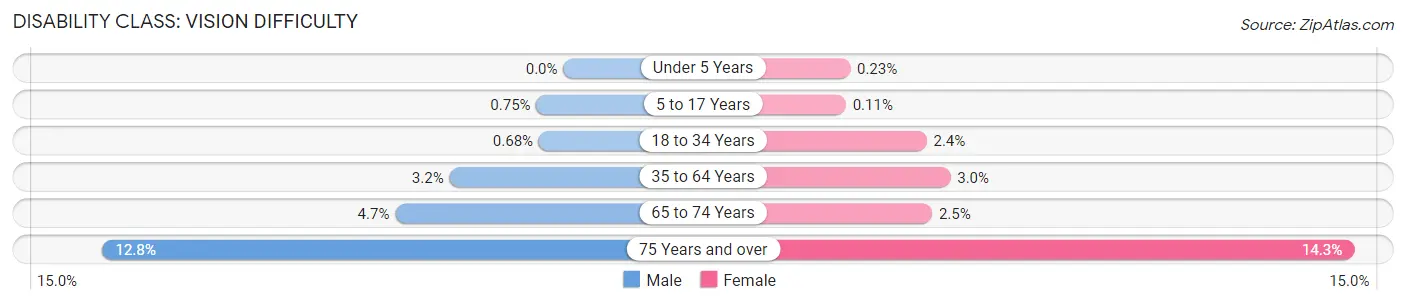
| Age Bracket | Male | Female |
| Under 5 Years | 0 (0.0%) | 3 (0.2%) |
| 5 to 17 Years | 29 (0.7%) | 4 (0.1%) |
| 18 to 34 Years | 28 (0.7%) | 95 (2.4%) |
| 35 to 64 Years | 262 (3.2%) | 254 (3.0%) |
| 65 to 74 Years | 103 (4.7%) | 60 (2.5%) |
| 75 Years and over | 168 (12.8%) | 252 (14.3%) |
Disability Class: Cognitive Difficulty
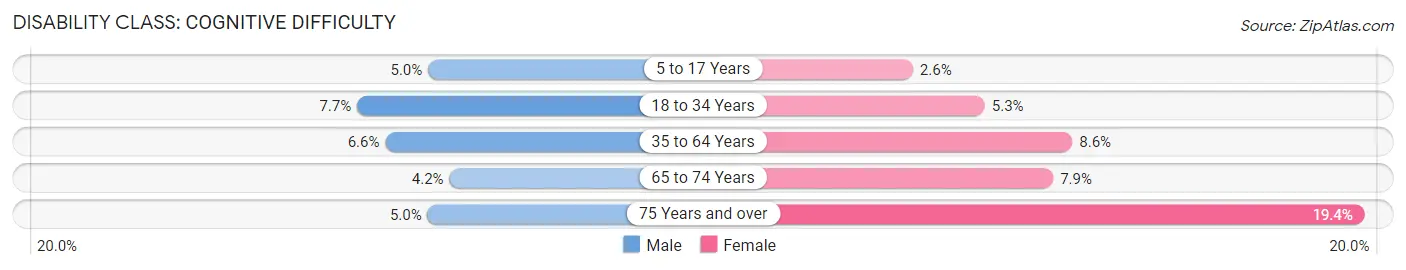
| Age Bracket | Male | Female |
| 5 to 17 Years | 193 (5.0%) | 100 (2.6%) |
| 18 to 34 Years | 315 (7.7%) | 214 (5.3%) |
| 35 to 64 Years | 547 (6.6%) | 719 (8.6%) |
| 65 to 74 Years | 93 (4.2%) | 188 (7.9%) |
| 75 Years and over | 66 (5.0%) | 343 (19.4%) |
Disability Class: Ambulatory Difficulty
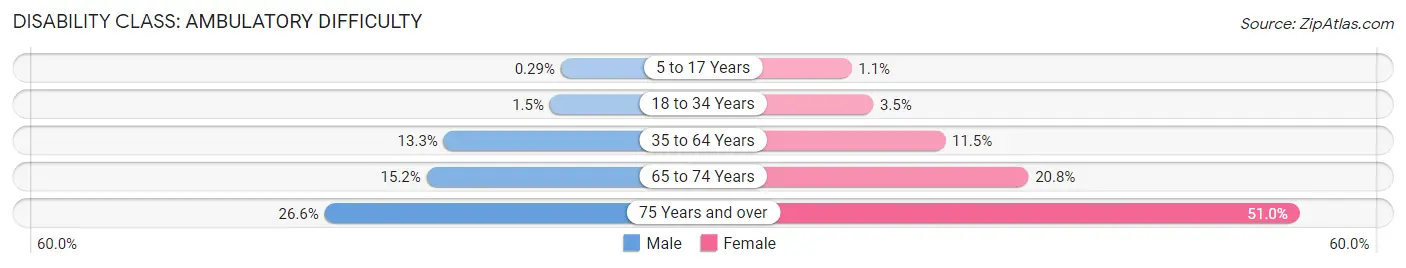
| Age Bracket | Male | Female |
| 5 to 17 Years | 11 (0.3%) | 40 (1.1%) |
| 18 to 34 Years | 62 (1.5%) | 140 (3.5%) |
| 35 to 64 Years | 1,103 (13.3%) | 966 (11.5%) |
| 65 to 74 Years | 335 (15.2%) | 497 (20.8%) |
| 75 Years and over | 348 (26.6%) | 901 (51.0%) |
Disability Class: Self-Care Difficulty
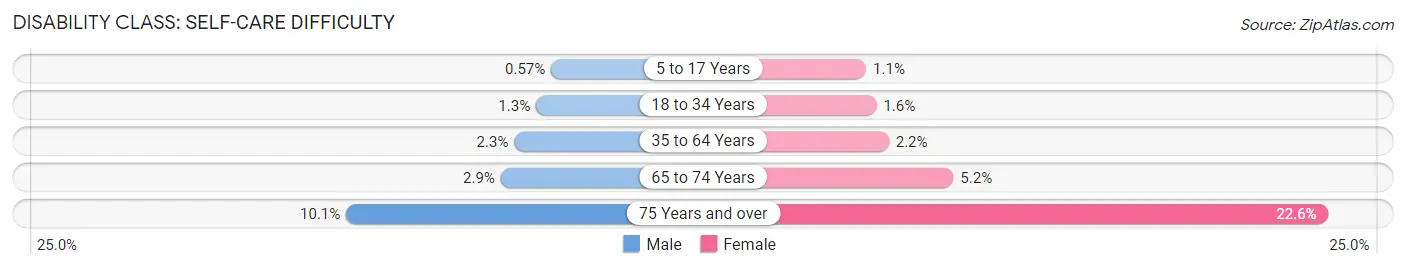
| Age Bracket | Male | Female |
| 5 to 17 Years | 22 (0.6%) | 43 (1.1%) |
| 18 to 34 Years | 52 (1.3%) | 65 (1.6%) |
| 35 to 64 Years | 189 (2.3%) | 183 (2.2%) |
| 65 to 74 Years | 64 (2.9%) | 124 (5.2%) |
| 75 Years and over | 132 (10.1%) | 399 (22.6%) |
Technology Access in Highland County
Computing Device Access in Highland County
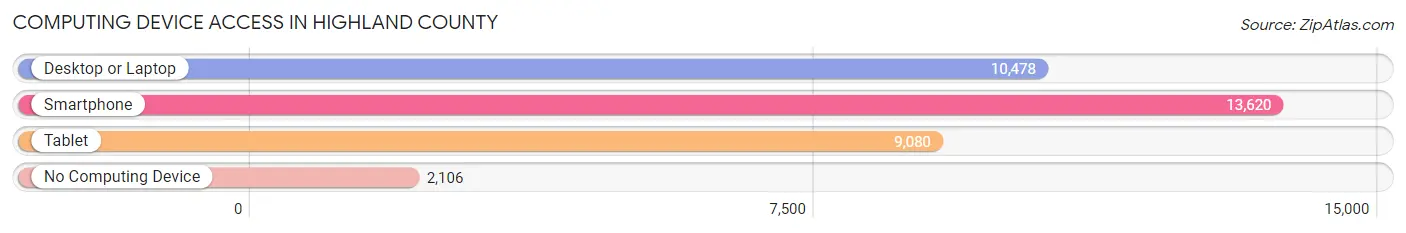
| Device Type | # Households | % Households |
| Desktop or Laptop | 10,478 | 62.8% |
| Smartphone | 13,620 | 81.6% |
| Tablet | 9,080 | 54.4% |
| No Computing Device | 2,106 | 12.6% |
| Total | 16,688 | 100.0% |
Internet Access in Highland County
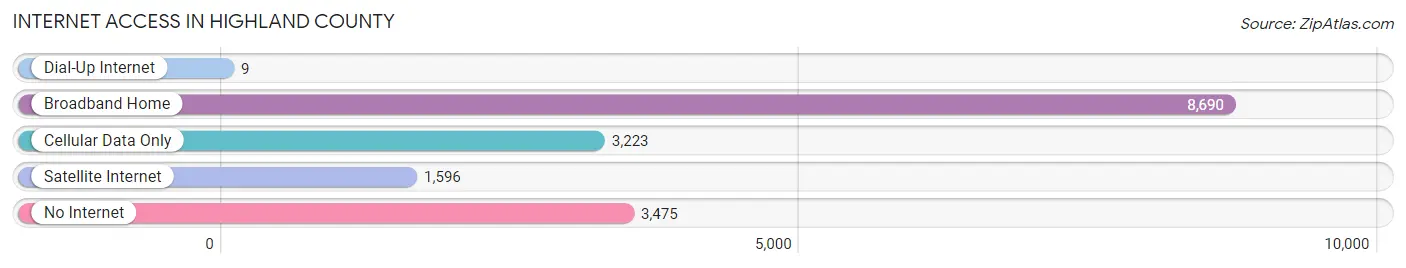
| Internet Type | # Households | % Households |
| Dial-Up Internet | 9 | 0.1% |
| Broadband Home | 8,690 | 52.1% |
| Cellular Data Only | 3,223 | 19.3% |
| Satellite Internet | 1,596 | 9.6% |
| No Internet | 3,475 | 20.8% |
| Total | 16,688 | 100.0% |
Highland County Summary
Highland County is a county located in the state of Ohio, United States. As of the 2010 census, the population was 42,944. The county seat is Hillsboro. The county was formed on January 22, 1805 from parts of Adams, Ross, and Clermont counties. It was named for the topography of its terrain, which is composed of numerous hills and valleys.
Geography
Highland County is located in the southwestern part of Ohio, along the Ohio River. It is bordered by Adams County to the north, Ross County to the east, Fayette County to the south, and Clinton County to the west. The county has a total area of 437 square miles, of which 431 square miles is land and 6.2 square miles is water.
The terrain of Highland County is mostly hilly, with numerous valleys and ridges. The highest point in the county is located in the northwest corner, at an elevation of 1,400 feet. The county is drained by the Little Miami River, which flows through the center of the county.
Demographics
As of the 2010 census, there were 42,944 people, 16,845 households, and 11,845 families residing in the county. The population density was 99.3 people per square mile. There were 18,845 housing units at an average density of 43.7 per square mile. The racial makeup of the county was 97.7% White, 0.6% Black or African American, 0.2% Native American, 0.2% Asian, 0.2% from other races, and 1.1% from two or more races. 1.3% of the population were Hispanic or Latino of any race.
There were 16,845 households, out of which 30.2% had children under the age of 18 living with them, 56.2% were married couples living together, 10.2% had a female householder with no husband present, and 29.3% were non-families. 24.7% of all households were made up of individuals, and 10.7% had someone living alone who was 65 years of age or older. The average household size was 2.51 and the average family size was 2.98.
The median income for a household in the county was $41,945, and the median income for a family was $50,845. Males had a median income of $37,945 versus $25,845 for females. The per capita income for the county was $20,845. About 8.2% of families and 11.2% of the population were below the poverty line, including 15.2% of those under age 18 and 8.2% of those age 65 or over.
Economy
Highland County has a diverse economy, with a mix of agriculture, manufacturing, and services. The county is home to several large employers, including Hillsboro Industries, a manufacturer of automotive parts; Hillsboro Plastics, a plastics manufacturer; and Hillsboro Technologies, a software development company.
Agriculture is an important part of the county's economy, with corn, soybeans, and wheat being the primary crops. Livestock production is also important, with beef cattle, dairy cows, and hogs being the primary animals raised.
The county is also home to several tourist attractions, including the Highland County Historical Museum, the Highland County Fairgrounds, and the Highland County Arts Council.
Conclusion
Highland County is a rural county located in the southwestern part of Ohio. It is home to a diverse economy, with a mix of agriculture, manufacturing, and services. The county is also home to several tourist attractions, including the Highland County Historical Museum, the Highland County Fairgrounds, and the Highland County Arts Council. The population of the county was 42,944 as of the 2010 census, and the median household income was $41,945.
Common Questions
What is Per Capita Income in Highland County?
Per Capita income in Highland County is $27,971.
What is the Median Family Income in Highland County?
Median Family Income in Highland County is $70,651.
What is the Median Household income in Highland County?
Median Household Income in Highland County is $60,522.
What is Income or Wage Gap in Highland County?
Income or Wage Gap in Highland County is 25.4%.
Women in Highland County earn 74.6 cents for every dollar earned by a man.
What is Family Income Deficit in Highland County?
Family Income Deficit in Highland County is $9,416.
Families that are below poverty line in Highland County earn $9,416 less on average than the poverty threshold level.
What is Inequality or Gini Index in Highland County?
Inequality or Gini Index in Highland County is 0.40.
What is the Total Population of Highland County?
Total Population of Highland County is 43,285.
What is the Total Male Population of Highland County?
Total Male Population of Highland County is 21,303.
What is the Total Female Population of Highland County?
Total Female Population of Highland County is 21,982.
What is the Ratio of Males per 100 Females in Highland County?
There are 96.91 Males per 100 Females in Highland County.
What is the Ratio of Females per 100 Males in Highland County?
There are 103.19 Females per 100 Males in Highland County.
What is the Median Population Age in Highland County?
Median Population Age in Highland County is 40.8 Years.
What is the Average Family Size in Highland County
Average Family Size in Highland County is 3.0 People.
What is the Average Household Size in Highland County
Average Household Size in Highland County is 2.6 People.
How Large is the Labor Force in Highland County?
There are 19,909 People in the Labor Forcein in Highland County.
What is the Percentage of People in the Labor Force in Highland County?
58.3% of People are in the Labor Force in Highland County.
What is the Unemployment Rate in Highland County?
Unemployment Rate in Highland County is 4.4%.