Gallia County, OH Map & Demographics
Gallia County Overview
$28,943
PER CAPITA INCOME
$69,521
AVG FAMILY INCOME
$55,533
AVG HOUSEHOLD INCOME
25.9%
WAGE / INCOME GAP [ % ]
74.1¢/ $1
WAGE / INCOME GAP [ $ ]
$10,282
FAMILY INCOME DEFICIT
0.45
INEQUALITY / GINI INDEX
29,276
TOTAL POPULATION
14,445
MALE POPULATION
14,831
FEMALE POPULATION
97.40
MALES / 100 FEMALES
102.67
FEMALES / 100 MALES
40.2
MEDIAN AGE
3.1
AVG FAMILY SIZE
2.5
AVG HOUSEHOLD SIZE
12,317
LABOR FORCE [ PEOPLE ]
52.7%
PERCENT IN LABOR FORCE
4.1%
UNEMPLOYMENT RATE
Gallia County Area Codes
Income in Gallia County
Income Overview in Gallia County
Per Capita Income in Gallia County is $28,943, while median incomes of families and households are $69,521 and $55,533 respectively.
| Characteristic | Number | Measure |
| Per Capita Income | 29,276 | $28,943 |
| Median Family Income | 7,613 | $69,521 |
| Mean Family Income | 7,613 | $87,249 |
| Median Household Income | 11,303 | $55,533 |
| Mean Household Income | 11,303 | $73,571 |
| Income Deficit | 7,613 | $10,282 |
| Wage / Income Gap (%) | 29,276 | 25.87% |
| Wage / Income Gap ($) | 29,276 | 74.13¢ per $1 |
| Gini / Inequality Index | 29,276 | 0.45 |
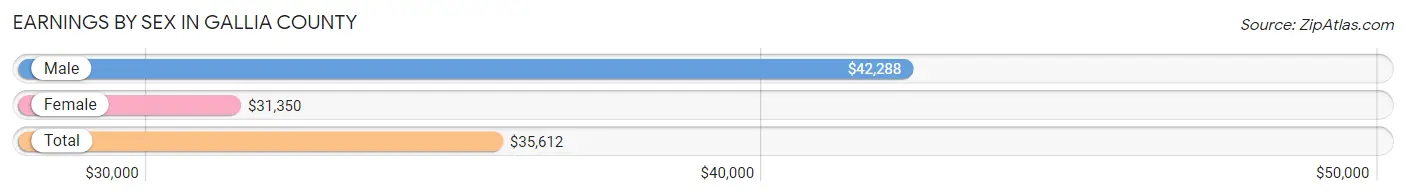
Earnings by Sex in Gallia County
Average Earnings in Gallia County are $35,612, $42,288 for men and $31,350 for women, a difference of 25.9%.
| Sex | Number | Average Earnings |
| Male | 6,848 (52.9%) | $42,288 |
| Female | 6,090 (47.1%) | $31,350 |
| Total | 12,938 (100.0%) | $35,612 |
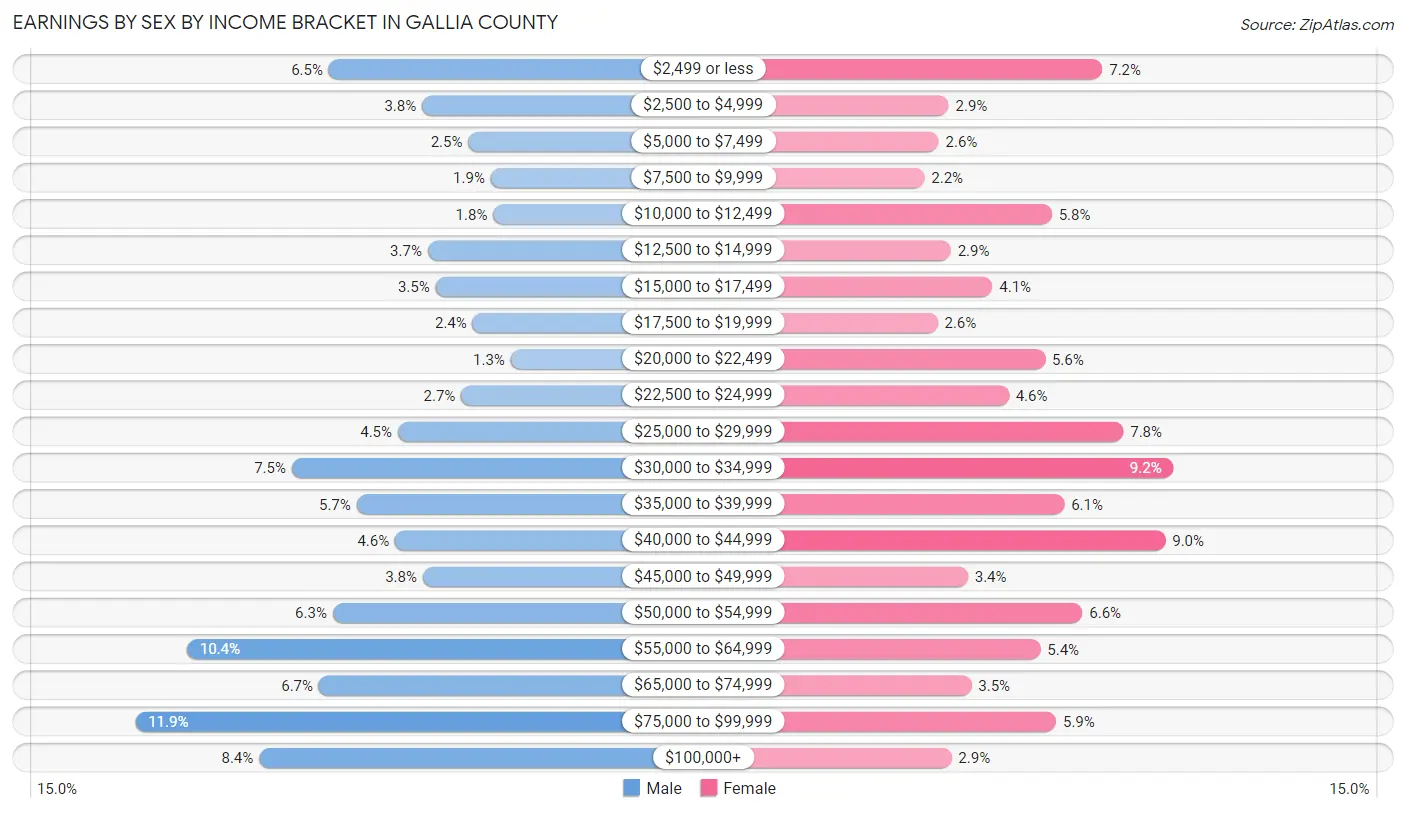
Earnings by Sex by Income Bracket in Gallia County
The most common earnings brackets in Gallia County are $75,000 to $99,999 for men (814 | 11.9%) and $30,000 to $34,999 for women (559 | 9.2%).
| Income | Male | Female |
| $2,499 or less | 442 (6.5%) | 437 (7.2%) |
| $2,500 to $4,999 | 262 (3.8%) | 174 (2.9%) |
| $5,000 to $7,499 | 173 (2.5%) | 157 (2.6%) |
| $7,500 to $9,999 | 130 (1.9%) | 133 (2.2%) |
| $10,000 to $12,499 | 125 (1.8%) | 351 (5.8%) |
| $12,500 to $14,999 | 251 (3.7%) | 178 (2.9%) |
| $15,000 to $17,499 | 236 (3.5%) | 249 (4.1%) |
| $17,500 to $19,999 | 165 (2.4%) | 155 (2.5%) |
| $20,000 to $22,499 | 92 (1.3%) | 339 (5.6%) |
| $22,500 to $24,999 | 187 (2.7%) | 277 (4.5%) |
| $25,000 to $29,999 | 309 (4.5%) | 473 (7.8%) |
| $30,000 to $34,999 | 513 (7.5%) | 559 (9.2%) |
| $35,000 to $39,999 | 388 (5.7%) | 372 (6.1%) |
| $40,000 to $44,999 | 314 (4.6%) | 545 (8.9%) |
| $45,000 to $49,999 | 261 (3.8%) | 207 (3.4%) |
| $50,000 to $54,999 | 434 (6.3%) | 403 (6.6%) |
| $55,000 to $64,999 | 715 (10.4%) | 331 (5.4%) |
| $65,000 to $74,999 | 461 (6.7%) | 213 (3.5%) |
| $75,000 to $99,999 | 814 (11.9%) | 358 (5.9%) |
| $100,000+ | 576 (8.4%) | 179 (2.9%) |
| Total | 6,848 (100.0%) | 6,090 (100.0%) |
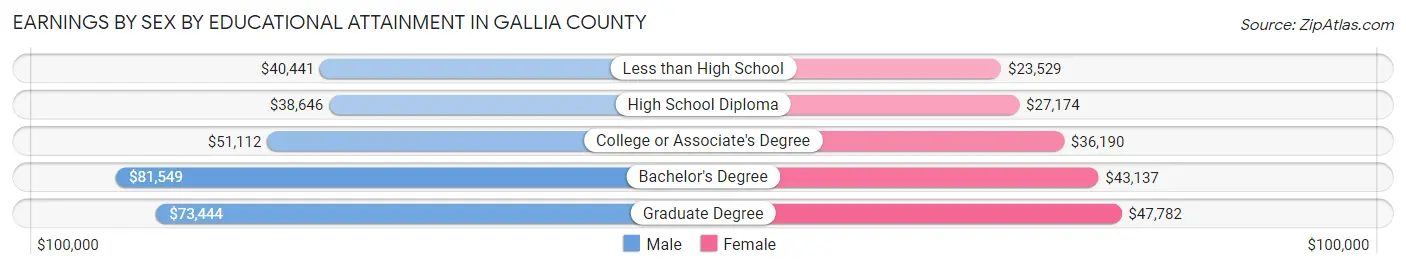
Earnings by Sex by Educational Attainment in Gallia County
Average earnings in Gallia County are $50,150 for men and $34,925 for women, a difference of 30.4%. Men with an educational attainment of bachelor's degree enjoy the highest average annual earnings of $81,549, while those with high school diploma education earn the least with $38,646. Women with an educational attainment of graduate degree earn the most with the average annual earnings of $47,782, while those with less than high school education have the smallest earnings of $23,529.
| Educational Attainment | Male Income | Female Income |
| Less than High School | $40,441 | $23,529 |
| High School Diploma | $38,646 | $27,174 |
| College or Associate's Degree | $51,112 | $36,190 |
| Bachelor's Degree | $81,549 | $43,137 |
| Graduate Degree | $73,444 | $47,782 |
| Total | $50,150 | $34,925 |
Family Income in Gallia County
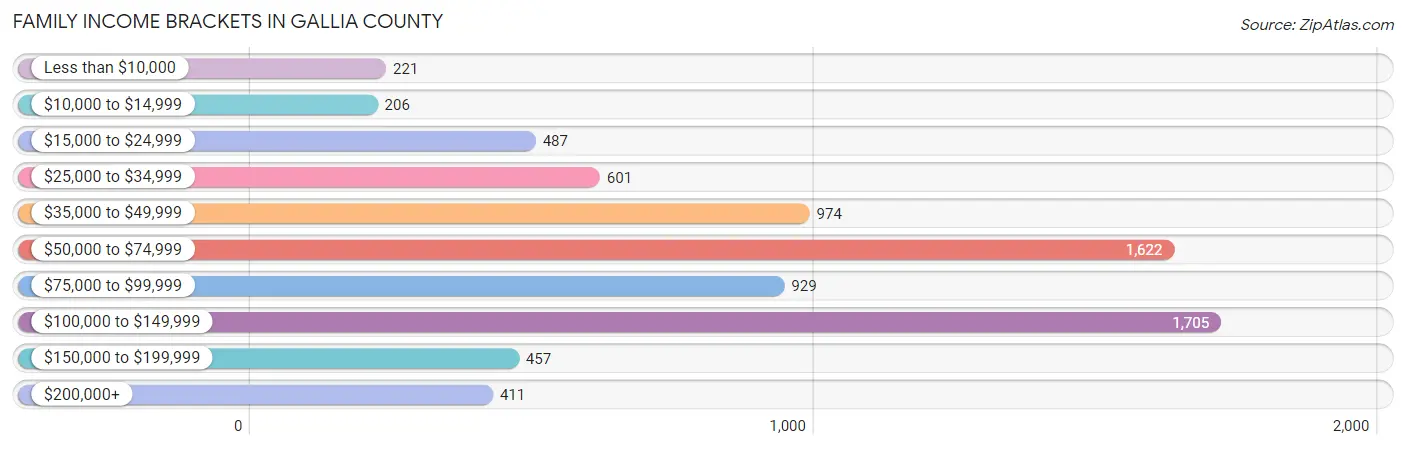
Family Income Brackets in Gallia County
According to the Gallia County family income data, there are 1,705 families falling into the $100,000 to $149,999 income range, which is the most common income bracket and makes up 22.4% of all families. Conversely, the $10,000 to $14,999 income bracket is the least frequent group with only 206 families (2.7%) belonging to this category.
| Income Bracket | # Families | % Families |
| Less than $10,000 | 221 | 2.9% |
| $10,000 to $14,999 | 206 | 2.7% |
| $15,000 to $24,999 | 487 | 6.4% |
| $25,000 to $34,999 | 601 | 7.9% |
| $35,000 to $49,999 | 974 | 12.8% |
| $50,000 to $74,999 | 1,622 | 21.3% |
| $75,000 to $99,999 | 929 | 12.2% |
| $100,000 to $149,999 | 1,705 | 22.4% |
| $150,000 to $199,999 | 457 | 6.0% |
| $200,000+ | 411 | 5.4% |
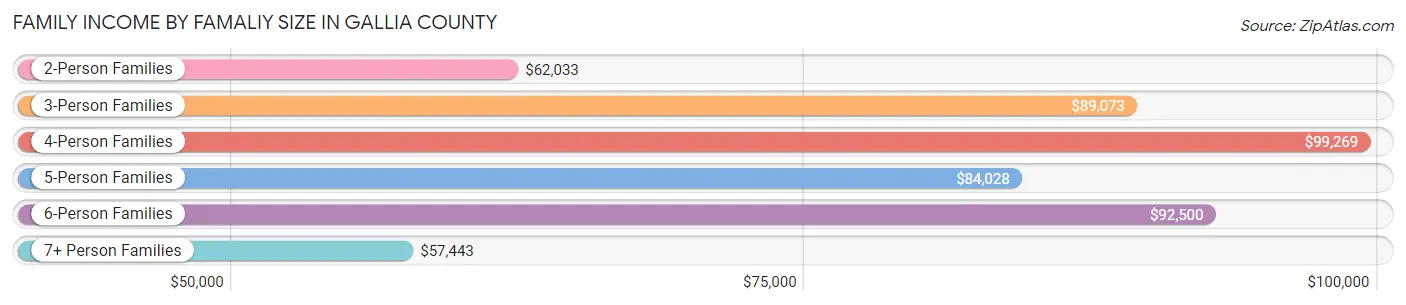
Family Income by Famaliy Size in Gallia County
4-person families (1,454 | 19.1%) account for the highest median family income in Gallia County with $99,269 per family, while 2-person families (3,840 | 50.4%) have the highest median income of $31,016 per family member.
| Income Bracket | # Families | Median Income |
| 2-Person Families | 3,840 (50.4%) | $62,033 |
| 3-Person Families | 1,559 (20.5%) | $89,073 |
| 4-Person Families | 1,454 (19.1%) | $99,269 |
| 5-Person Families | 357 (4.7%) | $84,028 |
| 6-Person Families | 164 (2.1%) | $92,500 |
| 7+ Person Families | 239 (3.1%) | $57,443 |
| Total | 7,613 (100.0%) | $69,521 |
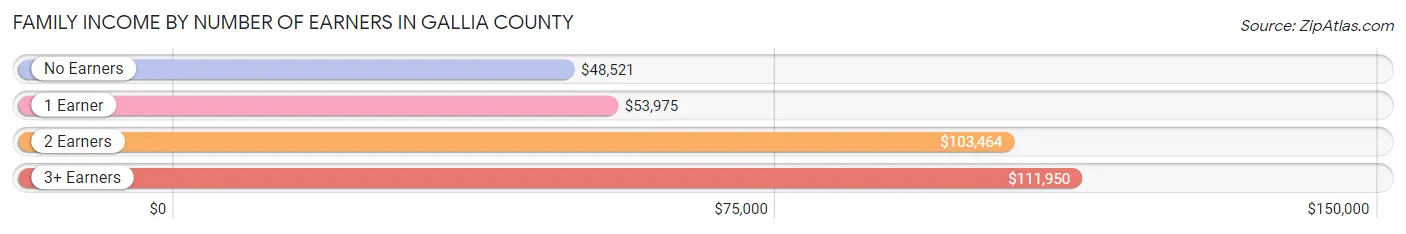
Family Income by Number of Earners in Gallia County
The median family income in Gallia County is $69,521, with families comprising 3+ earners (656) having the highest median family income of $111,950, while families with no earners (1,642) have the lowest median family income of $48,521, accounting for 8.6% and 21.6% of families, respectively.
| Number of Earners | # Families | Median Income |
| No Earners | 1,642 (21.6%) | $48,521 |
| 1 Earner | 2,643 (34.7%) | $53,975 |
| 2 Earners | 2,672 (35.1%) | $103,464 |
| 3+ Earners | 656 (8.6%) | $111,950 |
| Total | 7,613 (100.0%) | $69,521 |
Household Income in Gallia County
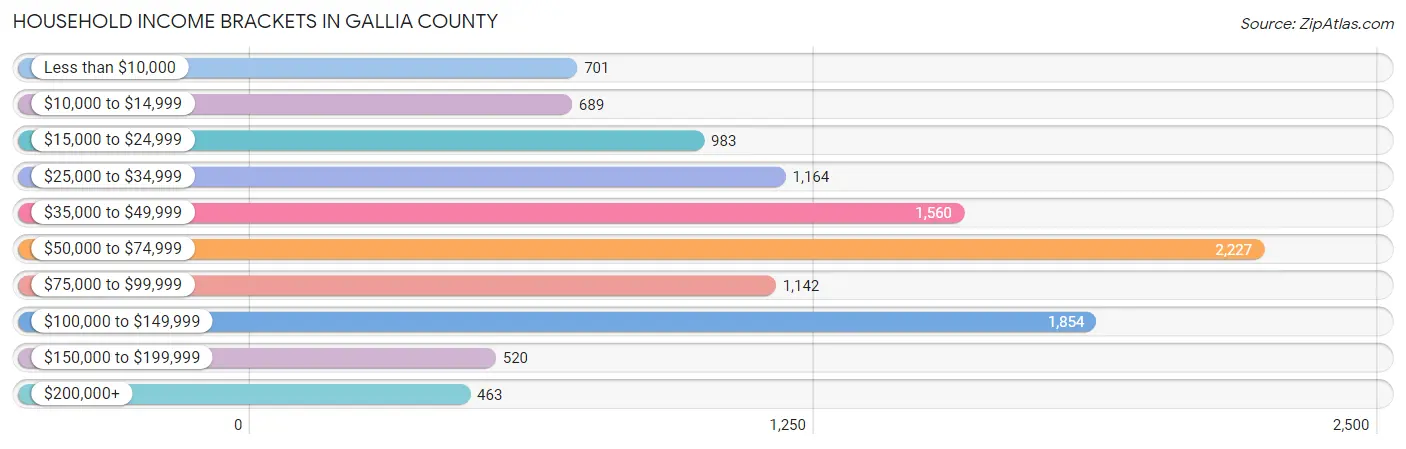
Household Income Brackets in Gallia County
With 2,227 households falling in the category, the $50,000 to $74,999 income range is the most frequent in Gallia County, accounting for 19.7% of all households. In contrast, only 463 households (4.1%) fall into the $200,000+ income bracket, making it the least populous group.
| Income Bracket | # Households | % Households |
| Less than $10,000 | 701 | 6.2% |
| $10,000 to $14,999 | 689 | 6.1% |
| $15,000 to $24,999 | 983 | 8.7% |
| $25,000 to $34,999 | 1,164 | 10.3% |
| $35,000 to $49,999 | 1,560 | 13.8% |
| $50,000 to $74,999 | 2,227 | 19.7% |
| $75,000 to $99,999 | 1,142 | 10.1% |
| $100,000 to $149,999 | 1,854 | 16.4% |
| $150,000 to $199,999 | 520 | 4.6% |
| $200,000+ | 463 | 4.1% |
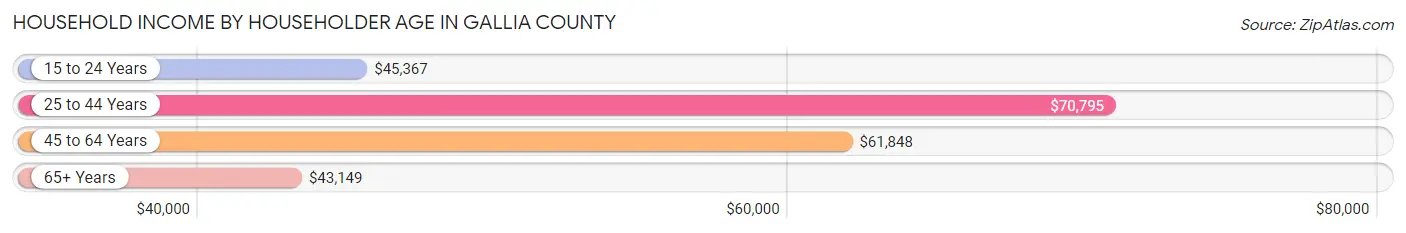
Household Income by Householder Age in Gallia County
The median household income in Gallia County is $55,533, with the highest median household income of $70,795 found in the 25 to 44 years age bracket for the primary householder. A total of 2,966 households (26.2%) fall into this category. Meanwhile, the 65+ years age bracket for the primary householder has the lowest median household income of $43,149, with 3,562 households (31.5%) in this group.
| Income Bracket | # Households | Median Income |
| 15 to 24 Years | 360 (3.2%) | $45,367 |
| 25 to 44 Years | 2,966 (26.2%) | $70,795 |
| 45 to 64 Years | 4,415 (39.1%) | $61,848 |
| 65+ Years | 3,562 (31.5%) | $43,149 |
| Total | 11,303 (100.0%) | $55,533 |
Poverty in Gallia County
Income Below Poverty by Sex and Age in Gallia County
With 17.6% poverty level for males and 16.7% for females among the residents of Gallia County, 12 to 14 year old males and 5 year old females are the most vulnerable to poverty, with 215 males (44.7%) and 92 females (42.4%) in their respective age groups living below the poverty level.
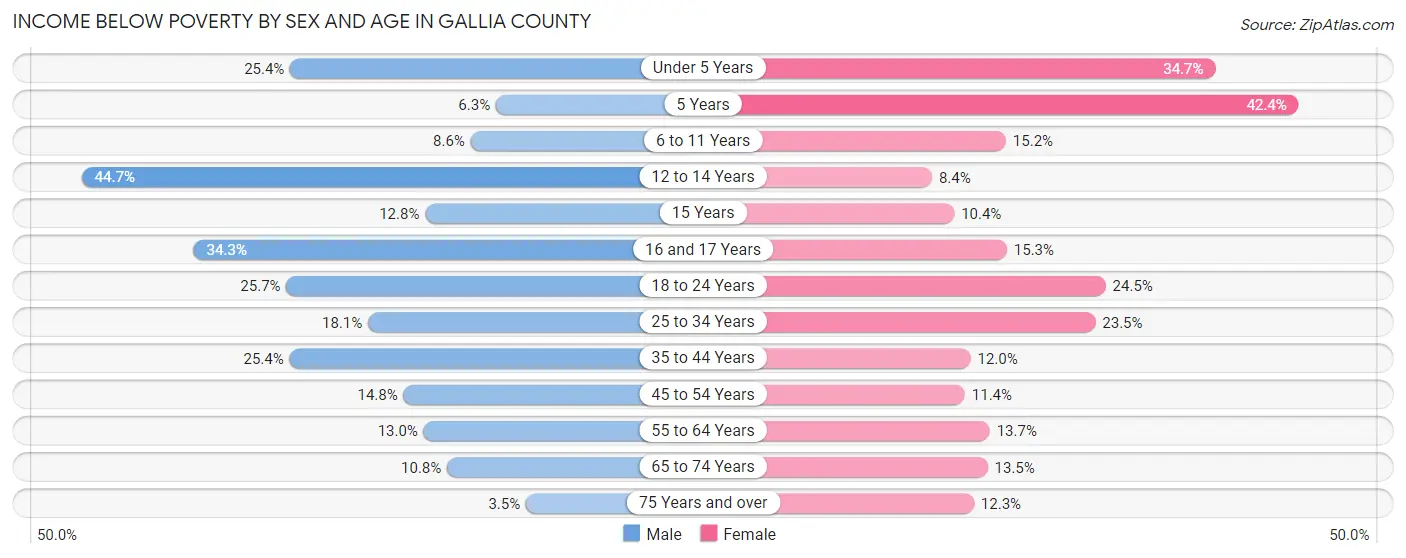
| Age Bracket | Male | Female |
| Under 5 Years | 238 (25.4%) | 314 (34.7%) |
| 5 Years | 10 (6.2%) | 92 (42.4%) |
| 6 to 11 Years | 110 (8.6%) | 177 (15.2%) |
| 12 to 14 Years | 215 (44.7%) | 38 (8.4%) |
| 15 Years | 15 (12.8%) | 17 (10.4%) |
| 16 and 17 Years | 163 (34.3%) | 68 (15.3%) |
| 18 to 24 Years | 292 (25.7%) | 263 (24.5%) |
| 25 to 34 Years | 312 (18.1%) | 400 (23.5%) |
| 35 to 44 Years | 418 (25.4%) | 197 (11.9%) |
| 45 to 54 Years | 250 (14.8%) | 196 (11.4%) |
| 55 to 64 Years | 258 (13.0%) | 292 (13.7%) |
| 65 to 74 Years | 166 (10.8%) | 220 (13.5%) |
| 75 Years and over | 31 (3.5%) | 164 (12.3%) |
| Total | 2,478 (17.6%) | 2,438 (16.7%) |
Income Above Poverty by Sex and Age in Gallia County
According to the poverty statistics in Gallia County, males aged 75 years and over and females aged 12 to 14 years are the age groups that are most secure financially, with 96.5% of males and 91.6% of females in these age groups living above the poverty line.
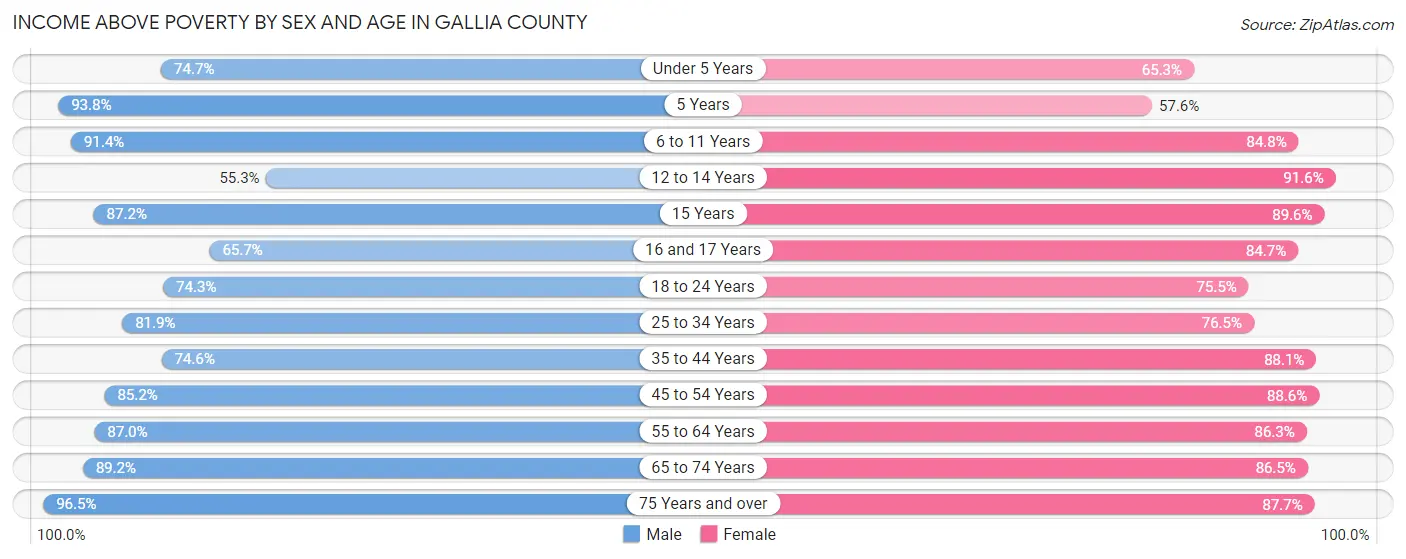
| Age Bracket | Male | Female |
| Under 5 Years | 701 (74.7%) | 592 (65.3%) |
| 5 Years | 150 (93.8%) | 125 (57.6%) |
| 6 to 11 Years | 1,169 (91.4%) | 985 (84.8%) |
| 12 to 14 Years | 266 (55.3%) | 416 (91.6%) |
| 15 Years | 102 (87.2%) | 146 (89.6%) |
| 16 and 17 Years | 312 (65.7%) | 376 (84.7%) |
| 18 to 24 Years | 844 (74.3%) | 811 (75.5%) |
| 25 to 34 Years | 1,410 (81.9%) | 1,300 (76.5%) |
| 35 to 44 Years | 1,227 (74.6%) | 1,452 (88.0%) |
| 45 to 54 Years | 1,436 (85.2%) | 1,520 (88.6%) |
| 55 to 64 Years | 1,733 (87.0%) | 1,835 (86.3%) |
| 65 to 74 Years | 1,372 (89.2%) | 1,406 (86.5%) |
| 75 Years and over | 864 (96.5%) | 1,174 (87.7%) |
| Total | 11,586 (82.4%) | 12,138 (83.3%) |
Income Below Poverty Among Married-Couple Families in Gallia County
The poverty statistics for married-couple families in Gallia County show that 7.6% or 460 of the total 6,069 families live below the poverty line. Families with 3 or 4 children have the highest poverty rate of 33.6%, comprising of 151 families. On the other hand, families with no children have the lowest poverty rate of 3.8%, which includes 141 families.
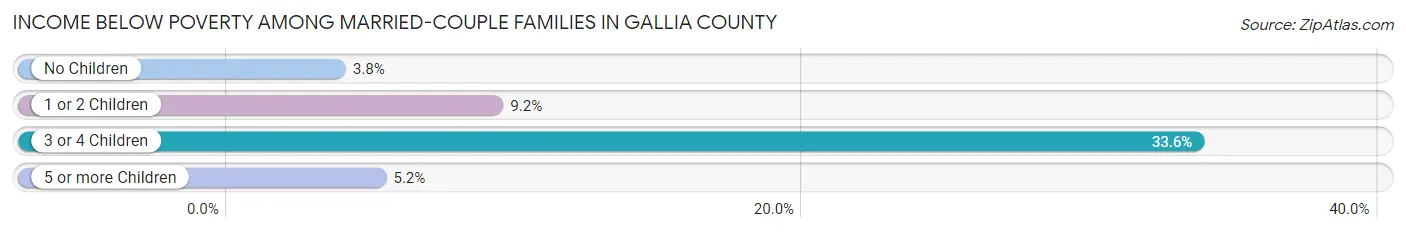
| Children | Above Poverty | Below Poverty |
| No Children | 3,610 (96.2%) | 141 (3.8%) |
| 1 or 2 Children | 1,591 (90.8%) | 162 (9.2%) |
| 3 or 4 Children | 298 (66.4%) | 151 (33.6%) |
| 5 or more Children | 110 (94.8%) | 6 (5.2%) |
| Total | 5,609 (92.4%) | 460 (7.6%) |
Income Below Poverty Among Single-Parent Households in Gallia County
According to the poverty data in Gallia County, 26.2% or 139 single-father households and 26.8% or 271 single-mother households are living below the poverty line. Among single-father households, those with 5 or more children have the highest poverty rate, with 5 households (100.0%) experiencing poverty. Likewise, among single-mother households, those with 1 or 2 children have the highest poverty rate, with 184 households (38.6%) falling below the poverty line.
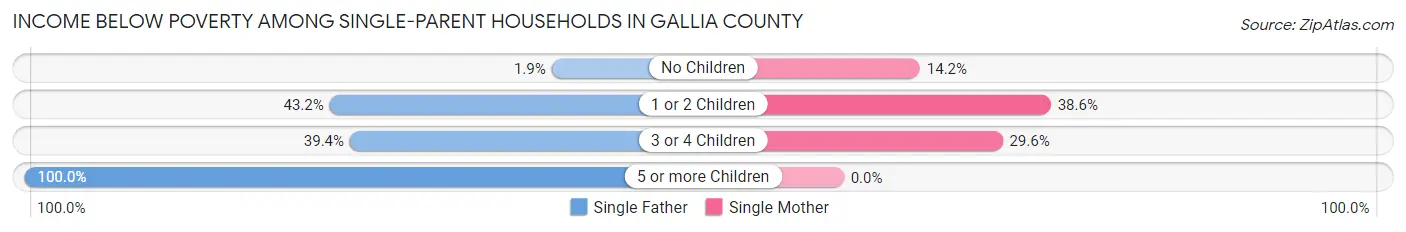
| Children | Single Father | Single Mother |
| No Children | 4 (1.8%) | 66 (14.2%) |
| 1 or 2 Children | 89 (43.2%) | 184 (38.6%) |
| 3 or 4 Children | 41 (39.4%) | 21 (29.6%) |
| 5 or more Children | 5 (100.0%) | 0 (0.0%) |
| Total | 139 (26.2%) | 271 (26.8%) |
Income Below Poverty Among Married-Couple vs Single-Parent Households in Gallia County
The poverty data for Gallia County shows that 460 of the married-couple family households (7.6%) and 410 of the single-parent households (26.6%) are living below the poverty level. Within the married-couple family households, those with 3 or 4 children have the highest poverty rate, with 151 households (33.6%) falling below the poverty line. Among the single-parent households, those with 5 or more children have the highest poverty rate, with 5 household (100.0%) living below poverty.
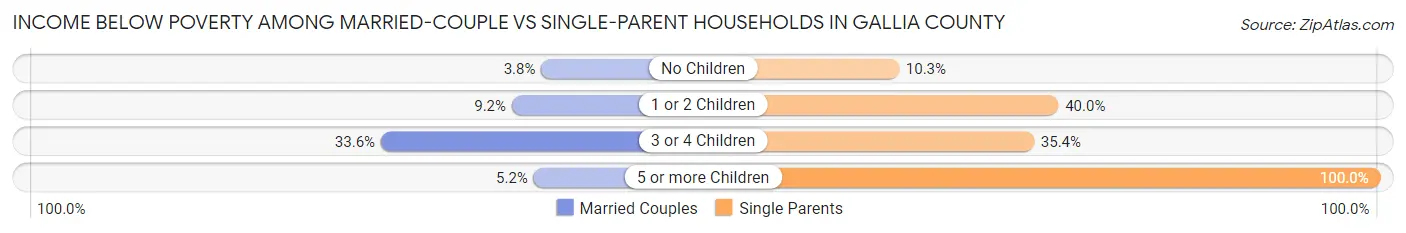
| Children | Married-Couple Families | Single-Parent Households |
| No Children | 141 (3.8%) | 70 (10.3%) |
| 1 or 2 Children | 162 (9.2%) | 273 (40.0%) |
| 3 or 4 Children | 151 (33.6%) | 62 (35.4%) |
| 5 or more Children | 6 (5.2%) | 5 (100.0%) |
| Total | 460 (7.6%) | 410 (26.6%) |
Race in Gallia County
The most populous races in Gallia County are White / Caucasian (27,210 | 92.9%), Two or more Races (1,088 | 3.7%), and Black / African American (539 | 1.8%).
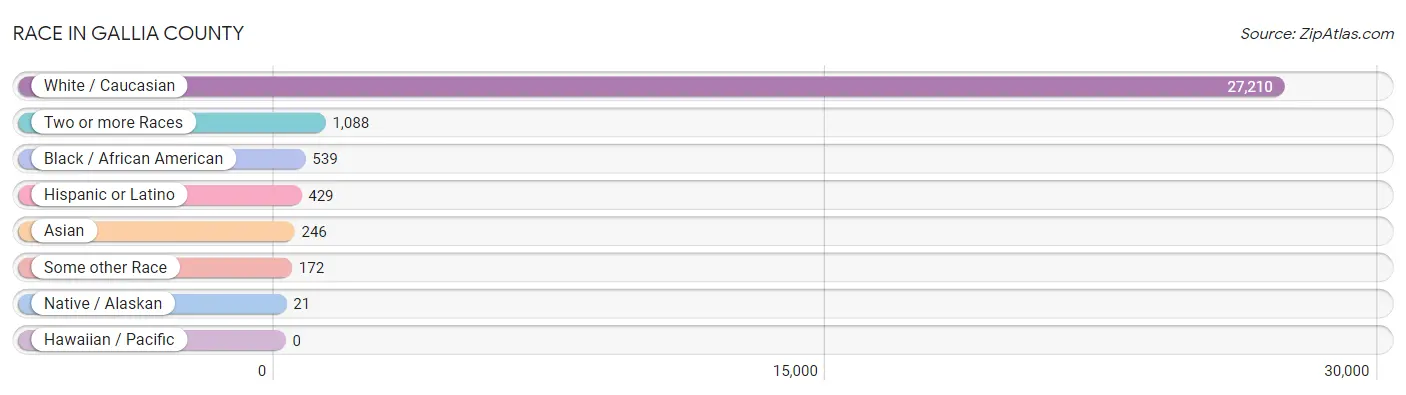
| Race | # Population | % Population |
| Asian | 246 | 0.8% |
| Black / African American | 539 | 1.8% |
| Hawaiian / Pacific | 0 | 0.0% |
| Hispanic or Latino | 429 | 1.5% |
| Native / Alaskan | 21 | 0.1% |
| White / Caucasian | 27,210 | 92.9% |
| Two or more Races | 1,088 | 3.7% |
| Some other Race | 172 | 0.6% |
| Total | 29,276 | 100.0% |
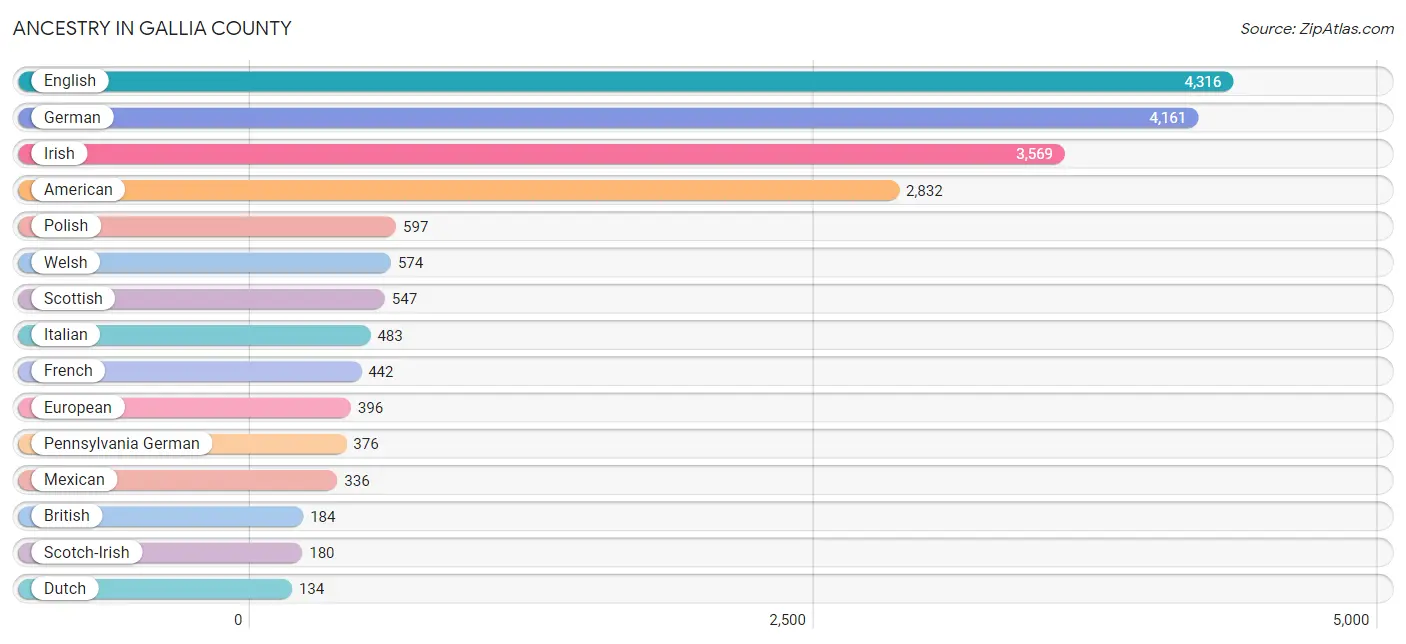
Ancestry in Gallia County
The most populous ancestries reported in Gallia County are English (4,316 | 14.7%), German (4,161 | 14.2%), Irish (3,569 | 12.2%), American (2,832 | 9.7%), and Polish (597 | 2.0%), together accounting for 52.8% of all Gallia County residents.
| Ancestry | # Population | % Population |
| African | 39 | 0.1% |
| American | 2,832 | 9.7% |
| Arab | 3 | 0.0% |
| Austrian | 7 | 0.0% |
| Belgian | 2 | 0.0% |
| Bhutanese | 16 | 0.1% |
| Blackfeet | 115 | 0.4% |
| Brazilian | 13 | 0.0% |
| British | 184 | 0.6% |
| Bulgarian | 34 | 0.1% |
| Burmese | 18 | 0.1% |
| Cajun | 3 | 0.0% |
| Canadian | 60 | 0.2% |
| Cherokee | 82 | 0.3% |
| Chickasaw | 9 | 0.0% |
| Chilean | 2 | 0.0% |
| Croatian | 37 | 0.1% |
| Czech | 12 | 0.0% |
| Dutch | 134 | 0.5% |
| Dutch West Indian | 9 | 0.0% |
| Eastern European | 13 | 0.0% |
| Ecuadorian | 3 | 0.0% |
| English | 4,316 | 14.7% |
| European | 396 | 1.3% |
| Finnish | 9 | 0.0% |
| French | 442 | 1.5% |
| French Canadian | 26 | 0.1% |
| German | 4,161 | 14.2% |
| Greek | 17 | 0.1% |
| Hungarian | 28 | 0.1% |
| Indian (Asian) | 35 | 0.1% |
| Iranian | 12 | 0.0% |
| Irish | 3,569 | 12.2% |
| Italian | 483 | 1.7% |
| Jamaican | 98 | 0.3% |
| Korean | 112 | 0.4% |
| Lebanese | 3 | 0.0% |
| Lithuanian | 24 | 0.1% |
| Mexican | 336 | 1.1% |
| Northern European | 80 | 0.3% |
| Norwegian | 40 | 0.1% |
| Pennsylvania German | 376 | 1.3% |
| Polish | 597 | 2.0% |
| Portuguese | 1 | 0.0% |
| Puerto Rican | 14 | 0.1% |
| Russian | 53 | 0.2% |
| Samoan | 3 | 0.0% |
| Scandinavian | 2 | 0.0% |
| Scotch-Irish | 180 | 0.6% |
| Scottish | 547 | 1.9% |
| Slovak | 61 | 0.2% |
| South American | 69 | 0.2% |
| Spanish | 10 | 0.0% |
| Subsaharan African | 39 | 0.1% |
| Swedish | 9 | 0.0% |
| Swiss | 72 | 0.3% |
| Thai | 60 | 0.2% |
| Ukrainian | 17 | 0.1% |
| Venezuelan | 64 | 0.2% |
| Welsh | 574 | 2.0% | View All 60 Rows |
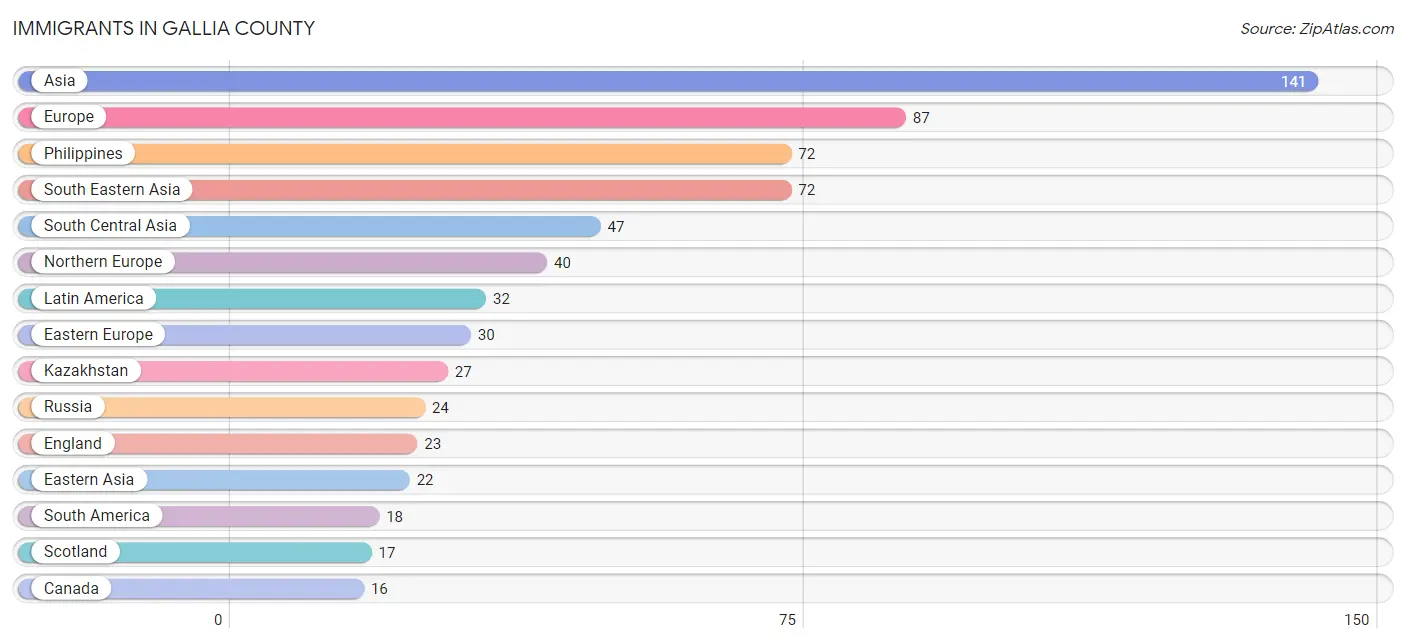
Immigrants in Gallia County
The most numerous immigrant groups reported in Gallia County came from Asia (141 | 0.5%), Europe (87 | 0.3%), Philippines (72 | 0.3%), South Eastern Asia (72 | 0.3%), and South Central Asia (47 | 0.2%), together accounting for 1.4% of all Gallia County residents.
| Immigration Origin | # Population | % Population |
| Asia | 141 | 0.5% |
| Brazil | 13 | 0.0% |
| Canada | 16 | 0.1% |
| Central America | 14 | 0.1% |
| Chile | 2 | 0.0% |
| China | 16 | 0.1% |
| Eastern Asia | 22 | 0.1% |
| Eastern Europe | 30 | 0.1% |
| Ecuador | 3 | 0.0% |
| England | 23 | 0.1% |
| Europe | 87 | 0.3% |
| Germany | 12 | 0.0% |
| Greece | 5 | 0.0% |
| India | 9 | 0.0% |
| Japan | 6 | 0.0% |
| Kazakhstan | 27 | 0.1% |
| Latin America | 32 | 0.1% |
| Mexico | 14 | 0.1% |
| Northern Europe | 40 | 0.1% |
| Philippines | 72 | 0.3% |
| Poland | 6 | 0.0% |
| Russia | 24 | 0.1% |
| Scotland | 17 | 0.1% |
| South America | 18 | 0.1% |
| South Central Asia | 47 | 0.2% |
| South Eastern Asia | 72 | 0.3% |
| Southern Europe | 5 | 0.0% |
| Taiwan | 16 | 0.1% |
| Western Europe | 12 | 0.0% | View All 29 Rows |
Sex and Age in Gallia County
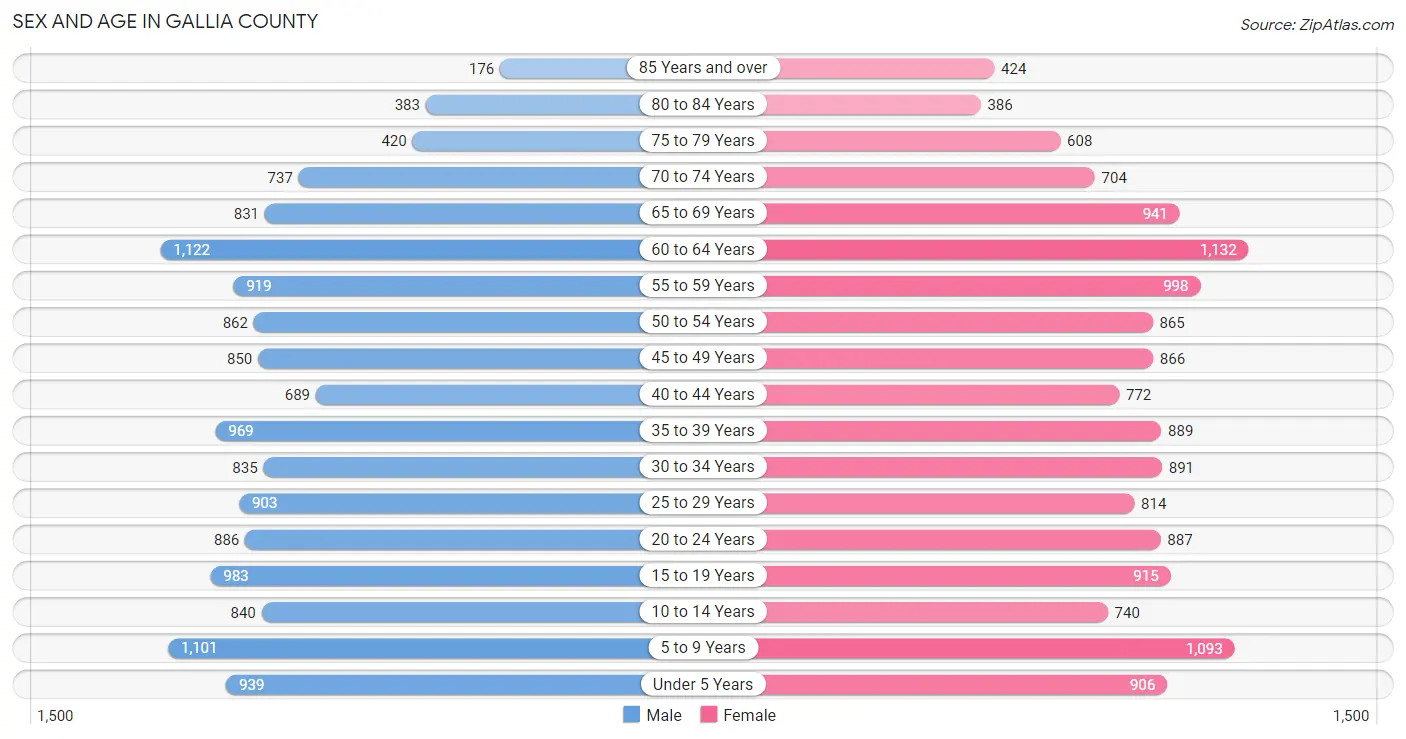
Sex and Age in Gallia County
The most populous age groups in Gallia County are 60 to 64 Years (1,122 | 7.8%) for men and 60 to 64 Years (1,132 | 7.6%) for women.
| Age Bracket | Male | Female |
| Under 5 Years | 939 (6.5%) | 906 (6.1%) |
| 5 to 9 Years | 1,101 (7.6%) | 1,093 (7.4%) |
| 10 to 14 Years | 840 (5.8%) | 740 (5.0%) |
| 15 to 19 Years | 983 (6.8%) | 915 (6.2%) |
| 20 to 24 Years | 886 (6.1%) | 887 (6.0%) |
| 25 to 29 Years | 903 (6.2%) | 814 (5.5%) |
| 30 to 34 Years | 835 (5.8%) | 891 (6.0%) |
| 35 to 39 Years | 969 (6.7%) | 889 (6.0%) |
| 40 to 44 Years | 689 (4.8%) | 772 (5.2%) |
| 45 to 49 Years | 850 (5.9%) | 866 (5.8%) |
| 50 to 54 Years | 862 (6.0%) | 865 (5.8%) |
| 55 to 59 Years | 919 (6.4%) | 998 (6.7%) |
| 60 to 64 Years | 1,122 (7.8%) | 1,132 (7.6%) |
| 65 to 69 Years | 831 (5.8%) | 941 (6.3%) |
| 70 to 74 Years | 737 (5.1%) | 704 (4.8%) |
| 75 to 79 Years | 420 (2.9%) | 608 (4.1%) |
| 80 to 84 Years | 383 (2.6%) | 386 (2.6%) |
| 85 Years and over | 176 (1.2%) | 424 (2.9%) |
| Total | 14,445 (100.0%) | 14,831 (100.0%) |
Families and Households in Gallia County
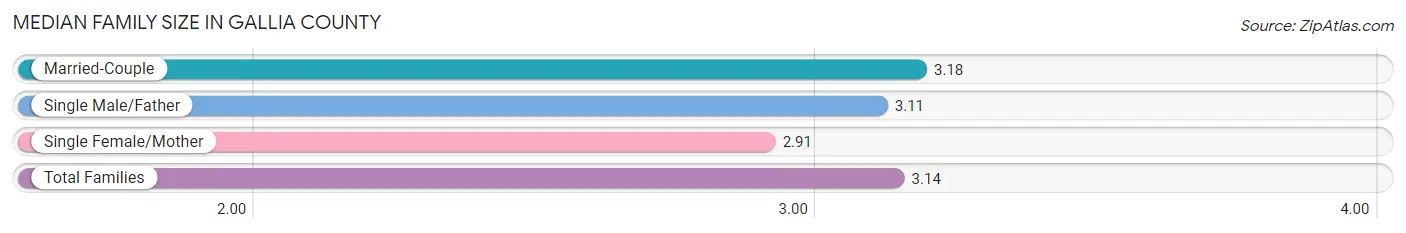
Median Family Size in Gallia County
The median family size in Gallia County is 3.14 persons per family, with married-couple families (6,069 | 79.7%) accounting for the largest median family size of 3.18 persons per family. On the other hand, single female/mother families (1,013 | 13.3%) represent the smallest median family size with 2.91 persons per family.
| Family Type | # Families | Family Size |
| Married-Couple | 6,069 (79.7%) | 3.18 |
| Single Male/Father | 531 (7.0%) | 3.11 |
| Single Female/Mother | 1,013 (13.3%) | 2.91 |
| Total Families | 7,613 (100.0%) | 3.14 |
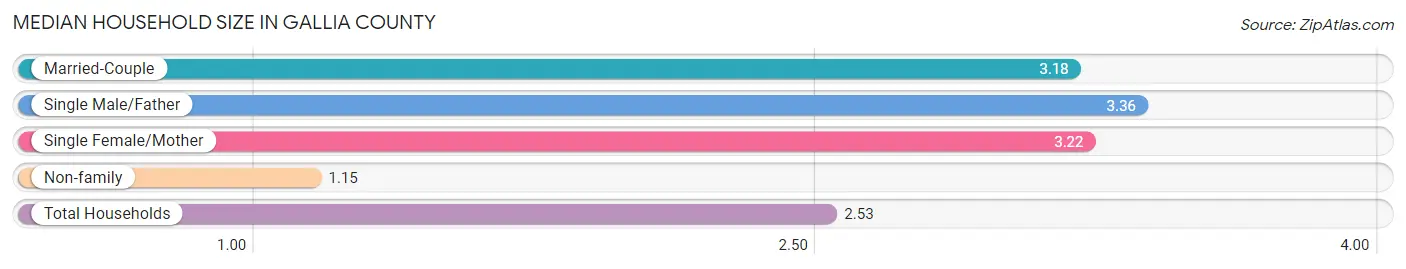
Median Household Size in Gallia County
The median household size in Gallia County is 2.53 persons per household, with single male/father households (531 | 4.7%) accounting for the largest median household size of 3.36 persons per household. non-family households (3,690 | 32.7%) represent the smallest median household size with 1.15 persons per household.
| Household Type | # Households | Household Size |
| Married-Couple | 6,069 (53.7%) | 3.18 |
| Single Male/Father | 531 (4.7%) | 3.36 |
| Single Female/Mother | 1,013 (9.0%) | 3.22 |
| Non-family | 3,690 (32.7%) | 1.15 |
| Total Households | 11,303 (100.0%) | 2.53 |
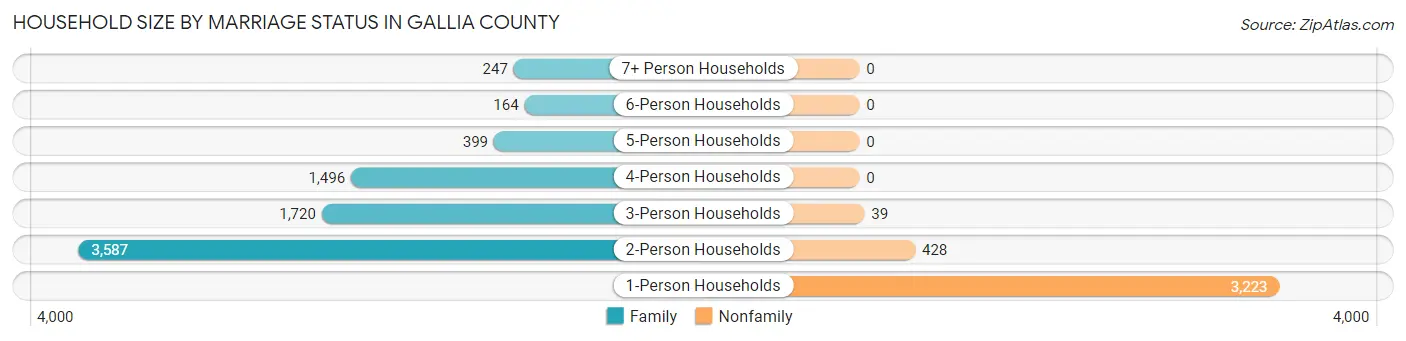
Household Size by Marriage Status in Gallia County
Out of a total of 11,303 households in Gallia County, 7,613 (67.3%) are family households, while 3,690 (32.7%) are nonfamily households. The most numerous type of family households are 2-person households, comprising 3,587, and the most common type of nonfamily households are 1-person households, comprising 3,223.
| Household Size | Family Households | Nonfamily Households |
| 1-Person Households | - | 3,223 (28.5%) |
| 2-Person Households | 3,587 (31.7%) | 428 (3.8%) |
| 3-Person Households | 1,720 (15.2%) | 39 (0.4%) |
| 4-Person Households | 1,496 (13.2%) | 0 (0.0%) |
| 5-Person Households | 399 (3.5%) | 0 (0.0%) |
| 6-Person Households | 164 (1.5%) | 0 (0.0%) |
| 7+ Person Households | 247 (2.2%) | 0 (0.0%) |
| Total | 7,613 (67.3%) | 3,690 (32.7%) |
Female Fertility in Gallia County
Fertility by Age in Gallia County
Average fertility rate in Gallia County is 53.0 births per 1,000 women. Women in the age bracket of 20 to 34 years have the highest fertility rate with 117.0 births per 1,000 women. Women in the age bracket of 20 to 34 years acount for 92.1% of all women with births.
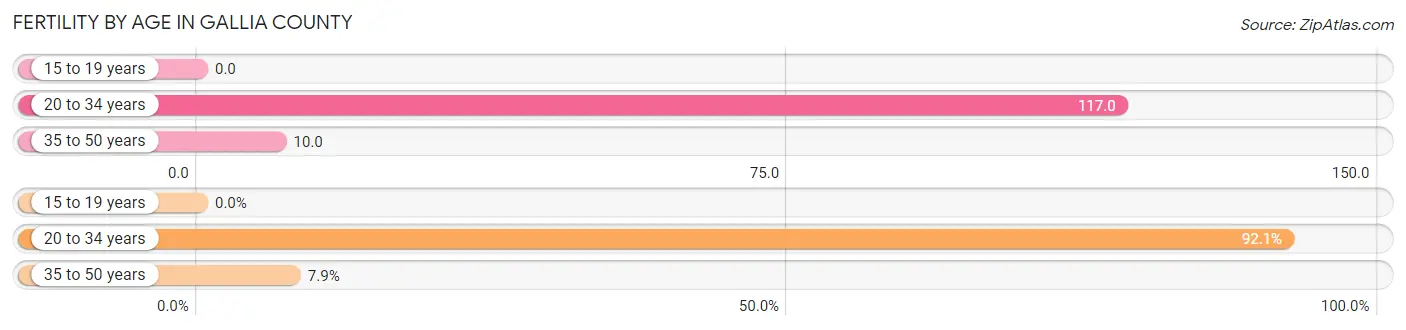
| Age Bracket | Women with Births | Births / 1,000 Women |
| 15 to 19 years | 0 (0.0%) | 0.0 |
| 20 to 34 years | 304 (92.1%) | 117.0 |
| 35 to 50 years | 26 (7.9%) | 10.0 |
| Total | 330 (100.0%) | 53.0 |
Fertility by Age by Marriage Status in Gallia County
80.6% of women with births (330) in Gallia County are married. The highest percentage of unmarried women with births falls into 35 to 50 years age bracket with 30.8% of them unmarried at the time of birth, while the lowest percentage of unmarried women with births belong to 20 to 34 years age bracket with 18.4% of them unmarried.
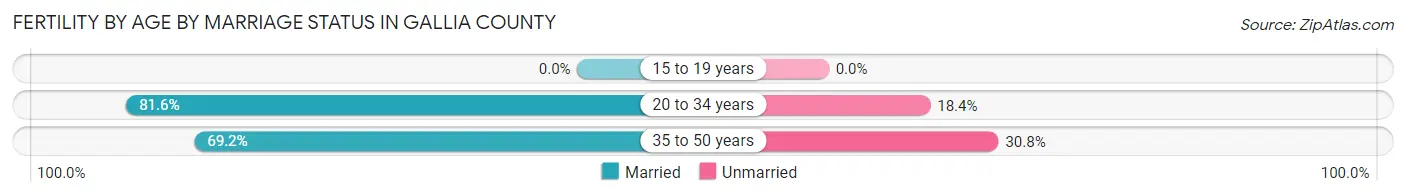
| Age Bracket | Married | Unmarried |
| 15 to 19 years | 0 (0.0%) | 0 (0.0%) |
| 20 to 34 years | 248 (81.6%) | 56 (18.4%) |
| 35 to 50 years | 18 (69.2%) | 8 (30.8%) |
| Total | 266 (80.6%) | 64 (19.4%) |
Fertility by Education in Gallia County
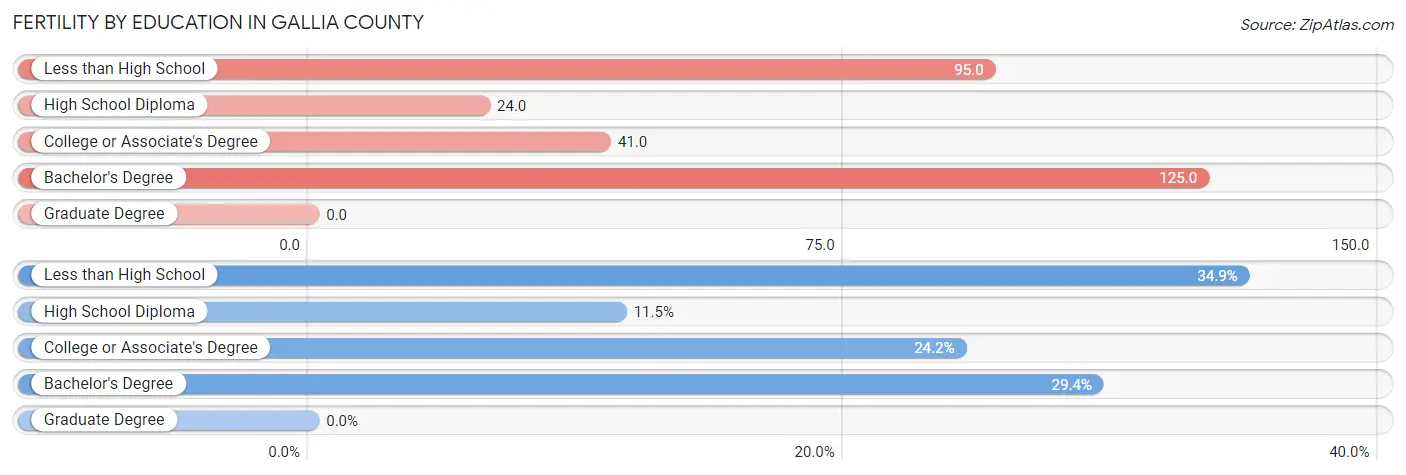
| Educational Attainment | Women with Births | Births / 1,000 Women |
| Less than High School | 115 (34.8%) | 95.0 |
| High School Diploma | 38 (11.5%) | 24.0 |
| College or Associate's Degree | 80 (24.2%) | 41.0 |
| Bachelor's Degree | 97 (29.4%) | 125.0 |
| Graduate Degree | 0 (0.0%) | 0.0 |
| Total | 330 (100.0%) | 53.0 |
Fertility by Education by Marriage Status in Gallia County
19.4% of women with births in Gallia County are unmarried. Women with the educational attainment of bachelor's degree are most likely to be married with 100.0% of them married at childbirth, while women with the educational attainment of high school diploma are least likely to be married with 60.5% of them unmarried at childbirth.
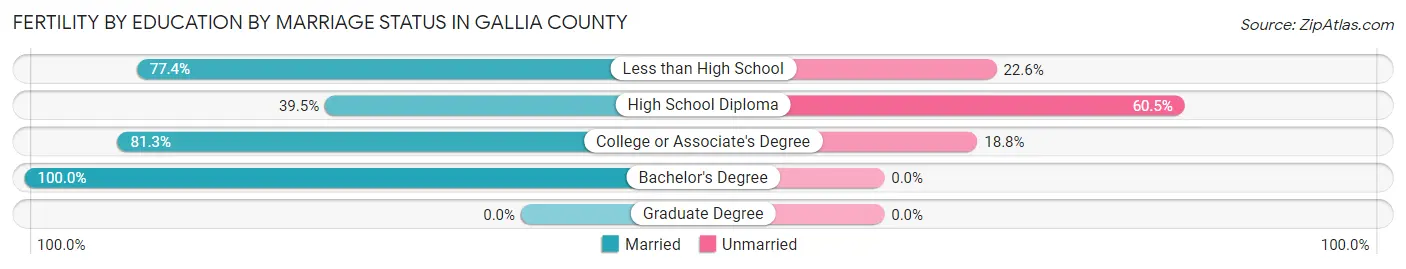
| Educational Attainment | Married | Unmarried |
| Less than High School | 89 (77.4%) | 26 (22.6%) |
| High School Diploma | 15 (39.5%) | 23 (60.5%) |
| College or Associate's Degree | 65 (81.2%) | 15 (18.8%) |
| Bachelor's Degree | 97 (100.0%) | 0 (0.0%) |
| Graduate Degree | 0 (0.0%) | 0 (0.0%) |
| Total | 266 (80.6%) | 64 (19.4%) |
Employment Characteristics in Gallia County
Employment by Class of Employer in Gallia County
Among the 11,616 employed individuals in Gallia County, private company employees (6,755 | 58.2%), local government employees (1,752 | 15.1%), and not-for-profit organizations (1,162 | 10.0%) make up the most common classes of employment.
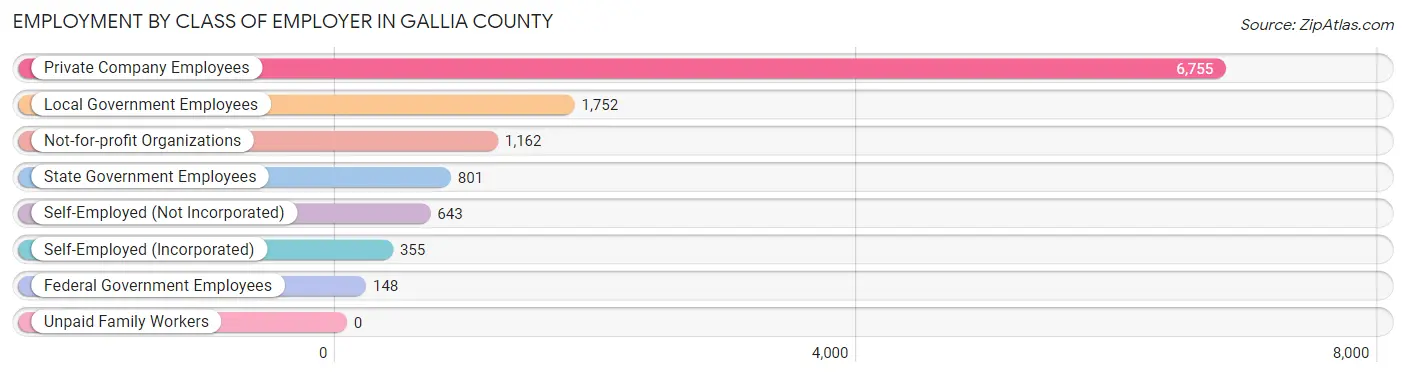
| Employer Class | # Employees | % Employees |
| Private Company Employees | 6,755 | 58.2% |
| Self-Employed (Incorporated) | 355 | 3.1% |
| Self-Employed (Not Incorporated) | 643 | 5.5% |
| Not-for-profit Organizations | 1,162 | 10.0% |
| Local Government Employees | 1,752 | 15.1% |
| State Government Employees | 801 | 6.9% |
| Federal Government Employees | 148 | 1.3% |
| Unpaid Family Workers | 0 | 0.0% |
| Total | 11,616 | 100.0% |
Employment Status by Age in Gallia County
According to the labor force statistics for Gallia County, out of the total population over 16 years of age (23,372), 52.7% or 12,317 individuals are in the labor force, with 4.1% or 505 of them unemployed. The age group with the highest labor force participation rate is 25 to 29 years, with 79.3% or 1,362 individuals in the labor force. Within the labor force, the 20 to 24 years age range has the highest percentage of unemployed individuals, with 23.9% or 279 of them being unemployed.
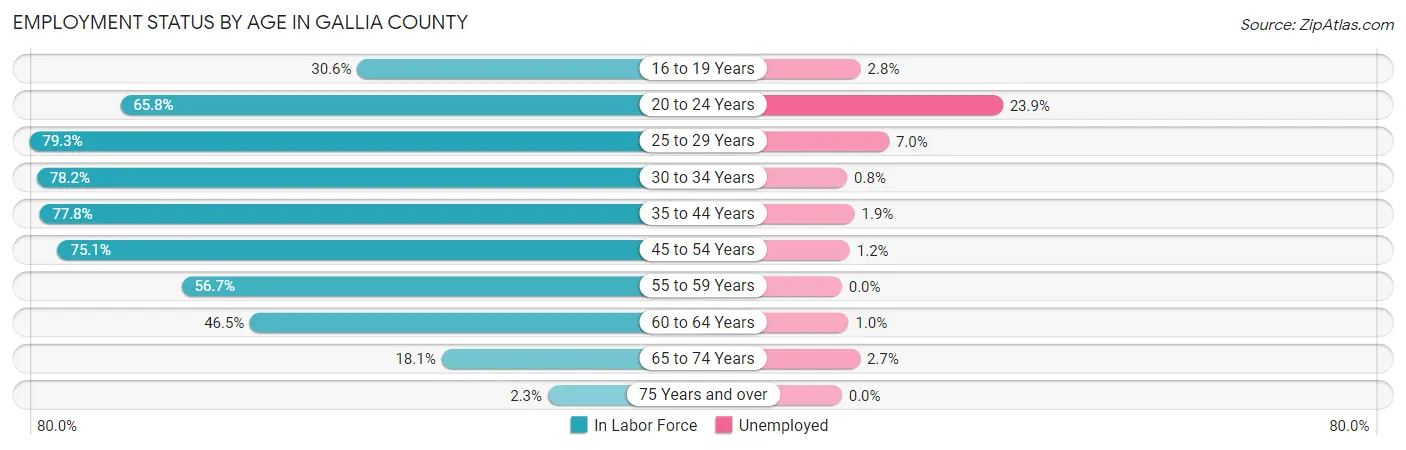
| Age Bracket | In Labor Force | Unemployed |
| 16 to 19 Years | 494 (30.6%) | 14 (2.8%) |
| 20 to 24 Years | 1,167 (65.8%) | 279 (23.9%) |
| 25 to 29 Years | 1,362 (79.3%) | 95 (7.0%) |
| 30 to 34 Years | 1,350 (78.2%) | 11 (0.8%) |
| 35 to 44 Years | 2,582 (77.8%) | 49 (1.9%) |
| 45 to 54 Years | 2,586 (75.1%) | 31 (1.2%) |
| 55 to 59 Years | 1,087 (56.7%) | 0 (0.0%) |
| 60 to 64 Years | 1,048 (46.5%) | 10 (1.0%) |
| 65 to 74 Years | 582 (18.1%) | 16 (2.7%) |
| 75 Years and over | 55 (2.3%) | 0 (0.0%) |
| Total | 12,317 (52.7%) | 505 (4.1%) |
Employment Status by Educational Attainment in Gallia County
According to labor force statistics for Gallia County, 69.6% of individuals (10,006) out of the total population between 25 and 64 years of age (14,376) are in the labor force, with 2.0% or 200 of them being unemployed. The group with the highest labor force participation rate are those with the educational attainment of bachelor's degree or higher, with 84.9% or 2,363 individuals in the labor force. Within the labor force, individuals with high school diploma education have the highest percentage of unemployment, with 3.8% or 133 of them being unemployed.
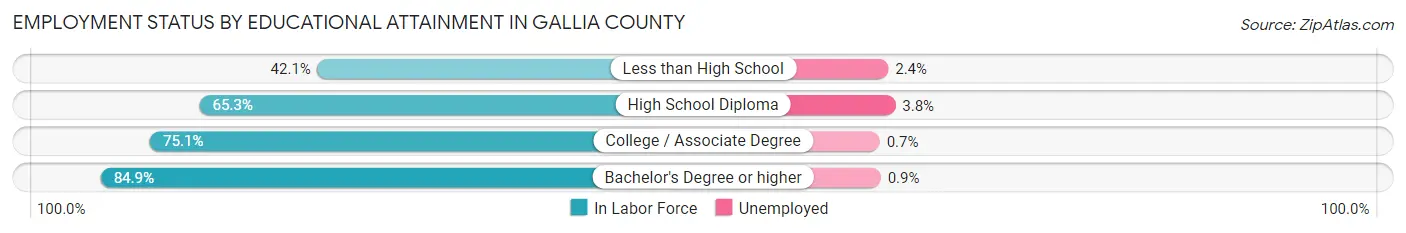
| Educational Attainment | In Labor Force | Unemployed |
| Less than High School | 677 (42.1%) | 39 (2.4%) |
| High School Diploma | 3,492 (65.3%) | 203 (3.8%) |
| College / Associate Degree | 3,484 (75.1%) | 32 (0.7%) |
| Bachelor's Degree or higher | 2,363 (84.9%) | 25 (0.9%) |
| Total | 10,006 (69.6%) | 288 (2.0%) |
Employment Occupations by Sex in Gallia County
Management, Business, Science and Arts Occupations
The most common Management, Business, Science and Arts occupations in Gallia County are Community & Social Service (1,225 | 10.4%), Management (932 | 7.9%), Health Diagnosing & Treating (882 | 7.5%), Education Instruction & Library (803 | 6.8%), and Computers, Engineering & Science (799 | 6.8%).
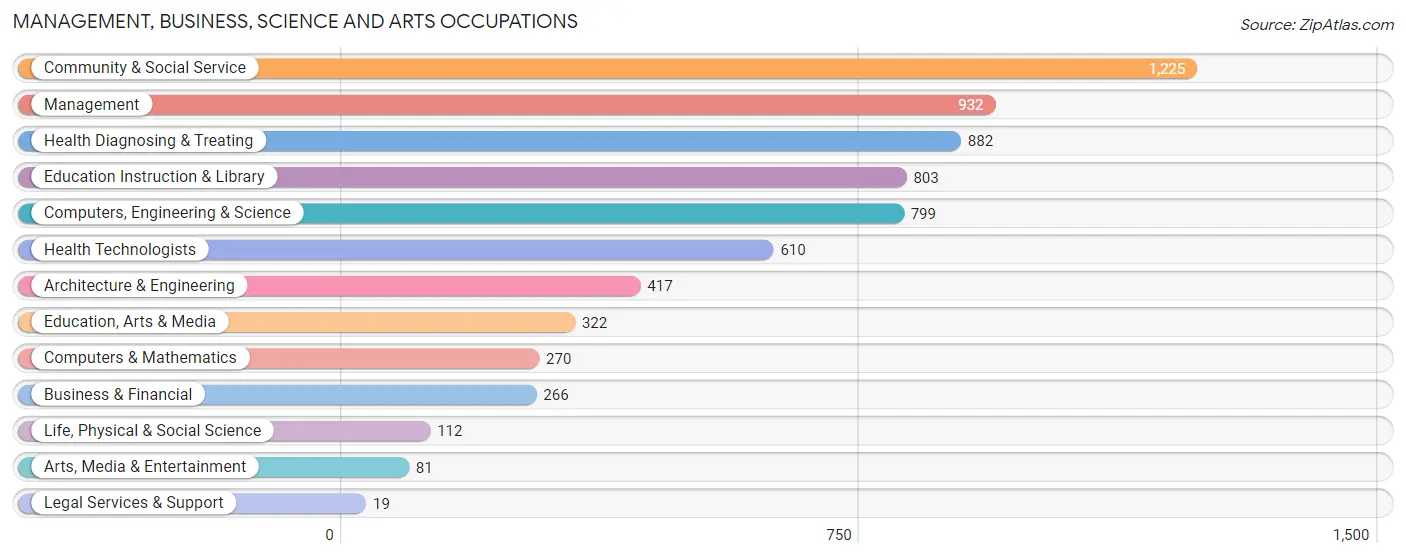
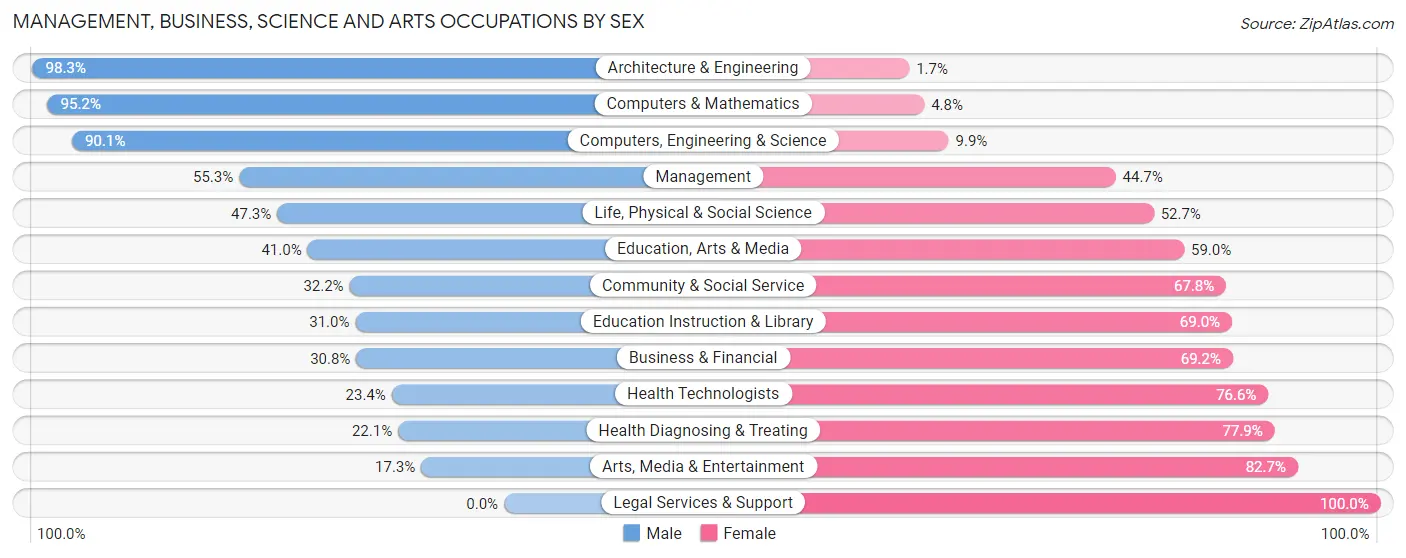
Management, Business, Science and Arts Occupations by Sex
Within the Management, Business, Science and Arts occupations in Gallia County, the most male-oriented occupations are Architecture & Engineering (98.3%), Computers & Mathematics (95.2%), and Computers, Engineering & Science (90.1%), while the most female-oriented occupations are Legal Services & Support (100.0%), Arts, Media & Entertainment (82.7%), and Health Diagnosing & Treating (77.9%).
| Occupation | Male | Female |
| Management | 515 (55.3%) | 417 (44.7%) |
| Business & Financial | 82 (30.8%) | 184 (69.2%) |
| Computers, Engineering & Science | 720 (90.1%) | 79 (9.9%) |
| Computers & Mathematics | 257 (95.2%) | 13 (4.8%) |
| Architecture & Engineering | 410 (98.3%) | 7 (1.7%) |
| Life, Physical & Social Science | 53 (47.3%) | 59 (52.7%) |
| Community & Social Service | 395 (32.2%) | 830 (67.8%) |
| Education, Arts & Media | 132 (41.0%) | 190 (59.0%) |
| Legal Services & Support | 0 (0.0%) | 19 (100.0%) |
| Education Instruction & Library | 249 (31.0%) | 554 (69.0%) |
| Arts, Media & Entertainment | 14 (17.3%) | 67 (82.7%) |
| Health Diagnosing & Treating | 195 (22.1%) | 687 (77.9%) |
| Health Technologists | 143 (23.4%) | 467 (76.6%) |
| Total (Category) | 1,907 (46.5%) | 2,197 (53.5%) |
| Total (Overall) | 6,194 (52.5%) | 5,612 (47.5%) |
Services Occupations
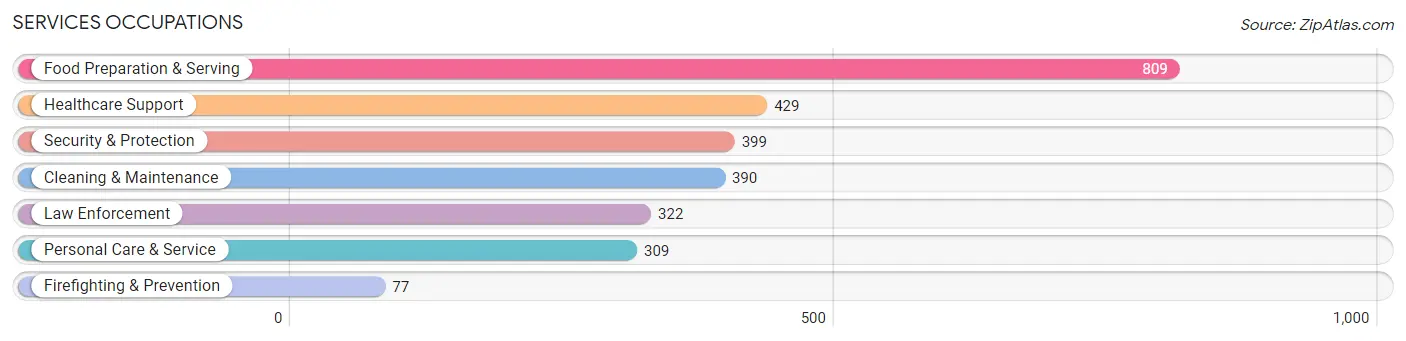
The most common Services occupations in Gallia County are Food Preparation & Serving (809 | 6.9%), Healthcare Support (429 | 3.6%), Security & Protection (399 | 3.4%), Cleaning & Maintenance (390 | 3.3%), and Law Enforcement (322 | 2.7%).
Services Occupations by Sex
Within the Services occupations in Gallia County, the most male-oriented occupations are Firefighting & Prevention (100.0%), Security & Protection (58.9%), and Cleaning & Maintenance (55.4%), while the most female-oriented occupations are Healthcare Support (81.6%), Personal Care & Service (75.7%), and Food Preparation & Serving (51.8%).
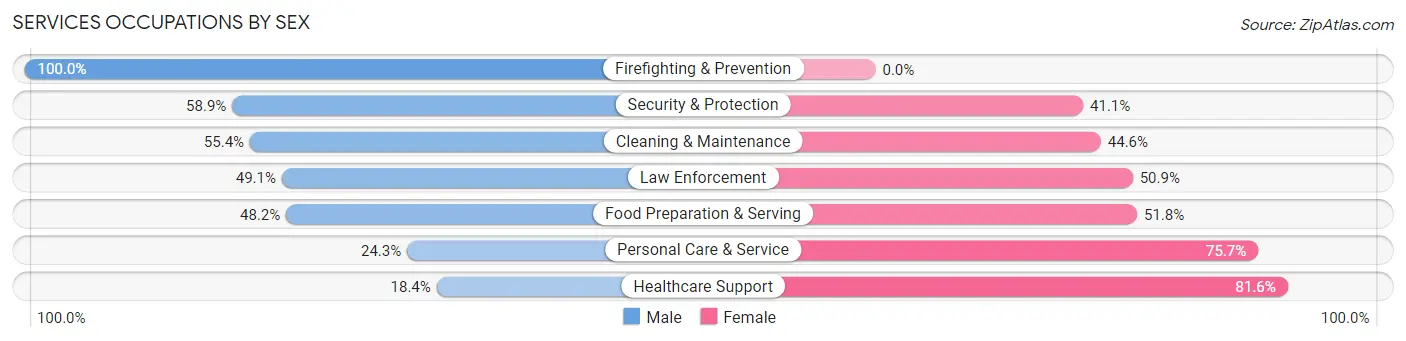
| Occupation | Male | Female |
| Healthcare Support | 79 (18.4%) | 350 (81.6%) |
| Security & Protection | 235 (58.9%) | 164 (41.1%) |
| Firefighting & Prevention | 77 (100.0%) | 0 (0.0%) |
| Law Enforcement | 158 (49.1%) | 164 (50.9%) |
| Food Preparation & Serving | 390 (48.2%) | 419 (51.8%) |
| Cleaning & Maintenance | 216 (55.4%) | 174 (44.6%) |
| Personal Care & Service | 75 (24.3%) | 234 (75.7%) |
| Total (Category) | 995 (42.6%) | 1,341 (57.4%) |
| Total (Overall) | 6,194 (52.5%) | 5,612 (47.5%) |
Sales and Office Occupations
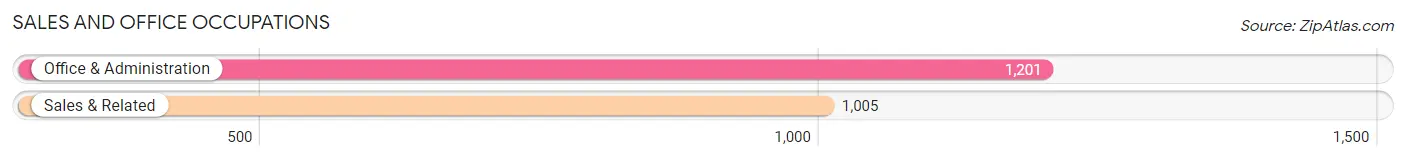
The most common Sales and Office occupations in Gallia County are Office & Administration (1,201 | 10.2%), and Sales & Related (1,005 | 8.5%).
Sales and Office Occupations by Sex
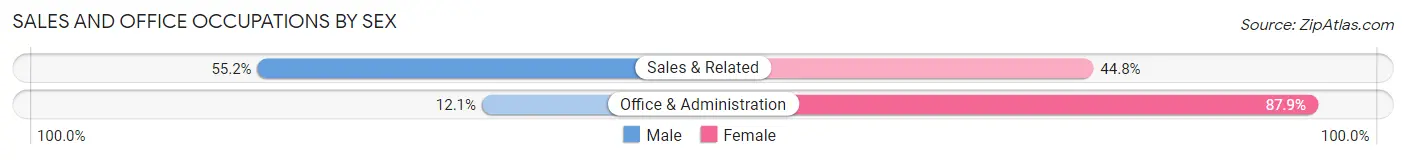
| Occupation | Male | Female |
| Sales & Related | 555 (55.2%) | 450 (44.8%) |
| Office & Administration | 145 (12.1%) | 1,056 (87.9%) |
| Total (Category) | 700 (31.7%) | 1,506 (68.3%) |
| Total (Overall) | 6,194 (52.5%) | 5,612 (47.5%) |
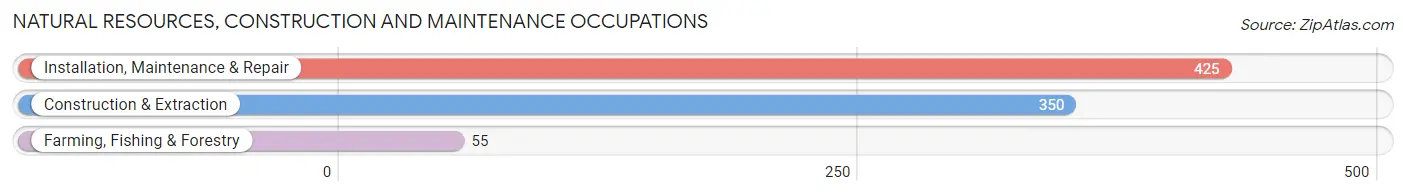
Natural Resources, Construction and Maintenance Occupations
The most common Natural Resources, Construction and Maintenance occupations in Gallia County are Installation, Maintenance & Repair (425 | 3.6%), Construction & Extraction (350 | 3.0%), and Farming, Fishing & Forestry (55 | 0.5%).
Natural Resources, Construction and Maintenance Occupations by Sex
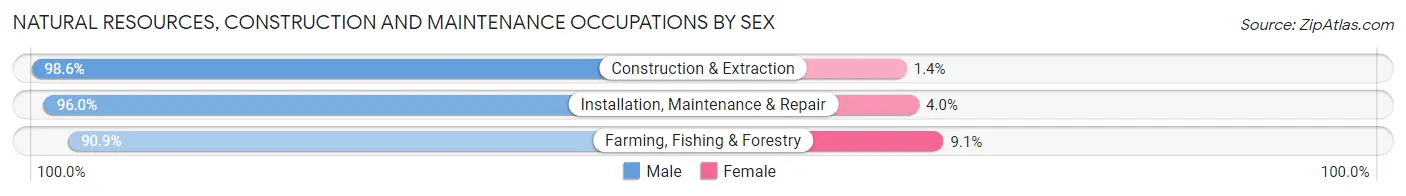
| Occupation | Male | Female |
| Farming, Fishing & Forestry | 50 (90.9%) | 5 (9.1%) |
| Construction & Extraction | 345 (98.6%) | 5 (1.4%) |
| Installation, Maintenance & Repair | 408 (96.0%) | 17 (4.0%) |
| Total (Category) | 803 (96.8%) | 27 (3.3%) |
| Total (Overall) | 6,194 (52.5%) | 5,612 (47.5%) |
Production, Transportation and Moving Occupations
The most common Production, Transportation and Moving occupations in Gallia County are Production (1,222 | 10.3%), Transportation (792 | 6.7%), and Material Moving (316 | 2.7%).
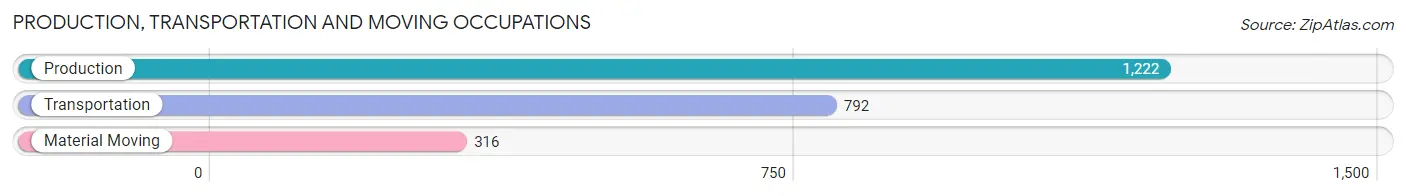
Production, Transportation and Moving Occupations by Sex
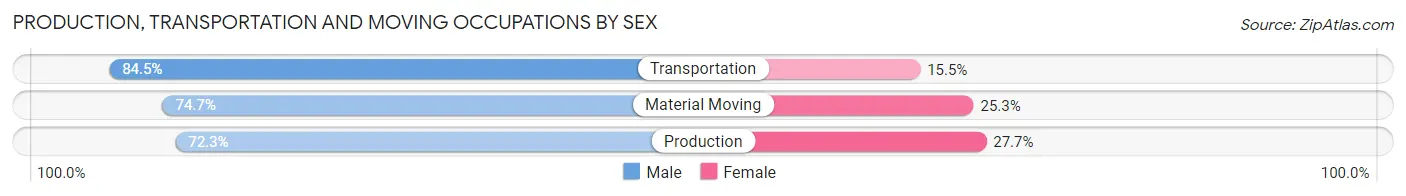
| Occupation | Male | Female |
| Production | 884 (72.3%) | 338 (27.7%) |
| Transportation | 669 (84.5%) | 123 (15.5%) |
| Material Moving | 236 (74.7%) | 80 (25.3%) |
| Total (Category) | 1,789 (76.8%) | 541 (23.2%) |
| Total (Overall) | 6,194 (52.5%) | 5,612 (47.5%) |
Employment Industries by Sex in Gallia County
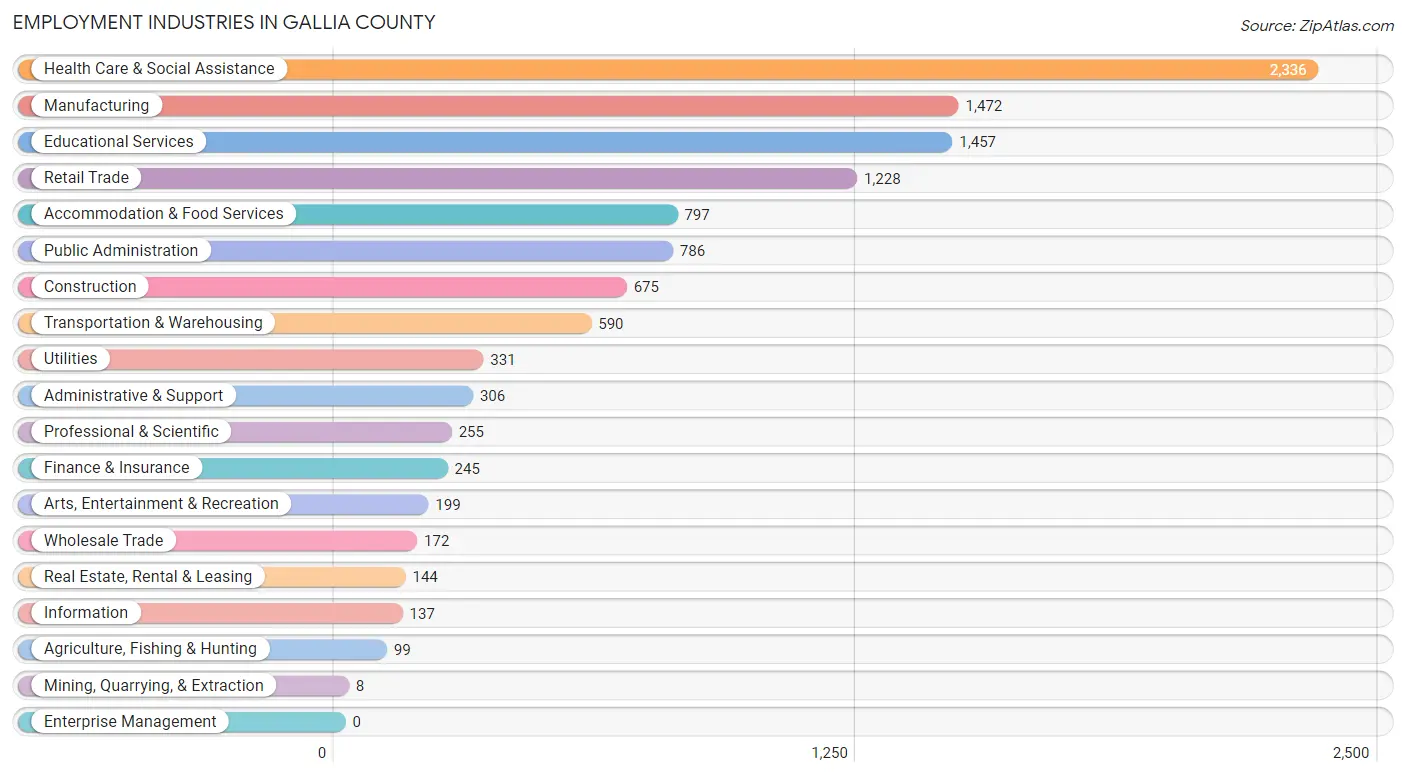
Employment Industries in Gallia County
The major employment industries in Gallia County include Health Care & Social Assistance (2,336 | 19.8%), Manufacturing (1,472 | 12.5%), Educational Services (1,457 | 12.3%), Retail Trade (1,228 | 10.4%), and Accommodation & Food Services (797 | 6.8%).
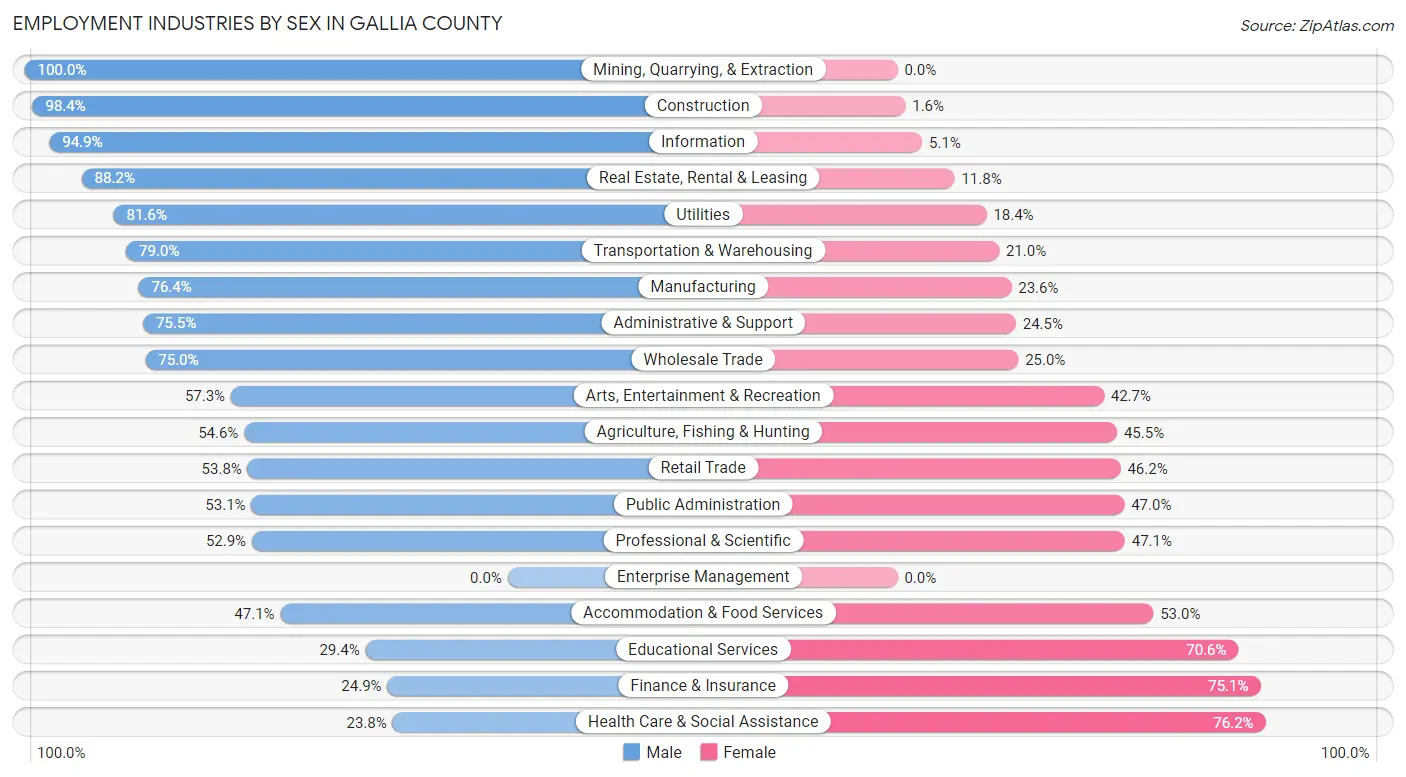
Employment Industries by Sex in Gallia County
The Gallia County industries that see more men than women are Mining, Quarrying, & Extraction (100.0%), Construction (98.4%), and Information (94.9%), whereas the industries that tend to have a higher number of women are Health Care & Social Assistance (76.2%), Finance & Insurance (75.1%), and Educational Services (70.6%).
| Industry | Male | Female |
| Agriculture, Fishing & Hunting | 54 (54.5%) | 45 (45.5%) |
| Mining, Quarrying, & Extraction | 8 (100.0%) | 0 (0.0%) |
| Construction | 664 (98.4%) | 11 (1.6%) |
| Manufacturing | 1,125 (76.4%) | 347 (23.6%) |
| Wholesale Trade | 129 (75.0%) | 43 (25.0%) |
| Retail Trade | 661 (53.8%) | 567 (46.2%) |
| Transportation & Warehousing | 466 (79.0%) | 124 (21.0%) |
| Utilities | 270 (81.6%) | 61 (18.4%) |
| Information | 130 (94.9%) | 7 (5.1%) |
| Finance & Insurance | 61 (24.9%) | 184 (75.1%) |
| Real Estate, Rental & Leasing | 127 (88.2%) | 17 (11.8%) |
| Professional & Scientific | 135 (52.9%) | 120 (47.1%) |
| Enterprise Management | 0 (0.0%) | 0 (0.0%) |
| Administrative & Support | 231 (75.5%) | 75 (24.5%) |
| Educational Services | 429 (29.4%) | 1,028 (70.6%) |
| Health Care & Social Assistance | 557 (23.8%) | 1,779 (76.2%) |
| Arts, Entertainment & Recreation | 114 (57.3%) | 85 (42.7%) |
| Accommodation & Food Services | 375 (47.0%) | 422 (52.9%) |
| Public Administration | 417 (53.0%) | 369 (46.9%) |
| Total | 6,194 (52.5%) | 5,612 (47.5%) |
Education in Gallia County
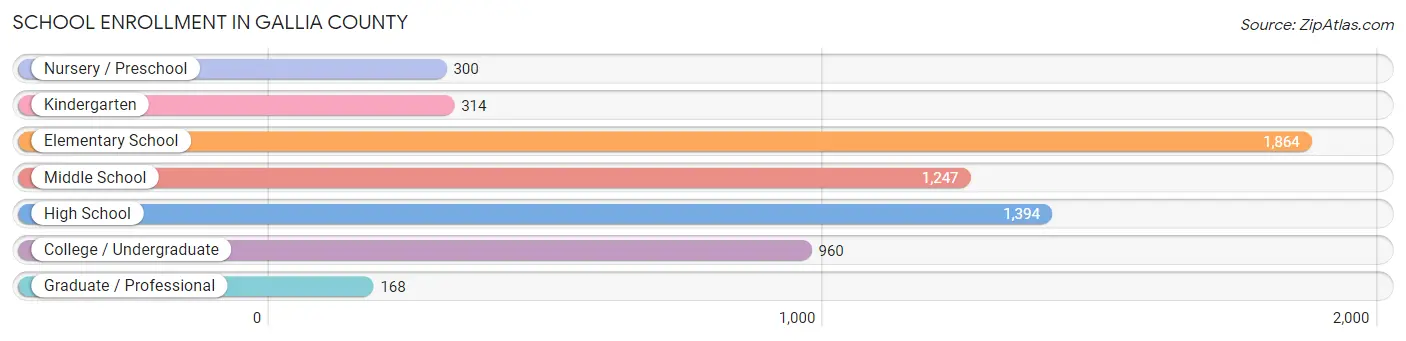
School Enrollment in Gallia County
The most common levels of schooling among the 6,247 students in Gallia County are elementary school (1,864 | 29.8%), high school (1,394 | 22.3%), and middle school (1,247 | 20.0%).
| School Level | # Students | % Students |
| Nursery / Preschool | 300 | 4.8% |
| Kindergarten | 314 | 5.0% |
| Elementary School | 1,864 | 29.8% |
| Middle School | 1,247 | 20.0% |
| High School | 1,394 | 22.3% |
| College / Undergraduate | 960 | 15.4% |
| Graduate / Professional | 168 | 2.7% |
| Total | 6,247 | 100.0% |
School Enrollment by Age by Funding Source in Gallia County
Out of a total of 6,247 students who are enrolled in schools in Gallia County, 912 (14.6%) attend a private institution, while the remaining 5,335 (85.4%) are enrolled in public schools. The age group of 35 years and over has the highest likelihood of being enrolled in private schools, with 37 (27.2% in the age bracket) enrolled. Conversely, the age group of 10 to 14 year olds has the lowest likelihood of being enrolled in a private school, with 1,549 (98.0% in the age bracket) attending a public institution.
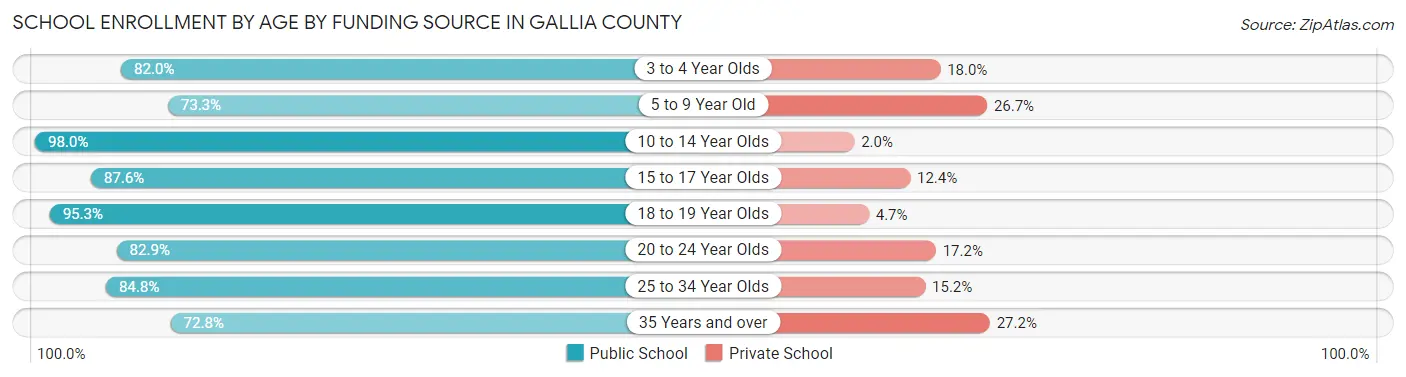
| Age Bracket | Public School | Private School |
| 3 to 4 Year Olds | 187 (82.0%) | 41 (18.0%) |
| 5 to 9 Year Old | 1,428 (73.3%) | 520 (26.7%) |
| 10 to 14 Year Olds | 1,549 (98.0%) | 31 (2.0%) |
| 15 to 17 Year Olds | 1,028 (87.6%) | 145 (12.4%) |
| 18 to 19 Year Olds | 468 (95.3%) | 23 (4.7%) |
| 20 to 24 Year Olds | 425 (82.9%) | 88 (17.2%) |
| 25 to 34 Year Olds | 151 (84.8%) | 27 (15.2%) |
| 35 Years and over | 99 (72.8%) | 37 (27.2%) |
| Total | 5,335 (85.4%) | 912 (14.6%) |
Educational Attainment by Field of Study in Gallia County
Education (925 | 23.7%), business (661 | 17.0%), science & technology (492 | 12.6%), bio, nature & agricultural (441 | 11.3%), and arts & humanities (241 | 6.2%) are the most common fields of study among 3,898 individuals in Gallia County who have obtained a bachelor's degree or higher.
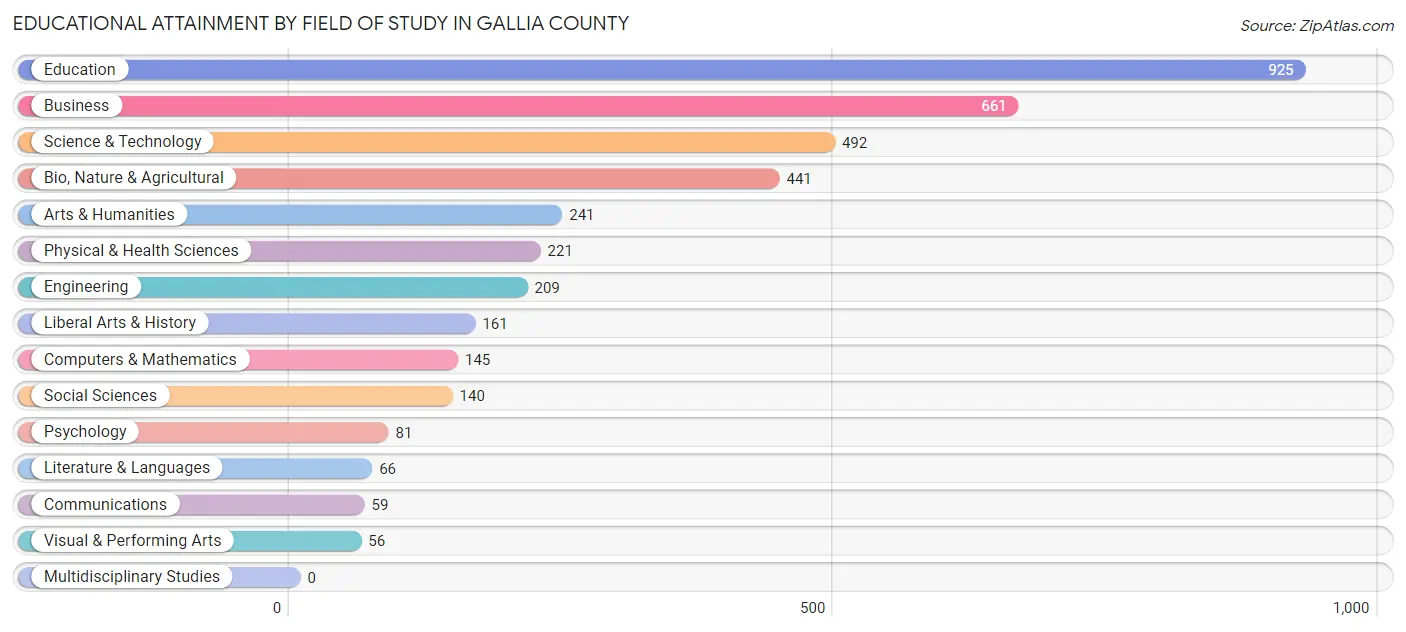
| Field of Study | # Graduates | % Graduates |
| Computers & Mathematics | 145 | 3.7% |
| Bio, Nature & Agricultural | 441 | 11.3% |
| Physical & Health Sciences | 221 | 5.7% |
| Psychology | 81 | 2.1% |
| Social Sciences | 140 | 3.6% |
| Engineering | 209 | 5.4% |
| Multidisciplinary Studies | 0 | 0.0% |
| Science & Technology | 492 | 12.6% |
| Business | 661 | 17.0% |
| Education | 925 | 23.7% |
| Literature & Languages | 66 | 1.7% |
| Liberal Arts & History | 161 | 4.1% |
| Visual & Performing Arts | 56 | 1.4% |
| Communications | 59 | 1.5% |
| Arts & Humanities | 241 | 6.2% |
| Total | 3,898 | 100.0% |
Transportation & Commute in Gallia County
Vehicle Availability by Sex in Gallia County
The most prevalent vehicle ownership categories in Gallia County are males with 2 vehicles (2,277, accounting for 37.2%) and females with 2 vehicles (2,109, making up 41.9%).
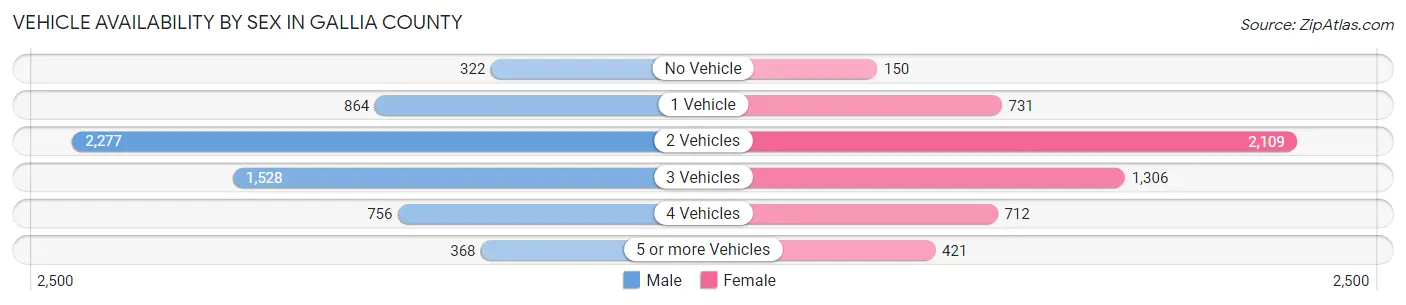
| Vehicles Available | Male | Female |
| No Vehicle | 322 (5.3%) | 150 (2.8%) |
| 1 Vehicle | 864 (14.1%) | 731 (13.5%) |
| 2 Vehicles | 2,277 (37.2%) | 2,109 (38.9%) |
| 3 Vehicles | 1,528 (25.0%) | 1,306 (24.1%) |
| 4 Vehicles | 756 (12.4%) | 712 (13.1%) |
| 5 or more Vehicles | 368 (6.0%) | 421 (7.7%) |
| Total | 6,115 (100.0%) | 5,429 (100.0%) |
Commute Time in Gallia County
The most frequently occuring commute durations in Gallia County are 15 to 19 minutes (1,984 commuters, 18.4%), 20 to 24 minutes (1,609 commuters, 14.9%), and 10 to 14 minutes (1,431 commuters, 13.3%).
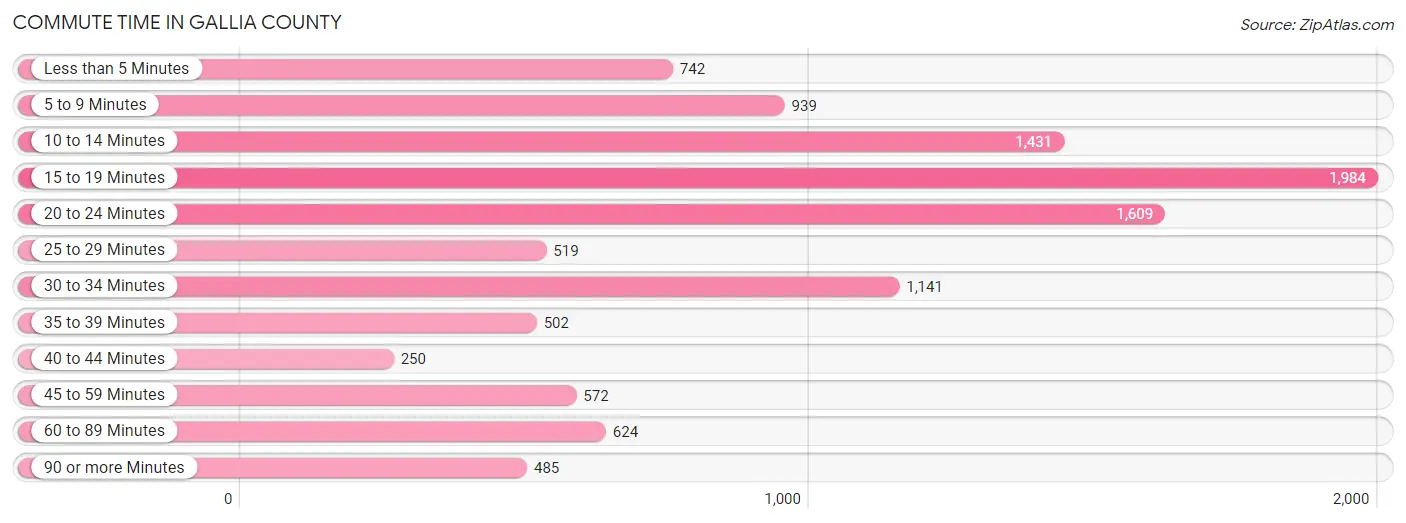
| Commute Time | # Commuters | % Commuters |
| Less than 5 Minutes | 742 | 6.9% |
| 5 to 9 Minutes | 939 | 8.7% |
| 10 to 14 Minutes | 1,431 | 13.3% |
| 15 to 19 Minutes | 1,984 | 18.4% |
| 20 to 24 Minutes | 1,609 | 14.9% |
| 25 to 29 Minutes | 519 | 4.8% |
| 30 to 34 Minutes | 1,141 | 10.6% |
| 35 to 39 Minutes | 502 | 4.6% |
| 40 to 44 Minutes | 250 | 2.3% |
| 45 to 59 Minutes | 572 | 5.3% |
| 60 to 89 Minutes | 624 | 5.8% |
| 90 or more Minutes | 485 | 4.5% |
Commute Time by Sex in Gallia County
The most common commute times in Gallia County are 15 to 19 minutes (850 commuters, 14.7%) for males and 15 to 19 minutes (1,134 commuters, 22.6%) for females.
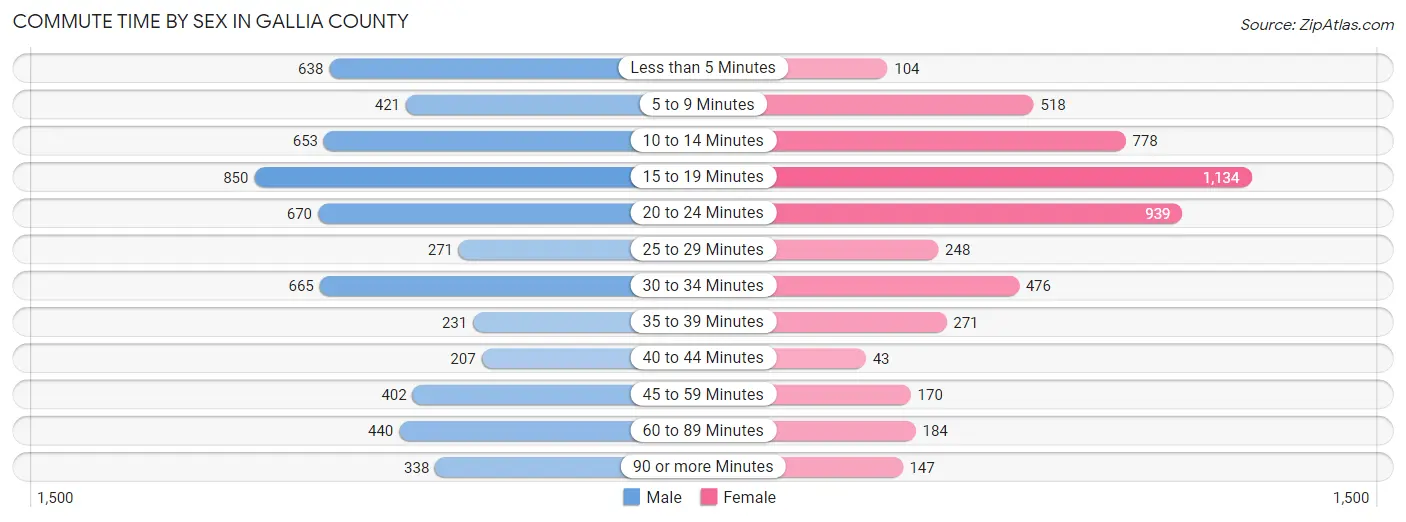
| Commute Time | Male | Female |
| Less than 5 Minutes | 638 (11.0%) | 104 (2.1%) |
| 5 to 9 Minutes | 421 (7.3%) | 518 (10.3%) |
| 10 to 14 Minutes | 653 (11.3%) | 778 (15.5%) |
| 15 to 19 Minutes | 850 (14.7%) | 1,134 (22.6%) |
| 20 to 24 Minutes | 670 (11.6%) | 939 (18.7%) |
| 25 to 29 Minutes | 271 (4.7%) | 248 (5.0%) |
| 30 to 34 Minutes | 665 (11.5%) | 476 (9.5%) |
| 35 to 39 Minutes | 231 (4.0%) | 271 (5.4%) |
| 40 to 44 Minutes | 207 (3.6%) | 43 (0.9%) |
| 45 to 59 Minutes | 402 (7.0%) | 170 (3.4%) |
| 60 to 89 Minutes | 440 (7.6%) | 184 (3.7%) |
| 90 or more Minutes | 338 (5.8%) | 147 (2.9%) |
Time of Departure to Work by Sex in Gallia County
The most frequent times of departure to work in Gallia County are 7:00 AM to 7:29 AM (733, 12.7%) for males and 7:30 AM to 7:59 AM (837, 16.7%) for females.
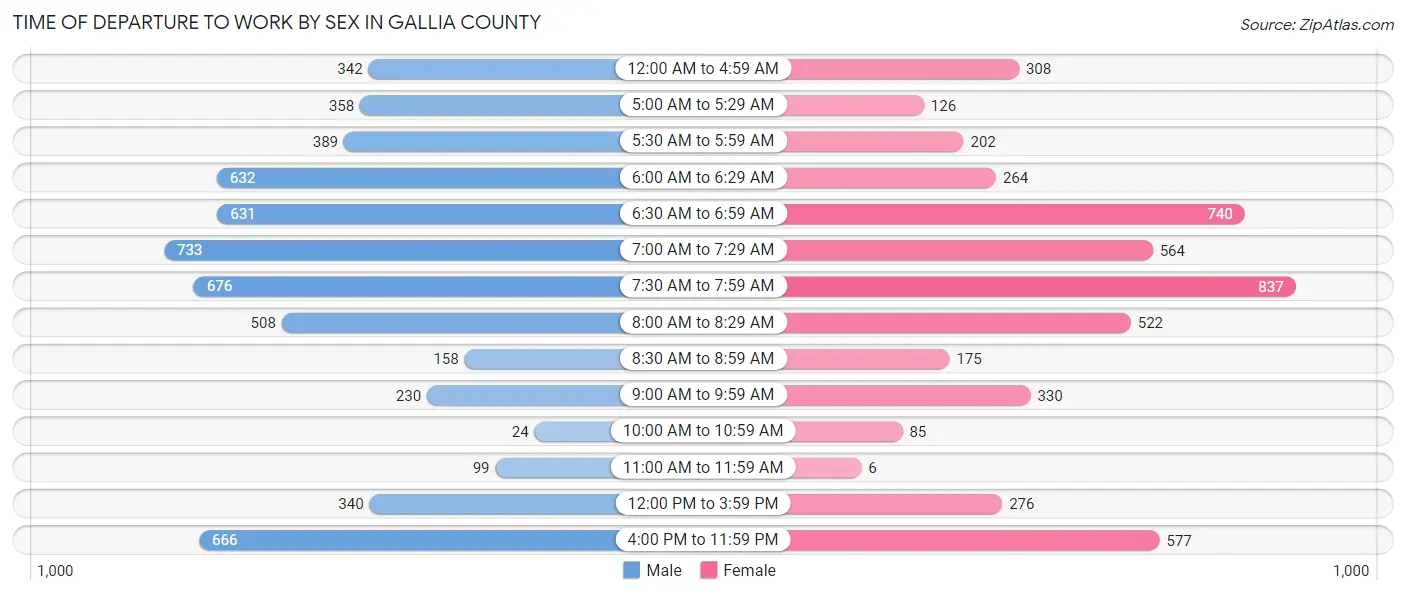
| Time of Departure | Male | Female |
| 12:00 AM to 4:59 AM | 342 (5.9%) | 308 (6.1%) |
| 5:00 AM to 5:29 AM | 358 (6.2%) | 126 (2.5%) |
| 5:30 AM to 5:59 AM | 389 (6.7%) | 202 (4.0%) |
| 6:00 AM to 6:29 AM | 632 (10.9%) | 264 (5.3%) |
| 6:30 AM to 6:59 AM | 631 (10.9%) | 740 (14.8%) |
| 7:00 AM to 7:29 AM | 733 (12.7%) | 564 (11.3%) |
| 7:30 AM to 7:59 AM | 676 (11.7%) | 837 (16.7%) |
| 8:00 AM to 8:29 AM | 508 (8.8%) | 522 (10.4%) |
| 8:30 AM to 8:59 AM | 158 (2.7%) | 175 (3.5%) |
| 9:00 AM to 9:59 AM | 230 (4.0%) | 330 (6.6%) |
| 10:00 AM to 10:59 AM | 24 (0.4%) | 85 (1.7%) |
| 11:00 AM to 11:59 AM | 99 (1.7%) | 6 (0.1%) |
| 12:00 PM to 3:59 PM | 340 (5.9%) | 276 (5.5%) |
| 4:00 PM to 11:59 PM | 666 (11.5%) | 577 (11.5%) |
| Total | 5,786 (100.0%) | 5,012 (100.0%) |
Housing Occupancy in Gallia County
Occupancy by Ownership in Gallia County
Of the total 11,303 dwellings in Gallia County, owner-occupied units account for 8,578 (75.9%), while renter-occupied units make up 2,725 (24.1%).
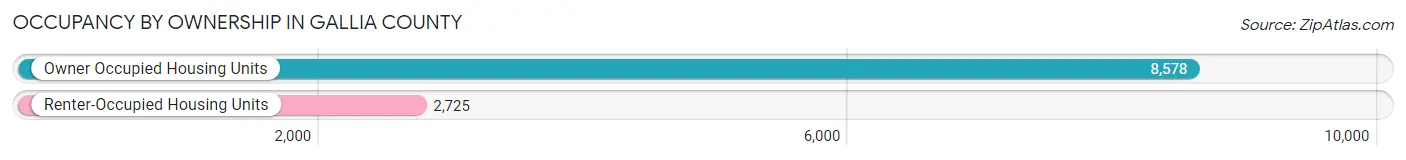
| Occupancy | # Housing Units | % Housing Units |
| Owner Occupied Housing Units | 8,578 | 75.9% |
| Renter-Occupied Housing Units | 2,725 | 24.1% |
| Total Occupied Housing Units | 11,303 | 100.0% |
Occupancy by Household Size in Gallia County
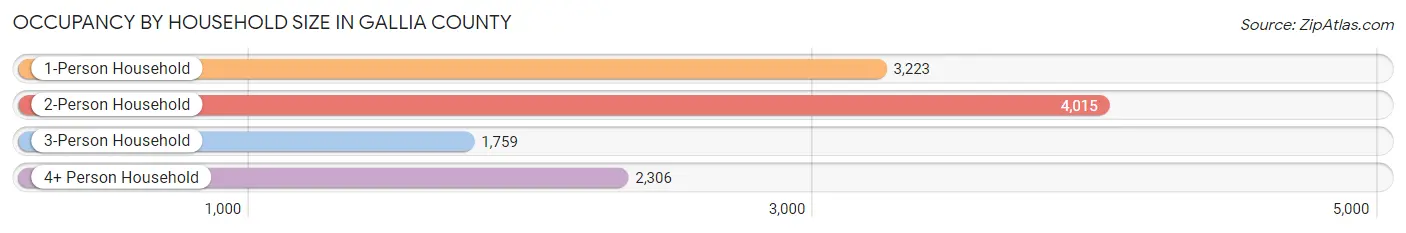
| Household Size | # Housing Units | % Housing Units |
| 1-Person Household | 3,223 | 28.5% |
| 2-Person Household | 4,015 | 35.5% |
| 3-Person Household | 1,759 | 15.6% |
| 4+ Person Household | 2,306 | 20.4% |
| Total Housing Units | 11,303 | 100.0% |
Occupancy by Ownership by Household Size in Gallia County
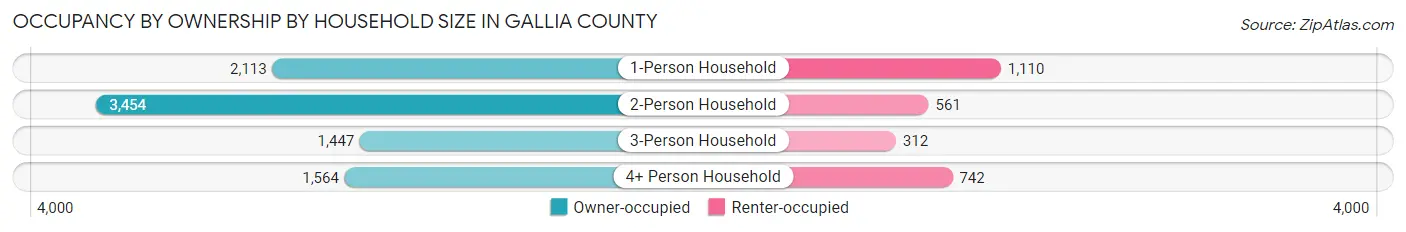
| Household Size | Owner-occupied | Renter-occupied |
| 1-Person Household | 2,113 (65.6%) | 1,110 (34.4%) |
| 2-Person Household | 3,454 (86.0%) | 561 (14.0%) |
| 3-Person Household | 1,447 (82.3%) | 312 (17.7%) |
| 4+ Person Household | 1,564 (67.8%) | 742 (32.2%) |
| Total Housing Units | 8,578 (75.9%) | 2,725 (24.1%) |
Occupancy by Educational Attainment in Gallia County
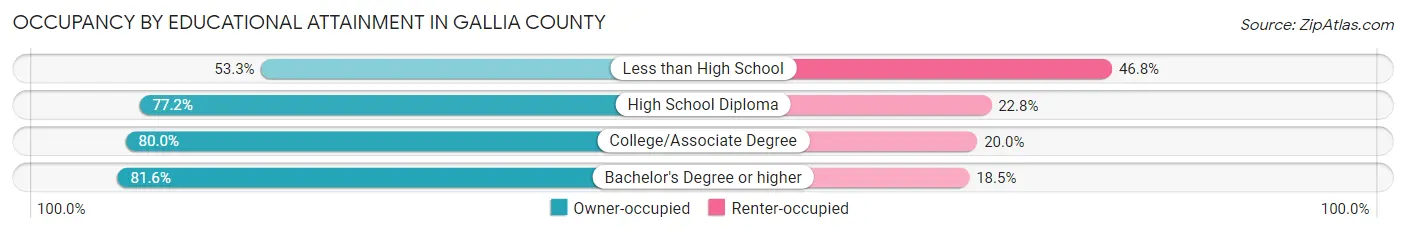
| Household Size | Owner-occupied | Renter-occupied |
| Less than High School | 746 (53.2%) | 655 (46.8%) |
| High School Diploma | 3,363 (77.2%) | 994 (22.8%) |
| College/Associate Degree | 2,661 (80.0%) | 667 (20.0%) |
| Bachelor's Degree or higher | 1,808 (81.6%) | 409 (18.4%) |
Occupancy by Age of Householder in Gallia County
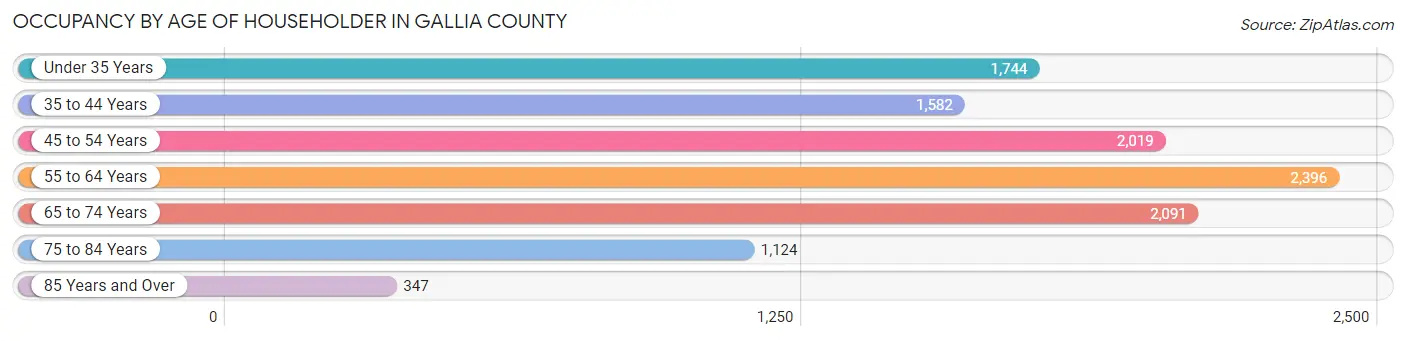
| Age Bracket | # Households | % Households |
| Under 35 Years | 1,744 | 15.4% |
| 35 to 44 Years | 1,582 | 14.0% |
| 45 to 54 Years | 2,019 | 17.9% |
| 55 to 64 Years | 2,396 | 21.2% |
| 65 to 74 Years | 2,091 | 18.5% |
| 75 to 84 Years | 1,124 | 9.9% |
| 85 Years and Over | 347 | 3.1% |
| Total | 11,303 | 100.0% |
Housing Finances in Gallia County
Median Income by Occupancy in Gallia County
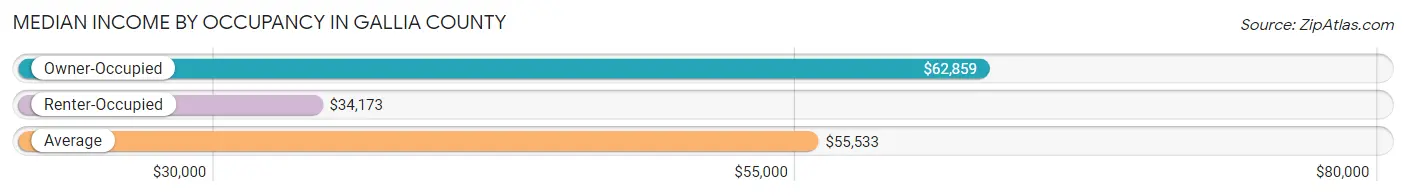
| Occupancy Type | # Households | Median Income |
| Owner-Occupied | 8,578 (75.9%) | $62,859 |
| Renter-Occupied | 2,725 (24.1%) | $34,173 |
| Average | 11,303 (100.0%) | $55,533 |
Occupancy by Householder Income Bracket in Gallia County
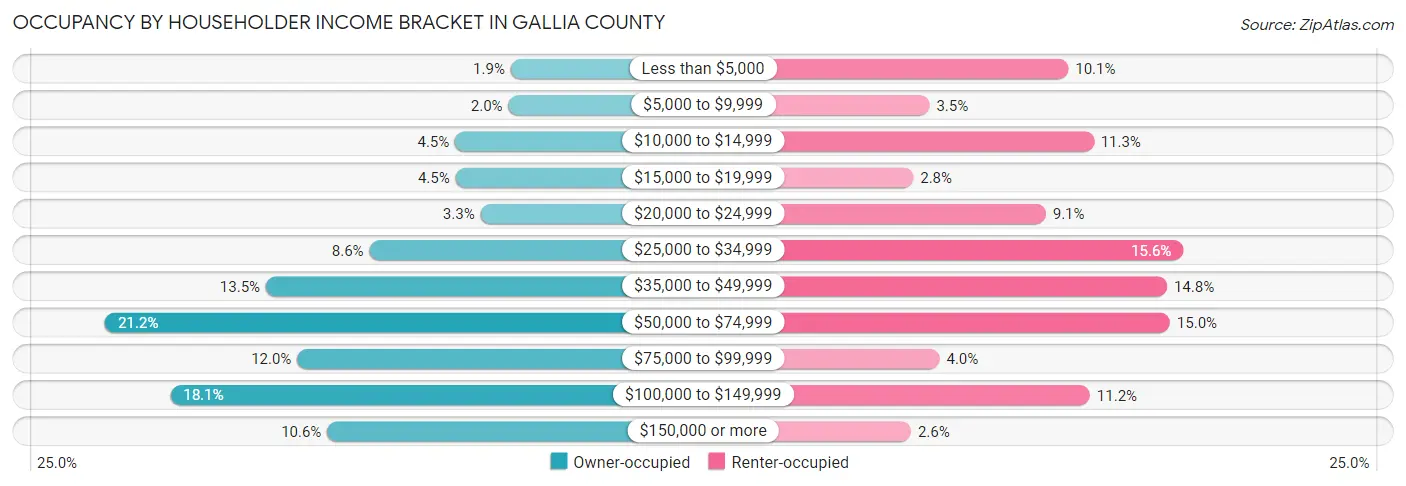
| Income Bracket | Owner-occupied | Renter-occupied |
| Less than $5,000 | 159 (1.8%) | 276 (10.1%) |
| $5,000 to $9,999 | 168 (2.0%) | 96 (3.5%) |
| $10,000 to $14,999 | 386 (4.5%) | 309 (11.3%) |
| $15,000 to $19,999 | 384 (4.5%) | 75 (2.8%) |
| $20,000 to $24,999 | 282 (3.3%) | 247 (9.1%) |
| $25,000 to $34,999 | 736 (8.6%) | 425 (15.6%) |
| $35,000 to $49,999 | 1,159 (13.5%) | 404 (14.8%) |
| $50,000 to $74,999 | 1,816 (21.2%) | 408 (15.0%) |
| $75,000 to $99,999 | 1,031 (12.0%) | 109 (4.0%) |
| $100,000 to $149,999 | 1,549 (18.1%) | 304 (11.2%) |
| $150,000 or more | 908 (10.6%) | 72 (2.6%) |
| Total | 8,578 (100.0%) | 2,725 (100.0%) |
Monthly Housing Cost Tiers in Gallia County
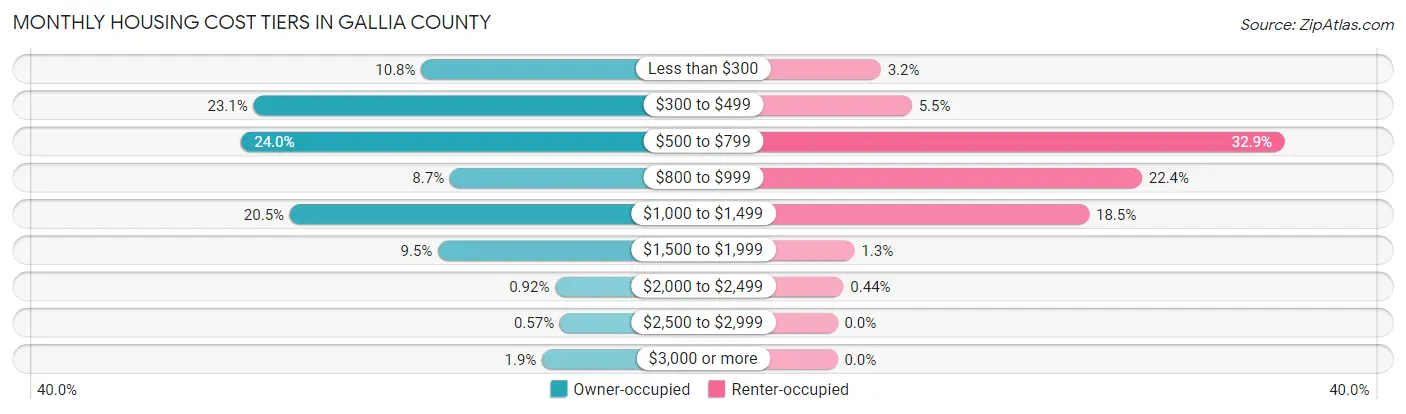
| Monthly Cost | Owner-occupied | Renter-occupied |
| Less than $300 | 925 (10.8%) | 87 (3.2%) |
| $300 to $499 | 1,985 (23.1%) | 149 (5.5%) |
| $500 to $799 | 2,062 (24.0%) | 896 (32.9%) |
| $800 to $999 | 744 (8.7%) | 611 (22.4%) |
| $1,000 to $1,499 | 1,755 (20.5%) | 505 (18.5%) |
| $1,500 to $1,999 | 818 (9.5%) | 34 (1.3%) |
| $2,000 to $2,499 | 79 (0.9%) | 12 (0.4%) |
| $2,500 to $2,999 | 49 (0.6%) | 0 (0.0%) |
| $3,000 or more | 161 (1.9%) | 0 (0.0%) |
| Total | 8,578 (100.0%) | 2,725 (100.0%) |
Physical Housing Characteristics in Gallia County
Housing Structures in Gallia County
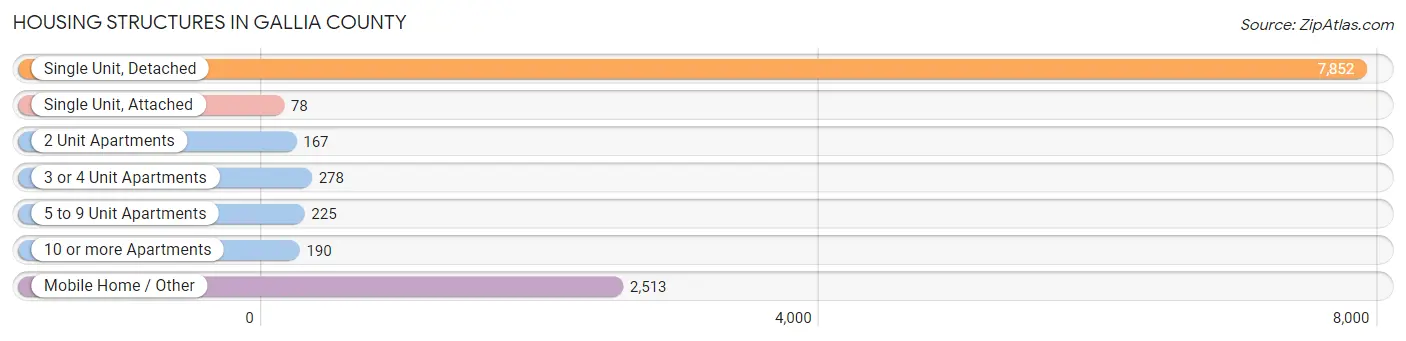
| Structure Type | # Housing Units | % Housing Units |
| Single Unit, Detached | 7,852 | 69.5% |
| Single Unit, Attached | 78 | 0.7% |
| 2 Unit Apartments | 167 | 1.5% |
| 3 or 4 Unit Apartments | 278 | 2.5% |
| 5 to 9 Unit Apartments | 225 | 2.0% |
| 10 or more Apartments | 190 | 1.7% |
| Mobile Home / Other | 2,513 | 22.2% |
| Total | 11,303 | 100.0% |
Housing Structures by Occupancy in Gallia County
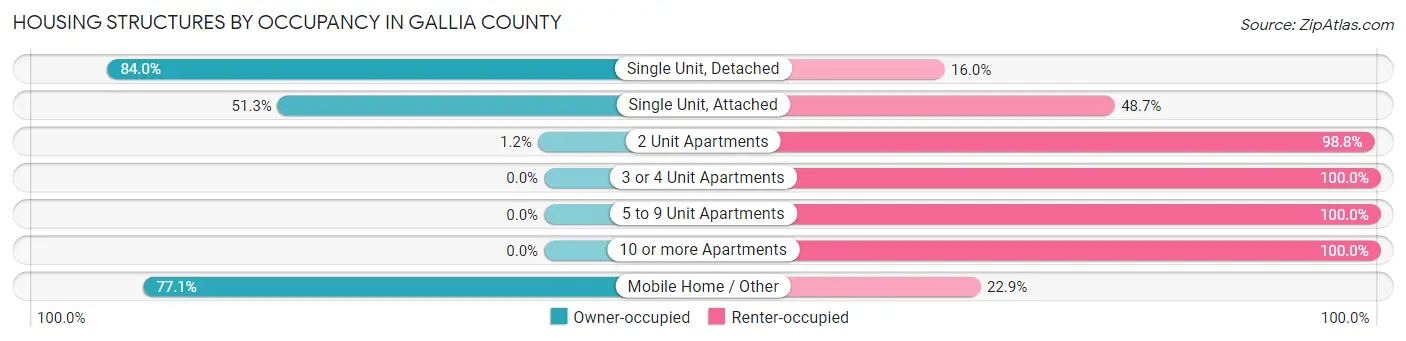
| Structure Type | Owner-occupied | Renter-occupied |
| Single Unit, Detached | 6,598 (84.0%) | 1,254 (16.0%) |
| Single Unit, Attached | 40 (51.3%) | 38 (48.7%) |
| 2 Unit Apartments | 2 (1.2%) | 165 (98.8%) |
| 3 or 4 Unit Apartments | 0 (0.0%) | 278 (100.0%) |
| 5 to 9 Unit Apartments | 0 (0.0%) | 225 (100.0%) |
| 10 or more Apartments | 0 (0.0%) | 190 (100.0%) |
| Mobile Home / Other | 1,938 (77.1%) | 575 (22.9%) |
| Total | 8,578 (75.9%) | 2,725 (24.1%) |
Housing Structures by Number of Rooms in Gallia County
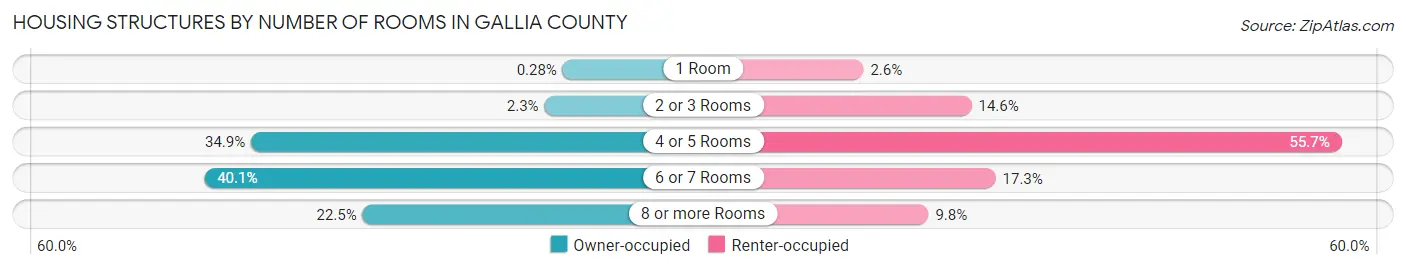
| Number of Rooms | Owner-occupied | Renter-occupied |
| 1 Room | 24 (0.3%) | 71 (2.6%) |
| 2 or 3 Rooms | 198 (2.3%) | 398 (14.6%) |
| 4 or 5 Rooms | 2,991 (34.9%) | 1,517 (55.7%) |
| 6 or 7 Rooms | 3,436 (40.1%) | 471 (17.3%) |
| 8 or more Rooms | 1,929 (22.5%) | 268 (9.8%) |
| Total | 8,578 (100.0%) | 2,725 (100.0%) |
Housing Structure by Heating Type in Gallia County
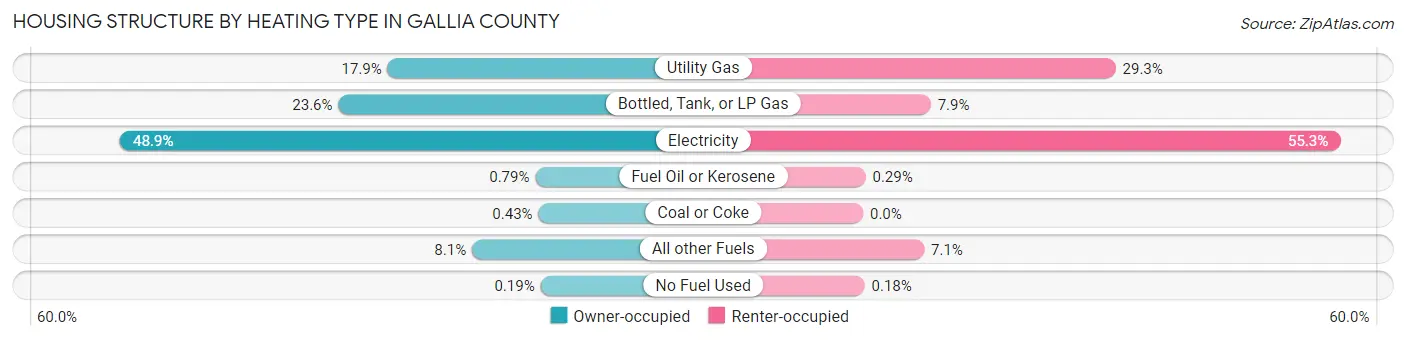
| Heating Type | Owner-occupied | Renter-occupied |
| Utility Gas | 1,537 (17.9%) | 798 (29.3%) |
| Bottled, Tank, or LP Gas | 2,026 (23.6%) | 214 (7.9%) |
| Electricity | 4,197 (48.9%) | 1,507 (55.3%) |
| Fuel Oil or Kerosene | 68 (0.8%) | 8 (0.3%) |
| Coal or Coke | 37 (0.4%) | 0 (0.0%) |
| All other Fuels | 697 (8.1%) | 193 (7.1%) |
| No Fuel Used | 16 (0.2%) | 5 (0.2%) |
| Total | 8,578 (100.0%) | 2,725 (100.0%) |
Household Vehicle Usage in Gallia County
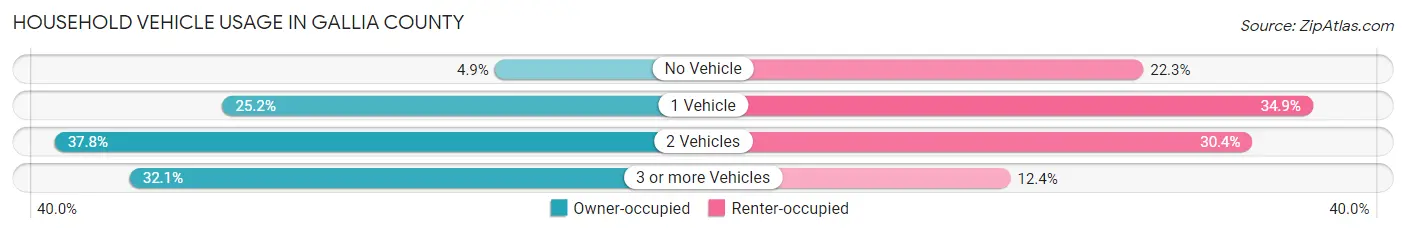
| Vehicles per Household | Owner-occupied | Renter-occupied |
| No Vehicle | 420 (4.9%) | 607 (22.3%) |
| 1 Vehicle | 2,163 (25.2%) | 952 (34.9%) |
| 2 Vehicles | 3,238 (37.8%) | 829 (30.4%) |
| 3 or more Vehicles | 2,757 (32.1%) | 337 (12.4%) |
| Total | 8,578 (100.0%) | 2,725 (100.0%) |
Real Estate & Mortgages in Gallia County
Real Estate and Mortgage Overview in Gallia County
| Characteristic | Without Mortgage | With Mortgage |
| Housing Units | 4,913 | 3,665 |
| Median Property Value | $113,600 | $150,600 |
| Median Household Income | $49,235 | $648 |
| Monthly Housing Costs | $464 | $161 |
| Real Estate Taxes | $1,115 | $65 |
Property Value by Mortgage Status in Gallia County
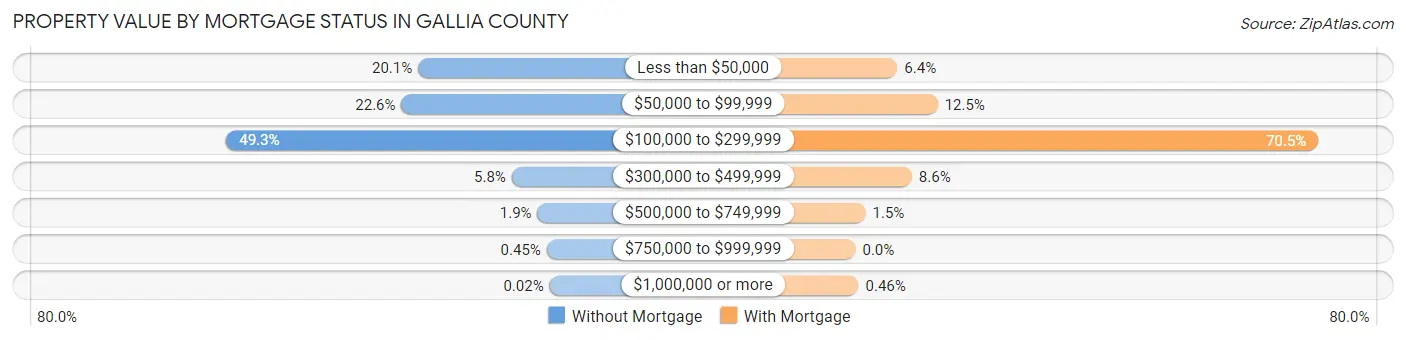
| Property Value | Without Mortgage | With Mortgage |
| Less than $50,000 | 985 (20.1%) | 234 (6.4%) |
| $50,000 to $99,999 | 1,110 (22.6%) | 459 (12.5%) |
| $100,000 to $299,999 | 2,420 (49.3%) | 2,584 (70.5%) |
| $300,000 to $499,999 | 284 (5.8%) | 315 (8.6%) |
| $500,000 to $749,999 | 91 (1.8%) | 56 (1.5%) |
| $750,000 to $999,999 | 22 (0.4%) | 0 (0.0%) |
| $1,000,000 or more | 1 (0.0%) | 17 (0.5%) |
| Total | 4,913 (100.0%) | 3,665 (100.0%) |
Household Income by Mortgage Status in Gallia County
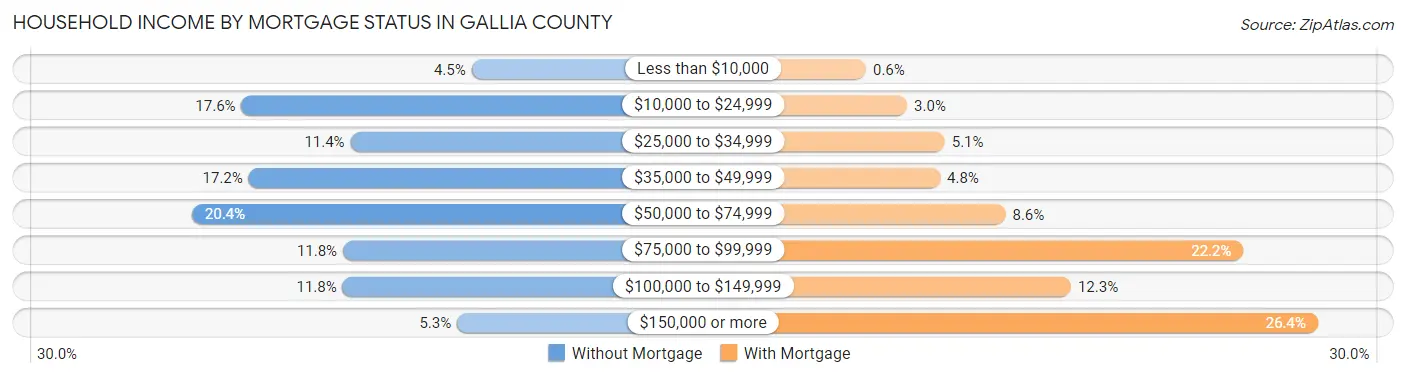
| Household Income | Without Mortgage | With Mortgage |
| Less than $10,000 | 219 (4.5%) | 22 (0.6%) |
| $10,000 to $24,999 | 865 (17.6%) | 108 (2.9%) |
| $25,000 to $34,999 | 559 (11.4%) | 187 (5.1%) |
| $35,000 to $49,999 | 845 (17.2%) | 177 (4.8%) |
| $50,000 to $74,999 | 1,004 (20.4%) | 314 (8.6%) |
| $75,000 to $99,999 | 580 (11.8%) | 812 (22.2%) |
| $100,000 to $149,999 | 581 (11.8%) | 451 (12.3%) |
| $150,000 or more | 260 (5.3%) | 968 (26.4%) |
| Total | 4,913 (100.0%) | 3,665 (100.0%) |
Property Value to Household Income Ratio in Gallia County
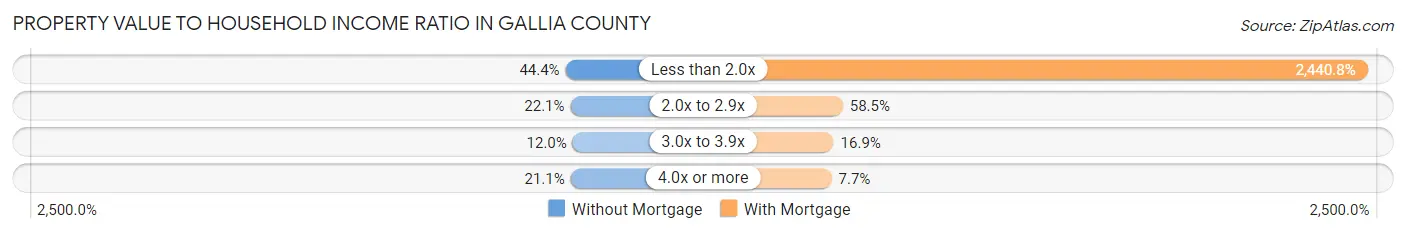
| Value-to-Income Ratio | Without Mortgage | With Mortgage |
| Less than 2.0x | 2,182 (44.4%) | 89,454 (2,440.8%) |
| 2.0x to 2.9x | 1,085 (22.1%) | 2,144 (58.5%) |
| 3.0x to 3.9x | 587 (11.9%) | 621 (16.9%) |
| 4.0x or more | 1,038 (21.1%) | 281 (7.7%) |
| Total | 4,913 (100.0%) | 3,665 (100.0%) |
Real Estate Taxes by Mortgage Status in Gallia County
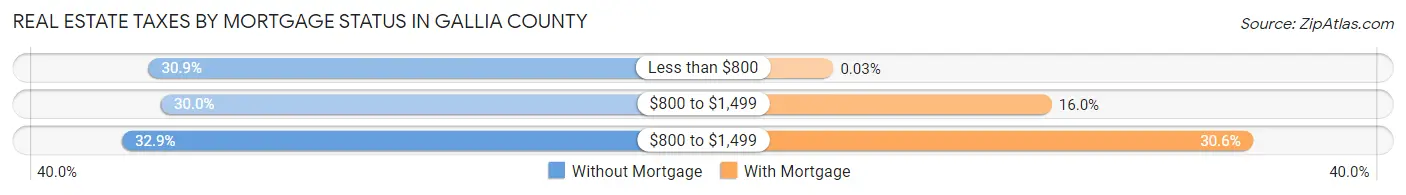
| Property Taxes | Without Mortgage | With Mortgage |
| Less than $800 | 1,520 (30.9%) | 1 (0.0%) |
| $800 to $1,499 | 1,475 (30.0%) | 586 (16.0%) |
| $800 to $1,499 | 1,615 (32.9%) | 1,123 (30.6%) |
| Total | 4,913 (100.0%) | 3,665 (100.0%) |
Health & Disability in Gallia County
Health Insurance Coverage by Age in Gallia County
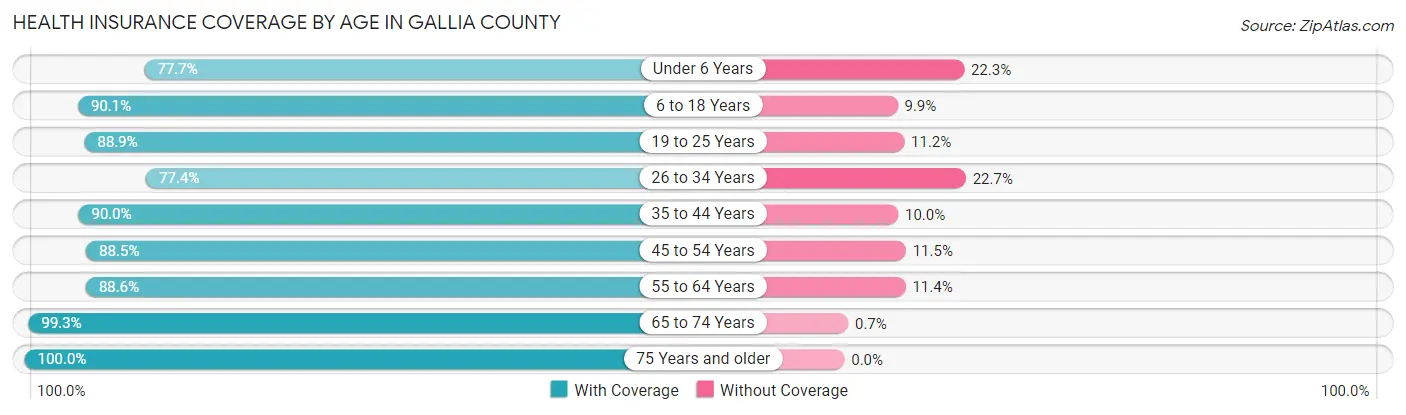
| Age Bracket | With Coverage | Without Coverage |
| Under 6 Years | 1,726 (77.7%) | 496 (22.3%) |
| 6 to 18 Years | 4,572 (90.1%) | 504 (9.9%) |
| 19 to 25 Years | 1,985 (88.8%) | 249 (11.2%) |
| 26 to 34 Years | 2,448 (77.3%) | 717 (22.7%) |
| 35 to 44 Years | 2,964 (90.0%) | 330 (10.0%) |
| 45 to 54 Years | 3,012 (88.5%) | 390 (11.5%) |
| 55 to 64 Years | 3,648 (88.6%) | 470 (11.4%) |
| 65 to 74 Years | 3,142 (99.3%) | 22 (0.7%) |
| 75 Years and older | 2,233 (100.0%) | 0 (0.0%) |
| Total | 25,730 (89.0%) | 3,178 (11.0%) |
Health Insurance Coverage by Citizenship Status in Gallia County
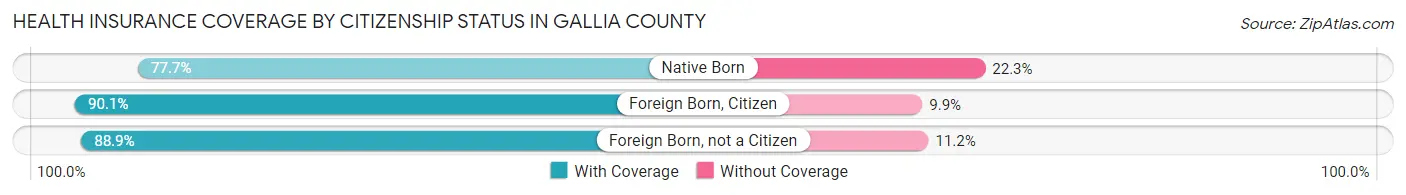
| Citizenship Status | With Coverage | Without Coverage |
| Native Born | 1,726 (77.7%) | 496 (22.3%) |
| Foreign Born, Citizen | 4,572 (90.1%) | 504 (9.9%) |
| Foreign Born, not a Citizen | 1,985 (88.8%) | 249 (11.2%) |
Health Insurance Coverage by Household Income in Gallia County
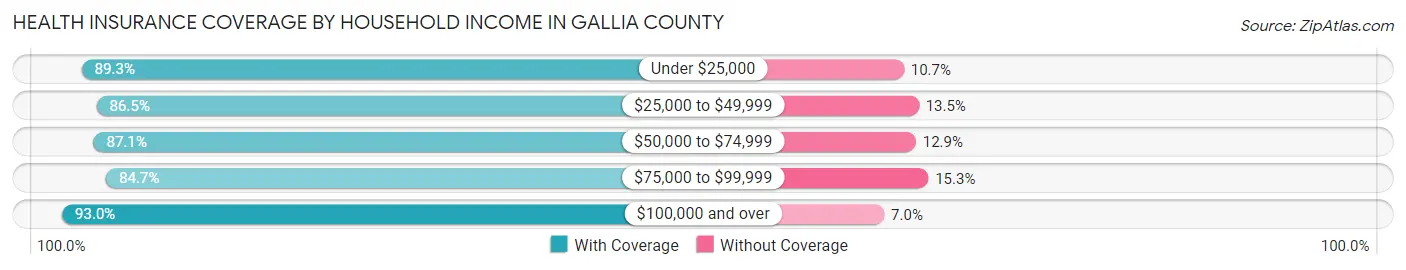
| Household Income | With Coverage | Without Coverage |
| Under $25,000 | 3,839 (89.3%) | 459 (10.7%) |
| $25,000 to $49,999 | 5,395 (86.5%) | 840 (13.5%) |
| $50,000 to $74,999 | 4,877 (87.1%) | 724 (12.9%) |
| $75,000 to $99,999 | 2,732 (84.7%) | 492 (15.3%) |
| $100,000 and over | 8,581 (93.0%) | 646 (7.0%) |
Public vs Private Health Insurance Coverage by Age in Gallia County
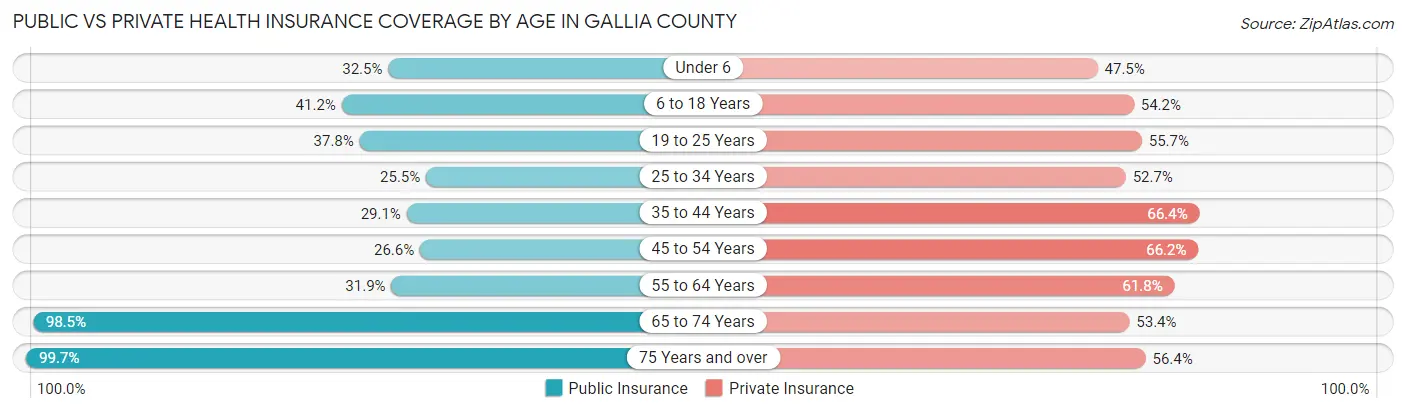
| Age Bracket | Public Insurance | Private Insurance |
| Under 6 | 722 (32.5%) | 1,055 (47.5%) |
| 6 to 18 Years | 2,089 (41.1%) | 2,751 (54.2%) |
| 19 to 25 Years | 845 (37.8%) | 1,244 (55.7%) |
| 25 to 34 Years | 806 (25.5%) | 1,668 (52.7%) |
| 35 to 44 Years | 958 (29.1%) | 2,187 (66.4%) |
| 45 to 54 Years | 905 (26.6%) | 2,251 (66.2%) |
| 55 to 64 Years | 1,314 (31.9%) | 2,543 (61.8%) |
| 65 to 74 Years | 3,116 (98.5%) | 1,689 (53.4%) |
| 75 Years and over | 2,227 (99.7%) | 1,259 (56.4%) |
| Total | 12,982 (44.9%) | 16,647 (57.6%) |
Disability Status by Sex by Age in Gallia County
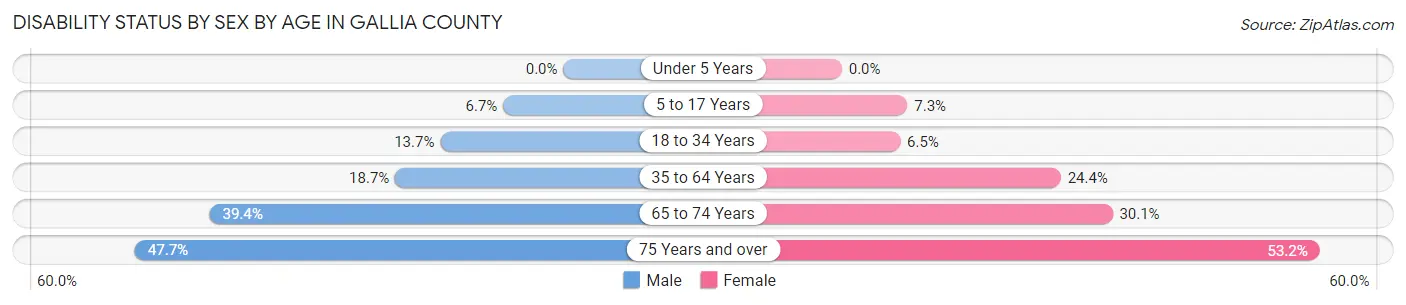
| Age Bracket | Male | Female |
| Under 5 Years | 0 (0.0%) | 0 (0.0%) |
| 5 to 17 Years | 169 (6.7%) | 178 (7.3%) |
| 18 to 34 Years | 410 (13.7%) | 188 (6.5%) |
| 35 to 64 Years | 997 (18.7%) | 1,339 (24.4%) |
| 65 to 74 Years | 606 (39.4%) | 490 (30.1%) |
| 75 Years and over | 427 (47.7%) | 712 (53.2%) |
Disability Class by Sex by Age in Gallia County
Disability Class: Hearing Difficulty
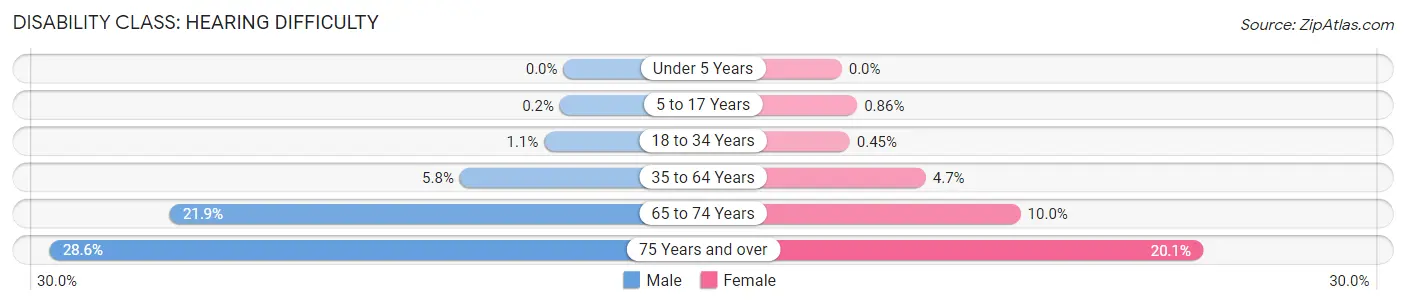
| Age Bracket | Male | Female |
| Under 5 Years | 0 (0.0%) | 0 (0.0%) |
| 5 to 17 Years | 5 (0.2%) | 21 (0.9%) |
| 18 to 34 Years | 32 (1.1%) | 13 (0.4%) |
| 35 to 64 Years | 307 (5.8%) | 257 (4.7%) |
| 65 to 74 Years | 337 (21.9%) | 162 (10.0%) |
| 75 Years and over | 256 (28.6%) | 269 (20.1%) |
Disability Class: Vision Difficulty
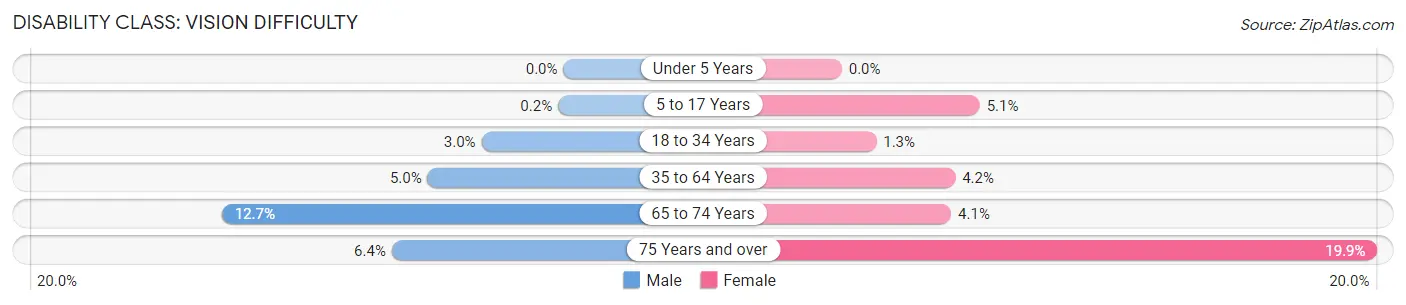
| Age Bracket | Male | Female |
| Under 5 Years | 0 (0.0%) | 0 (0.0%) |
| 5 to 17 Years | 5 (0.2%) | 125 (5.1%) |
| 18 to 34 Years | 91 (3.0%) | 37 (1.3%) |
| 35 to 64 Years | 268 (5.0%) | 231 (4.2%) |
| 65 to 74 Years | 195 (12.7%) | 66 (4.1%) |
| 75 Years and over | 57 (6.4%) | 266 (19.9%) |
Disability Class: Cognitive Difficulty
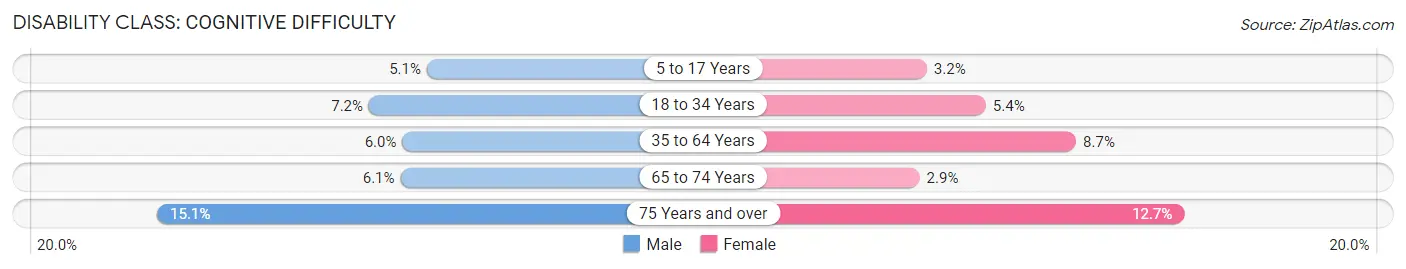
| Age Bracket | Male | Female |
| 5 to 17 Years | 128 (5.1%) | 77 (3.2%) |
| 18 to 34 Years | 216 (7.2%) | 155 (5.3%) |
| 35 to 64 Years | 318 (6.0%) | 478 (8.7%) |
| 65 to 74 Years | 93 (6.0%) | 47 (2.9%) |
| 75 Years and over | 135 (15.1%) | 170 (12.7%) |
Disability Class: Ambulatory Difficulty
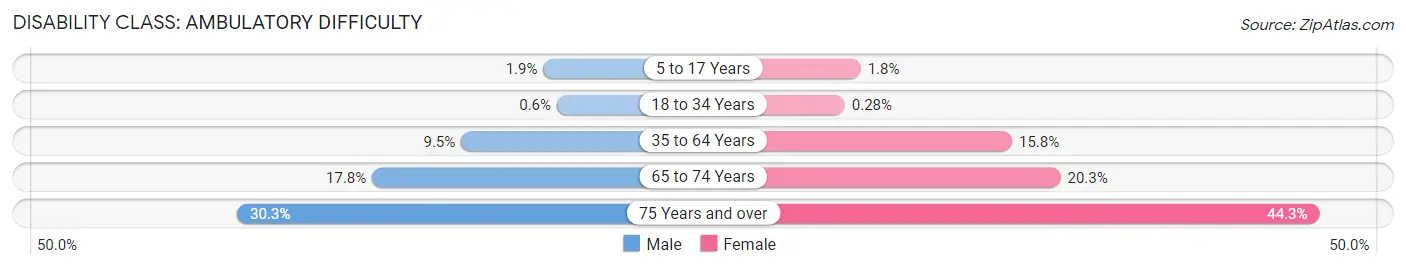
| Age Bracket | Male | Female |
| 5 to 17 Years | 47 (1.9%) | 43 (1.8%) |
| 18 to 34 Years | 18 (0.6%) | 8 (0.3%) |
| 35 to 64 Years | 505 (9.5%) | 868 (15.8%) |
| 65 to 74 Years | 273 (17.7%) | 330 (20.3%) |
| 75 Years and over | 271 (30.3%) | 593 (44.3%) |
Disability Class: Self-Care Difficulty
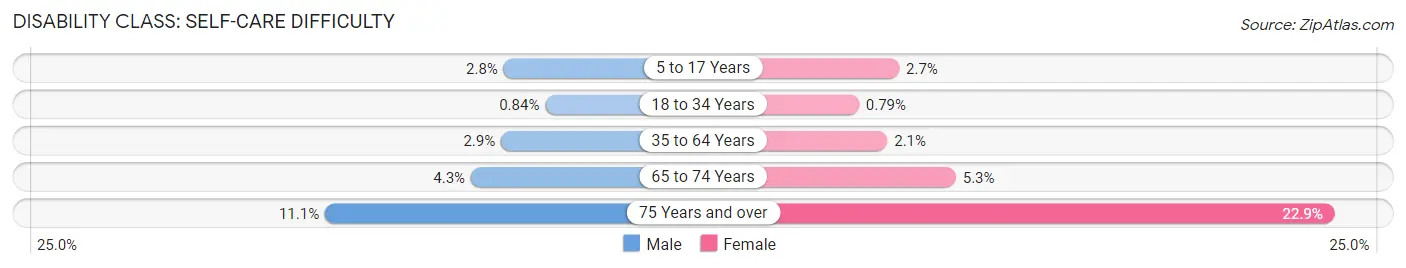
| Age Bracket | Male | Female |
| 5 to 17 Years | 70 (2.8%) | 65 (2.7%) |
| 18 to 34 Years | 25 (0.8%) | 23 (0.8%) |
| 35 to 64 Years | 154 (2.9%) | 116 (2.1%) |
| 65 to 74 Years | 66 (4.3%) | 86 (5.3%) |
| 75 Years and over | 99 (11.1%) | 306 (22.9%) |
Technology Access in Gallia County
Computing Device Access in Gallia County
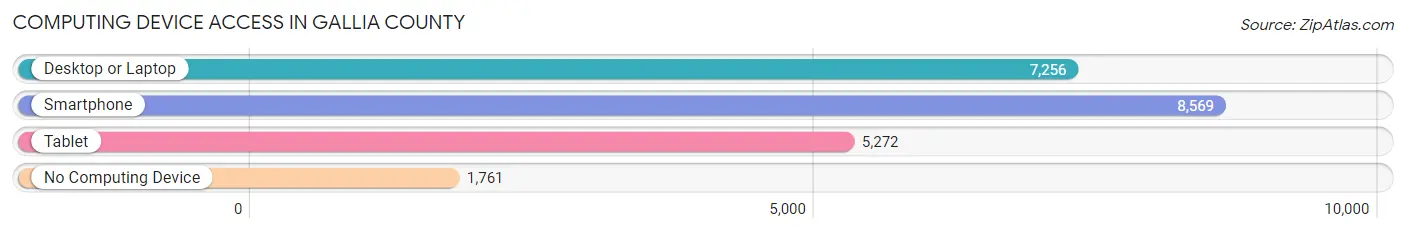
| Device Type | # Households | % Households |
| Desktop or Laptop | 7,256 | 64.2% |
| Smartphone | 8,569 | 75.8% |
| Tablet | 5,272 | 46.6% |
| No Computing Device | 1,761 | 15.6% |
| Total | 11,303 | 100.0% |
Internet Access in Gallia County
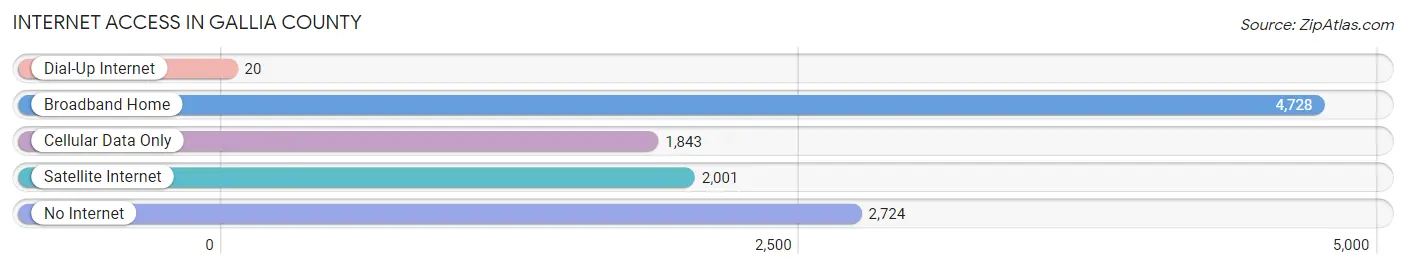
| Internet Type | # Households | % Households |
| Dial-Up Internet | 20 | 0.2% |
| Broadband Home | 4,728 | 41.8% |
| Cellular Data Only | 1,843 | 16.3% |
| Satellite Internet | 2,001 | 17.7% |
| No Internet | 2,724 | 24.1% |
| Total | 11,303 | 100.0% |
Gallia County Summary
Gallia County is located in the southeastern part of Ohio, along the Ohio River. It is bordered by Lawrence County to the north, Jackson County to the east, Meigs County to the south, and Mason County, West Virginia to the west. The county seat is Gallipolis, which is also the largest city in the county. The county was established in 1803 and named after the Latin word for Gaul, Gallia.
Geography
Gallia County covers an area of 437 square miles, of which 431 square miles is land and 6 square miles is water. The terrain is mostly rolling hills, with some flat areas along the Ohio River. The highest point in the county is located in the northwest corner, at an elevation of 1,068 feet. The county is drained by the Ohio River and its tributaries, including the Little Kanawha River, the Hocking River, and the Raccoon Creek.
The climate of Gallia County is humid continental, with hot, humid summers and cold, snowy winters. The average annual temperature is around 50°F, and the average annual precipitation is around 40 inches.
Economy
The economy of Gallia County is largely based on agriculture and manufacturing. The county is home to several large farms, which produce corn, soybeans, wheat, hay, and other crops. The county also has several manufacturing plants, which produce a variety of products, including furniture, paper products, and automotive parts.
The county is also home to several tourist attractions, including the Ohio River Scenic Byway, the Ohio River Museum, and the Gallia County Historical Society.
Demographics
As of the 2010 census, the population of Gallia County was 30,063. The racial makeup of the county was 95.3% White, 2.3% African American, 0.3% Native American, 0.3% Asian, 0.2% from other races, and 1.5% from two or more races. Hispanic or Latino of any race were 0.7% of the population.
The median household income in Gallia County was $37,945, and the median family income was $45,945. The per capita income was $19,845. About 17.2% of the population was below the poverty line.
Education
Gallia County is served by the Gallia County Local School District, which operates seven elementary schools, two middle schools, and one high school. The county is also home to Ohio University Southern, a branch of Ohio University.
Common Questions
What is Per Capita Income in Gallia County?
Per Capita income in Gallia County is $28,943.
What is the Median Family Income in Gallia County?
Median Family Income in Gallia County is $69,521.
What is the Median Household income in Gallia County?
Median Household Income in Gallia County is $55,533.
What is Income or Wage Gap in Gallia County?
Income or Wage Gap in Gallia County is 25.9%.
Women in Gallia County earn 74.1 cents for every dollar earned by a man.
What is Family Income Deficit in Gallia County?
Family Income Deficit in Gallia County is $10,282.
Families that are below poverty line in Gallia County earn $10,282 less on average than the poverty threshold level.
What is Inequality or Gini Index in Gallia County?
Inequality or Gini Index in Gallia County is 0.45.
What is the Total Population of Gallia County?
Total Population of Gallia County is 29,276.
What is the Total Male Population of Gallia County?
Total Male Population of Gallia County is 14,445.
What is the Total Female Population of Gallia County?
Total Female Population of Gallia County is 14,831.
What is the Ratio of Males per 100 Females in Gallia County?
There are 97.40 Males per 100 Females in Gallia County.
What is the Ratio of Females per 100 Males in Gallia County?
There are 102.67 Females per 100 Males in Gallia County.
What is the Median Population Age in Gallia County?
Median Population Age in Gallia County is 40.2 Years.
What is the Average Family Size in Gallia County
Average Family Size in Gallia County is 3.1 People.
What is the Average Household Size in Gallia County
Average Household Size in Gallia County is 2.5 People.
How Large is the Labor Force in Gallia County?
There are 12,317 People in the Labor Forcein in Gallia County.
What is the Percentage of People in the Labor Force in Gallia County?
52.7% of People are in the Labor Force in Gallia County.
What is the Unemployment Rate in Gallia County?
Unemployment Rate in Gallia County is 4.1%.