Fayette County, OH Map & Demographics
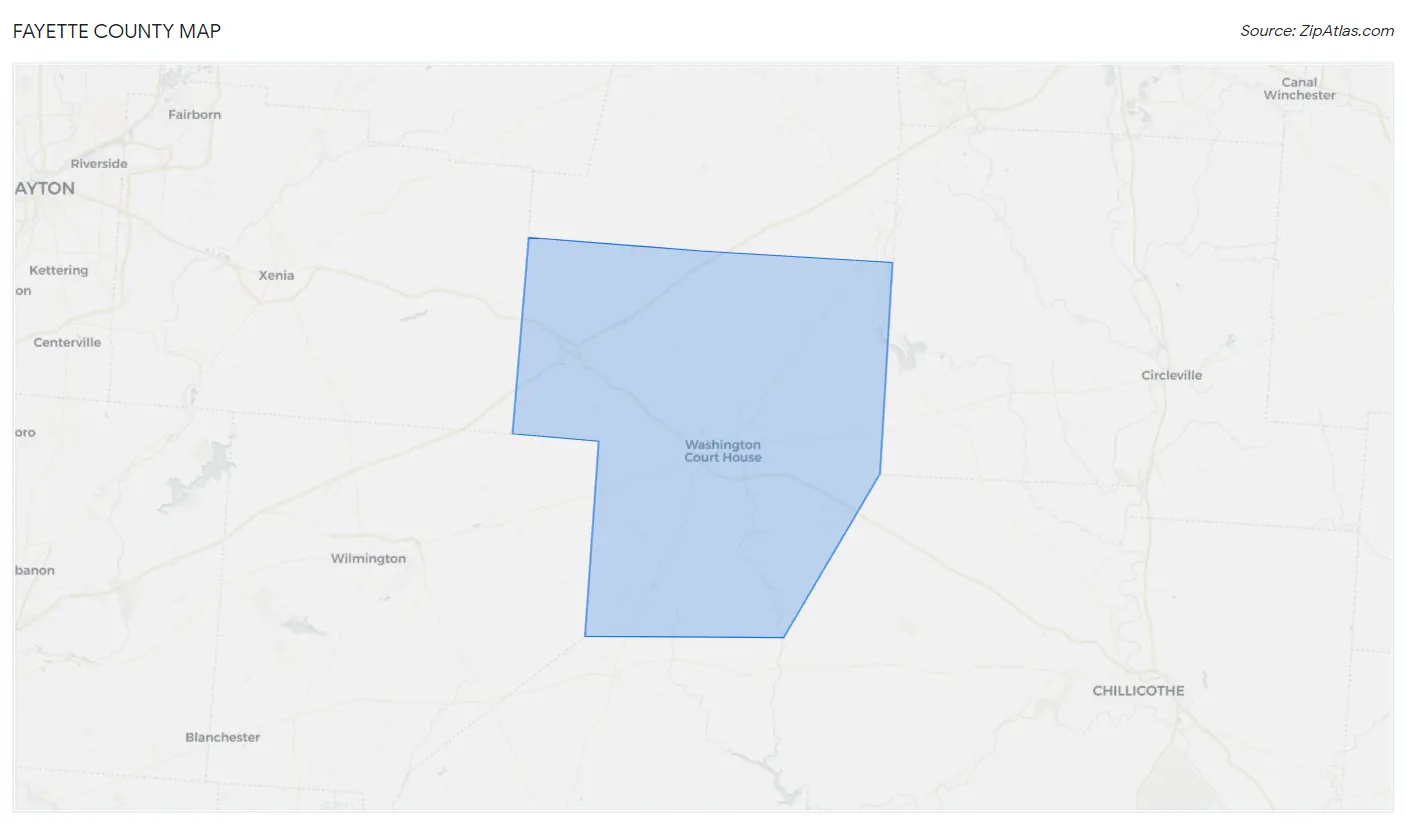
Fayette County Map
Fayette County Overview
$30,666
PER CAPITA INCOME
$71,719
AVG FAMILY INCOME
$56,773
AVG HOUSEHOLD INCOME
38.5%
WAGE / INCOME GAP [ % ]
61.5¢/ $1
WAGE / INCOME GAP [ $ ]
$14,705
FAMILY INCOME DEFICIT
0.44
INEQUALITY / GINI INDEX
28,901
TOTAL POPULATION
14,270
MALE POPULATION
14,631
FEMALE POPULATION
97.53
MALES / 100 FEMALES
102.53
FEMALES / 100 MALES
41.2
MEDIAN AGE
3.0
AVG FAMILY SIZE
2.5
AVG HOUSEHOLD SIZE
13,539
LABOR FORCE [ PEOPLE ]
58.9%
PERCENT IN LABOR FORCE
4.3%
UNEMPLOYMENT RATE
Income in Fayette County
Income Overview in Fayette County
Per Capita Income in Fayette County is $30,666, while median incomes of families and households are $71,719 and $56,773 respectively.
| Characteristic | Number | Measure |
| Per Capita Income | 28,901 | $30,666 |
| Median Family Income | 7,485 | $71,719 |
| Mean Family Income | 7,485 | $87,529 |
| Median Household Income | 11,620 | $56,773 |
| Mean Household Income | 11,620 | $73,872 |
| Income Deficit | 7,485 | $14,705 |
| Wage / Income Gap (%) | 28,901 | 38.46% |
| Wage / Income Gap ($) | 28,901 | 61.54¢ per $1 |
| Gini / Inequality Index | 28,901 | 0.44 |
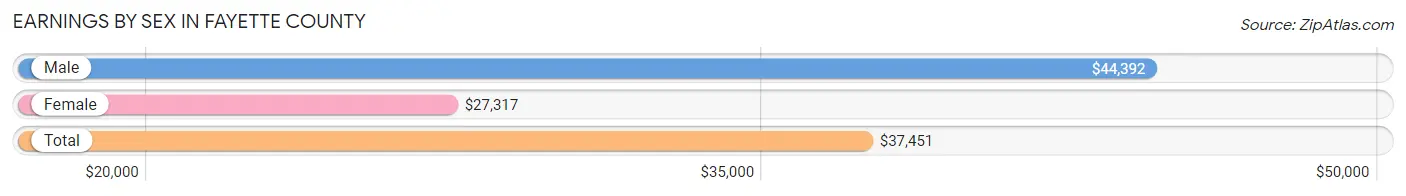
Earnings by Sex in Fayette County
Average Earnings in Fayette County are $37,451, $44,392 for men and $27,317 for women, a difference of 38.5%.
| Sex | Number | Average Earnings |
| Male | 7,803 (54.3%) | $44,392 |
| Female | 6,571 (45.7%) | $27,317 |
| Total | 14,374 (100.0%) | $37,451 |
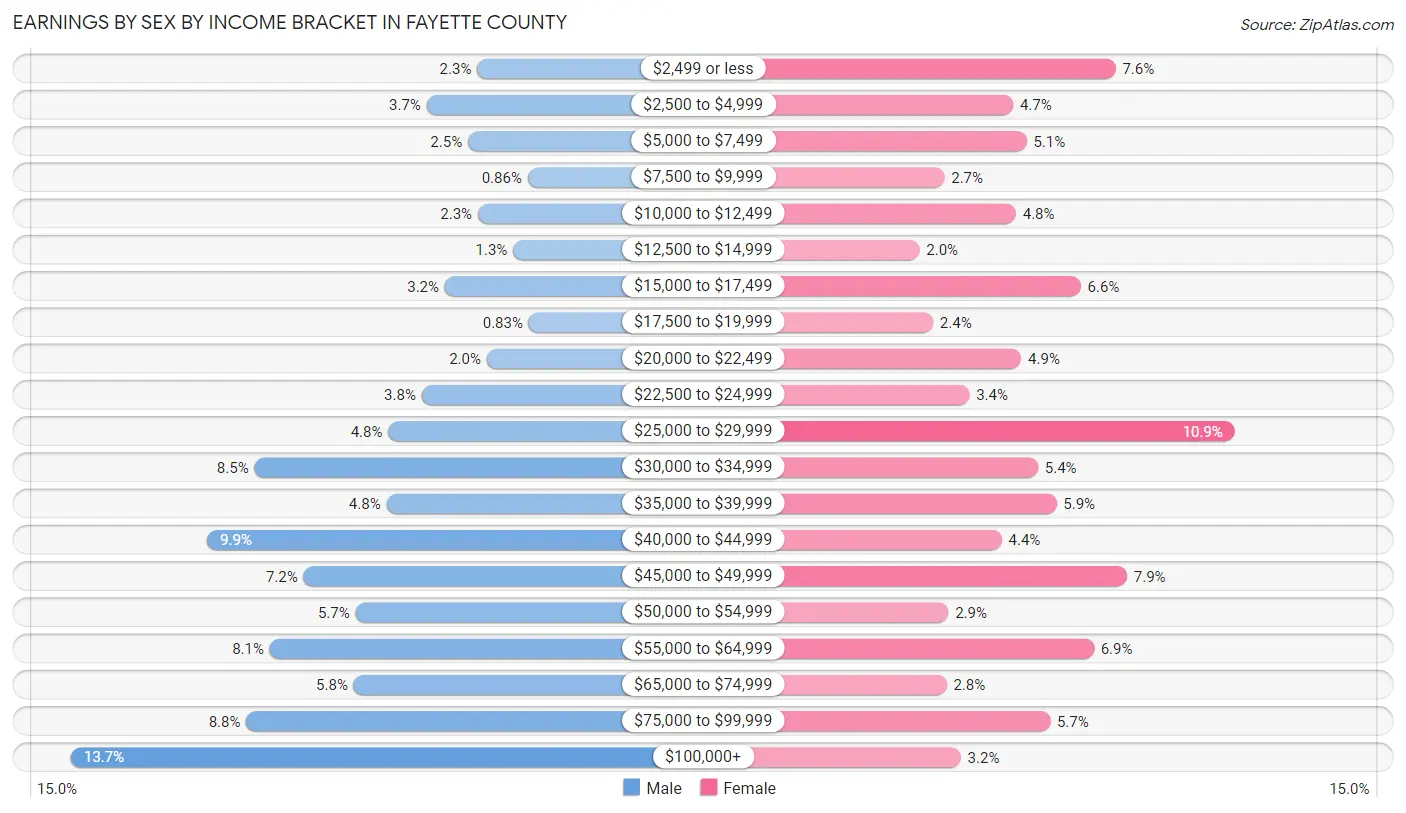
Earnings by Sex by Income Bracket in Fayette County
The most common earnings brackets in Fayette County are $100,000+ for men (1,069 | 13.7%) and $25,000 to $29,999 for women (716 | 10.9%).
| Income | Male | Female |
| $2,499 or less | 178 (2.3%) | 496 (7.5%) |
| $2,500 to $4,999 | 289 (3.7%) | 307 (4.7%) |
| $5,000 to $7,499 | 198 (2.5%) | 332 (5.1%) |
| $7,500 to $9,999 | 67 (0.9%) | 180 (2.7%) |
| $10,000 to $12,499 | 176 (2.3%) | 312 (4.8%) |
| $12,500 to $14,999 | 99 (1.3%) | 134 (2.0%) |
| $15,000 to $17,499 | 249 (3.2%) | 432 (6.6%) |
| $17,500 to $19,999 | 65 (0.8%) | 159 (2.4%) |
| $20,000 to $22,499 | 157 (2.0%) | 322 (4.9%) |
| $22,500 to $24,999 | 300 (3.8%) | 226 (3.4%) |
| $25,000 to $29,999 | 373 (4.8%) | 716 (10.9%) |
| $30,000 to $34,999 | 666 (8.5%) | 353 (5.4%) |
| $35,000 to $39,999 | 377 (4.8%) | 387 (5.9%) |
| $40,000 to $44,999 | 770 (9.9%) | 286 (4.3%) |
| $45,000 to $49,999 | 559 (7.2%) | 517 (7.9%) |
| $50,000 to $54,999 | 445 (5.7%) | 187 (2.9%) |
| $55,000 to $64,999 | 633 (8.1%) | 456 (6.9%) |
| $65,000 to $74,999 | 449 (5.8%) | 184 (2.8%) |
| $75,000 to $99,999 | 684 (8.8%) | 375 (5.7%) |
| $100,000+ | 1,069 (13.7%) | 210 (3.2%) |
| Total | 7,803 (100.0%) | 6,571 (100.0%) |
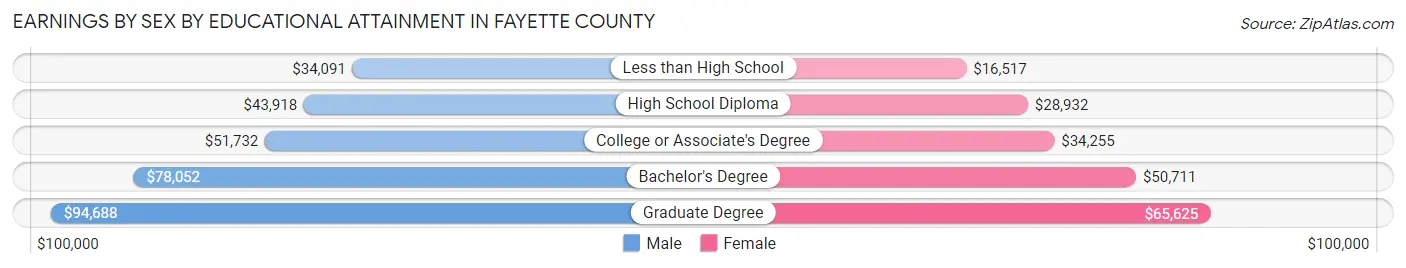
Earnings by Sex by Educational Attainment in Fayette County
Average earnings in Fayette County are $48,206 for men and $32,083 for women, a difference of 33.5%. Men with an educational attainment of graduate degree enjoy the highest average annual earnings of $94,688, while those with less than high school education earn the least with $34,091. Women with an educational attainment of graduate degree earn the most with the average annual earnings of $65,625, while those with less than high school education have the smallest earnings of $16,517.
| Educational Attainment | Male Income | Female Income |
| Less than High School | $34,091 | $16,517 |
| High School Diploma | $43,918 | $28,932 |
| College or Associate's Degree | $51,732 | $34,255 |
| Bachelor's Degree | $78,052 | $50,711 |
| Graduate Degree | $94,688 | $65,625 |
| Total | $48,206 | $32,083 |
Family Income in Fayette County
Family Income Brackets in Fayette County
According to the Fayette County family income data, there are 1,452 families falling into the $50,000 to $74,999 income range, which is the most common income bracket and makes up 19.4% of all families. Conversely, the $10,000 to $14,999 income bracket is the least frequent group with only 112 families (1.5%) belonging to this category.
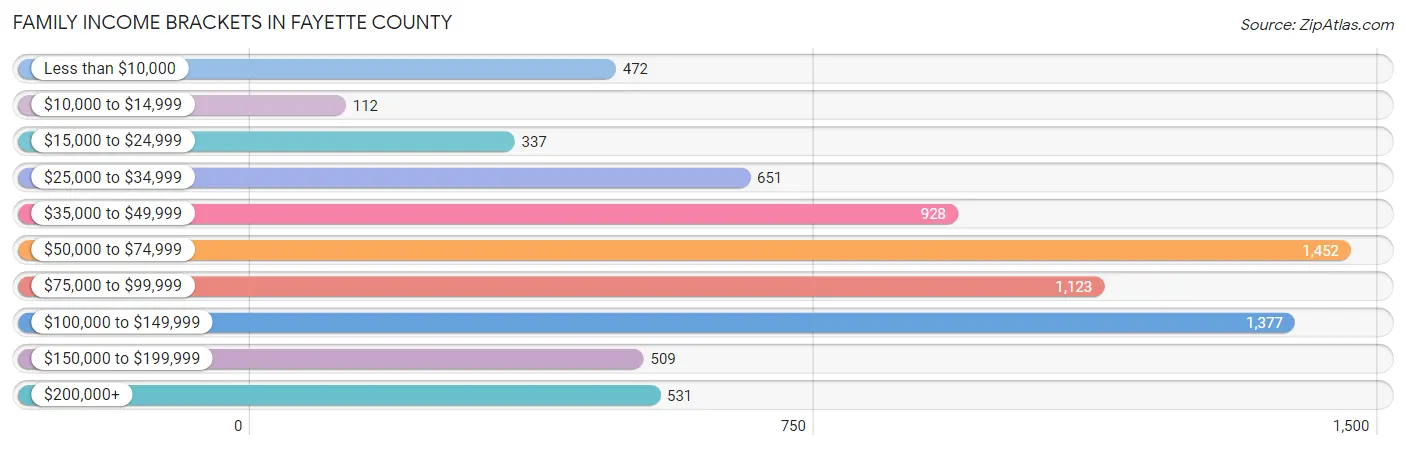
| Income Bracket | # Families | % Families |
| Less than $10,000 | 472 | 6.3% |
| $10,000 to $14,999 | 112 | 1.5% |
| $15,000 to $24,999 | 337 | 4.5% |
| $25,000 to $34,999 | 651 | 8.7% |
| $35,000 to $49,999 | 928 | 12.4% |
| $50,000 to $74,999 | 1,452 | 19.4% |
| $75,000 to $99,999 | 1,123 | 15.0% |
| $100,000 to $149,999 | 1,377 | 18.4% |
| $150,000 to $199,999 | 509 | 6.8% |
| $200,000+ | 531 | 7.1% |
Family Income by Famaliy Size in Fayette County
5-person families (689 | 9.2%) account for the highest median family income in Fayette County with $102,417 per family, while 3-person families (1,543 | 20.6%) have the highest median income of $28,568 per family member.
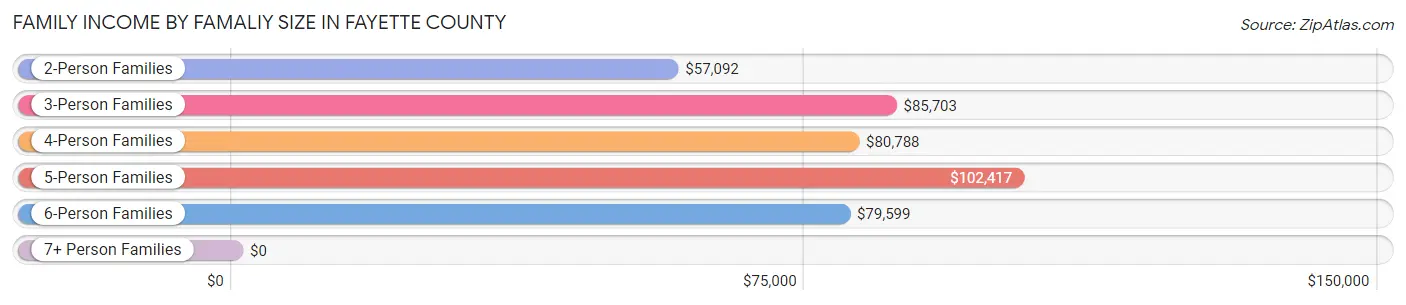
| Income Bracket | # Families | Median Income |
| 2-Person Families | 3,854 (51.5%) | $57,092 |
| 3-Person Families | 1,543 (20.6%) | $85,703 |
| 4-Person Families | 1,003 (13.4%) | $80,788 |
| 5-Person Families | 689 (9.2%) | $102,417 |
| 6-Person Families | 241 (3.2%) | $79,599 |
| 7+ Person Families | 155 (2.1%) | $0 |
| Total | 7,485 (100.0%) | $71,719 |
Family Income by Number of Earners in Fayette County
The median family income in Fayette County is $71,719, with families comprising 3+ earners (900) having the highest median family income of $130,000, while families with no earners (1,644) have the lowest median family income of $31,808, accounting for 12.0% and 22.0% of families, respectively.
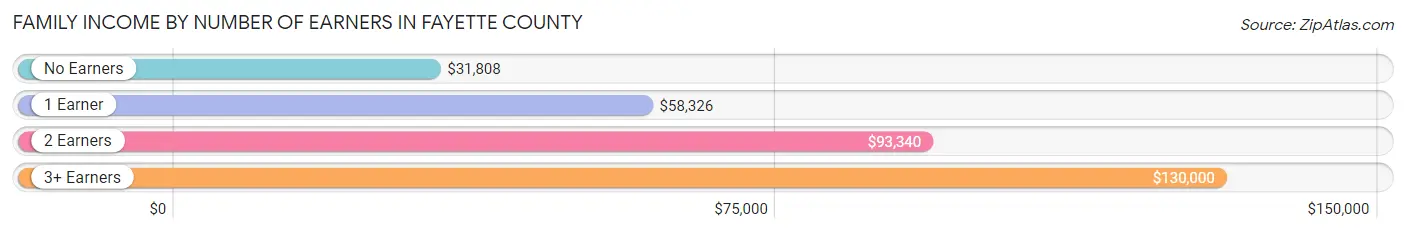
| Number of Earners | # Families | Median Income |
| No Earners | 1,644 (22.0%) | $31,808 |
| 1 Earner | 2,192 (29.3%) | $58,326 |
| 2 Earners | 2,749 (36.7%) | $93,340 |
| 3+ Earners | 900 (12.0%) | $130,000 |
| Total | 7,485 (100.0%) | $71,719 |
Household Income in Fayette County
Household Income Brackets in Fayette County
With 2,115 households falling in the category, the $50,000 to $74,999 income range is the most frequent in Fayette County, accounting for 18.2% of all households. In contrast, only 581 households (5.0%) fall into the $150,000 to $199,999 income bracket, making it the least populous group.
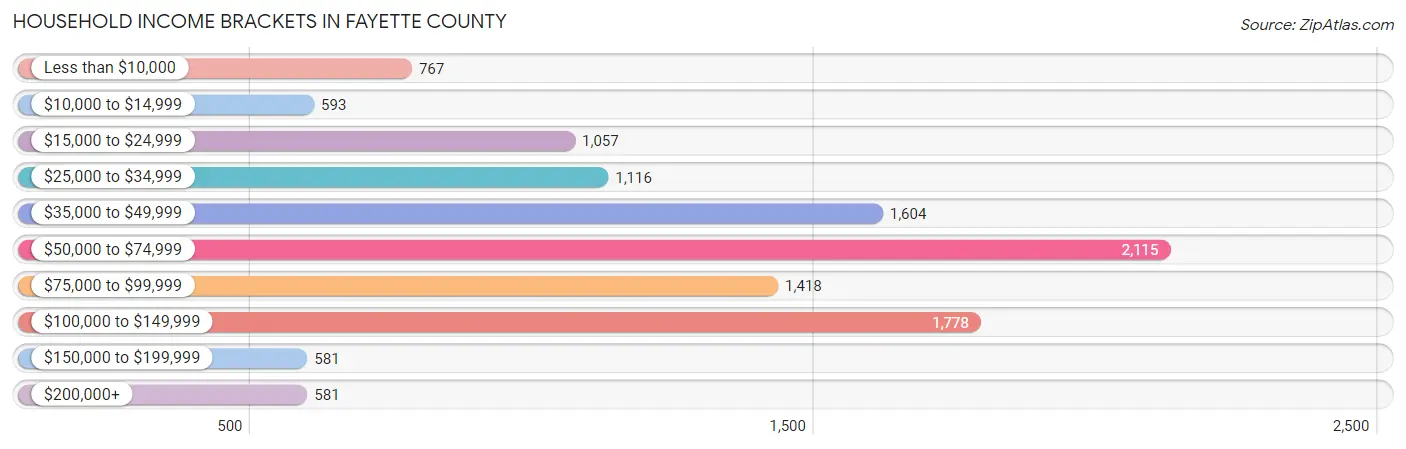
| Income Bracket | # Households | % Households |
| Less than $10,000 | 767 | 6.6% |
| $10,000 to $14,999 | 593 | 5.1% |
| $15,000 to $24,999 | 1,057 | 9.1% |
| $25,000 to $34,999 | 1,116 | 9.6% |
| $35,000 to $49,999 | 1,604 | 13.8% |
| $50,000 to $74,999 | 2,115 | 18.2% |
| $75,000 to $99,999 | 1,418 | 12.2% |
| $100,000 to $149,999 | 1,778 | 15.3% |
| $150,000 to $199,999 | 581 | 5.0% |
| $200,000+ | 581 | 5.0% |
Household Income by Householder Age in Fayette County
The median household income in Fayette County is $56,773, with the highest median household income of $70,144 found in the 25 to 44 years age bracket for the primary householder. A total of 3,424 households (29.5%) fall into this category. Meanwhile, the 65+ years age bracket for the primary householder has the lowest median household income of $40,474, with 3,272 households (28.2%) in this group.
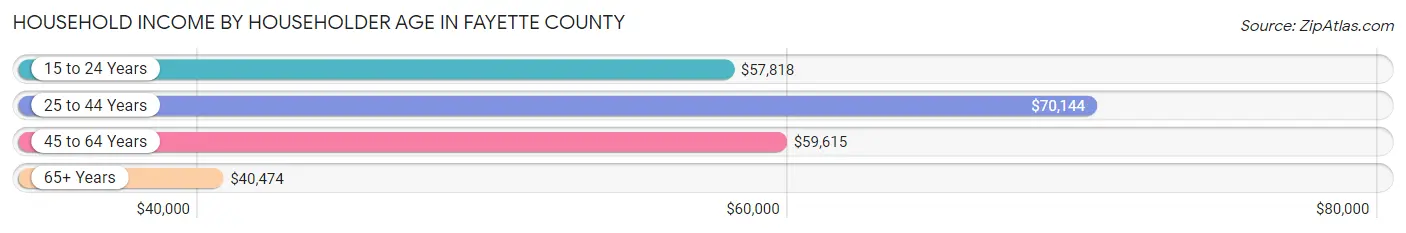
| Income Bracket | # Households | Median Income |
| 15 to 24 Years | 430 (3.7%) | $57,818 |
| 25 to 44 Years | 3,424 (29.5%) | $70,144 |
| 45 to 64 Years | 4,494 (38.7%) | $59,615 |
| 65+ Years | 3,272 (28.2%) | $40,474 |
| Total | 11,620 (100.0%) | $56,773 |
Poverty in Fayette County
Income Below Poverty by Sex and Age in Fayette County
With 12.5% poverty level for males and 19.0% for females among the residents of Fayette County, 6 to 11 year old males and 5 year old females are the most vulnerable to poverty, with 449 males (36.8%) and 104 females (42.6%) in their respective age groups living below the poverty level.
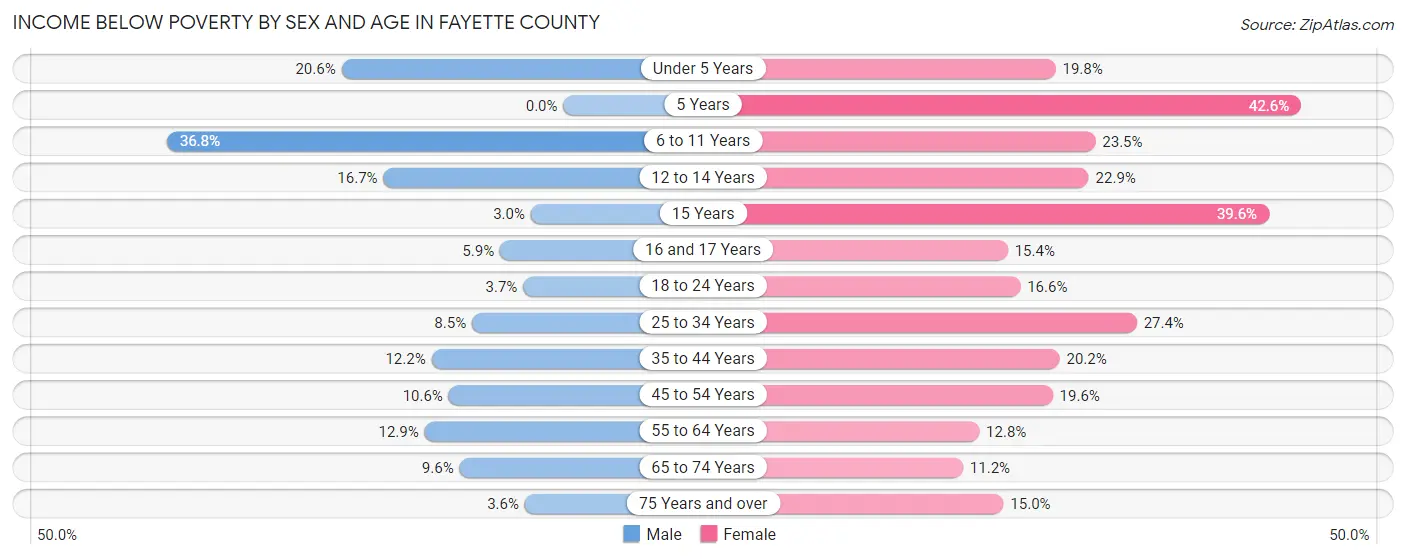
| Age Bracket | Male | Female |
| Under 5 Years | 168 (20.6%) | 149 (19.8%) |
| 5 Years | 0 (0.0%) | 104 (42.6%) |
| 6 to 11 Years | 449 (36.8%) | 249 (23.5%) |
| 12 to 14 Years | 98 (16.7%) | 123 (22.9%) |
| 15 Years | 8 (3.0%) | 67 (39.6%) |
| 16 and 17 Years | 23 (5.9%) | 67 (15.4%) |
| 18 to 24 Years | 45 (3.7%) | 189 (16.6%) |
| 25 to 34 Years | 151 (8.5%) | 470 (27.4%) |
| 35 to 44 Years | 202 (12.2%) | 345 (20.2%) |
| 45 to 54 Years | 206 (10.6%) | 372 (19.6%) |
| 55 to 64 Years | 242 (12.9%) | 263 (12.8%) |
| 65 to 74 Years | 140 (9.6%) | 178 (11.2%) |
| 75 Years and over | 27 (3.6%) | 164 (15.0%) |
| Total | 1,759 (12.5%) | 2,740 (19.0%) |
Income Above Poverty by Sex and Age in Fayette County
According to the poverty statistics in Fayette County, males aged 5 years and females aged 65 to 74 years are the age groups that are most secure financially, with 100.0% of males and 88.8% of females in these age groups living above the poverty line.
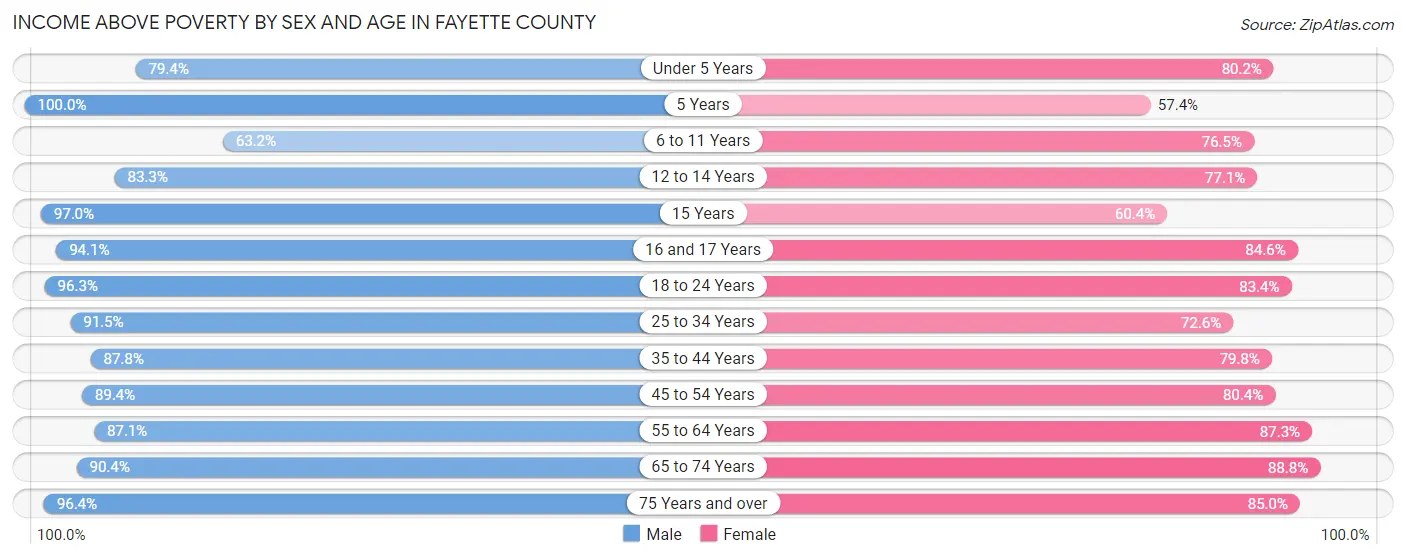
| Age Bracket | Male | Female |
| Under 5 Years | 648 (79.4%) | 602 (80.2%) |
| 5 Years | 114 (100.0%) | 140 (57.4%) |
| 6 to 11 Years | 771 (63.2%) | 809 (76.5%) |
| 12 to 14 Years | 489 (83.3%) | 414 (77.1%) |
| 15 Years | 257 (97.0%) | 102 (60.4%) |
| 16 and 17 Years | 368 (94.1%) | 368 (84.6%) |
| 18 to 24 Years | 1,160 (96.3%) | 952 (83.4%) |
| 25 to 34 Years | 1,630 (91.5%) | 1,247 (72.6%) |
| 35 to 44 Years | 1,448 (87.8%) | 1,362 (79.8%) |
| 45 to 54 Years | 1,731 (89.4%) | 1,529 (80.4%) |
| 55 to 64 Years | 1,637 (87.1%) | 1,800 (87.3%) |
| 65 to 74 Years | 1,312 (90.4%) | 1,406 (88.8%) |
| 75 Years and over | 728 (96.4%) | 929 (85.0%) |
| Total | 12,293 (87.5%) | 11,660 (81.0%) |
Income Below Poverty Among Married-Couple Families in Fayette County
The poverty statistics for married-couple families in Fayette County show that 4.9% or 263 of the total 5,343 families live below the poverty line. Families with 5 or more children have the highest poverty rate of 43.6%, comprising of 34 families. On the other hand, families with 1 or 2 children have the lowest poverty rate of 3.3%, which includes 46 families.
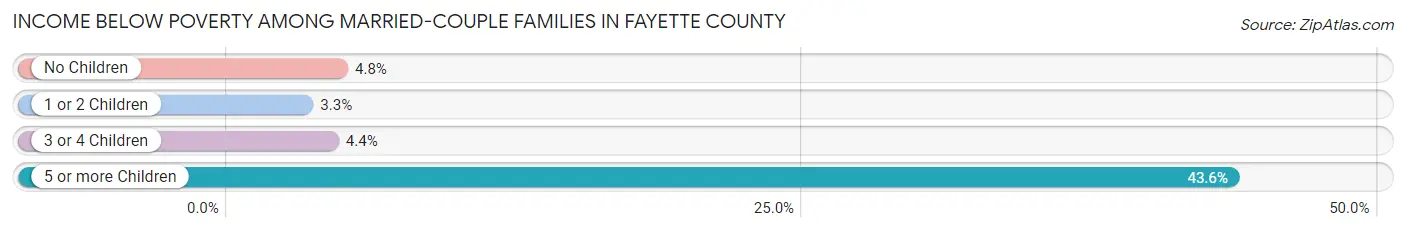
| Children | Above Poverty | Below Poverty |
| No Children | 3,179 (95.2%) | 160 (4.8%) |
| 1 or 2 Children | 1,356 (96.7%) | 46 (3.3%) |
| 3 or 4 Children | 501 (95.6%) | 23 (4.4%) |
| 5 or more Children | 44 (56.4%) | 34 (43.6%) |
| Total | 5,080 (95.1%) | 263 (4.9%) |
Income Below Poverty Among Single-Parent Households in Fayette County
According to the poverty data in Fayette County, 10.3% or 75 single-father households and 35.7% or 505 single-mother households are living below the poverty line. Among single-father households, those with 1 or 2 children have the highest poverty rate, with 66 households (17.9%) experiencing poverty. Likewise, among single-mother households, those with 3 or 4 children have the highest poverty rate, with 205 households (66.6%) falling below the poverty line.
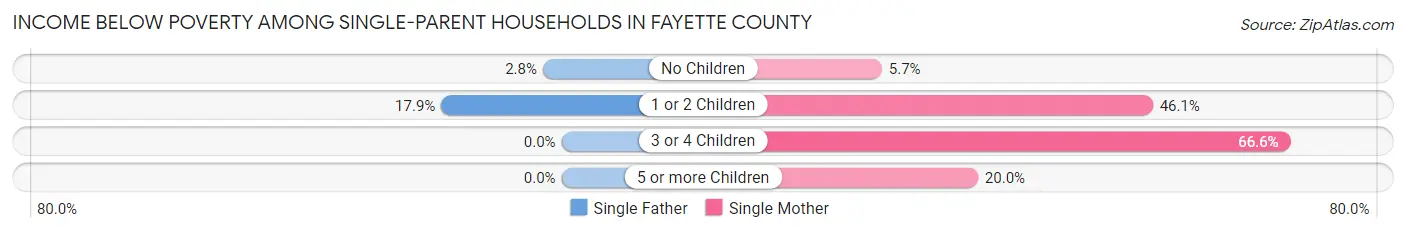
| Children | Single Father | Single Mother |
| No Children | 9 (2.8%) | 29 (5.7%) |
| 1 or 2 Children | 66 (17.9%) | 268 (46.1%) |
| 3 or 4 Children | 0 (0.0%) | 205 (66.6%) |
| 5 or more Children | 0 (0.0%) | 3 (20.0%) |
| Total | 75 (10.3%) | 505 (35.7%) |
Income Below Poverty Among Married-Couple vs Single-Parent Households in Fayette County
The poverty data for Fayette County shows that 263 of the married-couple family households (4.9%) and 580 of the single-parent households (27.1%) are living below the poverty level. Within the married-couple family households, those with 5 or more children have the highest poverty rate, with 34 households (43.6%) falling below the poverty line. Among the single-parent households, those with 3 or 4 children have the highest poverty rate, with 205 household (59.8%) living below poverty.
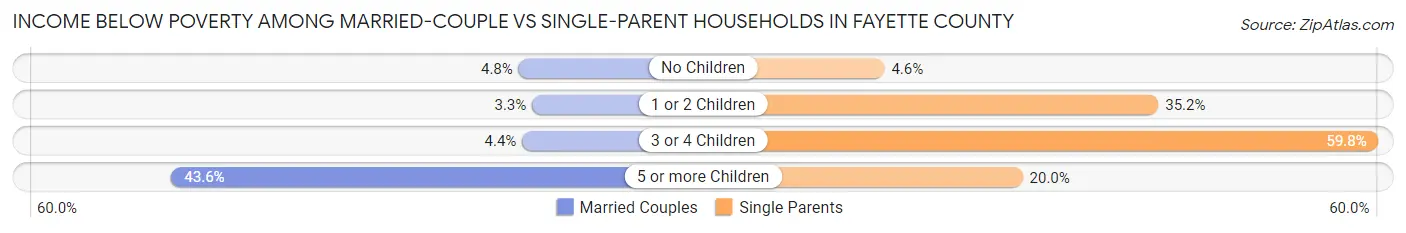
| Children | Married-Couple Families | Single-Parent Households |
| No Children | 160 (4.8%) | 38 (4.6%) |
| 1 or 2 Children | 46 (3.3%) | 334 (35.2%) |
| 3 or 4 Children | 23 (4.4%) | 205 (59.8%) |
| 5 or more Children | 34 (43.6%) | 3 (20.0%) |
| Total | 263 (4.9%) | 580 (27.1%) |
Race in Fayette County
The most populous races in Fayette County are White / Caucasian (26,472 | 91.6%), Two or more Races (1,102 | 3.8%), and Black / African American (803 | 2.8%).
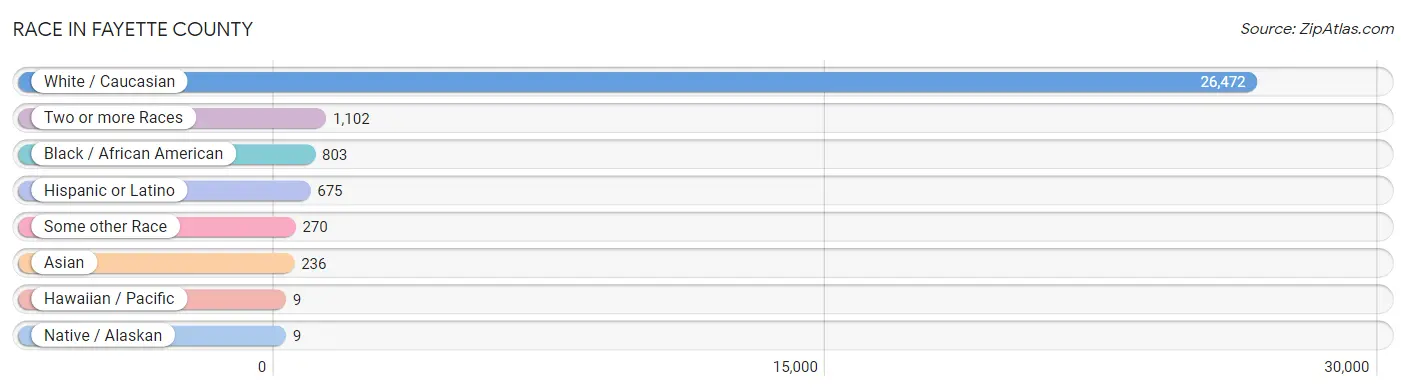
| Race | # Population | % Population |
| Asian | 236 | 0.8% |
| Black / African American | 803 | 2.8% |
| Hawaiian / Pacific | 9 | 0.0% |
| Hispanic or Latino | 675 | 2.3% |
| Native / Alaskan | 9 | 0.0% |
| White / Caucasian | 26,472 | 91.6% |
| Two or more Races | 1,102 | 3.8% |
| Some other Race | 270 | 0.9% |
| Total | 28,901 | 100.0% |
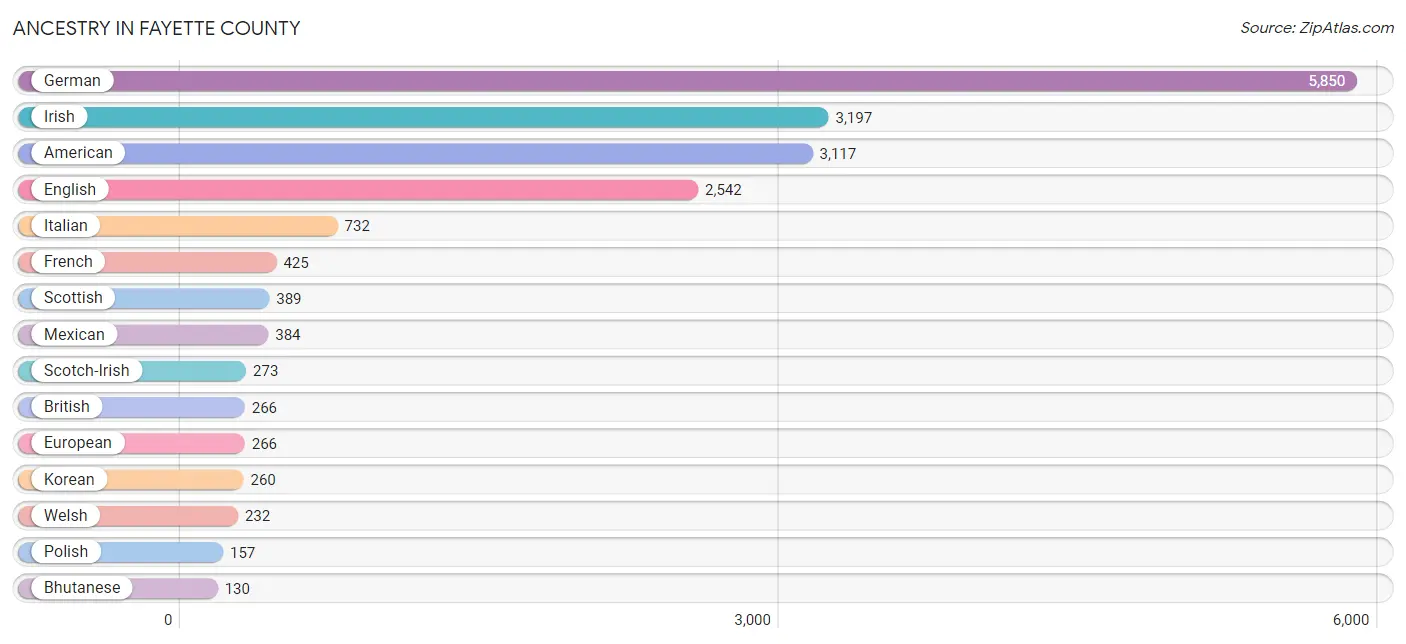
Ancestry in Fayette County
The most populous ancestries reported in Fayette County are German (5,850 | 20.2%), Irish (3,197 | 11.1%), American (3,117 | 10.8%), English (2,542 | 8.8%), and Italian (732 | 2.5%), together accounting for 53.4% of all Fayette County residents.
| Ancestry | # Population | % Population |
| African | 17 | 0.1% |
| American | 3,117 | 10.8% |
| Arab | 91 | 0.3% |
| Austrian | 31 | 0.1% |
| Bhutanese | 130 | 0.4% |
| British | 266 | 0.9% |
| Canadian | 3 | 0.0% |
| Central American | 58 | 0.2% |
| Cherokee | 71 | 0.3% |
| Cuban | 115 | 0.4% |
| Czech | 25 | 0.1% |
| Czechoslovakian | 8 | 0.0% |
| Danish | 20 | 0.1% |
| Dutch | 123 | 0.4% |
| Eastern European | 56 | 0.2% |
| Egyptian | 22 | 0.1% |
| English | 2,542 | 8.8% |
| European | 266 | 0.9% |
| Finnish | 30 | 0.1% |
| French | 425 | 1.5% |
| French Canadian | 7 | 0.0% |
| German | 5,850 | 20.2% |
| Greek | 22 | 0.1% |
| Guatemalan | 29 | 0.1% |
| Honduran | 8 | 0.0% |
| Indian (Asian) | 15 | 0.1% |
| Irish | 3,197 | 11.1% |
| Italian | 732 | 2.5% |
| Korean | 260 | 0.9% |
| Lithuanian | 20 | 0.1% |
| Mexican | 384 | 1.3% |
| Native Hawaiian | 9 | 0.0% |
| Nicaraguan | 21 | 0.1% |
| Norwegian | 114 | 0.4% |
| Polish | 157 | 0.5% |
| Puerto Rican | 78 | 0.3% |
| Romanian | 15 | 0.1% |
| Russian | 49 | 0.2% |
| Scandinavian | 40 | 0.1% |
| Scotch-Irish | 273 | 0.9% |
| Scottish | 389 | 1.3% |
| Slovak | 41 | 0.1% |
| Slovene | 15 | 0.1% |
| Spanish | 26 | 0.1% |
| Subsaharan African | 17 | 0.1% |
| Swedish | 54 | 0.2% |
| Swiss | 112 | 0.4% |
| Syrian | 69 | 0.2% |
| Welsh | 232 | 0.8% | View All 49 Rows |
Immigrants in Fayette County
The most numerous immigrant groups reported in Fayette County came from Latin America (300 | 1.0%), Asia (235 | 0.8%), Central America (185 | 0.6%), Eastern Asia (120 | 0.4%), and Japan (120 | 0.4%), together accounting for 3.3% of all Fayette County residents.
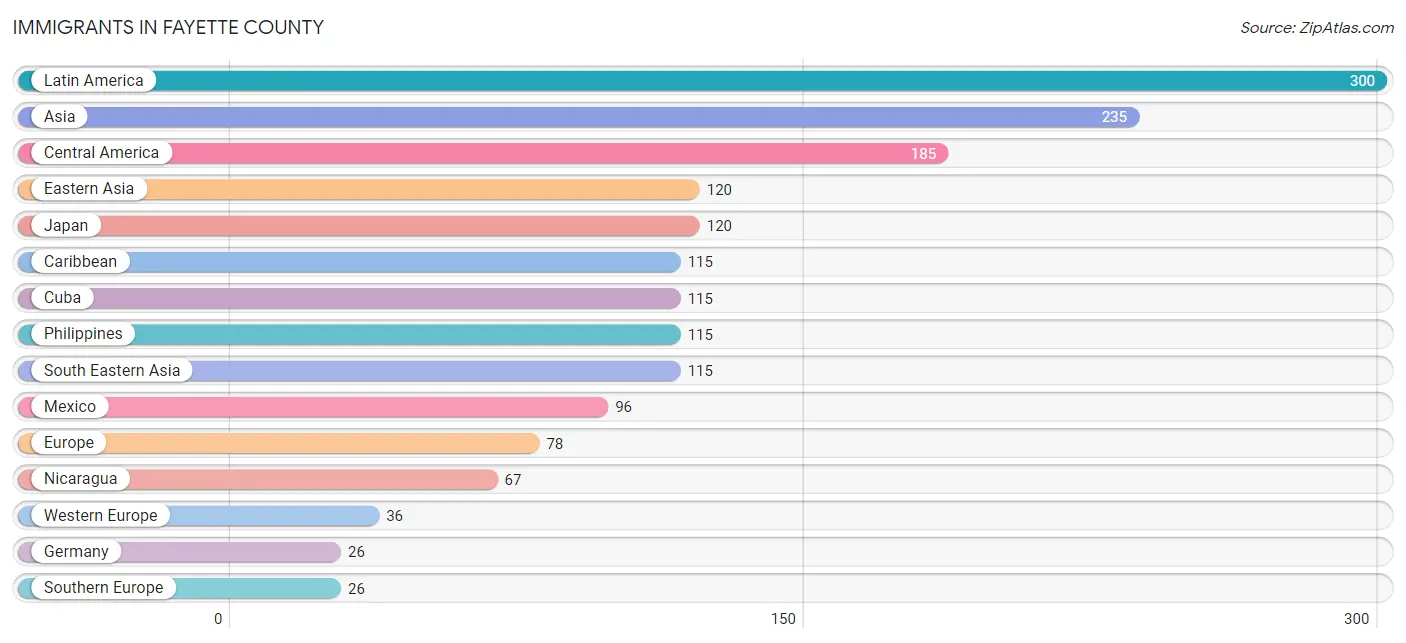
| Immigration Origin | # Population | % Population |
| Africa | 7 | 0.0% |
| Asia | 235 | 0.8% |
| Caribbean | 115 | 0.4% |
| Central America | 185 | 0.6% |
| Cuba | 115 | 0.4% |
| Eastern Africa | 7 | 0.0% |
| Eastern Asia | 120 | 0.4% |
| Eastern Europe | 8 | 0.0% |
| Ethiopia | 7 | 0.0% |
| Europe | 78 | 0.3% |
| France | 10 | 0.0% |
| Germany | 26 | 0.1% |
| Guatemala | 14 | 0.1% |
| Honduras | 8 | 0.0% |
| Japan | 120 | 0.4% |
| Latin America | 300 | 1.0% |
| Mexico | 96 | 0.3% |
| Nicaragua | 67 | 0.2% |
| Northern Europe | 8 | 0.0% |
| Philippines | 115 | 0.4% |
| Poland | 8 | 0.0% |
| South Eastern Asia | 115 | 0.4% |
| Southern Europe | 26 | 0.1% |
| Spain | 26 | 0.1% |
| Western Europe | 36 | 0.1% | View All 25 Rows |
Sex and Age in Fayette County
Sex and Age in Fayette County
The most populous age groups in Fayette County are 10 to 14 Years (1,062 | 7.4%) for men and 55 to 59 Years (1,103 | 7.5%) for women.
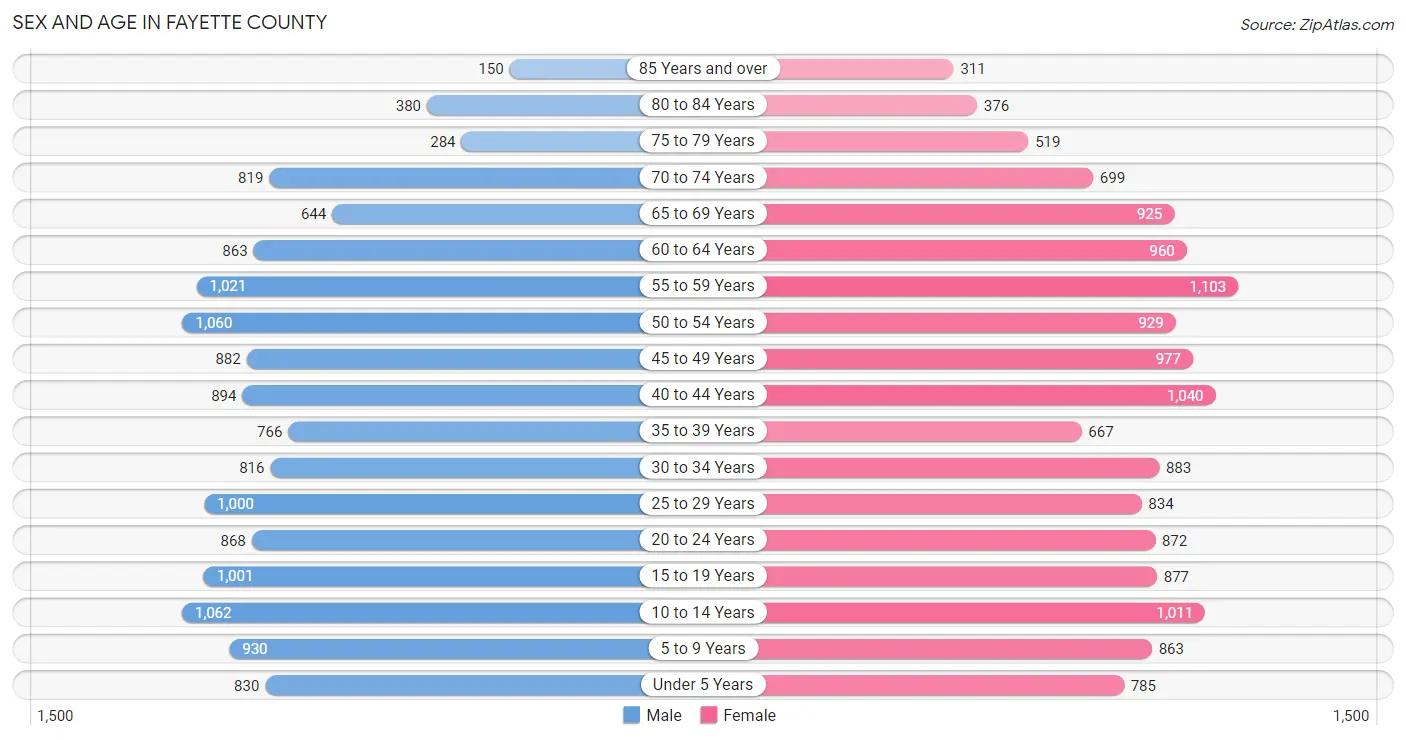
| Age Bracket | Male | Female |
| Under 5 Years | 830 (5.8%) | 785 (5.4%) |
| 5 to 9 Years | 930 (6.5%) | 863 (5.9%) |
| 10 to 14 Years | 1,062 (7.4%) | 1,011 (6.9%) |
| 15 to 19 Years | 1,001 (7.0%) | 877 (6.0%) |
| 20 to 24 Years | 868 (6.1%) | 872 (6.0%) |
| 25 to 29 Years | 1,000 (7.0%) | 834 (5.7%) |
| 30 to 34 Years | 816 (5.7%) | 883 (6.0%) |
| 35 to 39 Years | 766 (5.4%) | 667 (4.6%) |
| 40 to 44 Years | 894 (6.3%) | 1,040 (7.1%) |
| 45 to 49 Years | 882 (6.2%) | 977 (6.7%) |
| 50 to 54 Years | 1,060 (7.4%) | 929 (6.4%) |
| 55 to 59 Years | 1,021 (7.1%) | 1,103 (7.5%) |
| 60 to 64 Years | 863 (6.0%) | 960 (6.6%) |
| 65 to 69 Years | 644 (4.5%) | 925 (6.3%) |
| 70 to 74 Years | 819 (5.7%) | 699 (4.8%) |
| 75 to 79 Years | 284 (2.0%) | 519 (3.5%) |
| 80 to 84 Years | 380 (2.7%) | 376 (2.6%) |
| 85 Years and over | 150 (1.1%) | 311 (2.1%) |
| Total | 14,270 (100.0%) | 14,631 (100.0%) |
Families and Households in Fayette County
Median Family Size in Fayette County
The median family size in Fayette County is 3.01 persons per family, with married-couple families (5,343 | 71.4%) accounting for the largest median family size of 3.08 persons per family. On the other hand, single male/father families (727 | 9.7%) represent the smallest median family size with 2.52 persons per family.
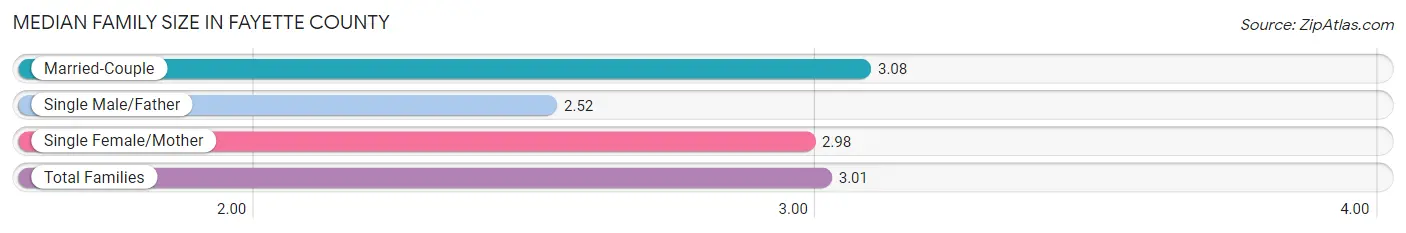
| Family Type | # Families | Family Size |
| Married-Couple | 5,343 (71.4%) | 3.08 |
| Single Male/Father | 727 (9.7%) | 2.52 |
| Single Female/Mother | 1,415 (18.9%) | 2.98 |
| Total Families | 7,485 (100.0%) | 3.01 |
Median Household Size in Fayette County
The median household size in Fayette County is 2.46 persons per household, with single female/mother households (1,415 | 12.2%) accounting for the largest median household size of 3.3 persons per household. non-family households (4,135 | 35.6%) represent the smallest median household size with 1.27 persons per household.
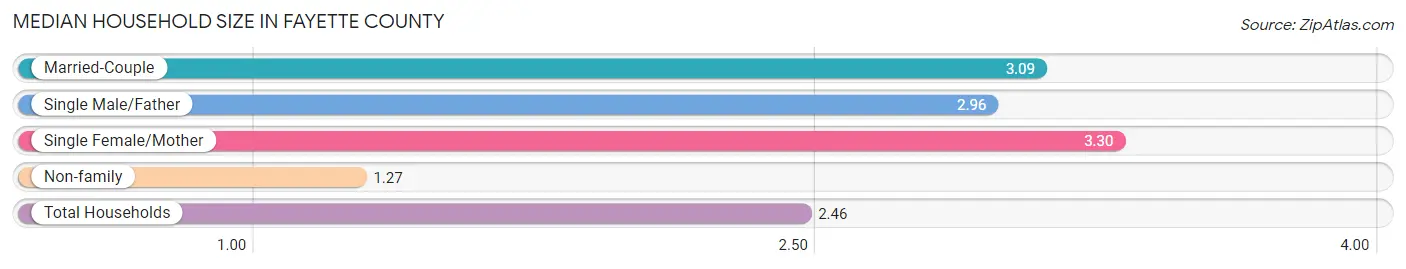
| Household Type | # Households | Household Size |
| Married-Couple | 5,343 (46.0%) | 3.09 |
| Single Male/Father | 727 (6.3%) | 2.96 |
| Single Female/Mother | 1,415 (12.2%) | 3.30 |
| Non-family | 4,135 (35.6%) | 1.27 |
| Total Households | 11,620 (100.0%) | 2.46 |
Household Size by Marriage Status in Fayette County
Out of a total of 11,620 households in Fayette County, 7,485 (64.4%) are family households, while 4,135 (35.6%) are nonfamily households. The most numerous type of family households are 2-person households, comprising 3,573, and the most common type of nonfamily households are 1-person households, comprising 3,399.
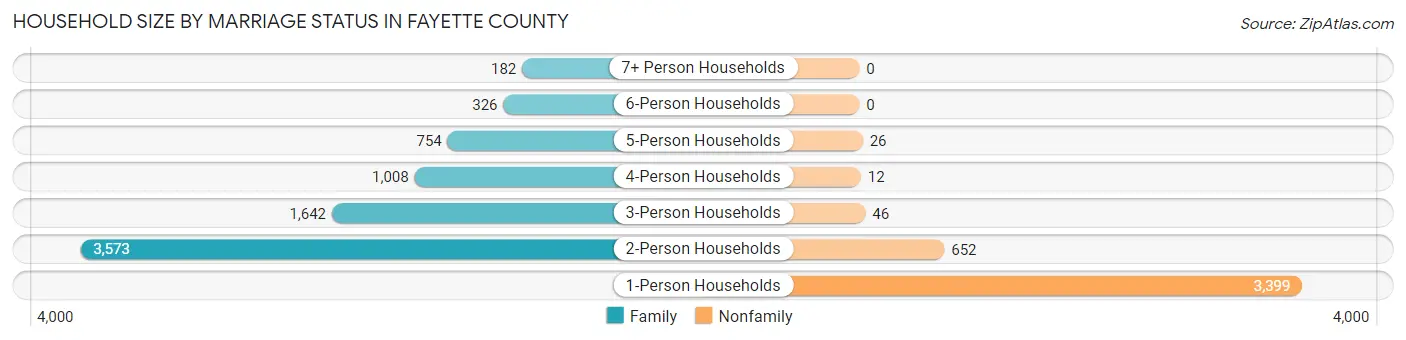
| Household Size | Family Households | Nonfamily Households |
| 1-Person Households | - | 3,399 (29.2%) |
| 2-Person Households | 3,573 (30.7%) | 652 (5.6%) |
| 3-Person Households | 1,642 (14.1%) | 46 (0.4%) |
| 4-Person Households | 1,008 (8.7%) | 12 (0.1%) |
| 5-Person Households | 754 (6.5%) | 26 (0.2%) |
| 6-Person Households | 326 (2.8%) | 0 (0.0%) |
| 7+ Person Households | 182 (1.6%) | 0 (0.0%) |
| Total | 7,485 (64.4%) | 4,135 (35.6%) |
Female Fertility in Fayette County
Fertility by Age in Fayette County
Average fertility rate in Fayette County is 65.0 births per 1,000 women. Women in the age bracket of 20 to 34 years have the highest fertility rate with 117.0 births per 1,000 women. Women in the age bracket of 20 to 34 years acount for 74.2% of all women with births.
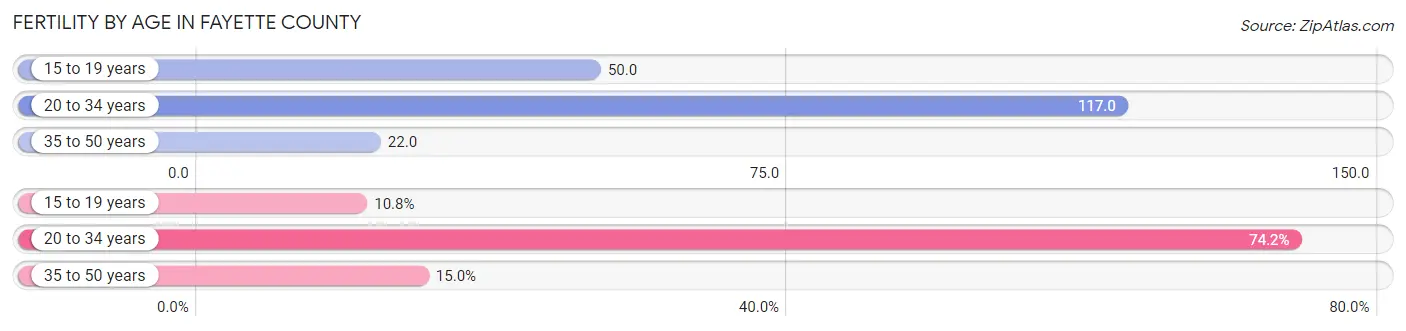
| Age Bracket | Women with Births | Births / 1,000 Women |
| 15 to 19 years | 44 (10.8%) | 50.0 |
| 20 to 34 years | 302 (74.2%) | 117.0 |
| 35 to 50 years | 61 (15.0%) | 22.0 |
| Total | 407 (100.0%) | 65.0 |
Fertility by Age by Marriage Status in Fayette County
43.0% of women with births (407) in Fayette County are married. The highest percentage of unmarried women with births falls into 15 to 19 years age bracket with 100.0% of them unmarried at the time of birth, while the lowest percentage of unmarried women with births belong to 35 to 50 years age bracket with 47.5% of them unmarried.
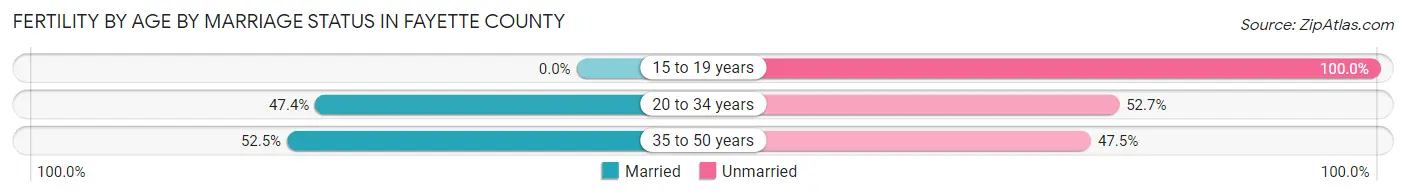
| Age Bracket | Married | Unmarried |
| 15 to 19 years | 0 (0.0%) | 44 (100.0%) |
| 20 to 34 years | 143 (47.3%) | 159 (52.6%) |
| 35 to 50 years | 32 (52.5%) | 29 (47.5%) |
| Total | 175 (43.0%) | 232 (57.0%) |
Fertility by Education in Fayette County
Average fertility rate in Fayette County is 65.0 births per 1,000 women. Women with the education attainment of graduate degree have the highest fertility rate of 103.0 births per 1,000 women, while women with the education attainment of less than high school have the lowest fertility at 4.0 births per 1,000 women. Women with the education attainment of college or associate's degree represent 44.2% of all women with births.
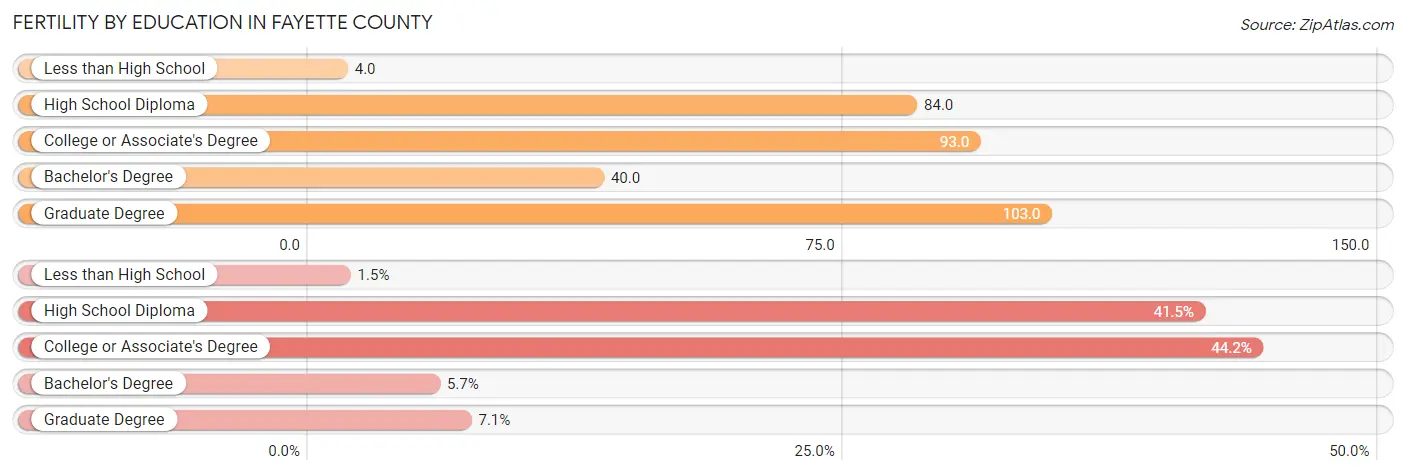
| Educational Attainment | Women with Births | Births / 1,000 Women |
| Less than High School | 6 (1.5%) | 4.0 |
| High School Diploma | 169 (41.5%) | 84.0 |
| College or Associate's Degree | 180 (44.2%) | 93.0 |
| Bachelor's Degree | 23 (5.7%) | 40.0 |
| Graduate Degree | 29 (7.1%) | 103.0 |
| Total | 407 (100.0%) | 65.0 |
Fertility by Education by Marriage Status in Fayette County
57.0% of women with births in Fayette County are unmarried. Women with the educational attainment of less than high school are most likely to be married with 100.0% of them married at childbirth, while women with the educational attainment of high school diploma are least likely to be married with 73.4% of them unmarried at childbirth.
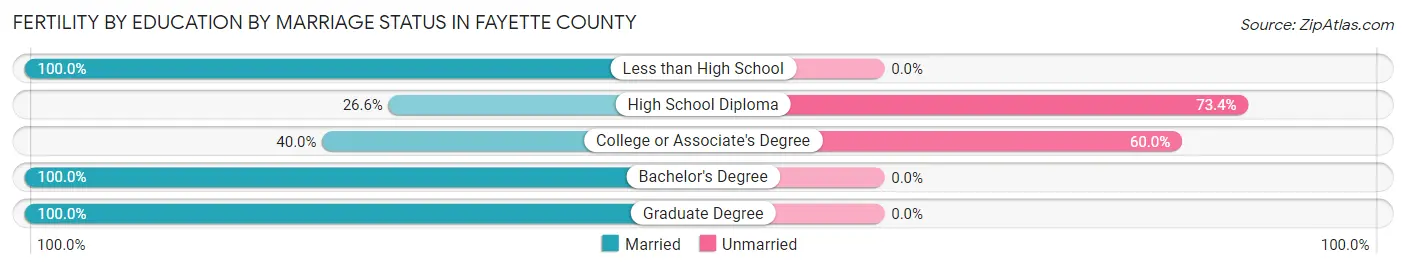
| Educational Attainment | Married | Unmarried |
| Less than High School | 6 (100.0%) | 0 (0.0%) |
| High School Diploma | 45 (26.6%) | 124 (73.4%) |
| College or Associate's Degree | 72 (40.0%) | 108 (60.0%) |
| Bachelor's Degree | 23 (100.0%) | 0 (0.0%) |
| Graduate Degree | 29 (100.0%) | 0 (0.0%) |
| Total | 175 (43.0%) | 232 (57.0%) |
Employment Characteristics in Fayette County
Employment by Class of Employer in Fayette County
Among the 12,678 employed individuals in Fayette County, private company employees (9,145 | 72.1%), local government employees (1,150 | 9.1%), and self-employed (not incorporated) (839 | 6.6%) make up the most common classes of employment.
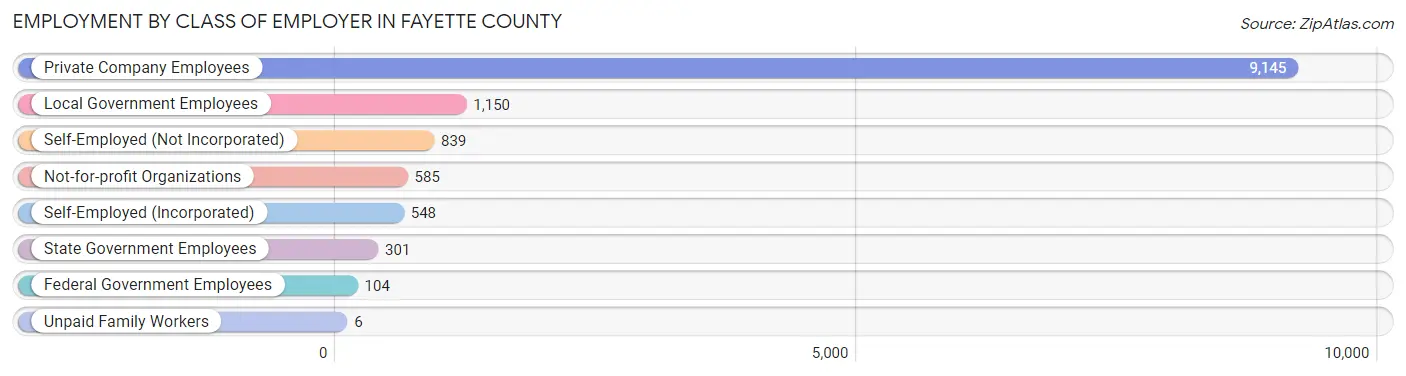
| Employer Class | # Employees | % Employees |
| Private Company Employees | 9,145 | 72.1% |
| Self-Employed (Incorporated) | 548 | 4.3% |
| Self-Employed (Not Incorporated) | 839 | 6.6% |
| Not-for-profit Organizations | 585 | 4.6% |
| Local Government Employees | 1,150 | 9.1% |
| State Government Employees | 301 | 2.4% |
| Federal Government Employees | 104 | 0.8% |
| Unpaid Family Workers | 6 | 0.1% |
| Total | 12,678 | 100.0% |
Employment Status by Age in Fayette County
According to the labor force statistics for Fayette County, out of the total population over 16 years of age (22,986), 58.9% or 13,539 individuals are in the labor force, with 4.3% or 582 of them unemployed. The age group with the highest labor force participation rate is 20 to 24 years, with 85.2% or 1,482 individuals in the labor force. Within the labor force, the 16 to 19 years age range has the highest percentage of unemployed individuals, with 12.9% or 109 of them being unemployed.
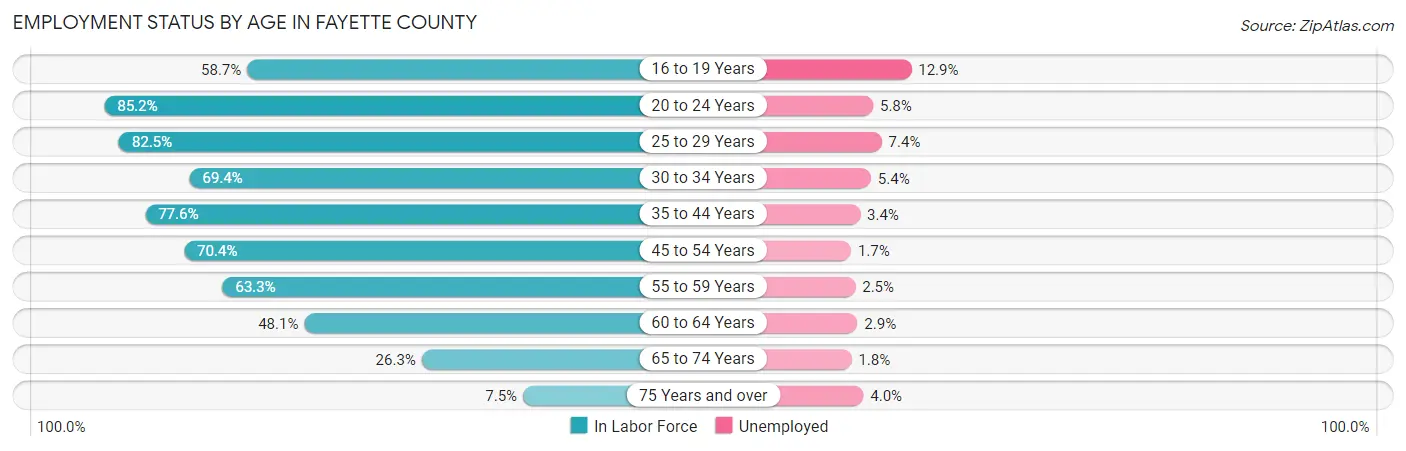
| Age Bracket | In Labor Force | Unemployed |
| 16 to 19 Years | 848 (58.7%) | 109 (12.9%) |
| 20 to 24 Years | 1,482 (85.2%) | 86 (5.8%) |
| 25 to 29 Years | 1,513 (82.5%) | 112 (7.4%) |
| 30 to 34 Years | 1,179 (69.4%) | 64 (5.4%) |
| 35 to 44 Years | 2,613 (77.6%) | 89 (3.4%) |
| 45 to 54 Years | 2,709 (70.4%) | 46 (1.7%) |
| 55 to 59 Years | 1,344 (63.3%) | 34 (2.5%) |
| 60 to 64 Years | 877 (48.1%) | 25 (2.9%) |
| 65 to 74 Years | 812 (26.3%) | 15 (1.8%) |
| 75 Years and over | 152 (7.5%) | 6 (4.0%) |
| Total | 13,539 (58.9%) | 582 (4.3%) |
Employment Status by Educational Attainment in Fayette County
According to labor force statistics for Fayette County, 69.7% of individuals (10,242) out of the total population between 25 and 64 years of age (14,695) are in the labor force, with 3.6% or 369 of them being unemployed. The group with the highest labor force participation rate are those with the educational attainment of bachelor's degree or higher, with 84.8% or 1,732 individuals in the labor force. Within the labor force, individuals with less than high school education have the highest percentage of unemployment, with 10.3% or 101 of them being unemployed.
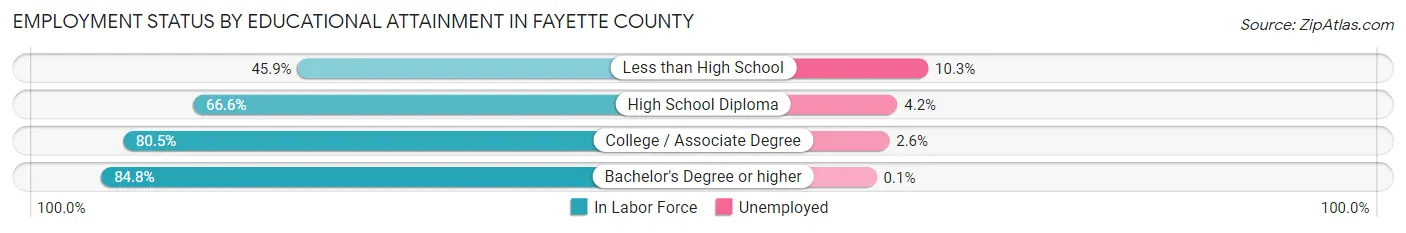
| Educational Attainment | In Labor Force | Unemployed |
| Less than High School | 985 (45.9%) | 221 (10.3%) |
| High School Diploma | 4,488 (66.6%) | 283 (4.2%) |
| College / Associate Degree | 3,033 (80.5%) | 98 (2.6%) |
| Bachelor's Degree or higher | 1,732 (84.8%) | 2 (0.1%) |
| Total | 10,242 (69.7%) | 529 (3.6%) |
Employment Occupations by Sex in Fayette County
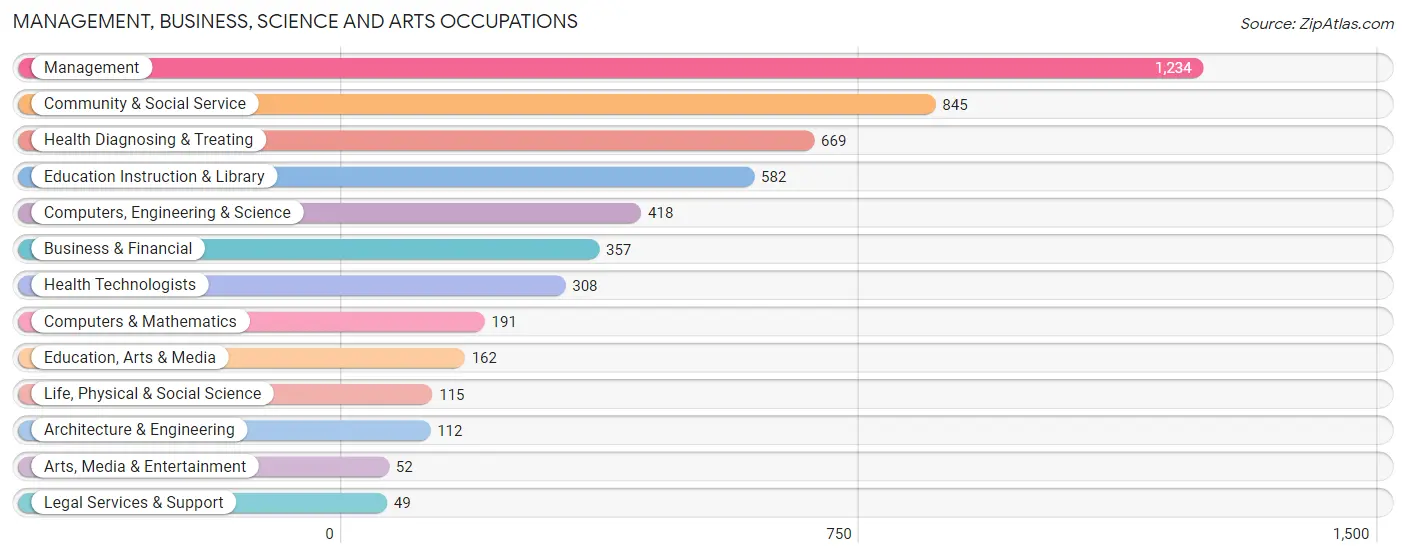
Management, Business, Science and Arts Occupations
The most common Management, Business, Science and Arts occupations in Fayette County are Management (1,234 | 9.5%), Community & Social Service (845 | 6.5%), Health Diagnosing & Treating (669 | 5.2%), Education Instruction & Library (582 | 4.5%), and Computers, Engineering & Science (418 | 3.2%).
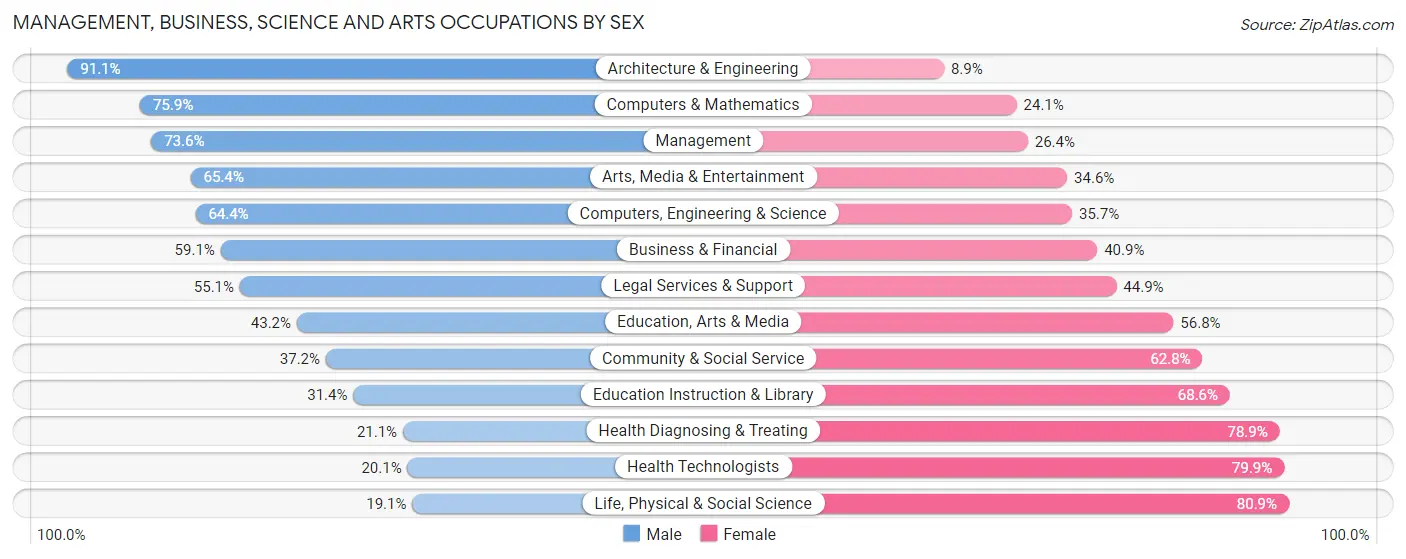
Management, Business, Science and Arts Occupations by Sex
Within the Management, Business, Science and Arts occupations in Fayette County, the most male-oriented occupations are Architecture & Engineering (91.1%), Computers & Mathematics (75.9%), and Management (73.6%), while the most female-oriented occupations are Life, Physical & Social Science (80.9%), Health Technologists (79.9%), and Health Diagnosing & Treating (78.9%).
| Occupation | Male | Female |
| Management | 908 (73.6%) | 326 (26.4%) |
| Business & Financial | 211 (59.1%) | 146 (40.9%) |
| Computers, Engineering & Science | 269 (64.3%) | 149 (35.6%) |
| Computers & Mathematics | 145 (75.9%) | 46 (24.1%) |
| Architecture & Engineering | 102 (91.1%) | 10 (8.9%) |
| Life, Physical & Social Science | 22 (19.1%) | 93 (80.9%) |
| Community & Social Service | 314 (37.2%) | 531 (62.8%) |
| Education, Arts & Media | 70 (43.2%) | 92 (56.8%) |
| Legal Services & Support | 27 (55.1%) | 22 (44.9%) |
| Education Instruction & Library | 183 (31.4%) | 399 (68.6%) |
| Arts, Media & Entertainment | 34 (65.4%) | 18 (34.6%) |
| Health Diagnosing & Treating | 141 (21.1%) | 528 (78.9%) |
| Health Technologists | 62 (20.1%) | 246 (79.9%) |
| Total (Category) | 1,843 (52.3%) | 1,680 (47.7%) |
| Total (Overall) | 7,228 (55.9%) | 5,712 (44.1%) |
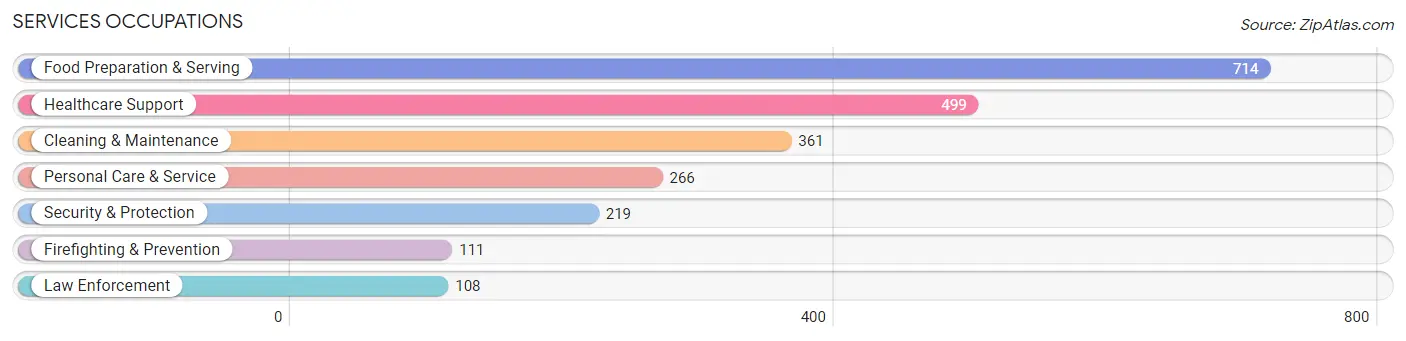
Services Occupations
The most common Services occupations in Fayette County are Food Preparation & Serving (714 | 5.5%), Healthcare Support (499 | 3.9%), Cleaning & Maintenance (361 | 2.8%), Personal Care & Service (266 | 2.1%), and Security & Protection (219 | 1.7%).
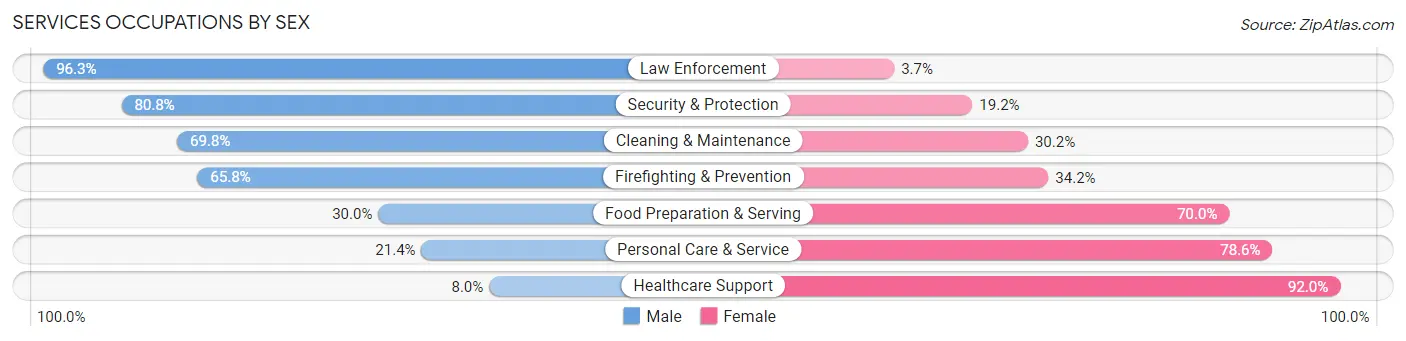
Services Occupations by Sex
Within the Services occupations in Fayette County, the most male-oriented occupations are Law Enforcement (96.3%), Security & Protection (80.8%), and Cleaning & Maintenance (69.8%), while the most female-oriented occupations are Healthcare Support (92.0%), Personal Care & Service (78.6%), and Food Preparation & Serving (70.0%).
| Occupation | Male | Female |
| Healthcare Support | 40 (8.0%) | 459 (92.0%) |
| Security & Protection | 177 (80.8%) | 42 (19.2%) |
| Firefighting & Prevention | 73 (65.8%) | 38 (34.2%) |
| Law Enforcement | 104 (96.3%) | 4 (3.7%) |
| Food Preparation & Serving | 214 (30.0%) | 500 (70.0%) |
| Cleaning & Maintenance | 252 (69.8%) | 109 (30.2%) |
| Personal Care & Service | 57 (21.4%) | 209 (78.6%) |
| Total (Category) | 740 (35.9%) | 1,319 (64.1%) |
| Total (Overall) | 7,228 (55.9%) | 5,712 (44.1%) |
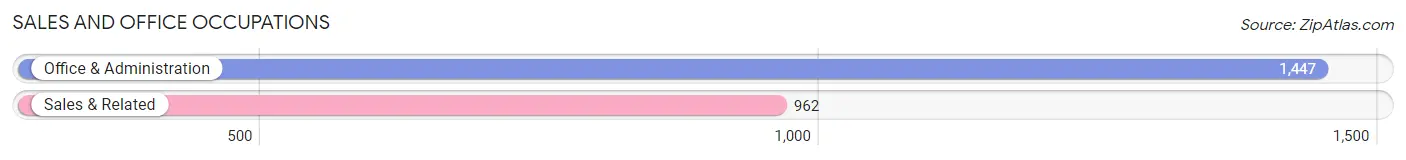
Sales and Office Occupations
The most common Sales and Office occupations in Fayette County are Office & Administration (1,447 | 11.2%), and Sales & Related (962 | 7.4%).
Sales and Office Occupations by Sex
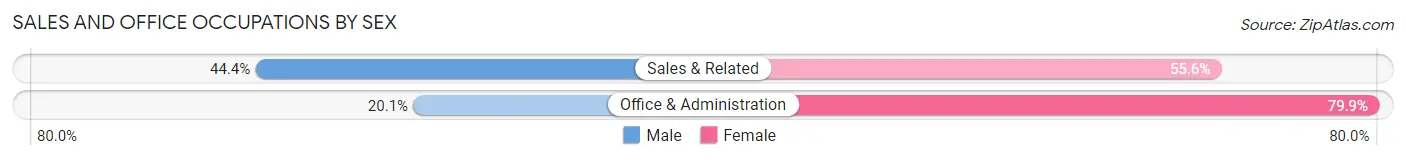
| Occupation | Male | Female |
| Sales & Related | 427 (44.4%) | 535 (55.6%) |
| Office & Administration | 291 (20.1%) | 1,156 (79.9%) |
| Total (Category) | 718 (29.8%) | 1,691 (70.2%) |
| Total (Overall) | 7,228 (55.9%) | 5,712 (44.1%) |
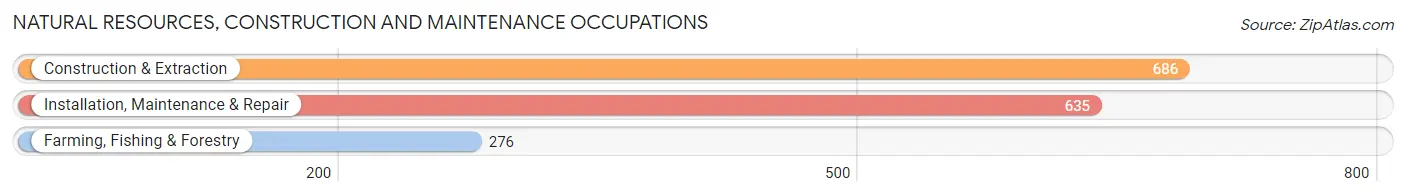
Natural Resources, Construction and Maintenance Occupations
The most common Natural Resources, Construction and Maintenance occupations in Fayette County are Construction & Extraction (686 | 5.3%), Installation, Maintenance & Repair (635 | 4.9%), and Farming, Fishing & Forestry (276 | 2.1%).
Natural Resources, Construction and Maintenance Occupations by Sex
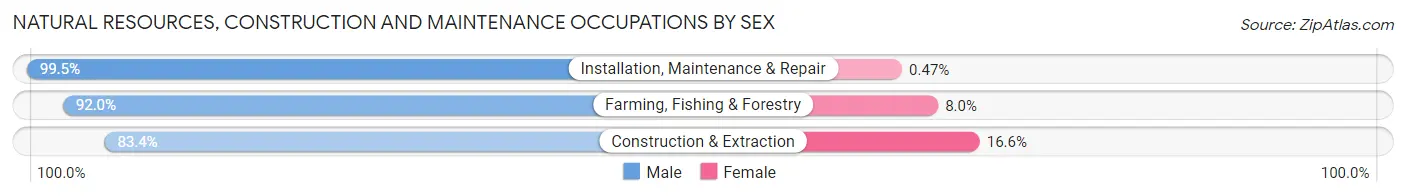
| Occupation | Male | Female |
| Farming, Fishing & Forestry | 254 (92.0%) | 22 (8.0%) |
| Construction & Extraction | 572 (83.4%) | 114 (16.6%) |
| Installation, Maintenance & Repair | 632 (99.5%) | 3 (0.5%) |
| Total (Category) | 1,458 (91.3%) | 139 (8.7%) |
| Total (Overall) | 7,228 (55.9%) | 5,712 (44.1%) |
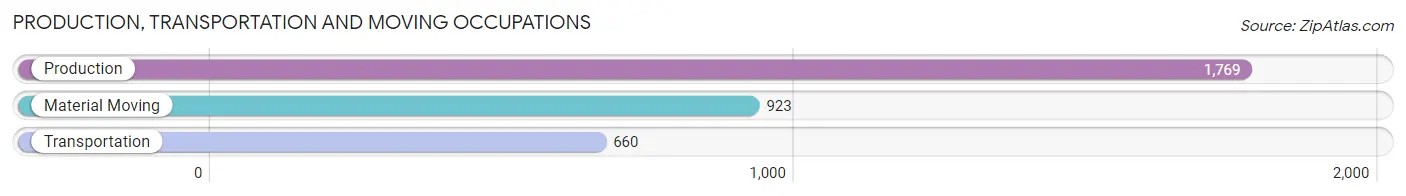
Production, Transportation and Moving Occupations
The most common Production, Transportation and Moving occupations in Fayette County are Production (1,769 | 13.7%), Material Moving (923 | 7.1%), and Transportation (660 | 5.1%).
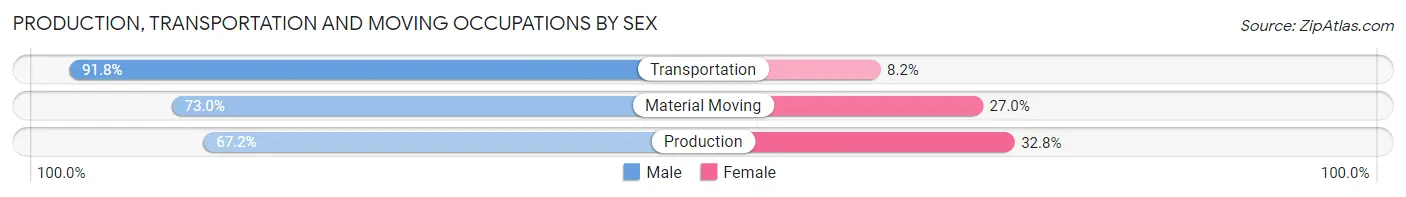
Production, Transportation and Moving Occupations by Sex
| Occupation | Male | Female |
| Production | 1,189 (67.2%) | 580 (32.8%) |
| Transportation | 606 (91.8%) | 54 (8.2%) |
| Material Moving | 674 (73.0%) | 249 (27.0%) |
| Total (Category) | 2,469 (73.7%) | 883 (26.3%) |
| Total (Overall) | 7,228 (55.9%) | 5,712 (44.1%) |
Employment Industries by Sex in Fayette County
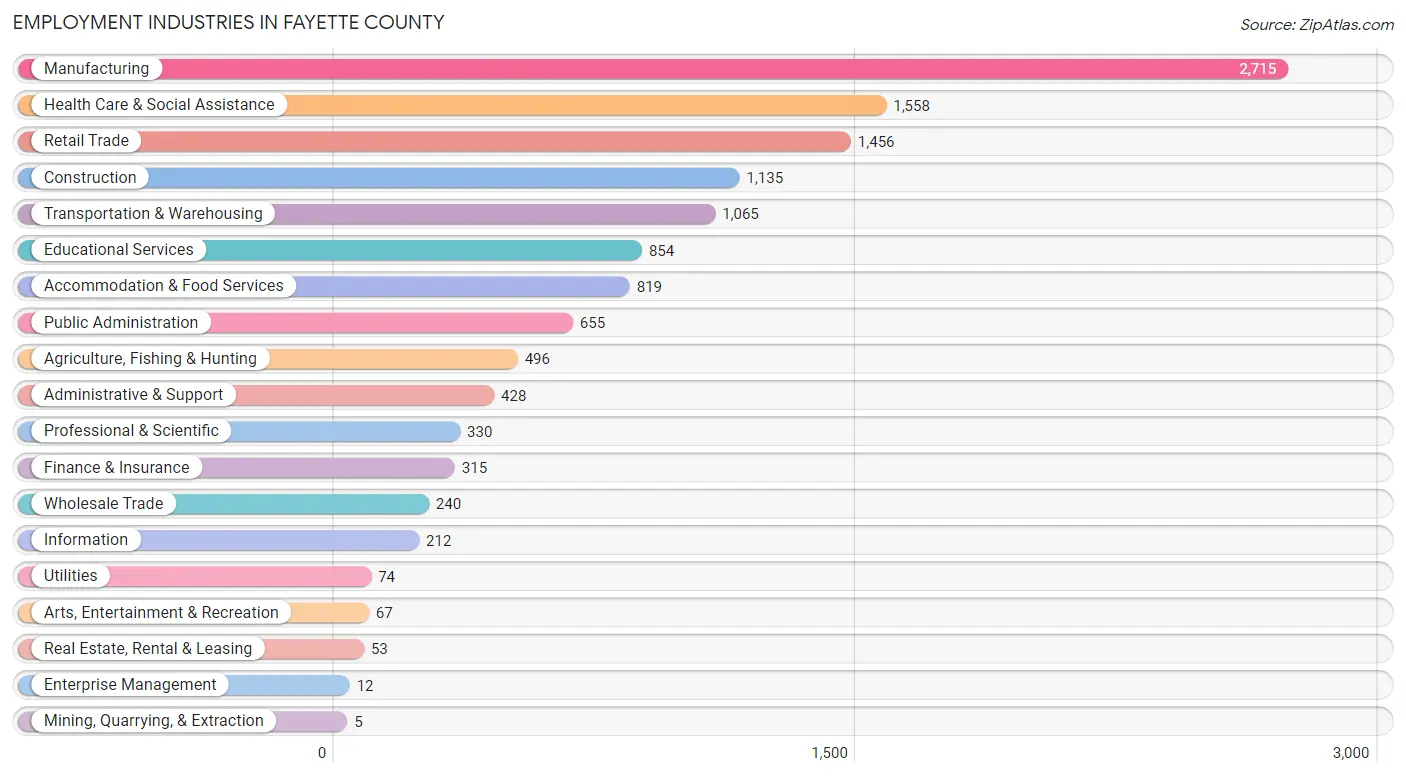
Employment Industries in Fayette County
The major employment industries in Fayette County include Manufacturing (2,715 | 21.0%), Health Care & Social Assistance (1,558 | 12.0%), Retail Trade (1,456 | 11.3%), Construction (1,135 | 8.8%), and Transportation & Warehousing (1,065 | 8.2%).
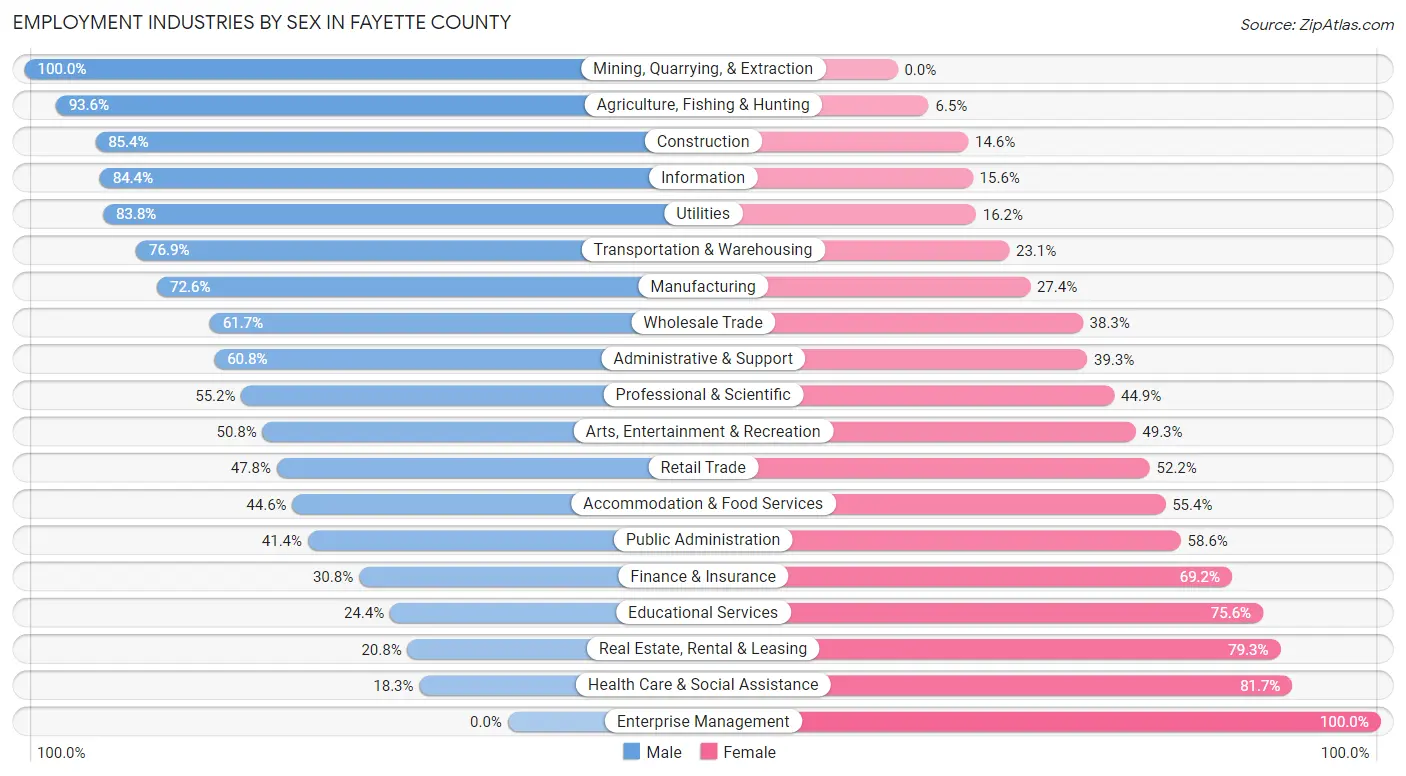
Employment Industries by Sex in Fayette County
The Fayette County industries that see more men than women are Mining, Quarrying, & Extraction (100.0%), Agriculture, Fishing & Hunting (93.5%), and Construction (85.4%), whereas the industries that tend to have a higher number of women are Enterprise Management (100.0%), Health Care & Social Assistance (81.7%), and Real Estate, Rental & Leasing (79.2%).
| Industry | Male | Female |
| Agriculture, Fishing & Hunting | 464 (93.5%) | 32 (6.5%) |
| Mining, Quarrying, & Extraction | 5 (100.0%) | 0 (0.0%) |
| Construction | 969 (85.4%) | 166 (14.6%) |
| Manufacturing | 1,970 (72.6%) | 745 (27.4%) |
| Wholesale Trade | 148 (61.7%) | 92 (38.3%) |
| Retail Trade | 696 (47.8%) | 760 (52.2%) |
| Transportation & Warehousing | 819 (76.9%) | 246 (23.1%) |
| Utilities | 62 (83.8%) | 12 (16.2%) |
| Information | 179 (84.4%) | 33 (15.6%) |
| Finance & Insurance | 97 (30.8%) | 218 (69.2%) |
| Real Estate, Rental & Leasing | 11 (20.7%) | 42 (79.2%) |
| Professional & Scientific | 182 (55.1%) | 148 (44.9%) |
| Enterprise Management | 0 (0.0%) | 12 (100.0%) |
| Administrative & Support | 260 (60.8%) | 168 (39.3%) |
| Educational Services | 208 (24.4%) | 646 (75.6%) |
| Health Care & Social Assistance | 285 (18.3%) | 1,273 (81.7%) |
| Arts, Entertainment & Recreation | 34 (50.7%) | 33 (49.2%) |
| Accommodation & Food Services | 365 (44.6%) | 454 (55.4%) |
| Public Administration | 271 (41.4%) | 384 (58.6%) |
| Total | 7,228 (55.9%) | 5,712 (44.1%) |
Education in Fayette County
School Enrollment in Fayette County
The most common levels of schooling among the 6,026 students in Fayette County are high school (1,704 | 28.3%), elementary school (1,456 | 24.2%), and middle school (1,421 | 23.6%).
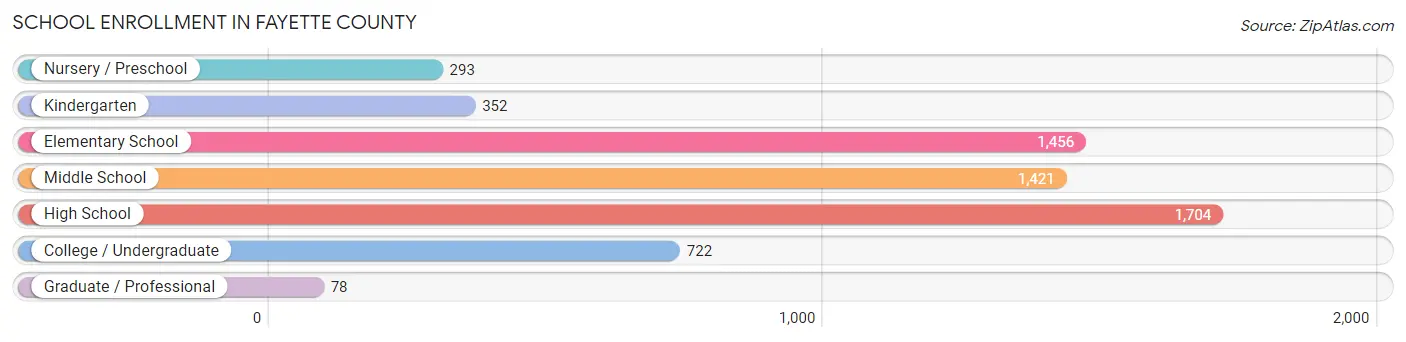
| School Level | # Students | % Students |
| Nursery / Preschool | 293 | 4.9% |
| Kindergarten | 352 | 5.8% |
| Elementary School | 1,456 | 24.2% |
| Middle School | 1,421 | 23.6% |
| High School | 1,704 | 28.3% |
| College / Undergraduate | 722 | 12.0% |
| Graduate / Professional | 78 | 1.3% |
| Total | 6,026 | 100.0% |
School Enrollment by Age by Funding Source in Fayette County
Out of a total of 6,026 students who are enrolled in schools in Fayette County, 723 (12.0%) attend a private institution, while the remaining 5,303 (88.0%) are enrolled in public schools. The age group of 25 to 34 year olds has the highest likelihood of being enrolled in private schools, with 62 (33.7% in the age bracket) enrolled. Conversely, the age group of 3 to 4 year olds has the lowest likelihood of being enrolled in a private school, with 197 (98.5% in the age bracket) attending a public institution.
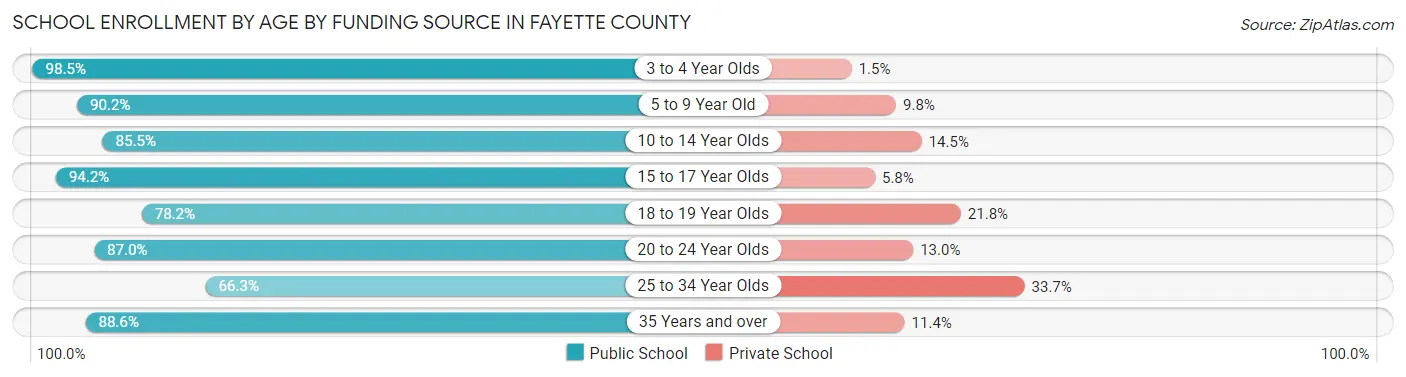
| Age Bracket | Public School | Private School |
| 3 to 4 Year Olds | 197 (98.5%) | 3 (1.5%) |
| 5 to 9 Year Old | 1,404 (90.2%) | 152 (9.8%) |
| 10 to 14 Year Olds | 1,675 (85.5%) | 285 (14.5%) |
| 15 to 17 Year Olds | 1,144 (94.2%) | 71 (5.8%) |
| 18 to 19 Year Olds | 297 (78.2%) | 83 (21.8%) |
| 20 to 24 Year Olds | 309 (87.0%) | 46 (13.0%) |
| 25 to 34 Year Olds | 122 (66.3%) | 62 (33.7%) |
| 35 Years and over | 156 (88.6%) | 20 (11.4%) |
| Total | 5,303 (88.0%) | 723 (12.0%) |
Educational Attainment by Field of Study in Fayette County
Education (665 | 22.3%), business (522 | 17.5%), science & technology (335 | 11.2%), bio, nature & agricultural (312 | 10.5%), and arts & humanities (200 | 6.7%) are the most common fields of study among 2,984 individuals in Fayette County who have obtained a bachelor's degree or higher.
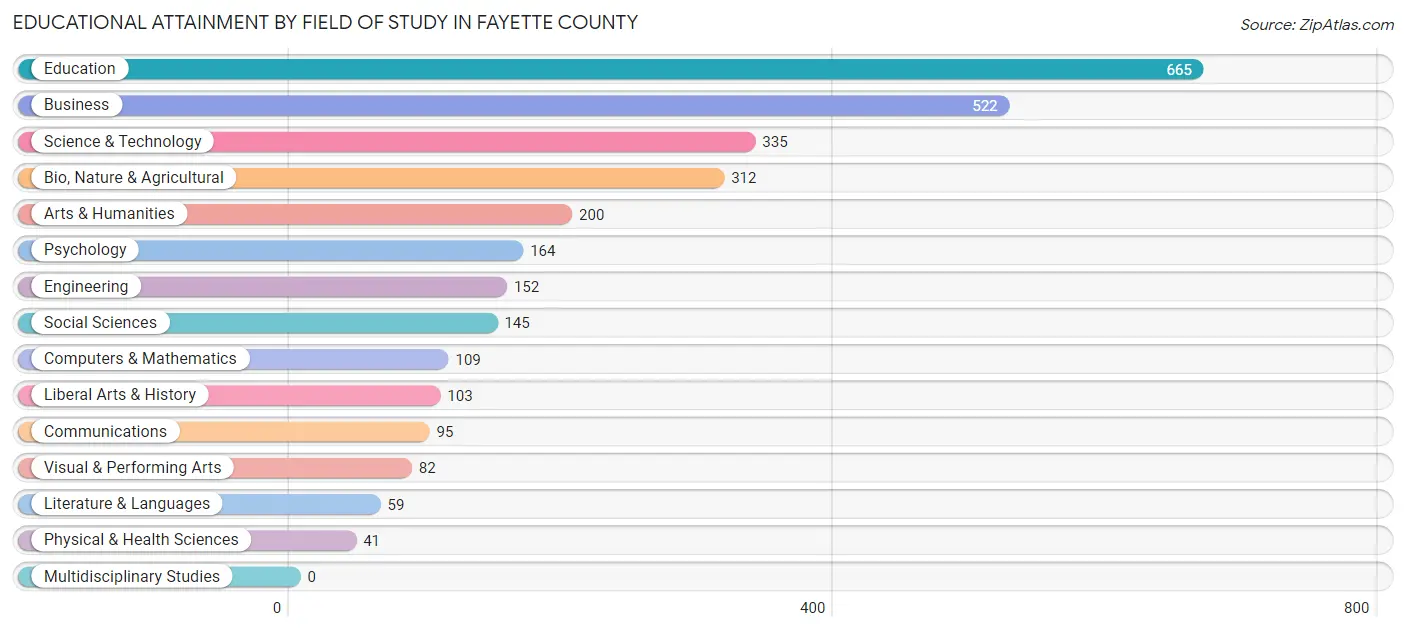
| Field of Study | # Graduates | % Graduates |
| Computers & Mathematics | 109 | 3.6% |
| Bio, Nature & Agricultural | 312 | 10.5% |
| Physical & Health Sciences | 41 | 1.4% |
| Psychology | 164 | 5.5% |
| Social Sciences | 145 | 4.9% |
| Engineering | 152 | 5.1% |
| Multidisciplinary Studies | 0 | 0.0% |
| Science & Technology | 335 | 11.2% |
| Business | 522 | 17.5% |
| Education | 665 | 22.3% |
| Literature & Languages | 59 | 2.0% |
| Liberal Arts & History | 103 | 3.5% |
| Visual & Performing Arts | 82 | 2.8% |
| Communications | 95 | 3.2% |
| Arts & Humanities | 200 | 6.7% |
| Total | 2,984 | 100.0% |
Transportation & Commute in Fayette County
Vehicle Availability by Sex in Fayette County
The most prevalent vehicle ownership categories in Fayette County are males with 2 vehicles (2,801, accounting for 39.3%) and females with 2 vehicles (1,998, making up 50.5%).
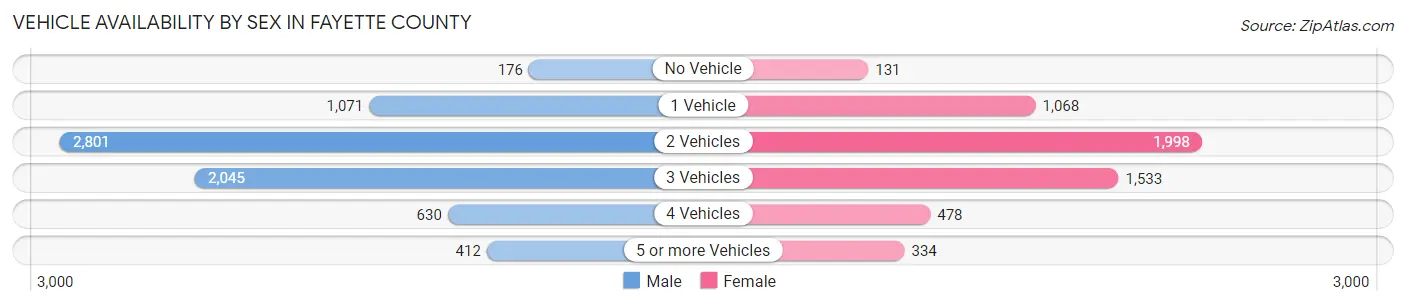
| Vehicles Available | Male | Female |
| No Vehicle | 176 (2.5%) | 131 (2.4%) |
| 1 Vehicle | 1,071 (15.0%) | 1,068 (19.3%) |
| 2 Vehicles | 2,801 (39.3%) | 1,998 (36.0%) |
| 3 Vehicles | 2,045 (28.7%) | 1,533 (27.7%) |
| 4 Vehicles | 630 (8.8%) | 478 (8.6%) |
| 5 or more Vehicles | 412 (5.8%) | 334 (6.0%) |
| Total | 7,135 (100.0%) | 5,542 (100.0%) |
Commute Time in Fayette County
The most frequently occuring commute durations in Fayette County are 10 to 14 minutes (1,972 commuters, 16.3%), 5 to 9 minutes (1,950 commuters, 16.1%), and 60 to 89 minutes (1,254 commuters, 10.3%).
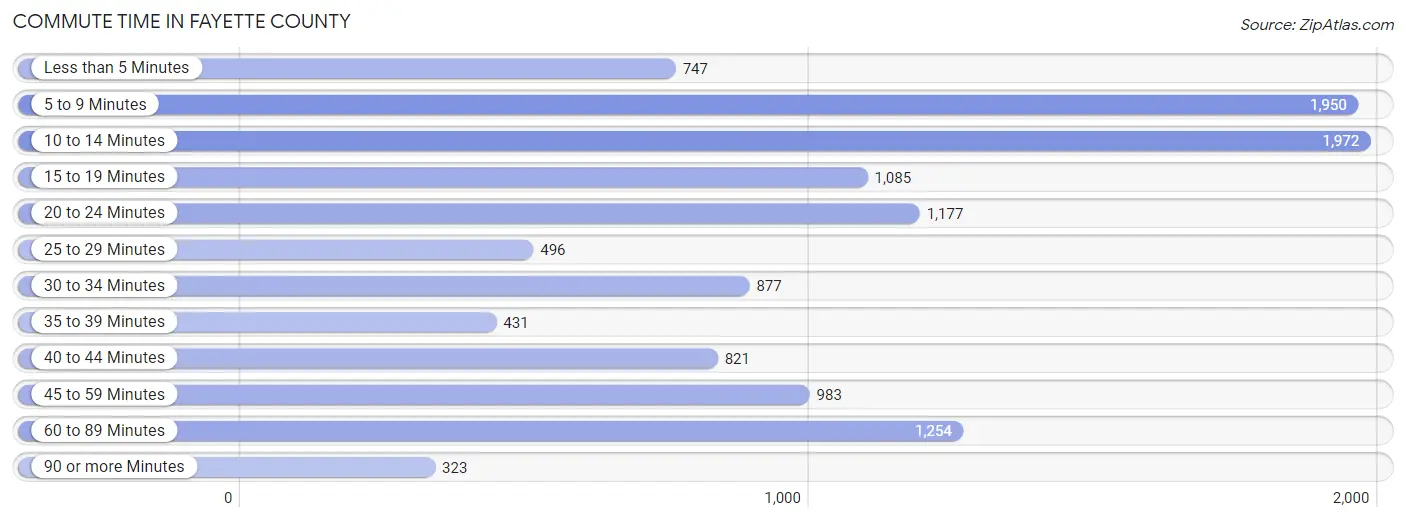
| Commute Time | # Commuters | % Commuters |
| Less than 5 Minutes | 747 | 6.2% |
| 5 to 9 Minutes | 1,950 | 16.1% |
| 10 to 14 Minutes | 1,972 | 16.3% |
| 15 to 19 Minutes | 1,085 | 9.0% |
| 20 to 24 Minutes | 1,177 | 9.7% |
| 25 to 29 Minutes | 496 | 4.1% |
| 30 to 34 Minutes | 877 | 7.2% |
| 35 to 39 Minutes | 431 | 3.6% |
| 40 to 44 Minutes | 821 | 6.8% |
| 45 to 59 Minutes | 983 | 8.1% |
| 60 to 89 Minutes | 1,254 | 10.3% |
| 90 or more Minutes | 323 | 2.7% |
Commute Time by Sex in Fayette County
The most common commute times in Fayette County are 5 to 9 minutes (976 commuters, 14.1%) for males and 10 to 14 minutes (1,004 commuters, 19.3%) for females.
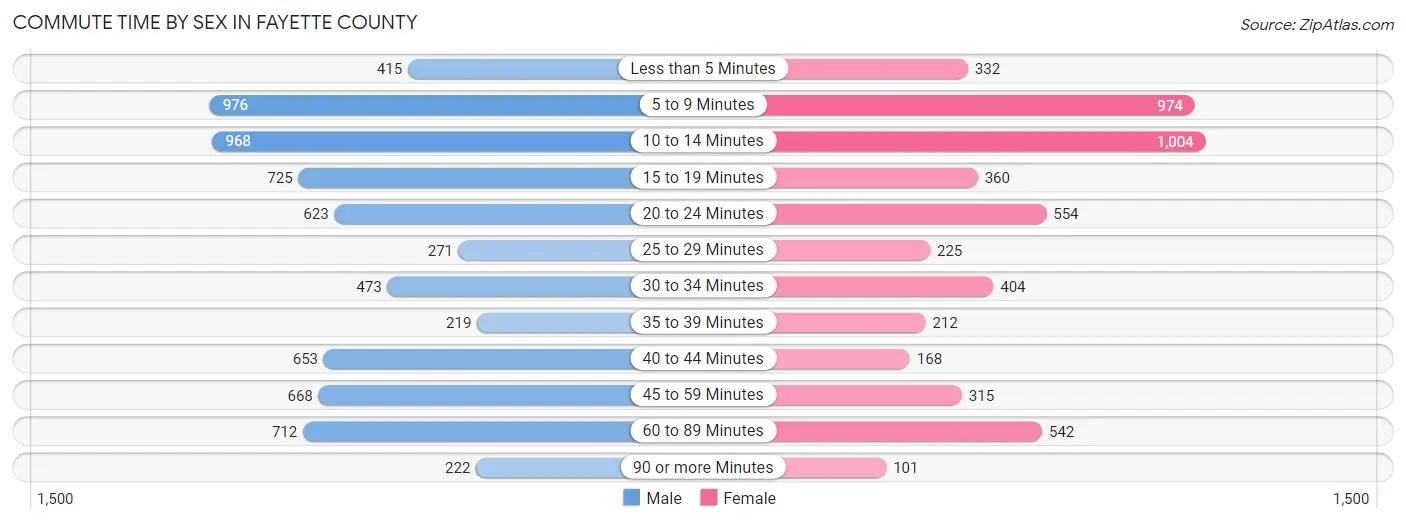
| Commute Time | Male | Female |
| Less than 5 Minutes | 415 (6.0%) | 332 (6.4%) |
| 5 to 9 Minutes | 976 (14.1%) | 974 (18.8%) |
| 10 to 14 Minutes | 968 (14.0%) | 1,004 (19.3%) |
| 15 to 19 Minutes | 725 (10.5%) | 360 (6.9%) |
| 20 to 24 Minutes | 623 (9.0%) | 554 (10.7%) |
| 25 to 29 Minutes | 271 (3.9%) | 225 (4.3%) |
| 30 to 34 Minutes | 473 (6.8%) | 404 (7.8%) |
| 35 to 39 Minutes | 219 (3.2%) | 212 (4.1%) |
| 40 to 44 Minutes | 653 (9.4%) | 168 (3.2%) |
| 45 to 59 Minutes | 668 (9.7%) | 315 (6.1%) |
| 60 to 89 Minutes | 712 (10.3%) | 542 (10.4%) |
| 90 or more Minutes | 222 (3.2%) | 101 (1.9%) |
Time of Departure to Work by Sex in Fayette County
The most frequent times of departure to work in Fayette County are 7:00 AM to 7:29 AM (895, 12.9%) for males and 6:30 AM to 6:59 AM (958, 18.5%) for females.
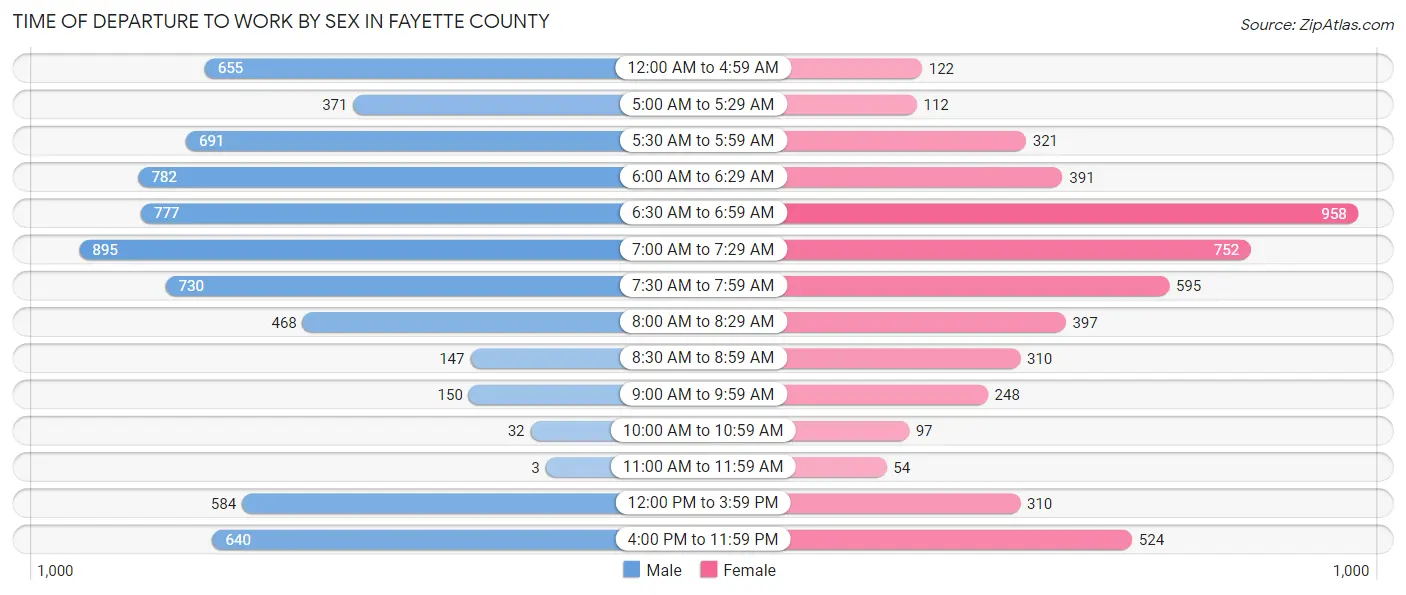
| Time of Departure | Male | Female |
| 12:00 AM to 4:59 AM | 655 (9.5%) | 122 (2.4%) |
| 5:00 AM to 5:29 AM | 371 (5.4%) | 112 (2.2%) |
| 5:30 AM to 5:59 AM | 691 (10.0%) | 321 (6.2%) |
| 6:00 AM to 6:29 AM | 782 (11.3%) | 391 (7.5%) |
| 6:30 AM to 6:59 AM | 777 (11.2%) | 958 (18.5%) |
| 7:00 AM to 7:29 AM | 895 (12.9%) | 752 (14.5%) |
| 7:30 AM to 7:59 AM | 730 (10.5%) | 595 (11.5%) |
| 8:00 AM to 8:29 AM | 468 (6.8%) | 397 (7.6%) |
| 8:30 AM to 8:59 AM | 147 (2.1%) | 310 (6.0%) |
| 9:00 AM to 9:59 AM | 150 (2.2%) | 248 (4.8%) |
| 10:00 AM to 10:59 AM | 32 (0.5%) | 97 (1.9%) |
| 11:00 AM to 11:59 AM | 3 (0.0%) | 54 (1.0%) |
| 12:00 PM to 3:59 PM | 584 (8.4%) | 310 (6.0%) |
| 4:00 PM to 11:59 PM | 640 (9.2%) | 524 (10.1%) |
| Total | 6,925 (100.0%) | 5,191 (100.0%) |
Housing Occupancy in Fayette County
Occupancy by Ownership in Fayette County
Of the total 11,620 dwellings in Fayette County, owner-occupied units account for 7,495 (64.5%), while renter-occupied units make up 4,125 (35.5%).
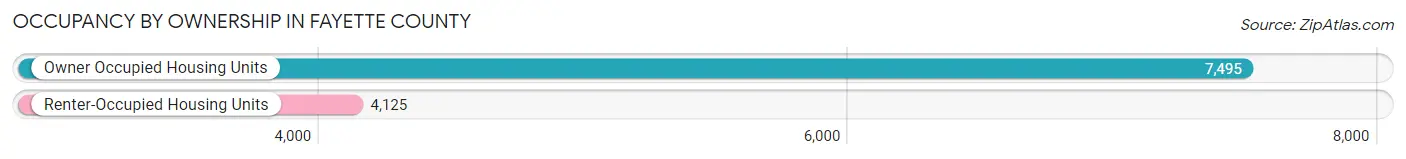
| Occupancy | # Housing Units | % Housing Units |
| Owner Occupied Housing Units | 7,495 | 64.5% |
| Renter-Occupied Housing Units | 4,125 | 35.5% |
| Total Occupied Housing Units | 11,620 | 100.0% |
Occupancy by Household Size in Fayette County
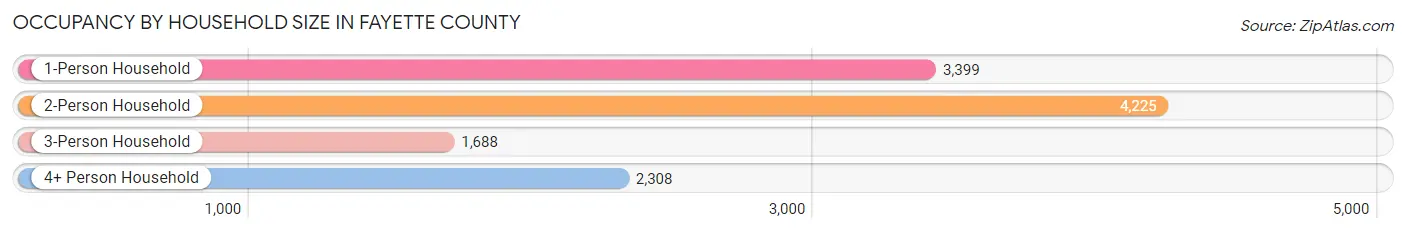
| Household Size | # Housing Units | % Housing Units |
| 1-Person Household | 3,399 | 29.2% |
| 2-Person Household | 4,225 | 36.4% |
| 3-Person Household | 1,688 | 14.5% |
| 4+ Person Household | 2,308 | 19.9% |
| Total Housing Units | 11,620 | 100.0% |
Occupancy by Ownership by Household Size in Fayette County
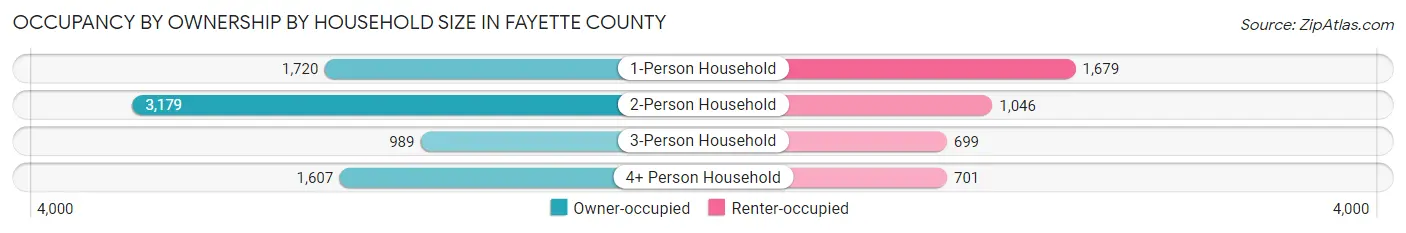
| Household Size | Owner-occupied | Renter-occupied |
| 1-Person Household | 1,720 (50.6%) | 1,679 (49.4%) |
| 2-Person Household | 3,179 (75.2%) | 1,046 (24.8%) |
| 3-Person Household | 989 (58.6%) | 699 (41.4%) |
| 4+ Person Household | 1,607 (69.6%) | 701 (30.4%) |
| Total Housing Units | 7,495 (64.5%) | 4,125 (35.5%) |
Occupancy by Educational Attainment in Fayette County
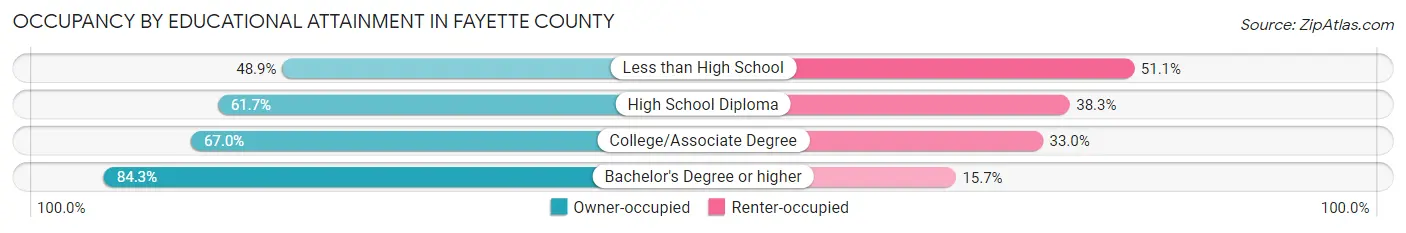
| Household Size | Owner-occupied | Renter-occupied |
| Less than High School | 696 (48.9%) | 727 (51.1%) |
| High School Diploma | 3,515 (61.7%) | 2,181 (38.3%) |
| College/Associate Degree | 1,976 (67.0%) | 973 (33.0%) |
| Bachelor's Degree or higher | 1,308 (84.3%) | 244 (15.7%) |
Occupancy by Age of Householder in Fayette County
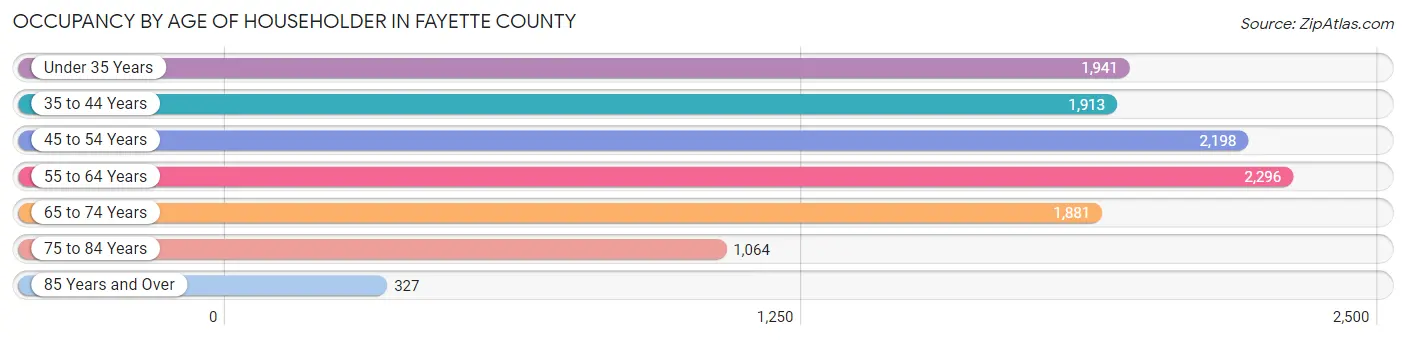
| Age Bracket | # Households | % Households |
| Under 35 Years | 1,941 | 16.7% |
| 35 to 44 Years | 1,913 | 16.5% |
| 45 to 54 Years | 2,198 | 18.9% |
| 55 to 64 Years | 2,296 | 19.8% |
| 65 to 74 Years | 1,881 | 16.2% |
| 75 to 84 Years | 1,064 | 9.2% |
| 85 Years and Over | 327 | 2.8% |
| Total | 11,620 | 100.0% |
Housing Finances in Fayette County
Median Income by Occupancy in Fayette County
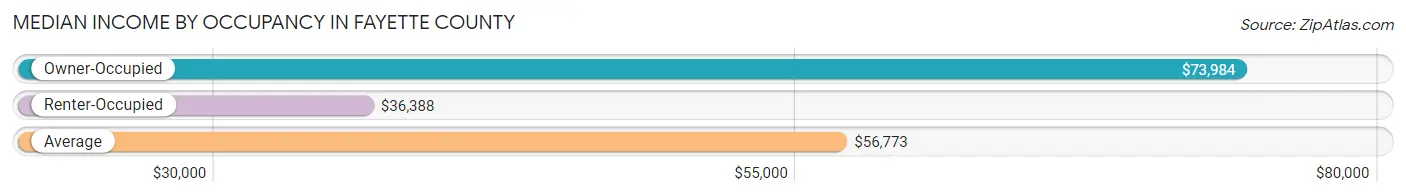
| Occupancy Type | # Households | Median Income |
| Owner-Occupied | 7,495 (64.5%) | $73,984 |
| Renter-Occupied | 4,125 (35.5%) | $36,388 |
| Average | 11,620 (100.0%) | $56,773 |
Occupancy by Householder Income Bracket in Fayette County
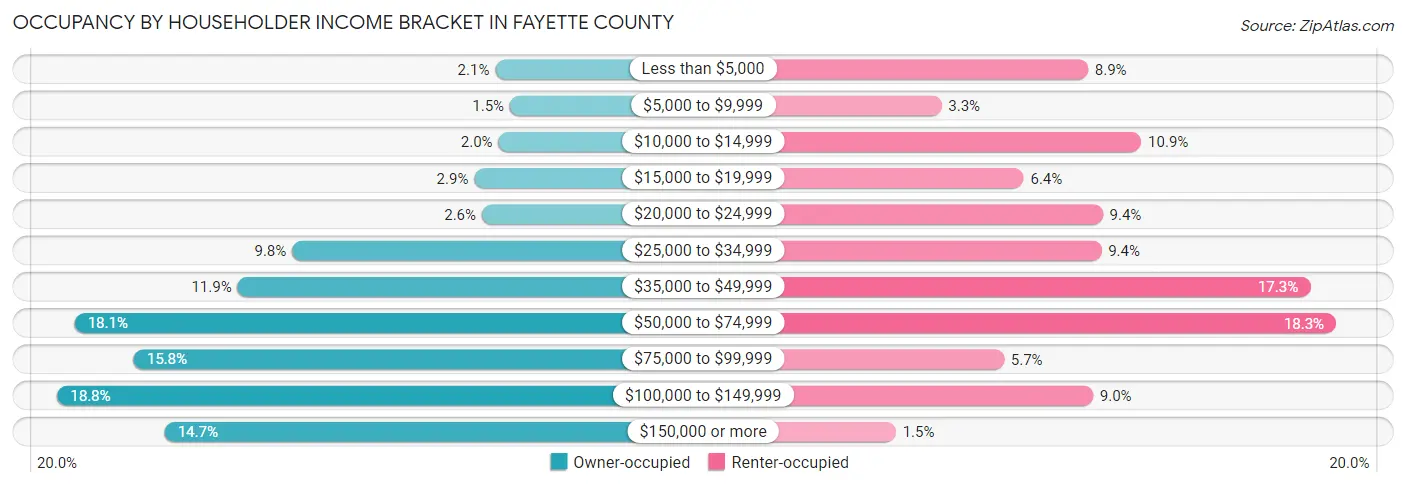
| Income Bracket | Owner-occupied | Renter-occupied |
| Less than $5,000 | 155 (2.1%) | 365 (8.8%) |
| $5,000 to $9,999 | 113 (1.5%) | 135 (3.3%) |
| $10,000 to $14,999 | 146 (1.9%) | 449 (10.9%) |
| $15,000 to $19,999 | 215 (2.9%) | 264 (6.4%) |
| $20,000 to $24,999 | 193 (2.6%) | 388 (9.4%) |
| $25,000 to $34,999 | 735 (9.8%) | 386 (9.4%) |
| $35,000 to $49,999 | 891 (11.9%) | 714 (17.3%) |
| $50,000 to $74,999 | 1,356 (18.1%) | 755 (18.3%) |
| $75,000 to $99,999 | 1,187 (15.8%) | 233 (5.7%) |
| $100,000 to $149,999 | 1,405 (18.8%) | 373 (9.0%) |
| $150,000 or more | 1,099 (14.7%) | 63 (1.5%) |
| Total | 7,495 (100.0%) | 4,125 (100.0%) |
Monthly Housing Cost Tiers in Fayette County
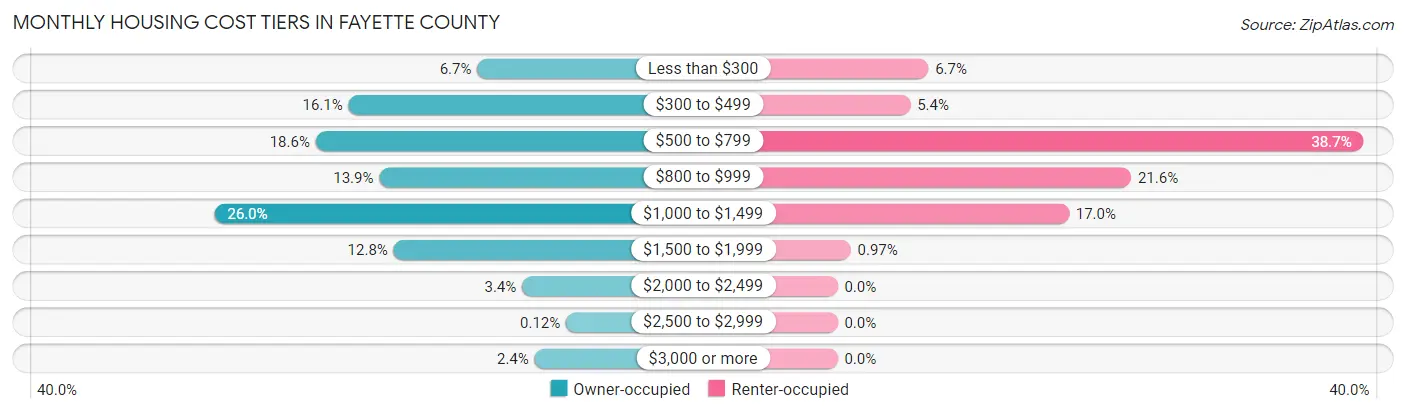
| Monthly Cost | Owner-occupied | Renter-occupied |
| Less than $300 | 499 (6.7%) | 276 (6.7%) |
| $300 to $499 | 1,210 (16.1%) | 221 (5.4%) |
| $500 to $799 | 1,391 (18.6%) | 1,598 (38.7%) |
| $800 to $999 | 1,040 (13.9%) | 892 (21.6%) |
| $1,000 to $1,499 | 1,950 (26.0%) | 703 (17.0%) |
| $1,500 to $1,999 | 961 (12.8%) | 40 (1.0%) |
| $2,000 to $2,499 | 252 (3.4%) | 0 (0.0%) |
| $2,500 to $2,999 | 9 (0.1%) | 0 (0.0%) |
| $3,000 or more | 183 (2.4%) | 0 (0.0%) |
| Total | 7,495 (100.0%) | 4,125 (100.0%) |
Physical Housing Characteristics in Fayette County
Housing Structures in Fayette County
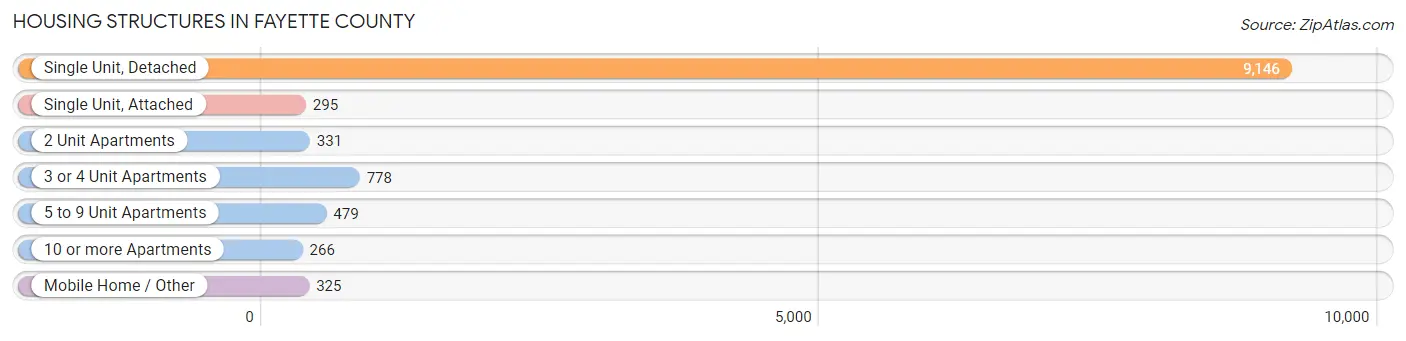
| Structure Type | # Housing Units | % Housing Units |
| Single Unit, Detached | 9,146 | 78.7% |
| Single Unit, Attached | 295 | 2.5% |
| 2 Unit Apartments | 331 | 2.9% |
| 3 or 4 Unit Apartments | 778 | 6.7% |
| 5 to 9 Unit Apartments | 479 | 4.1% |
| 10 or more Apartments | 266 | 2.3% |
| Mobile Home / Other | 325 | 2.8% |
| Total | 11,620 | 100.0% |
Housing Structures by Occupancy in Fayette County
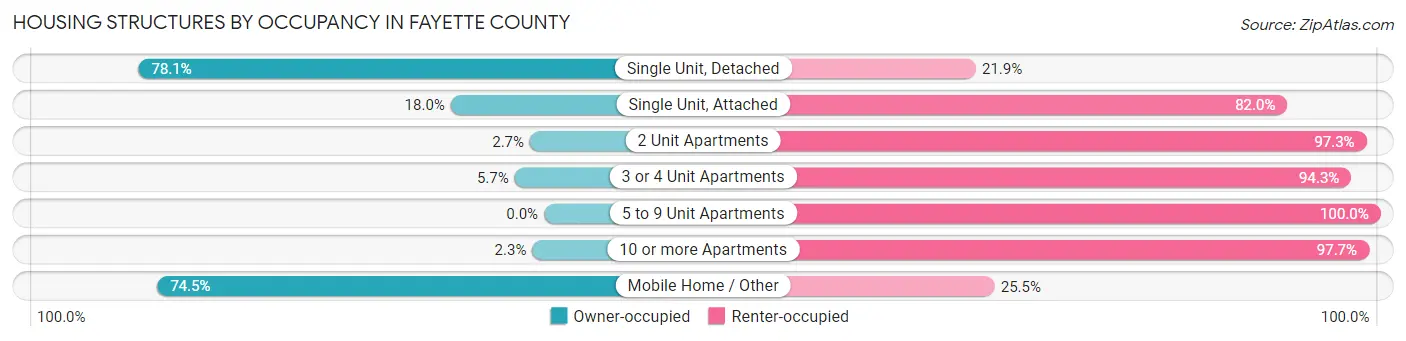
| Structure Type | Owner-occupied | Renter-occupied |
| Single Unit, Detached | 7,141 (78.1%) | 2,005 (21.9%) |
| Single Unit, Attached | 53 (18.0%) | 242 (82.0%) |
| 2 Unit Apartments | 9 (2.7%) | 322 (97.3%) |
| 3 or 4 Unit Apartments | 44 (5.7%) | 734 (94.3%) |
| 5 to 9 Unit Apartments | 0 (0.0%) | 479 (100.0%) |
| 10 or more Apartments | 6 (2.3%) | 260 (97.7%) |
| Mobile Home / Other | 242 (74.5%) | 83 (25.5%) |
| Total | 7,495 (64.5%) | 4,125 (35.5%) |
Housing Structures by Number of Rooms in Fayette County
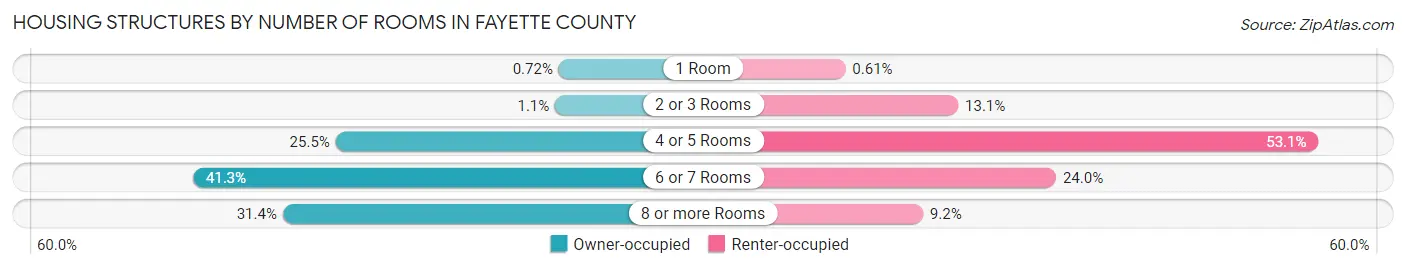
| Number of Rooms | Owner-occupied | Renter-occupied |
| 1 Room | 54 (0.7%) | 25 (0.6%) |
| 2 or 3 Rooms | 84 (1.1%) | 541 (13.1%) |
| 4 or 5 Rooms | 1,910 (25.5%) | 2,190 (53.1%) |
| 6 or 7 Rooms | 3,097 (41.3%) | 989 (24.0%) |
| 8 or more Rooms | 2,350 (31.4%) | 380 (9.2%) |
| Total | 7,495 (100.0%) | 4,125 (100.0%) |
Housing Structure by Heating Type in Fayette County
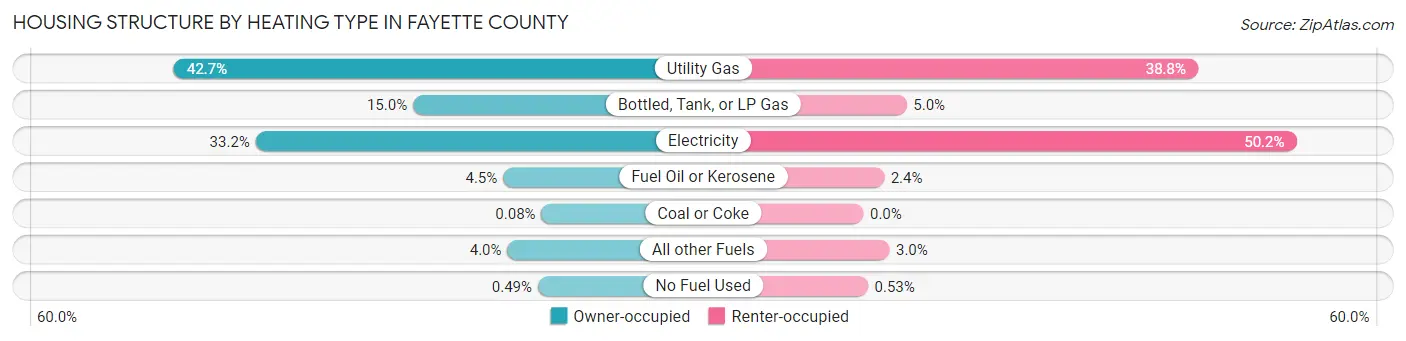
| Heating Type | Owner-occupied | Renter-occupied |
| Utility Gas | 3,200 (42.7%) | 1,601 (38.8%) |
| Bottled, Tank, or LP Gas | 1,122 (15.0%) | 207 (5.0%) |
| Electricity | 2,489 (33.2%) | 2,072 (50.2%) |
| Fuel Oil or Kerosene | 339 (4.5%) | 99 (2.4%) |
| Coal or Coke | 6 (0.1%) | 0 (0.0%) |
| All other Fuels | 302 (4.0%) | 124 (3.0%) |
| No Fuel Used | 37 (0.5%) | 22 (0.5%) |
| Total | 7,495 (100.0%) | 4,125 (100.0%) |
Household Vehicle Usage in Fayette County
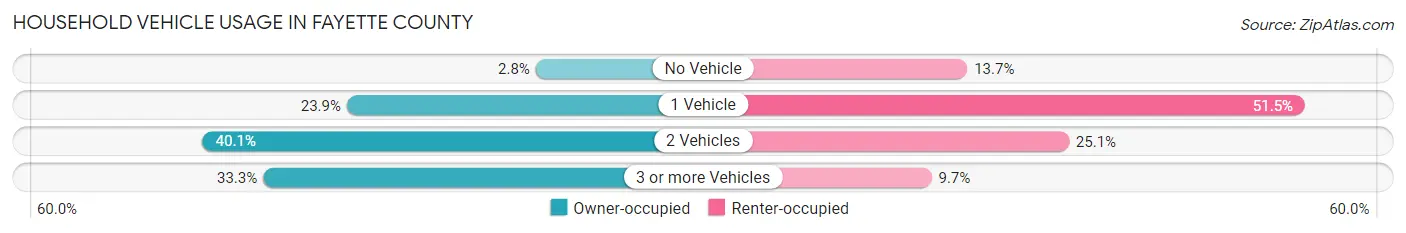
| Vehicles per Household | Owner-occupied | Renter-occupied |
| No Vehicle | 206 (2.8%) | 565 (13.7%) |
| 1 Vehicle | 1,792 (23.9%) | 2,125 (51.5%) |
| 2 Vehicles | 3,002 (40.1%) | 1,035 (25.1%) |
| 3 or more Vehicles | 2,495 (33.3%) | 400 (9.7%) |
| Total | 7,495 (100.0%) | 4,125 (100.0%) |
Real Estate & Mortgages in Fayette County
Real Estate and Mortgage Overview in Fayette County
| Characteristic | Without Mortgage | With Mortgage |
| Housing Units | 2,783 | 4,712 |
| Median Property Value | $140,300 | $155,400 |
| Median Household Income | $55,479 | $920 |
| Monthly Housing Costs | $458 | $160 |
| Real Estate Taxes | $1,383 | $169 |
Property Value by Mortgage Status in Fayette County
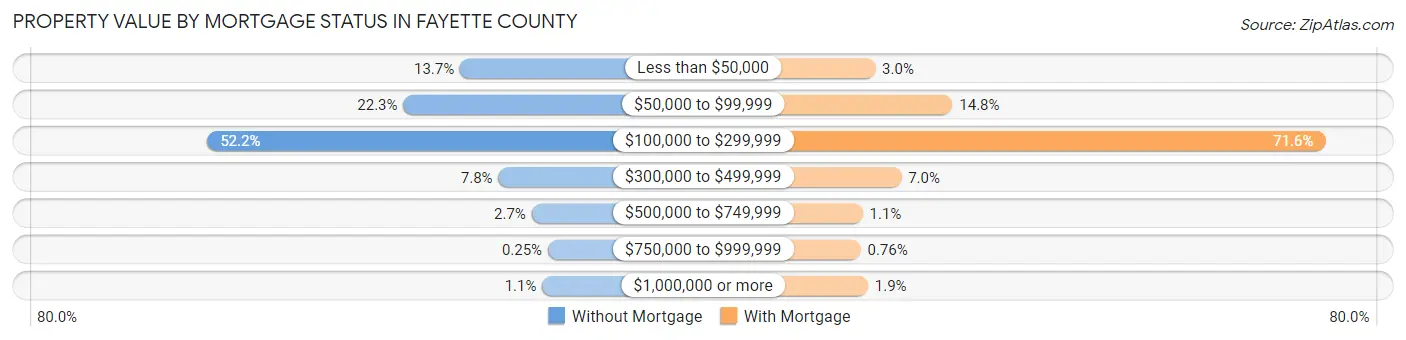
| Property Value | Without Mortgage | With Mortgage |
| Less than $50,000 | 380 (13.7%) | 141 (3.0%) |
| $50,000 to $99,999 | 620 (22.3%) | 695 (14.7%) |
| $100,000 to $299,999 | 1,452 (52.2%) | 3,373 (71.6%) |
| $300,000 to $499,999 | 217 (7.8%) | 328 (7.0%) |
| $500,000 to $749,999 | 76 (2.7%) | 51 (1.1%) |
| $750,000 to $999,999 | 7 (0.3%) | 36 (0.8%) |
| $1,000,000 or more | 31 (1.1%) | 88 (1.9%) |
| Total | 2,783 (100.0%) | 4,712 (100.0%) |
Household Income by Mortgage Status in Fayette County
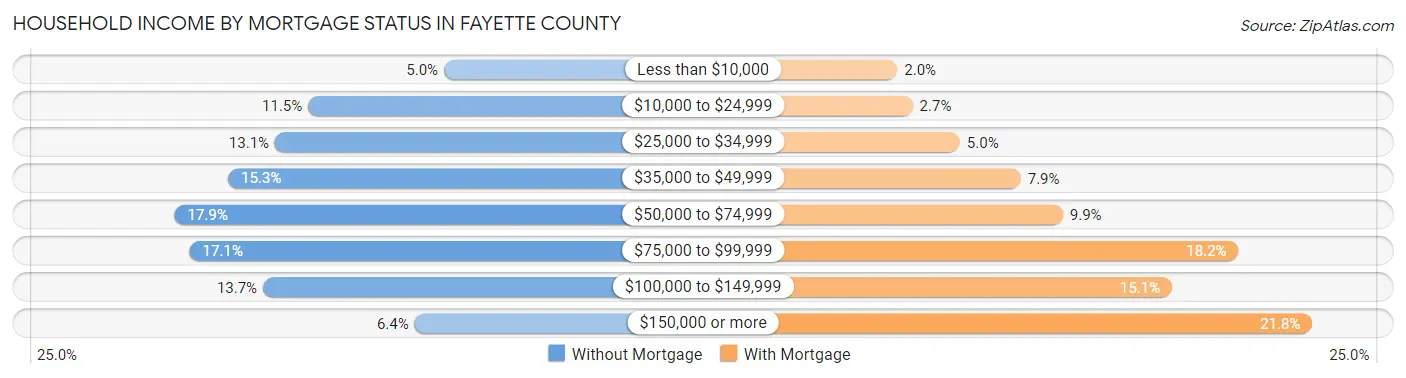
| Household Income | Without Mortgage | With Mortgage |
| Less than $10,000 | 140 (5.0%) | 94 (2.0%) |
| $10,000 to $24,999 | 320 (11.5%) | 128 (2.7%) |
| $25,000 to $34,999 | 364 (13.1%) | 234 (5.0%) |
| $35,000 to $49,999 | 426 (15.3%) | 371 (7.9%) |
| $50,000 to $74,999 | 497 (17.9%) | 465 (9.9%) |
| $75,000 to $99,999 | 477 (17.1%) | 859 (18.2%) |
| $100,000 to $149,999 | 380 (13.7%) | 710 (15.1%) |
| $150,000 or more | 179 (6.4%) | 1,025 (21.7%) |
| Total | 2,783 (100.0%) | 4,712 (100.0%) |
Property Value to Household Income Ratio in Fayette County
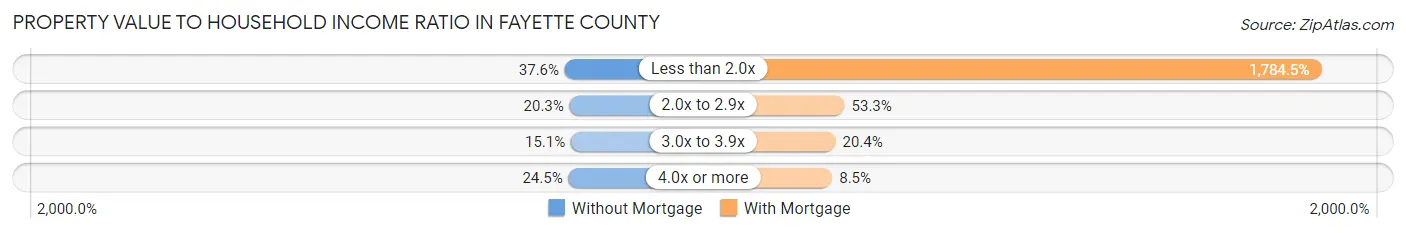
| Value-to-Income Ratio | Without Mortgage | With Mortgage |
| Less than 2.0x | 1,046 (37.6%) | 84,084 (1,784.5%) |
| 2.0x to 2.9x | 566 (20.3%) | 2,511 (53.3%) |
| 3.0x to 3.9x | 419 (15.1%) | 963 (20.4%) |
| 4.0x or more | 682 (24.5%) | 402 (8.5%) |
| Total | 2,783 (100.0%) | 4,712 (100.0%) |
Real Estate Taxes by Mortgage Status in Fayette County
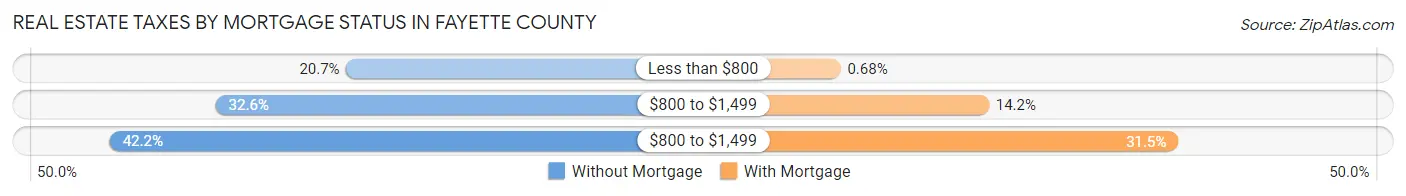
| Property Taxes | Without Mortgage | With Mortgage |
| Less than $800 | 576 (20.7%) | 32 (0.7%) |
| $800 to $1,499 | 906 (32.6%) | 670 (14.2%) |
| $800 to $1,499 | 1,175 (42.2%) | 1,485 (31.5%) |
| Total | 2,783 (100.0%) | 4,712 (100.0%) |
Health & Disability in Fayette County
Health Insurance Coverage by Age in Fayette County
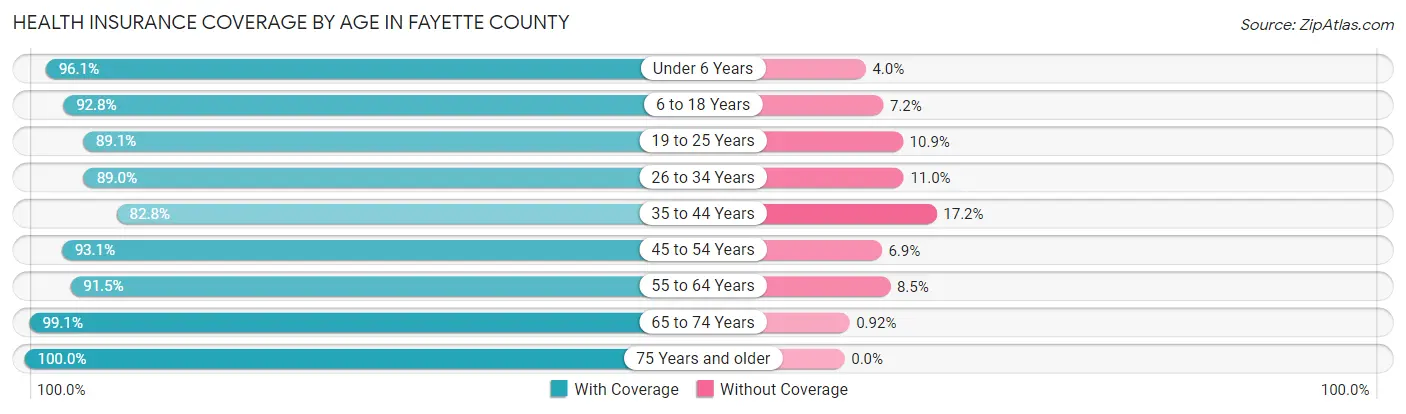
| Age Bracket | With Coverage | Without Coverage |
| Under 6 Years | 1,898 (96.1%) | 78 (4.0%) |
| 6 to 18 Years | 4,733 (92.8%) | 368 (7.2%) |
| 19 to 25 Years | 2,137 (89.1%) | 261 (10.9%) |
| 26 to 34 Years | 2,767 (89.0%) | 343 (11.0%) |
| 35 to 44 Years | 2,778 (82.8%) | 576 (17.2%) |
| 45 to 54 Years | 3,572 (93.1%) | 266 (6.9%) |
| 55 to 64 Years | 3,606 (91.5%) | 336 (8.5%) |
| 65 to 74 Years | 3,008 (99.1%) | 28 (0.9%) |
| 75 Years and older | 1,848 (100.0%) | 0 (0.0%) |
| Total | 26,347 (92.1%) | 2,256 (7.9%) |
Health Insurance Coverage by Citizenship Status in Fayette County
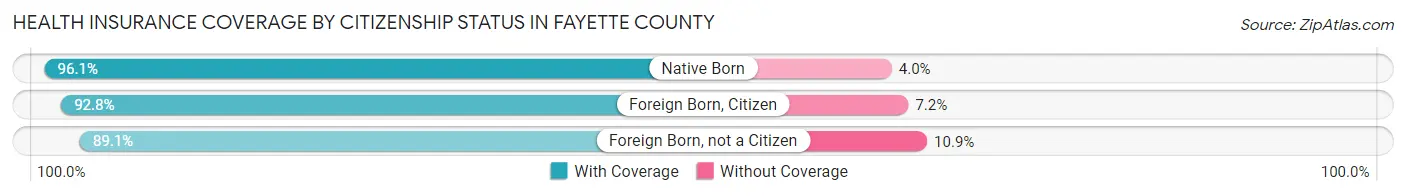
| Citizenship Status | With Coverage | Without Coverage |
| Native Born | 1,898 (96.1%) | 78 (4.0%) |
| Foreign Born, Citizen | 4,733 (92.8%) | 368 (7.2%) |
| Foreign Born, not a Citizen | 2,137 (89.1%) | 261 (10.9%) |
Health Insurance Coverage by Household Income in Fayette County
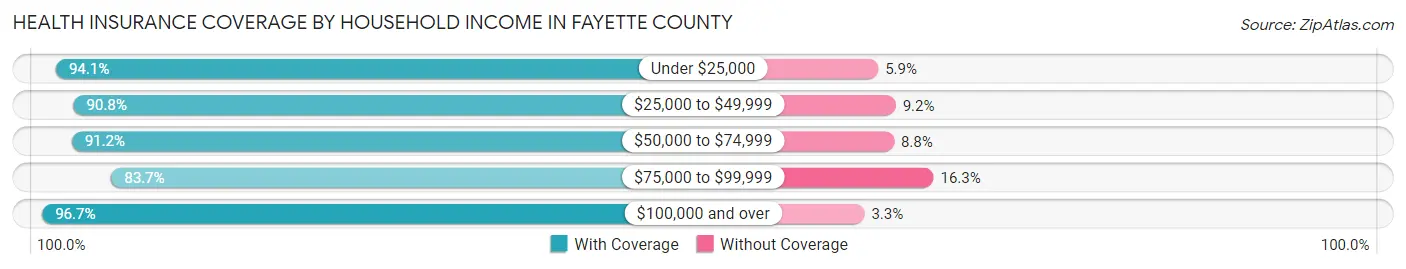
| Household Income | With Coverage | Without Coverage |
| Under $25,000 | 3,896 (94.1%) | 244 (5.9%) |
| $25,000 to $49,999 | 5,160 (90.8%) | 521 (9.2%) |
| $50,000 to $74,999 | 4,995 (91.2%) | 484 (8.8%) |
| $75,000 to $99,999 | 3,673 (83.7%) | 713 (16.3%) |
| $100,000 and over | 8,584 (96.7%) | 294 (3.3%) |
Public vs Private Health Insurance Coverage by Age in Fayette County
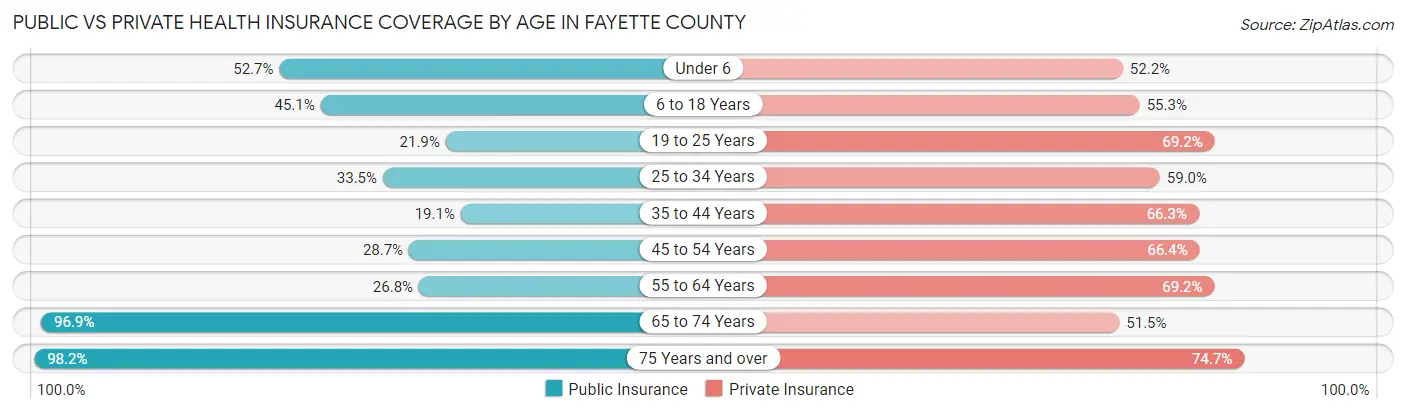
| Age Bracket | Public Insurance | Private Insurance |
| Under 6 | 1,042 (52.7%) | 1,031 (52.2%) |
| 6 to 18 Years | 2,299 (45.1%) | 2,821 (55.3%) |
| 19 to 25 Years | 524 (21.8%) | 1,659 (69.2%) |
| 25 to 34 Years | 1,042 (33.5%) | 1,836 (59.0%) |
| 35 to 44 Years | 639 (19.1%) | 2,222 (66.2%) |
| 45 to 54 Years | 1,100 (28.7%) | 2,548 (66.4%) |
| 55 to 64 Years | 1,057 (26.8%) | 2,726 (69.2%) |
| 65 to 74 Years | 2,943 (96.9%) | 1,564 (51.5%) |
| 75 Years and over | 1,815 (98.2%) | 1,380 (74.7%) |
| Total | 12,461 (43.6%) | 17,787 (62.2%) |
Disability Status by Sex by Age in Fayette County
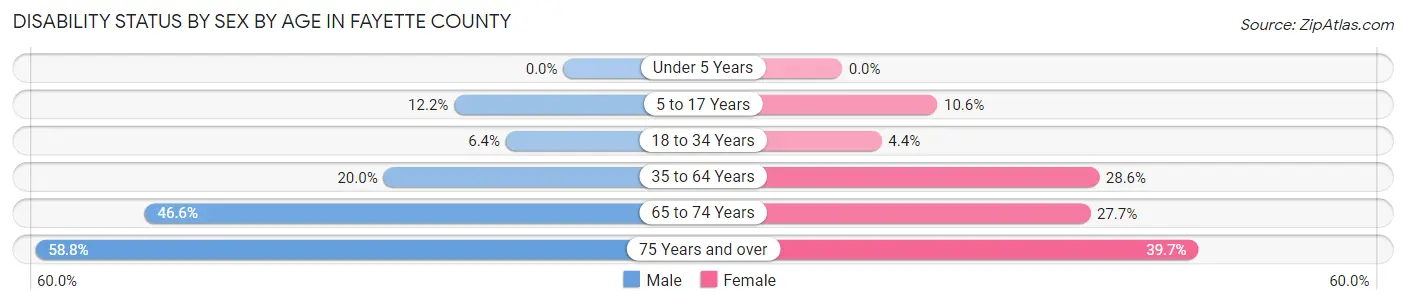
| Age Bracket | Male | Female |
| Under 5 Years | 0 (0.0%) | 0 (0.0%) |
| 5 to 17 Years | 322 (12.2%) | 263 (10.6%) |
| 18 to 34 Years | 191 (6.4%) | 126 (4.4%) |
| 35 to 64 Years | 1,095 (20.0%) | 1,623 (28.6%) |
| 65 to 74 Years | 677 (46.6%) | 438 (27.7%) |
| 75 Years and over | 444 (58.8%) | 434 (39.7%) |
Disability Class by Sex by Age in Fayette County
Disability Class: Hearing Difficulty
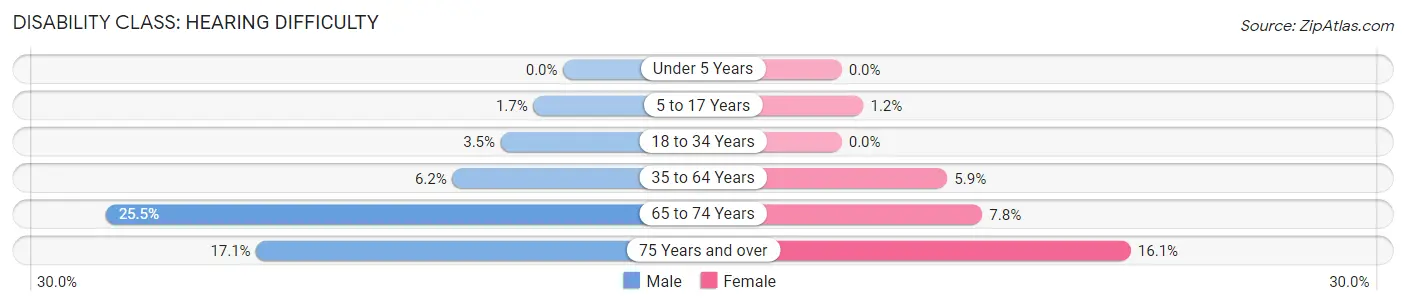
| Age Bracket | Male | Female |
| Under 5 Years | 0 (0.0%) | 0 (0.0%) |
| 5 to 17 Years | 44 (1.7%) | 30 (1.2%) |
| 18 to 34 Years | 104 (3.5%) | 0 (0.0%) |
| 35 to 64 Years | 337 (6.2%) | 333 (5.9%) |
| 65 to 74 Years | 370 (25.5%) | 124 (7.8%) |
| 75 Years and over | 129 (17.1%) | 176 (16.1%) |
Disability Class: Vision Difficulty
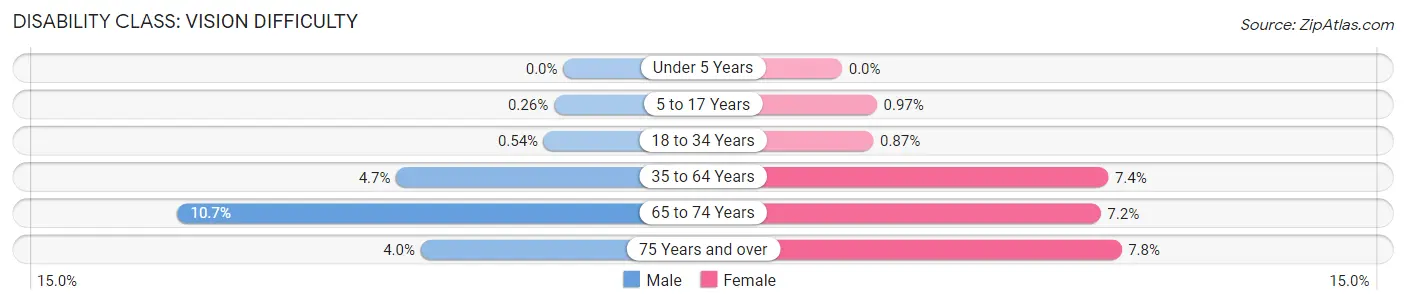
| Age Bracket | Male | Female |
| Under 5 Years | 0 (0.0%) | 0 (0.0%) |
| 5 to 17 Years | 7 (0.3%) | 24 (1.0%) |
| 18 to 34 Years | 16 (0.5%) | 25 (0.9%) |
| 35 to 64 Years | 254 (4.6%) | 420 (7.4%) |
| 65 to 74 Years | 156 (10.7%) | 114 (7.2%) |
| 75 Years and over | 30 (4.0%) | 85 (7.8%) |
Disability Class: Cognitive Difficulty
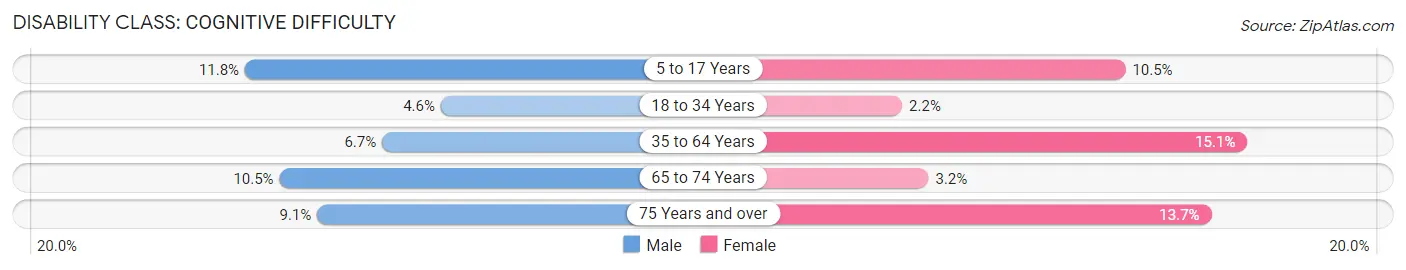
| Age Bracket | Male | Female |
| 5 to 17 Years | 313 (11.8%) | 261 (10.5%) |
| 18 to 34 Years | 136 (4.5%) | 64 (2.2%) |
| 35 to 64 Years | 368 (6.7%) | 853 (15.0%) |
| 65 to 74 Years | 153 (10.5%) | 51 (3.2%) |
| 75 Years and over | 69 (9.1%) | 150 (13.7%) |
Disability Class: Ambulatory Difficulty
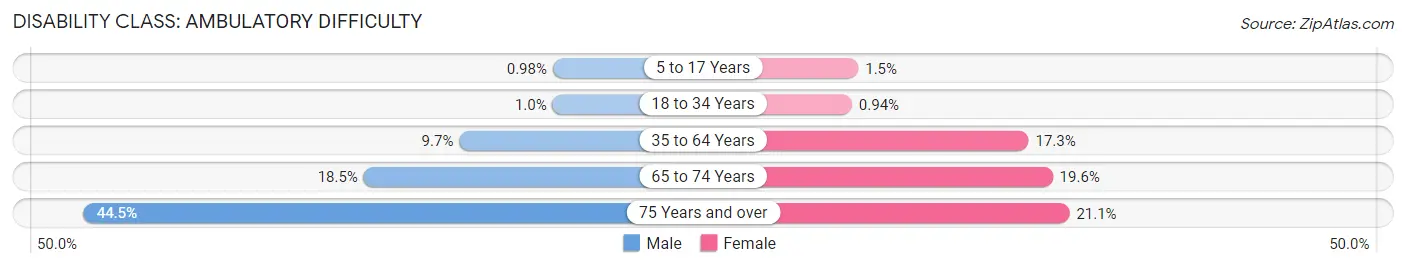
| Age Bracket | Male | Female |
| 5 to 17 Years | 26 (1.0%) | 38 (1.5%) |
| 18 to 34 Years | 30 (1.0%) | 27 (0.9%) |
| 35 to 64 Years | 528 (9.7%) | 982 (17.3%) |
| 65 to 74 Years | 269 (18.5%) | 310 (19.6%) |
| 75 Years and over | 336 (44.5%) | 231 (21.1%) |
Disability Class: Self-Care Difficulty
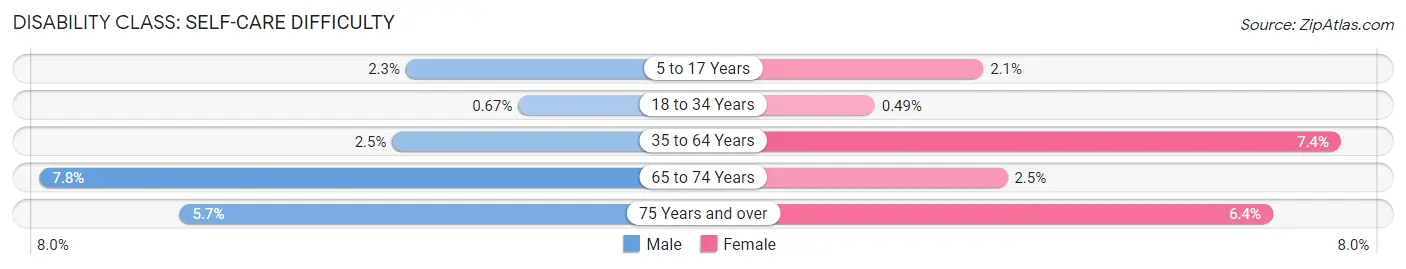
| Age Bracket | Male | Female |
| 5 to 17 Years | 62 (2.3%) | 52 (2.1%) |
| 18 to 34 Years | 20 (0.7%) | 14 (0.5%) |
| 35 to 64 Years | 139 (2.5%) | 420 (7.4%) |
| 65 to 74 Years | 113 (7.8%) | 39 (2.5%) |
| 75 Years and over | 43 (5.7%) | 70 (6.4%) |
Technology Access in Fayette County
Computing Device Access in Fayette County
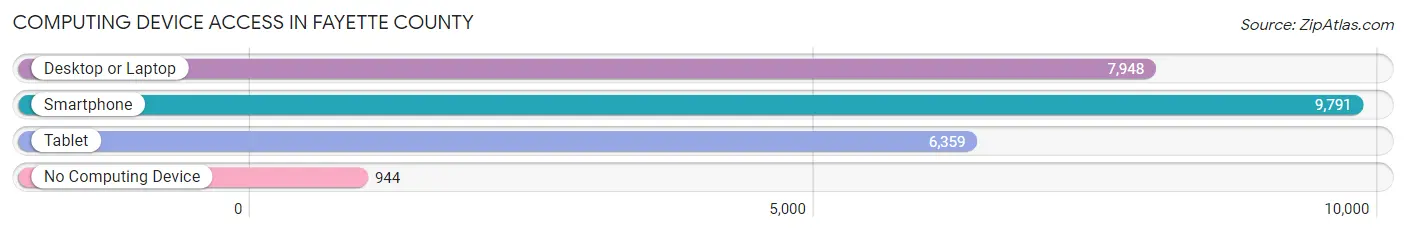
| Device Type | # Households | % Households |
| Desktop or Laptop | 7,948 | 68.4% |
| Smartphone | 9,791 | 84.3% |
| Tablet | 6,359 | 54.7% |
| No Computing Device | 944 | 8.1% |
| Total | 11,620 | 100.0% |
Internet Access in Fayette County
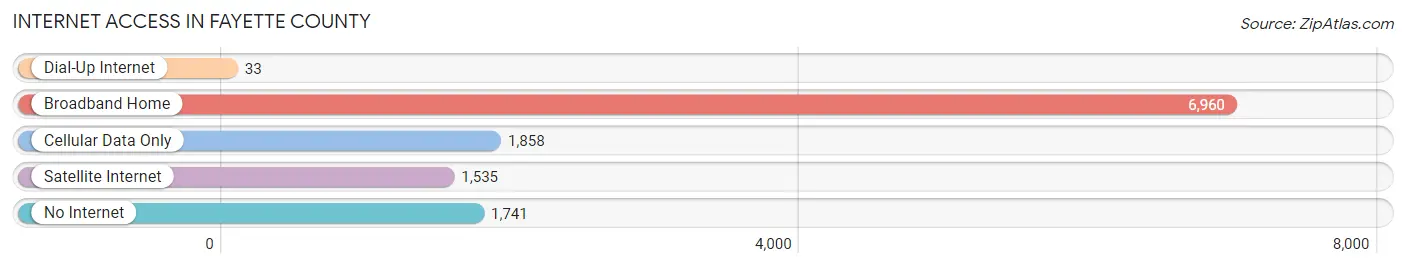
| Internet Type | # Households | % Households |
| Dial-Up Internet | 33 | 0.3% |
| Broadband Home | 6,960 | 59.9% |
| Cellular Data Only | 1,858 | 16.0% |
| Satellite Internet | 1,535 | 13.2% |
| No Internet | 1,741 | 15.0% |
| Total | 11,620 | 100.0% |
Fayette County Summary
Fayette County is located in the southwestern region of Ohio, and is part of the Appalachian region. It is bordered by Madison County to the north, Pickaway County to the east, Highland County to the south, and Clinton County to the west. The county seat is Washington Court House, and the county has a total area of 437 square miles.
History
Fayette County was formed in 1810 from parts of Highland and Ross Counties. It was named after the Marquis de Lafayette, a French military leader who fought alongside the American colonists during the Revolutionary War. The county was originally divided into six townships: Jefferson, Madison, Marion, Perry, Union, and Wayne.
The first settlers in the area were mostly of German and English descent, and they began arriving in the early 1800s. The county was largely agricultural, and the main crops were wheat, corn, and oats. The county also had a thriving livestock industry, with sheep, cattle, and hogs being raised.
The county was also home to several industries, including iron and coal mining, brick-making, and furniture-making. The county was also home to several mills, including grist mills, saw mills, and woolen mills.
Geography
Fayette County is located in the southwestern region of Ohio, and is part of the Appalachian region. It is bordered by Madison County to the north, Pickaway County to the east, Highland County to the south, and Clinton County to the west. The county seat is Washington Court House, and the county has a total area of 437 square miles.
The terrain of the county is mostly rolling hills, with some flat areas in the northern part of the county. The county is drained by the Scioto River, which flows through the county from north to south. The county is also home to several small lakes and ponds, including Lake Lorelei, Lake Loramie, and Lake Loramie State Park.
Economy
Fayette County has a diverse economy, with a mix of agriculture, manufacturing, and services. The county is home to several large employers, including Honda of America, Fayette County Memorial Hospital, and the Fayette County Board of Education.
Agriculture is a major part of the county’s economy, with corn, soybeans, wheat, and hay being the main crops. Livestock production is also important, with cattle, hogs, and sheep being raised.
Manufacturing is also an important part of the county’s economy, with several large companies located in the county. These include Honda of America, which produces automobiles and engines, and Fayette County Memorial Hospital, which produces medical equipment.
The county is also home to several small businesses, including restaurants, retail stores, and service providers. Tourism is also an important part of the county’s economy, with several attractions, including Lake Loramie State Park, the Fayette County Historical Society, and the Fayette County Fair.
Demographics
As of the 2010 census, Fayette County had a population of 29,030. The population was spread out, with 24.3% under the age of 18, 8.2% from 18 to 24, 28.2% from 25 to 44, 24.3% from 45 to 64, and 14.0% who were 65 years of age or older. The median age was 37.4 years.
The racial makeup of the county was 95.2% White, 1.7% African American, 0.2% Native American, 0.5% Asian, 0.1% Pacific Islander, 0.7% from other races, and 1.7% from two or more races. Hispanic or Latino of any race were 2.2% of the population.
The median income for a household in the county was $41,945, and the median income for a family was $50,945. The per capita income for the county was $20,945. About 11.2% of families and 14.2% of the population were below the poverty line, including 19.2% of those under age 18 and 8.2% of those age 65 or over.
Common Questions
What is Per Capita Income in Fayette County?
Per Capita income in Fayette County is $30,666.
What is the Median Family Income in Fayette County?
Median Family Income in Fayette County is $71,719.
What is the Median Household income in Fayette County?
Median Household Income in Fayette County is $56,773.
What is Income or Wage Gap in Fayette County?
Income or Wage Gap in Fayette County is 38.5%.
Women in Fayette County earn 61.5 cents for every dollar earned by a man.
What is Family Income Deficit in Fayette County?
Family Income Deficit in Fayette County is $14,705.
Families that are below poverty line in Fayette County earn $14,705 less on average than the poverty threshold level.
What is Inequality or Gini Index in Fayette County?
Inequality or Gini Index in Fayette County is 0.44.
What is the Total Population of Fayette County?
Total Population of Fayette County is 28,901.
What is the Total Male Population of Fayette County?
Total Male Population of Fayette County is 14,270.
What is the Total Female Population of Fayette County?
Total Female Population of Fayette County is 14,631.
What is the Ratio of Males per 100 Females in Fayette County?
There are 97.53 Males per 100 Females in Fayette County.
What is the Ratio of Females per 100 Males in Fayette County?
There are 102.53 Females per 100 Males in Fayette County.
What is the Median Population Age in Fayette County?
Median Population Age in Fayette County is 41.2 Years.
What is the Average Family Size in Fayette County
Average Family Size in Fayette County is 3.0 People.
What is the Average Household Size in Fayette County
Average Household Size in Fayette County is 2.5 People.
How Large is the Labor Force in Fayette County?
There are 13,539 People in the Labor Forcein in Fayette County.
What is the Percentage of People in the Labor Force in Fayette County?
58.9% of People are in the Labor Force in Fayette County.
What is the Unemployment Rate in Fayette County?
Unemployment Rate in Fayette County is 4.3%.