Cities with the Most Immigrants from Nicaragua in Florida
RELATED REPORTS & OPTIONS
Nicaragua
Florida
Compare Cities
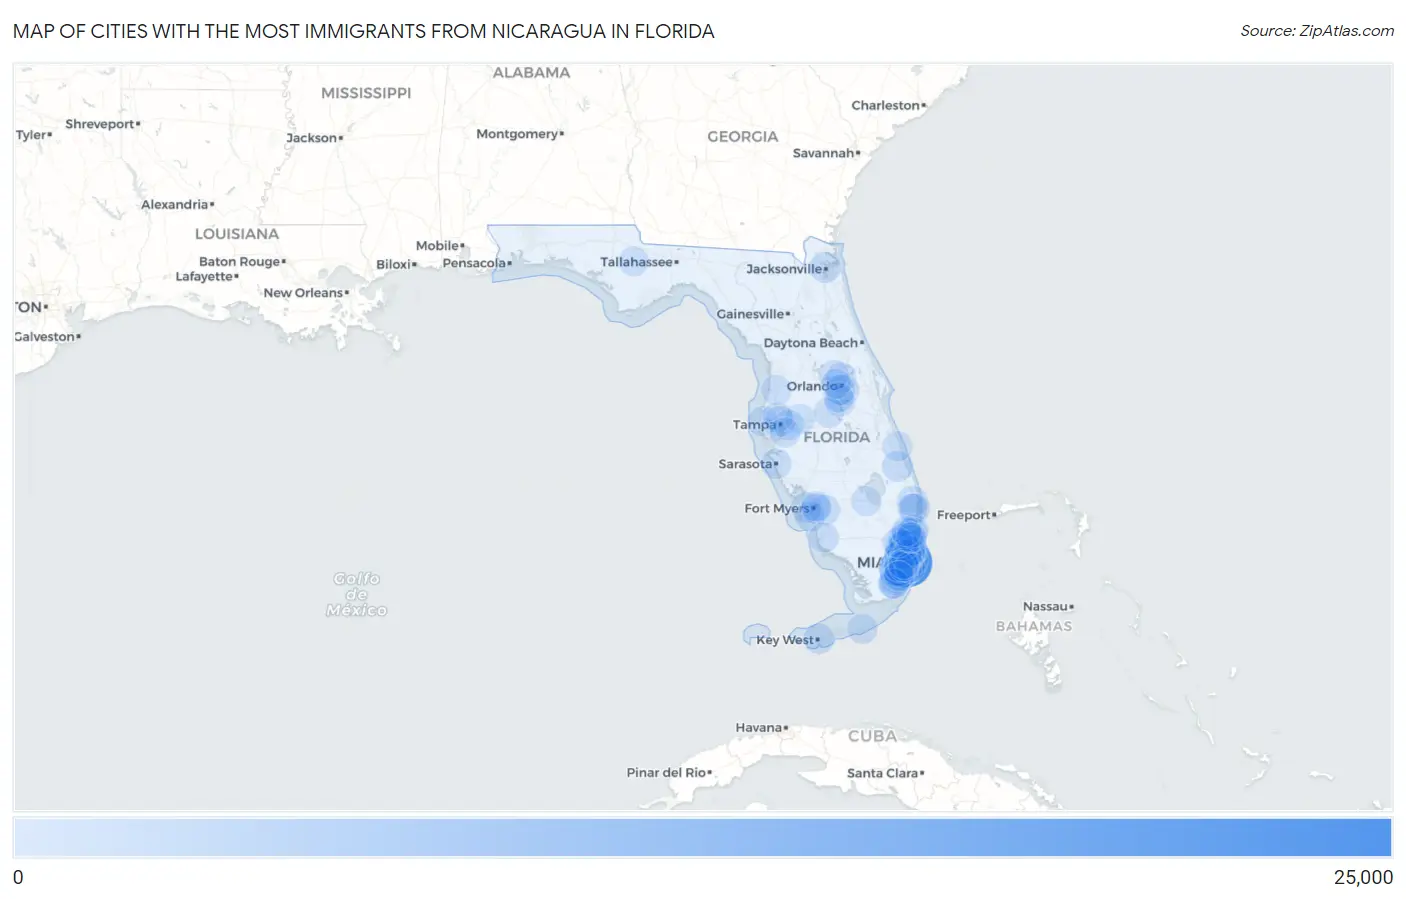
Map of Cities with the Most Immigrants from Nicaragua in Florida
0
25,000
Cities with the Most Immigrants from Nicaragua in Florida
| City | Nicaragua | vs State | vs National | |
| 1. | Miami | 20,714 | 105,066(19.72%)#1 | 255,152(8.12%)#1 |
| 2. | Hialeah | 7,858 | 105,066(7.48%)#2 | 255,152(3.08%)#3 |
| 3. | Fountainebleau | 3,151 | 105,066(3.00%)#3 | 255,152(1.23%)#7 |
| 4. | Sweetwater | 3,126 | 105,066(2.98%)#4 | 255,152(1.23%)#8 |
| 5. | The Hammocks | 2,197 | 105,066(2.09%)#5 | 255,152(0.86%)#9 |
| 6. | Kendale Lakes | 2,139 | 105,066(2.04%)#6 | 255,152(0.84%)#10 |
| 7. | Tamiami | 2,043 | 105,066(1.94%)#7 | 255,152(0.80%)#12 |
| 8. | Kendall | 1,901 | 105,066(1.81%)#8 | 255,152(0.75%)#13 |
| 9. | Miami Gardens | 1,708 | 105,066(1.63%)#9 | 255,152(0.67%)#14 |
| 10. | Kendall West | 1,632 | 105,066(1.55%)#10 | 255,152(0.64%)#15 |
| 11. | West Little River | 1,476 | 105,066(1.40%)#11 | 255,152(0.58%)#17 |
| 12. | Homestead | 1,467 | 105,066(1.40%)#12 | 255,152(0.57%)#18 |
| 13. | Pembroke Pines | 1,395 | 105,066(1.33%)#13 | 255,152(0.55%)#19 |
| 14. | Princeton | 1,225 | 105,066(1.17%)#14 | 255,152(0.48%)#22 |
| 15. | Cutler Bay | 1,124 | 105,066(1.07%)#15 | 255,152(0.44%)#24 |
| 16. | Richmond West | 1,088 | 105,066(1.04%)#16 | 255,152(0.43%)#25 |
| 17. | Miramar | 1,054 | 105,066(1.00%)#17 | 255,152(0.41%)#26 |
| 18. | Palmetto Estates | 1,044 | 105,066(0.99%)#18 | 255,152(0.41%)#27 |
| 19. | Hialeah Gardens | 1,043 | 105,066(0.99%)#19 | 255,152(0.41%)#28 |
| 20. | North Miami | 993 | 105,066(0.95%)#20 | 255,152(0.39%)#29 |
| 21. | Hollywood | 930 | 105,066(0.89%)#21 | 255,152(0.36%)#31 |
| 22. | Country Walk | 911 | 105,066(0.87%)#22 | 255,152(0.36%)#34 |
| 23. | Brownsville | 910 | 105,066(0.87%)#23 | 255,152(0.36%)#35 |
| 24. | Gladeview | 837 | 105,066(0.80%)#24 | 255,152(0.33%)#39 |
| 25. | Jacksonville | 790 | 105,066(0.75%)#25 | 255,152(0.31%)#42 |
| 26. | Port St Lucie | 769 | 105,066(0.73%)#26 | 255,152(0.30%)#43 |
| 27. | Coral Terrace | 737 | 105,066(0.70%)#27 | 255,152(0.29%)#46 |
| 28. | Westchester | 720 | 105,066(0.69%)#28 | 255,152(0.28%)#47 |
| 29. | North Miami Beach | 667 | 105,066(0.63%)#29 | 255,152(0.26%)#51 |
| 30. | Country Club | 655 | 105,066(0.62%)#30 | 255,152(0.26%)#53 |
| 31. | Orlando | 643 | 105,066(0.61%)#31 | 255,152(0.25%)#57 |
| 32. | South Miami Heights | 615 | 105,066(0.59%)#32 | 255,152(0.24%)#62 |
| 33. | The Crossings | 598 | 105,066(0.57%)#33 | 255,152(0.23%)#64 |
| 34. | Miami Beach | 585 | 105,066(0.56%)#34 | 255,152(0.23%)#65 |
| 35. | Doral | 568 | 105,066(0.54%)#35 | 255,152(0.22%)#67 |
| 36. | West Palm Beach | 567 | 105,066(0.54%)#36 | 255,152(0.22%)#68 |
| 37. | Coral Gables | 566 | 105,066(0.54%)#37 | 255,152(0.22%)#70 |
| 38. | Cape Coral | 559 | 105,066(0.53%)#38 | 255,152(0.22%)#73 |
| 39. | Davie | 548 | 105,066(0.52%)#39 | 255,152(0.21%)#74 |
| 40. | Palm Springs | 542 | 105,066(0.52%)#40 | 255,152(0.21%)#77 |
| 41. | Three Lakes | 536 | 105,066(0.51%)#41 | 255,152(0.21%)#78 |
| 42. | Key West | 532 | 105,066(0.51%)#42 | 255,152(0.21%)#79 |
| 43. | Pinewood | 519 | 105,066(0.49%)#43 | 255,152(0.20%)#81 |
| 44. | Sunrise | 517 | 105,066(0.49%)#44 | 255,152(0.20%)#82 |
| 45. | Kissimmee | 484 | 105,066(0.46%)#45 | 255,152(0.19%)#85 |
| 46. | Margate | 464 | 105,066(0.44%)#46 | 255,152(0.18%)#91 |
| 47. | West Perrine | 463 | 105,066(0.44%)#47 | 255,152(0.18%)#92 |
| 48. | Miami Springs | 448 | 105,066(0.43%)#48 | 255,152(0.18%)#95 |
| 49. | Tampa | 447 | 105,066(0.43%)#49 | 255,152(0.18%)#96 |
| 50. | Fort Lauderdale | 441 | 105,066(0.42%)#50 | 255,152(0.17%)#100 |
| 51. | Glenvar Heights | 439 | 105,066(0.42%)#51 | 255,152(0.17%)#101 |
| 52. | Leisure City | 426 | 105,066(0.41%)#52 | 255,152(0.17%)#104 |
| 53. | Lake Worth Beach | 371 | 105,066(0.35%)#53 | 255,152(0.15%)#120 |
| 54. | Sarasota | 367 | 105,066(0.35%)#54 | 255,152(0.14%)#123 |
| 55. | Palmetto Bay | 364 | 105,066(0.35%)#55 | 255,152(0.14%)#125 |
| 56. | Dania Beach | 360 | 105,066(0.34%)#56 | 255,152(0.14%)#127 |
| 57. | Miami Lakes | 351 | 105,066(0.33%)#57 | 255,152(0.14%)#129 |
| 58. | Westview | 344 | 105,066(0.33%)#58 | 255,152(0.13%)#131 |
| 59. | Deerfield Beach | 339 | 105,066(0.32%)#59 | 255,152(0.13%)#132 |
| 60. | Golden Glades | 332 | 105,066(0.32%)#60 | 255,152(0.13%)#134 |
| 61. | Lehigh Acres | 326 | 105,066(0.31%)#61 | 255,152(0.13%)#138 |
| 62. | Harlem Heights | 326 | 105,066(0.31%)#62 | 255,152(0.13%)#139 |
| 63. | Richmond Heights | 307 | 105,066(0.29%)#63 | 255,152(0.12%)#143 |
| 64. | Hallandale Beach | 284 | 105,066(0.27%)#64 | 255,152(0.11%)#153 |
| 65. | Sunset | 282 | 105,066(0.27%)#65 | 255,152(0.11%)#154 |
| 66. | Oak Ridge | 270 | 105,066(0.26%)#66 | 255,152(0.11%)#162 |
| 67. | Fort Myers | 261 | 105,066(0.25%)#67 | 255,152(0.10%)#165 |
| 68. | Brandon | 252 | 105,066(0.24%)#68 | 255,152(0.10%)#166 |
| 69. | Altamonte Springs | 250 | 105,066(0.24%)#69 | 255,152(0.10%)#169 |
| 70. | Greenacres | 222 | 105,066(0.21%)#70 | 255,152(0.09%)#187 |
| 71. | Tamarac | 215 | 105,066(0.20%)#71 | 255,152(0.08%)#192 |
| 72. | Marathon | 211 | 105,066(0.20%)#72 | 255,152(0.08%)#199 |
| 73. | Ives Estates | 209 | 105,066(0.20%)#73 | 255,152(0.08%)#200 |
| 74. | Opa Locka | 202 | 105,066(0.19%)#74 | 255,152(0.08%)#208 |
| 75. | Lauderdale Lakes | 198 | 105,066(0.19%)#75 | 255,152(0.08%)#212 |
| 76. | Cooper City | 198 | 105,066(0.19%)#76 | 255,152(0.08%)#213 |
| 77. | Westwood Lakes | 198 | 105,066(0.19%)#77 | 255,152(0.08%)#215 |
| 78. | Florida City | 195 | 105,066(0.19%)#78 | 255,152(0.08%)#219 |
| 79. | South Miami | 182 | 105,066(0.17%)#79 | 255,152(0.07%)#229 |
| 80. | Clearwater | 180 | 105,066(0.17%)#80 | 255,152(0.07%)#231 |
| 81. | Weston | 178 | 105,066(0.17%)#81 | 255,152(0.07%)#233 |
| 82. | Tice | 169 | 105,066(0.16%)#82 | 255,152(0.07%)#244 |
| 83. | Plant City | 168 | 105,066(0.16%)#83 | 255,152(0.07%)#245 |
| 84. | Pompano Beach | 166 | 105,066(0.16%)#84 | 255,152(0.07%)#246 |
| 85. | Carrollwood | 164 | 105,066(0.16%)#85 | 255,152(0.06%)#250 |
| 86. | Haines City | 164 | 105,066(0.16%)#86 | 255,152(0.06%)#252 |
| 87. | Golden Gate | 160 | 105,066(0.15%)#87 | 255,152(0.06%)#258 |
| 88. | Hunters Creek | 159 | 105,066(0.15%)#88 | 255,152(0.06%)#261 |
| 89. | Spring Hill | 151 | 105,066(0.14%)#89 | 255,152(0.06%)#270 |
| 90. | Coral Springs | 149 | 105,066(0.14%)#90 | 255,152(0.06%)#279 |
| 91. | Apopka | 143 | 105,066(0.14%)#91 | 255,152(0.06%)#285 |
| 92. | Key Biscayne | 142 | 105,066(0.14%)#92 | 255,152(0.06%)#288 |
| 93. | Pine Hills | 139 | 105,066(0.13%)#93 | 255,152(0.05%)#289 |
| 94. | West Miami | 133 | 105,066(0.13%)#94 | 255,152(0.05%)#298 |
| 95. | Gibsonton | 130 | 105,066(0.12%)#95 | 255,152(0.05%)#304 |
| 96. | Goulds | 128 | 105,066(0.12%)#96 | 255,152(0.05%)#311 |
| 97. | Vero Beach South | 126 | 105,066(0.12%)#97 | 255,152(0.05%)#316 |
| 98. | Blountstown | 126 | 105,066(0.12%)#98 | 255,152(0.05%)#317 |
| 99. | Clewiston | 122 | 105,066(0.12%)#99 | 255,152(0.05%)#323 |
| 100. | Oakland Park | 120 | 105,066(0.11%)#100 | 255,152(0.05%)#327 |
Common Questions
What are the Top 10 Cities with the Most Immigrants from Nicaragua in Florida?
Top 10 Cities with the Most Immigrants from Nicaragua in Florida are:
#1
20,714
#2
7,858
#3
3,151
#4
3,126
#5
2,197
#6
2,139
#7
2,043
#8
1,901
#9
1,708
#10
1,632
What city has the Most Immigrants from Nicaragua in Florida?
Miami has the Most Immigrants from Nicaragua in Florida with 20,714.
What is the Total Immigrants from Nicaragua in the State of Florida?
Total Immigrants from Nicaragua in Florida is 105,066.
What is the Total Immigrants from Nicaragua in the United States?
Total Immigrants from Nicaragua in the United States is 255,152.