Smithfield, KY Map & Demographics
Smithfield Map
Smithfield Overview
$19,169
PER CAPITA INCOME
$46,458
AVG FAMILY INCOME
$46,354
AVG HOUSEHOLD INCOME
25.3%
WAGE / INCOME GAP [ % ]
74.7¢/ $1
WAGE / INCOME GAP [ $ ]
0.40
INEQUALITY / GINI INDEX
186
TOTAL POPULATION
113
MALE POPULATION
73
FEMALE POPULATION
154.79
MALES / 100 FEMALES
64.60
FEMALES / 100 MALES
31.5
MEDIAN AGE
3.4
AVG FAMILY SIZE
3.1
AVG HOUSEHOLD SIZE
121
LABOR FORCE [ PEOPLE ]
82.9%
PERCENT IN LABOR FORCE
2.5%
UNEMPLOYMENT RATE
Smithfield Zip Codes
Smithfield Area Codes
Income in Smithfield
Income Overview in Smithfield
Per Capita Income in Smithfield is $19,169, while median incomes of families and households are $46,458 and $46,354 respectively.
| Characteristic | Number | Measure |
| Per Capita Income | 186 | $19,169 |
| Median Family Income | 48 | $46,458 |
| Mean Family Income | 48 | $54,371 |
| Median Household Income | 59 | $46,354 |
| Mean Household Income | 59 | $51,544 |
| Income Deficit | 48 | $0 |
| Wage / Income Gap (%) | 186 | 25.32% |
| Wage / Income Gap ($) | 186 | 74.68¢ per $1 |
| Gini / Inequality Index | 186 | 0.40 |
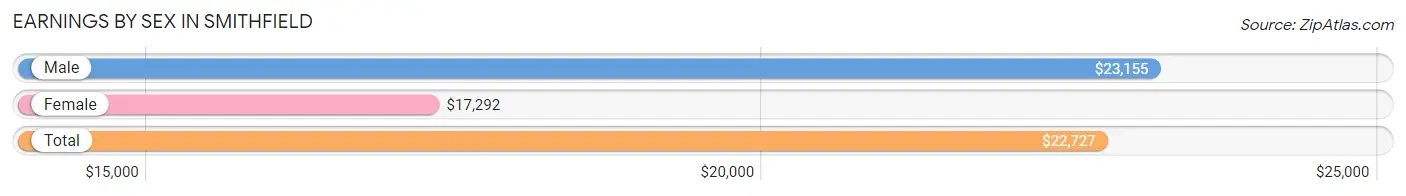
Earnings by Sex in Smithfield
Average Earnings in Smithfield are $22,727, $23,155 for men and $17,292 for women, a difference of 25.3%.
| Sex | Number | Average Earnings |
| Male | 77 (60.2%) | $23,155 |
| Female | 51 (39.8%) | $17,292 |
| Total | 128 (100.0%) | $22,727 |
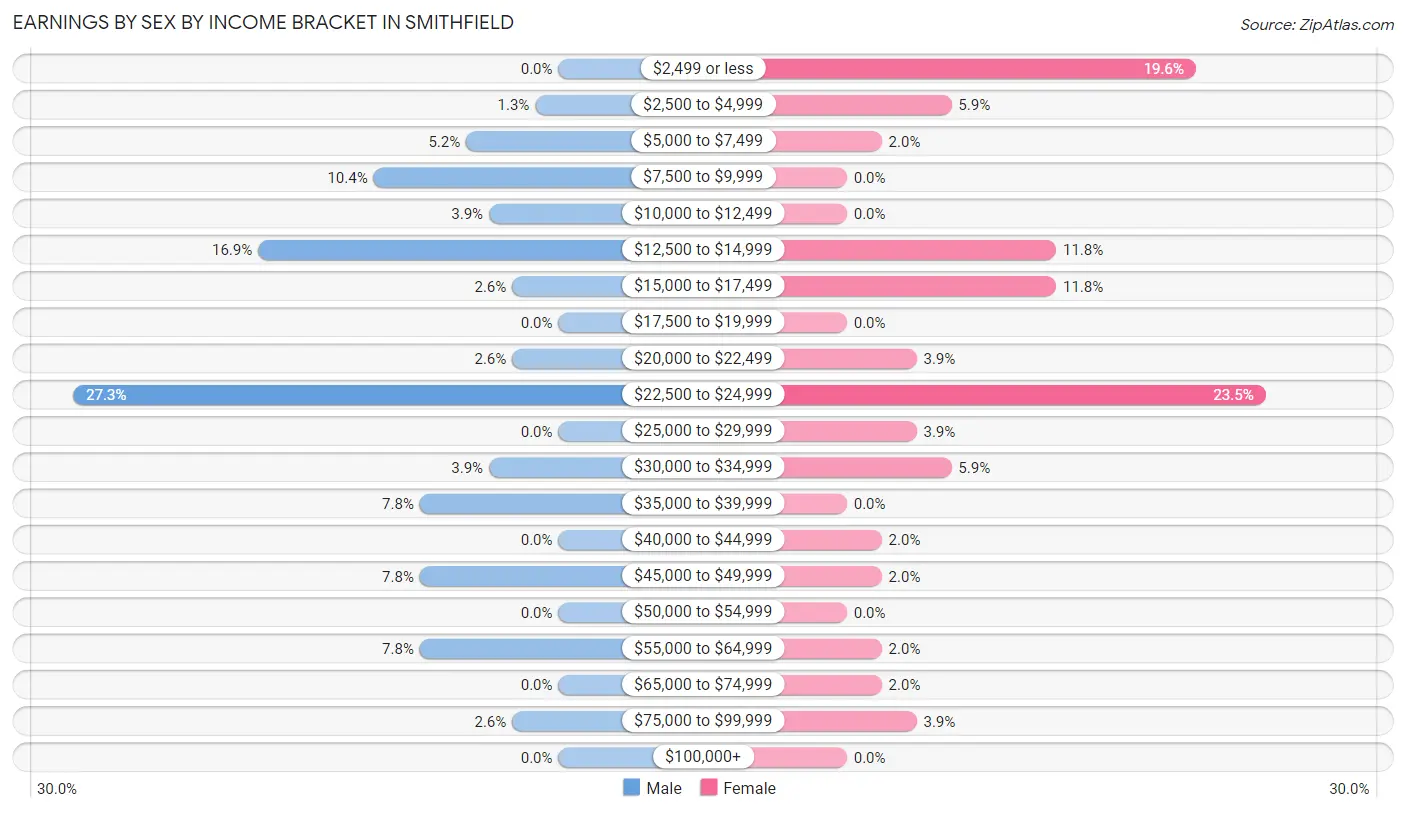
Earnings by Sex by Income Bracket in Smithfield
The most common earnings brackets in Smithfield are $22,500 to $24,999 for men (21 | 27.3%) and $22,500 to $24,999 for women (12 | 23.5%).
| Income | Male | Female |
| $2,499 or less | 0 (0.0%) | 10 (19.6%) |
| $2,500 to $4,999 | 1 (1.3%) | 3 (5.9%) |
| $5,000 to $7,499 | 4 (5.2%) | 1 (2.0%) |
| $7,500 to $9,999 | 8 (10.4%) | 0 (0.0%) |
| $10,000 to $12,499 | 3 (3.9%) | 0 (0.0%) |
| $12,500 to $14,999 | 13 (16.9%) | 6 (11.8%) |
| $15,000 to $17,499 | 2 (2.6%) | 6 (11.8%) |
| $17,500 to $19,999 | 0 (0.0%) | 0 (0.0%) |
| $20,000 to $22,499 | 2 (2.6%) | 2 (3.9%) |
| $22,500 to $24,999 | 21 (27.3%) | 12 (23.5%) |
| $25,000 to $29,999 | 0 (0.0%) | 2 (3.9%) |
| $30,000 to $34,999 | 3 (3.9%) | 3 (5.9%) |
| $35,000 to $39,999 | 6 (7.8%) | 0 (0.0%) |
| $40,000 to $44,999 | 0 (0.0%) | 1 (2.0%) |
| $45,000 to $49,999 | 6 (7.8%) | 1 (2.0%) |
| $50,000 to $54,999 | 0 (0.0%) | 0 (0.0%) |
| $55,000 to $64,999 | 6 (7.8%) | 1 (2.0%) |
| $65,000 to $74,999 | 0 (0.0%) | 1 (2.0%) |
| $75,000 to $99,999 | 2 (2.6%) | 2 (3.9%) |
| $100,000+ | 0 (0.0%) | 0 (0.0%) |
| Total | 77 (100.0%) | 51 (100.0%) |
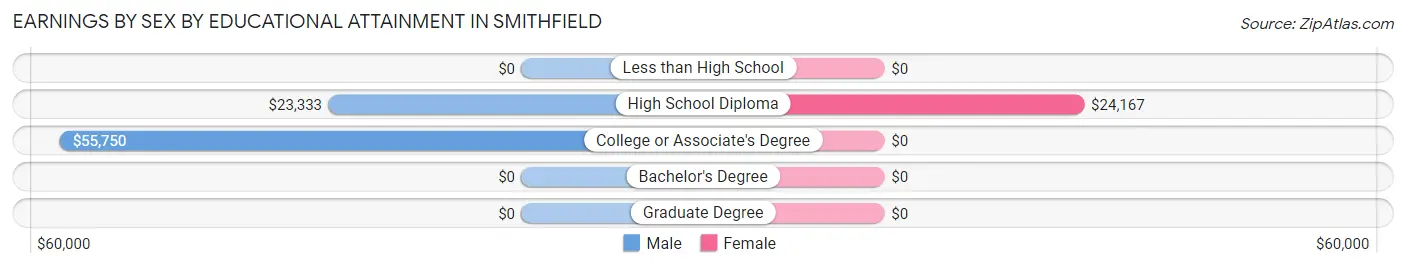
Earnings by Sex by Educational Attainment in Smithfield
Average earnings in Smithfield are $23,631 for men and $22,813 for women, a difference of 3.5%. Men with an educational attainment of college or associate's degree enjoy the highest average annual earnings of $55,750, while those with high school diploma education earn the least with $23,333. Women with an educational attainment of high school diploma earn the most with the average annual earnings of $24,167, while those with high school diploma education have the smallest earnings of $24,167.
| Educational Attainment | Male Income | Female Income |
| Less than High School | - | - |
| High School Diploma | $23,333 | $24,167 |
| College or Associate's Degree | $55,750 | $0 |
| Bachelor's Degree | - | - |
| Graduate Degree | - | - |
| Total | $23,631 | $22,813 |
Family Income in Smithfield
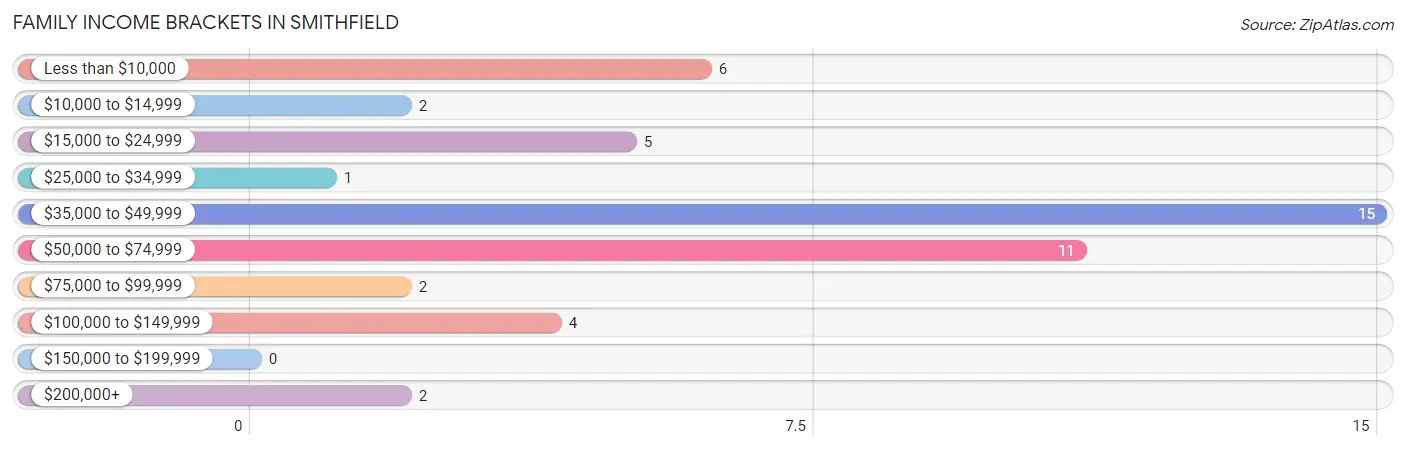
Family Income Brackets in Smithfield
According to the Smithfield family income data, there are 15 families falling into the $35,000 to $49,999 income range, which is the most common income bracket and makes up 31.2% of all families.
| Income Bracket | # Families | % Families |
| Less than $10,000 | 6 | 12.5% |
| $10,000 to $14,999 | 2 | 4.2% |
| $15,000 to $24,999 | 5 | 10.4% |
| $25,000 to $34,999 | 1 | 2.1% |
| $35,000 to $49,999 | 15 | 31.3% |
| $50,000 to $74,999 | 11 | 22.9% |
| $75,000 to $99,999 | 2 | 4.2% |
| $100,000 to $149,999 | 4 | 8.3% |
| $150,000 to $199,999 | 0 | 0.0% |
| $200,000+ | 2 | 4.2% |
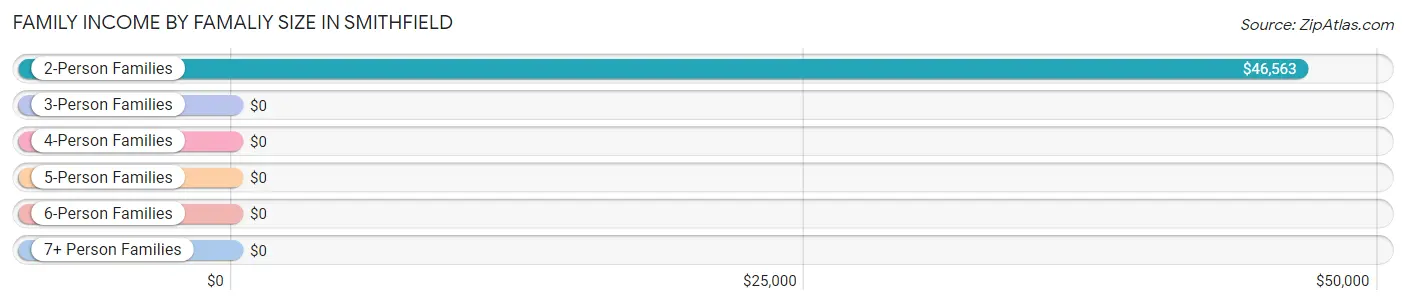
Family Income by Famaliy Size in Smithfield
2-person families (27 | 56.2%) account for the highest median family income in Smithfield with $46,563 per family, while 2-person families (27 | 56.2%) have the highest median income of $23,282 per family member.
| Income Bracket | # Families | Median Income |
| 2-Person Families | 27 (56.2%) | $46,563 |
| 3-Person Families | 8 (16.7%) | $0 |
| 4-Person Families | 13 (27.1%) | $0 |
| 5-Person Families | 0 (0.0%) | $0 |
| 6-Person Families | 0 (0.0%) | $0 |
| 7+ Person Families | 0 (0.0%) | $0 |
| Total | 48 (100.0%) | $46,458 |
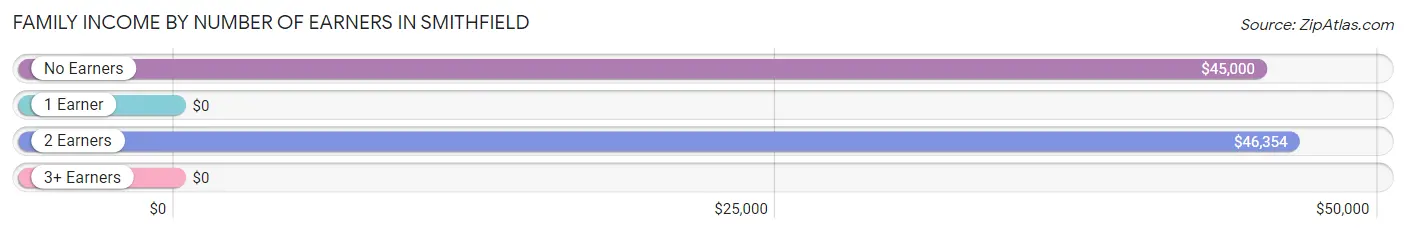
Family Income by Number of Earners in Smithfield
| Number of Earners | # Families | Median Income |
| No Earners | 8 (16.7%) | $45,000 |
| 1 Earner | 3 (6.2%) | $0 |
| 2 Earners | 35 (72.9%) | $46,354 |
| 3+ Earners | 2 (4.2%) | $0 |
| Total | 48 (100.0%) | $46,458 |
Household Income in Smithfield
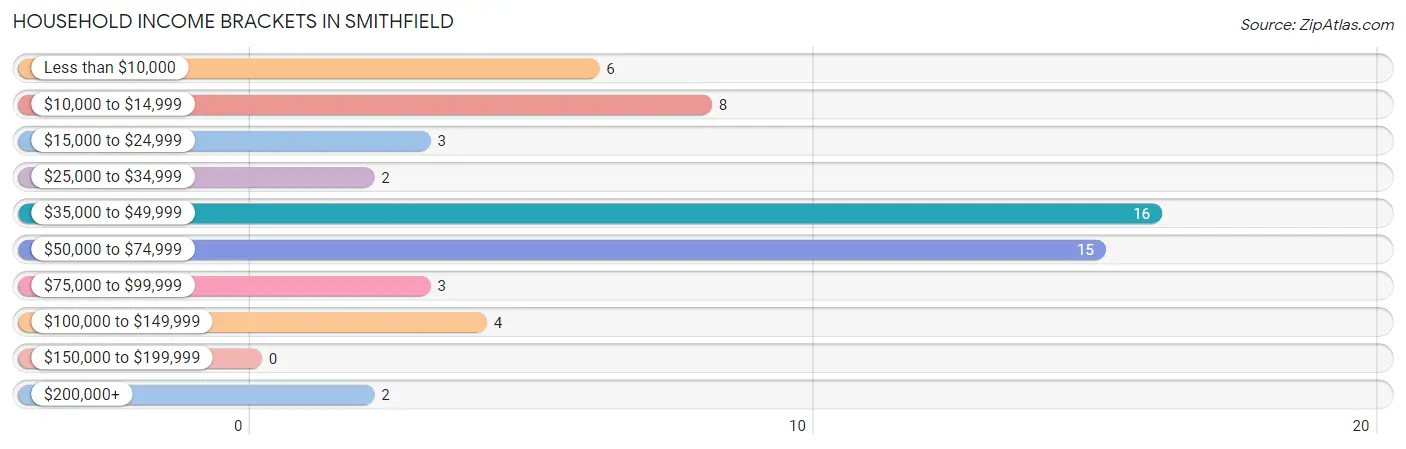
Household Income Brackets in Smithfield
With 16 households falling in the category, the $35,000 to $49,999 income range is the most frequent in Smithfield, accounting for 27.1% of all households.
| Income Bracket | # Households | % Households |
| Less than $10,000 | 6 | 10.2% |
| $10,000 to $14,999 | 8 | 13.6% |
| $15,000 to $24,999 | 3 | 5.1% |
| $25,000 to $34,999 | 2 | 3.4% |
| $35,000 to $49,999 | 16 | 27.1% |
| $50,000 to $74,999 | 15 | 25.4% |
| $75,000 to $99,999 | 3 | 5.1% |
| $100,000 to $149,999 | 4 | 6.8% |
| $150,000 to $199,999 | 0 | 0.0% |
| $200,000+ | 2 | 3.4% |
Household Income by Householder Age in Smithfield
The median household income in Smithfield is $46,354, with the highest median household income of $63,750 found in the 65+ years age bracket for the primary householder. A total of 9 households (15.2%) fall into this category. Meanwhile, the 15 to 24 years age bracket for the primary householder has the lowest median household income of $0, with 2 households (3.4%) in this group.
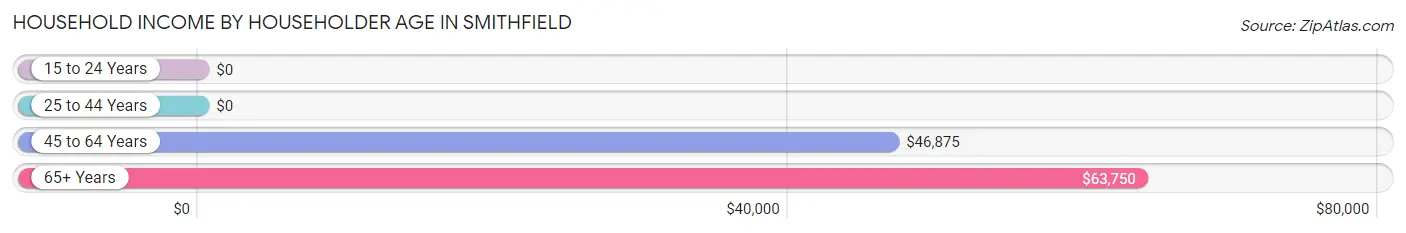
| Income Bracket | # Households | Median Income |
| 15 to 24 Years | 2 (3.4%) | $0 |
| 25 to 44 Years | 24 (40.7%) | $0 |
| 45 to 64 Years | 24 (40.7%) | $46,875 |
| 65+ Years | 9 (15.2%) | $63,750 |
| Total | 59 (100.0%) | $46,354 |
Poverty in Smithfield
Income Below Poverty by Sex and Age in Smithfield
With 25.7% poverty level for males and 26.0% for females among the residents of Smithfield, 5 year old males and under 5 year old females are the most vulnerable to poverty, with 9 males (100.0%) and 4 females (100.0%) in their respective age groups living below the poverty level.
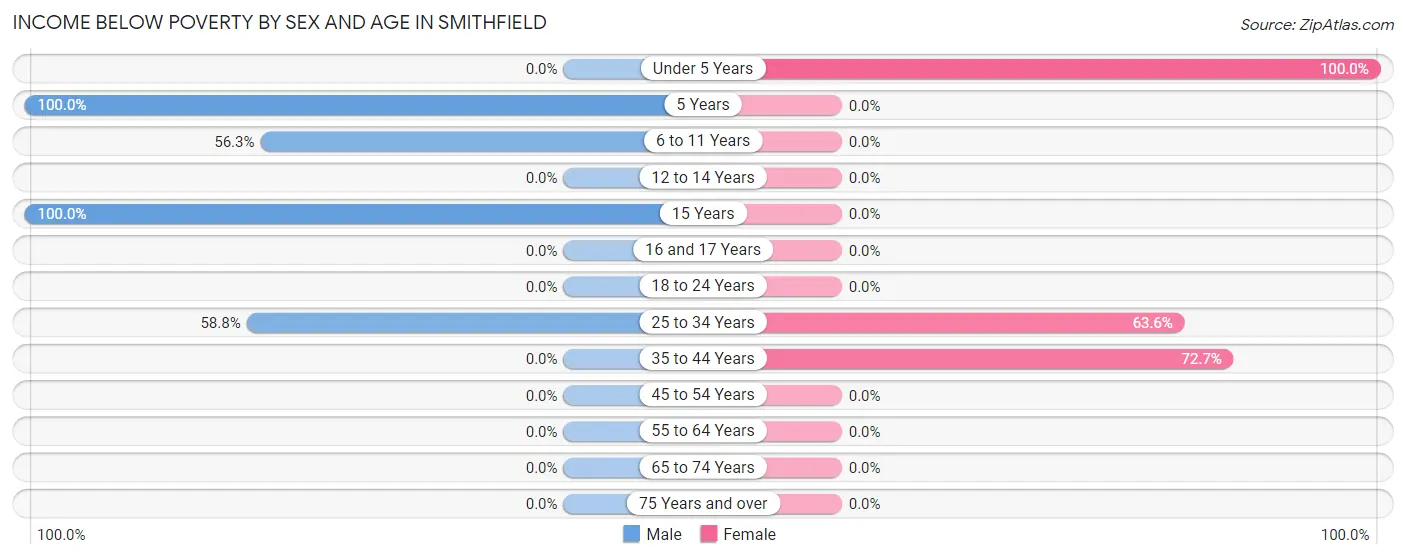
| Age Bracket | Male | Female |
| Under 5 Years | 0 (0.0%) | 4 (100.0%) |
| 5 Years | 9 (100.0%) | 0 (0.0%) |
| 6 to 11 Years | 9 (56.2%) | 0 (0.0%) |
| 12 to 14 Years | 0 (0.0%) | 0 (0.0%) |
| 15 Years | 1 (100.0%) | 0 (0.0%) |
| 16 and 17 Years | 0 (0.0%) | 0 (0.0%) |
| 18 to 24 Years | 0 (0.0%) | 0 (0.0%) |
| 25 to 34 Years | 10 (58.8%) | 7 (63.6%) |
| 35 to 44 Years | 0 (0.0%) | 8 (72.7%) |
| 45 to 54 Years | 0 (0.0%) | 0 (0.0%) |
| 55 to 64 Years | 0 (0.0%) | 0 (0.0%) |
| 65 to 74 Years | 0 (0.0%) | 0 (0.0%) |
| 75 Years and over | 0 (0.0%) | 0 (0.0%) |
| Total | 29 (25.7%) | 19 (26.0%) |
Income Above Poverty by Sex and Age in Smithfield
According to the poverty statistics in Smithfield, males aged 12 to 14 years and females aged 12 to 14 years are the age groups that are most secure financially, with 100.0% of males and 100.0% of females in these age groups living above the poverty line.
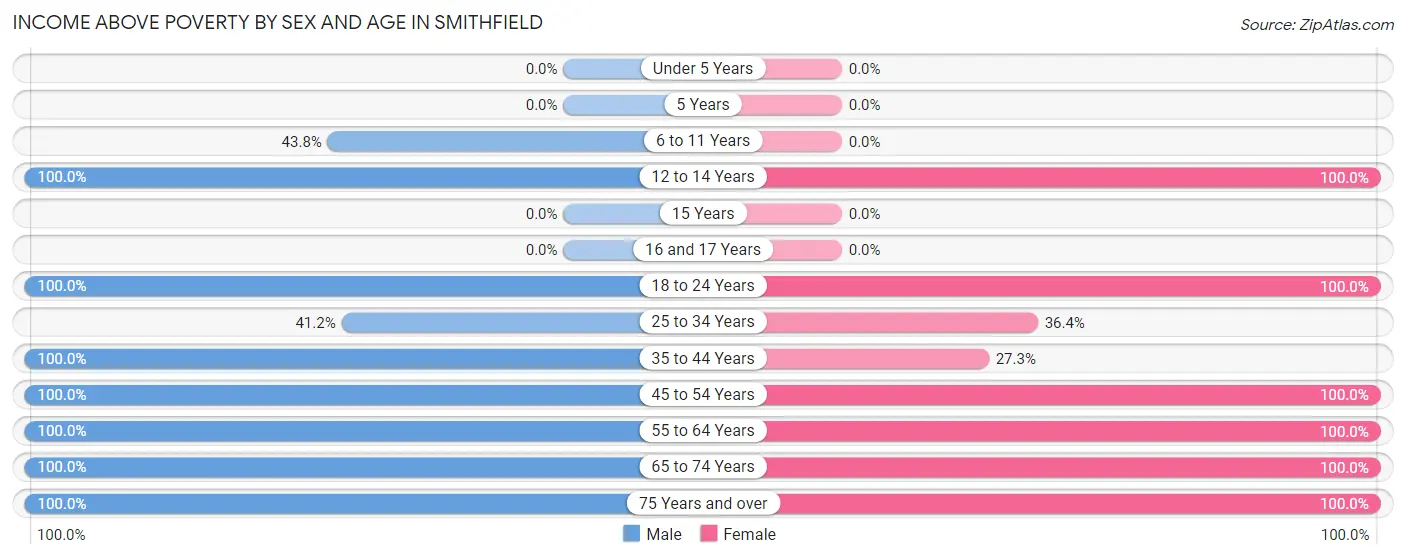
| Age Bracket | Male | Female |
| Under 5 Years | 0 (0.0%) | 0 (0.0%) |
| 5 Years | 0 (0.0%) | 0 (0.0%) |
| 6 to 11 Years | 7 (43.8%) | 0 (0.0%) |
| 12 to 14 Years | 2 (100.0%) | 8 (100.0%) |
| 15 Years | 0 (0.0%) | 0 (0.0%) |
| 16 and 17 Years | 0 (0.0%) | 0 (0.0%) |
| 18 to 24 Years | 24 (100.0%) | 8 (100.0%) |
| 25 to 34 Years | 7 (41.2%) | 4 (36.4%) |
| 35 to 44 Years | 10 (100.0%) | 3 (27.3%) |
| 45 to 54 Years | 24 (100.0%) | 21 (100.0%) |
| 55 to 64 Years | 4 (100.0%) | 3 (100.0%) |
| 65 to 74 Years | 3 (100.0%) | 6 (100.0%) |
| 75 Years and over | 3 (100.0%) | 1 (100.0%) |
| Total | 84 (74.3%) | 54 (74.0%) |
Income Below Poverty Among Married-Couple Families in Smithfield
The poverty statistics for married-couple families in Smithfield show that 20.5% or 8 of the total 39 families live below the poverty line. Families with 1 or 2 children have the highest poverty rate of 53.3%, comprising of 8 families. On the other hand, families with no children have the lowest poverty rate of 0.0%, which includes 0 families.
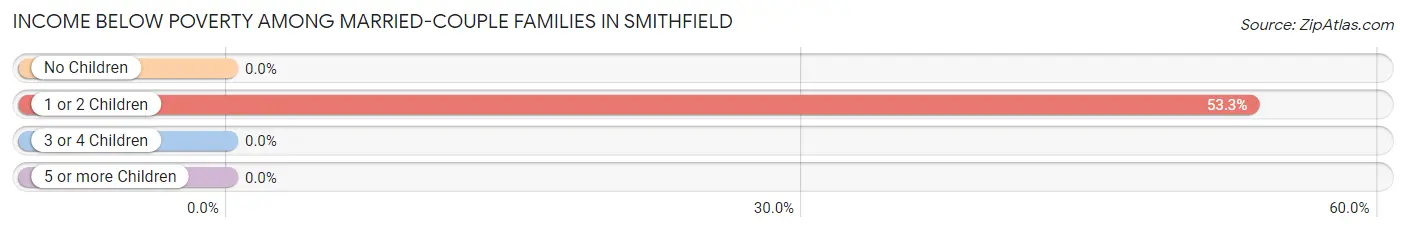
| Children | Above Poverty | Below Poverty |
| No Children | 24 (100.0%) | 0 (0.0%) |
| 1 or 2 Children | 7 (46.7%) | 8 (53.3%) |
| 3 or 4 Children | 0 (0.0%) | 0 (0.0%) |
| 5 or more Children | 0 (0.0%) | 0 (0.0%) |
| Total | 31 (79.5%) | 8 (20.5%) |
Income Below Poverty Among Single-Parent Households in Smithfield
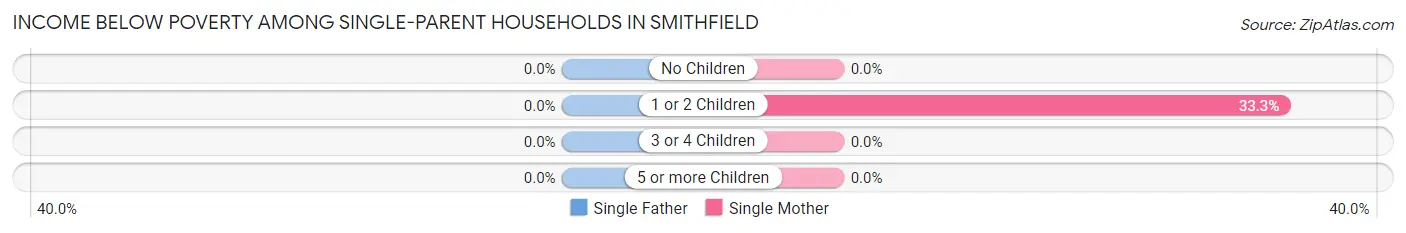
| Children | Single Father | Single Mother |
| No Children | 0 (0.0%) | 0 (0.0%) |
| 1 or 2 Children | 0 (0.0%) | 2 (33.3%) |
| 3 or 4 Children | 0 (0.0%) | 0 (0.0%) |
| 5 or more Children | 0 (0.0%) | 0 (0.0%) |
| Total | 0 (0.0%) | 2 (22.2%) |
Income Below Poverty Among Married-Couple vs Single-Parent Households in Smithfield
The poverty data for Smithfield shows that 8 of the married-couple family households (20.5%) and 2 of the single-parent households (22.2%) are living below the poverty level. Within the married-couple family households, those with 1 or 2 children have the highest poverty rate, with 8 households (53.3%) falling below the poverty line. Among the single-parent households, those with 1 or 2 children have the highest poverty rate, with 2 household (33.3%) living below poverty.
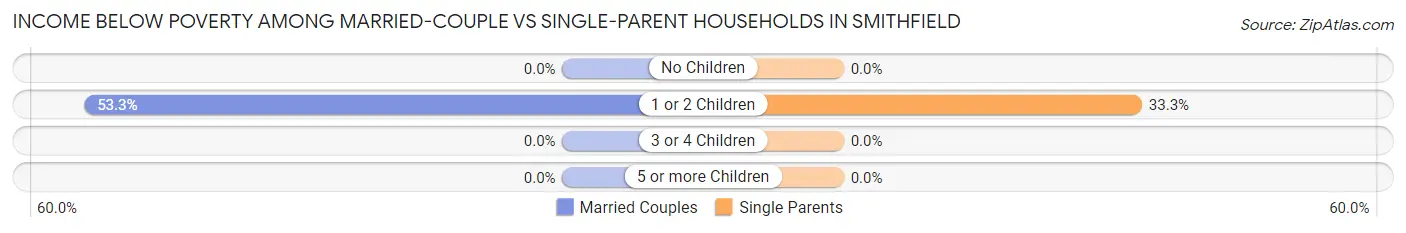
| Children | Married-Couple Families | Single-Parent Households |
| No Children | 0 (0.0%) | 0 (0.0%) |
| 1 or 2 Children | 8 (53.3%) | 2 (33.3%) |
| 3 or 4 Children | 0 (0.0%) | 0 (0.0%) |
| 5 or more Children | 0 (0.0%) | 0 (0.0%) |
| Total | 8 (20.5%) | 2 (22.2%) |
Race in Smithfield
The most populous races in Smithfield are White / Caucasian (173 | 93.0%), Hispanic or Latino (10 | 5.4%), and Two or more Races (9 | 4.8%).
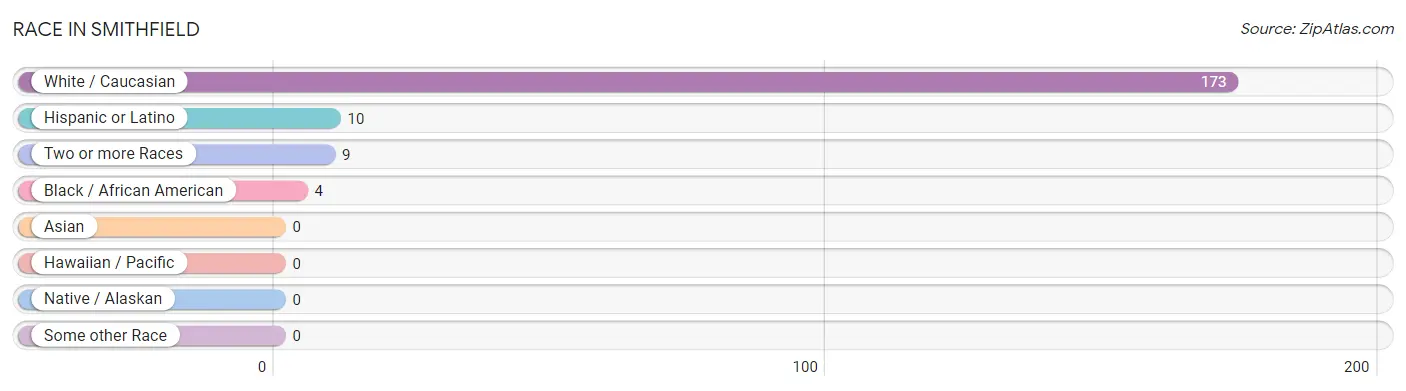
| Race | # Population | % Population |
| Asian | 0 | 0.0% |
| Black / African American | 4 | 2.1% |
| Hawaiian / Pacific | 0 | 0.0% |
| Hispanic or Latino | 10 | 5.4% |
| Native / Alaskan | 0 | 0.0% |
| White / Caucasian | 173 | 93.0% |
| Two or more Races | 9 | 4.8% |
| Some other Race | 0 | 0.0% |
| Total | 186 | 100.0% |
Ancestry in Smithfield
The most populous ancestries reported in Smithfield are German (18 | 9.7%), Italian (14 | 7.5%), Irish (10 | 5.4%), Mexican (9 | 4.8%), and English (4 | 2.1%), together accounting for 29.6% of all Smithfield residents.
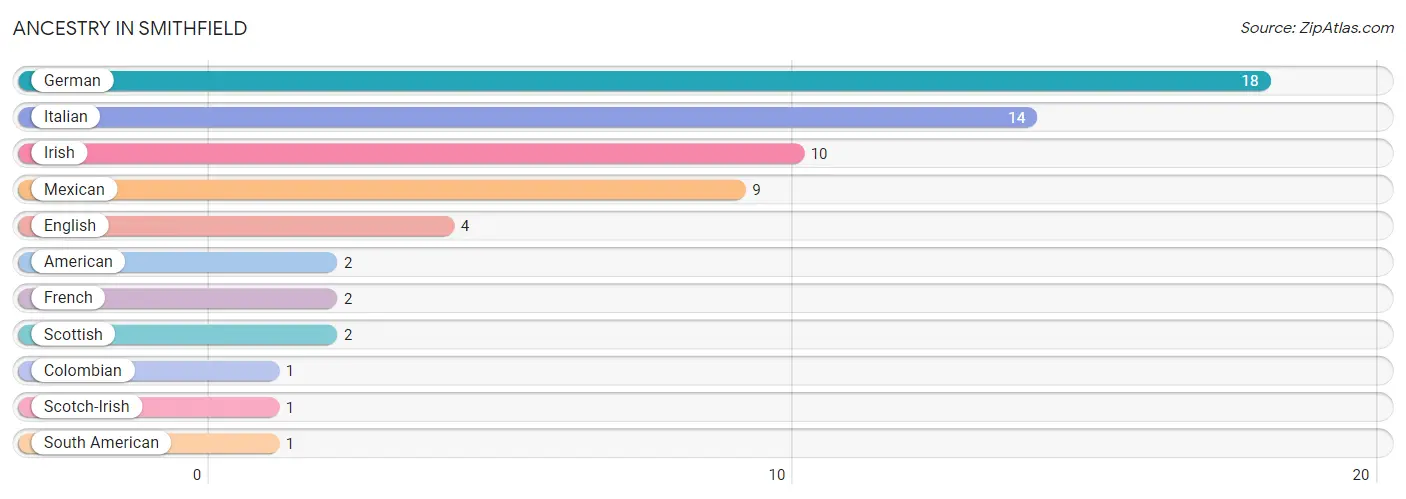
| Ancestry | # Population | % Population |
| American | 2 | 1.1% |
| Colombian | 1 | 0.5% |
| English | 4 | 2.1% |
| French | 2 | 1.1% |
| German | 18 | 9.7% |
| Irish | 10 | 5.4% |
| Italian | 14 | 7.5% |
| Mexican | 9 | 4.8% |
| Scotch-Irish | 1 | 0.5% |
| Scottish | 2 | 1.1% |
| South American | 1 | 0.5% | View All 11 Rows |
Immigrants in Smithfield
The most numerous immigrant groups reported in Smithfield came from Colombia (1 | 0.5%), Latin America (1 | 0.5%), and South America (1 | 0.5%), together accounting for 1.6% of all Smithfield residents.
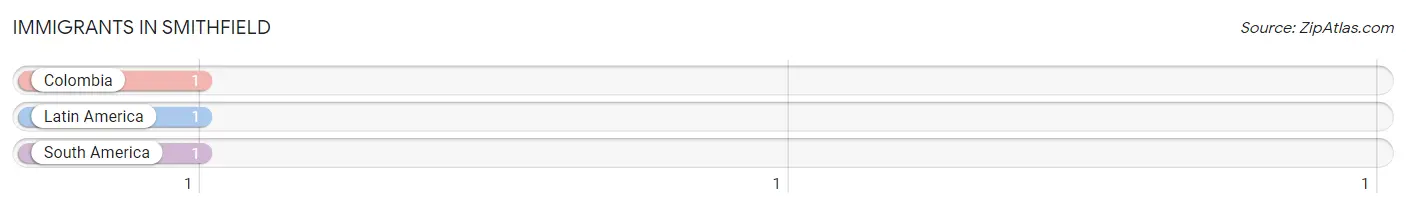
| Immigration Origin | # Population | % Population |
| Colombia | 1 | 0.5% |
| Latin America | 1 | 0.5% |
| South America | 1 | 0.5% | View All 3 Rows |
Sex and Age in Smithfield
Sex and Age in Smithfield
The most populous age groups in Smithfield are 5 to 9 Years (25 | 22.1%) for men and 45 to 49 Years (19 | 26.0%) for women.
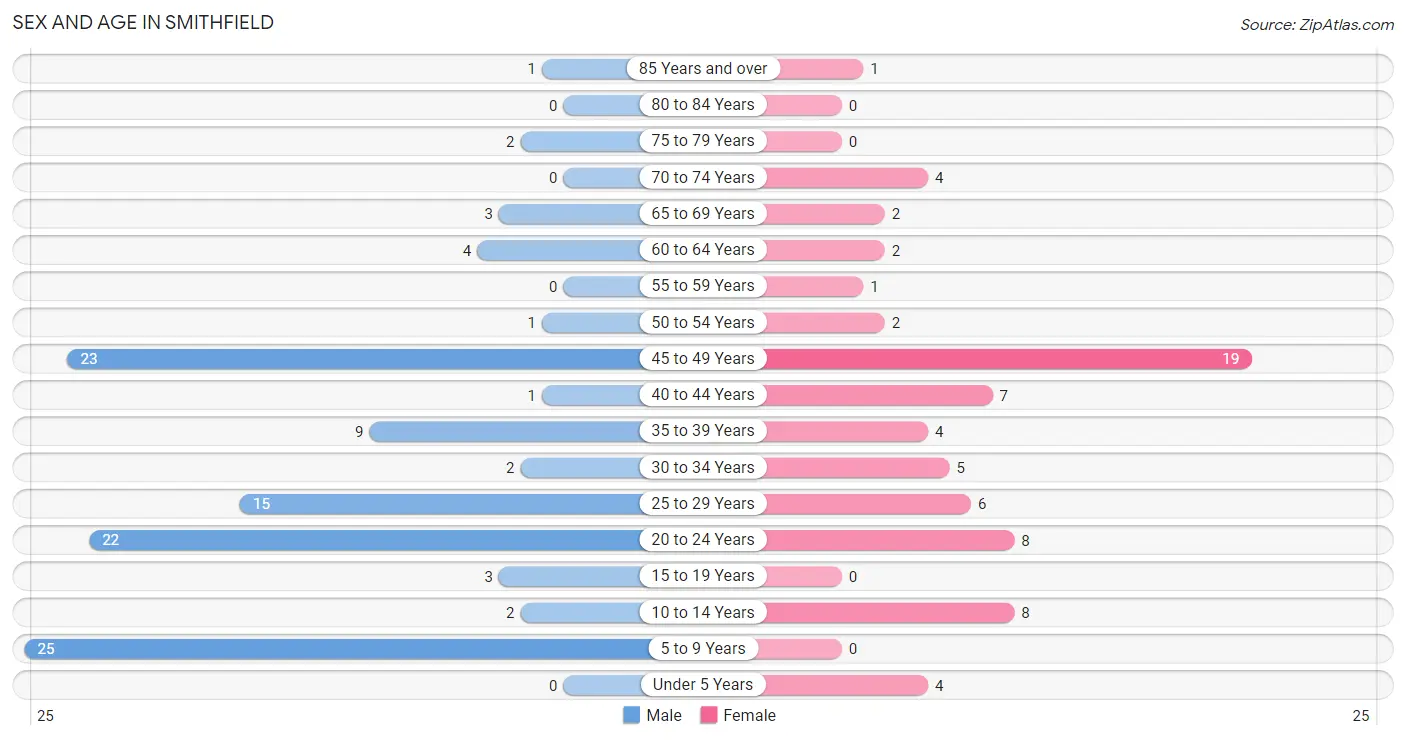
| Age Bracket | Male | Female |
| Under 5 Years | 0 (0.0%) | 4 (5.5%) |
| 5 to 9 Years | 25 (22.1%) | 0 (0.0%) |
| 10 to 14 Years | 2 (1.8%) | 8 (11.0%) |
| 15 to 19 Years | 3 (2.6%) | 0 (0.0%) |
| 20 to 24 Years | 22 (19.5%) | 8 (11.0%) |
| 25 to 29 Years | 15 (13.3%) | 6 (8.2%) |
| 30 to 34 Years | 2 (1.8%) | 5 (6.9%) |
| 35 to 39 Years | 9 (8.0%) | 4 (5.5%) |
| 40 to 44 Years | 1 (0.9%) | 7 (9.6%) |
| 45 to 49 Years | 23 (20.3%) | 19 (26.0%) |
| 50 to 54 Years | 1 (0.9%) | 2 (2.7%) |
| 55 to 59 Years | 0 (0.0%) | 1 (1.4%) |
| 60 to 64 Years | 4 (3.5%) | 2 (2.7%) |
| 65 to 69 Years | 3 (2.6%) | 2 (2.7%) |
| 70 to 74 Years | 0 (0.0%) | 4 (5.5%) |
| 75 to 79 Years | 2 (1.8%) | 0 (0.0%) |
| 80 to 84 Years | 0 (0.0%) | 0 (0.0%) |
| 85 Years and over | 1 (0.9%) | 1 (1.4%) |
| Total | 113 (100.0%) | 73 (100.0%) |
Families and Households in Smithfield
Median Family Size in Smithfield
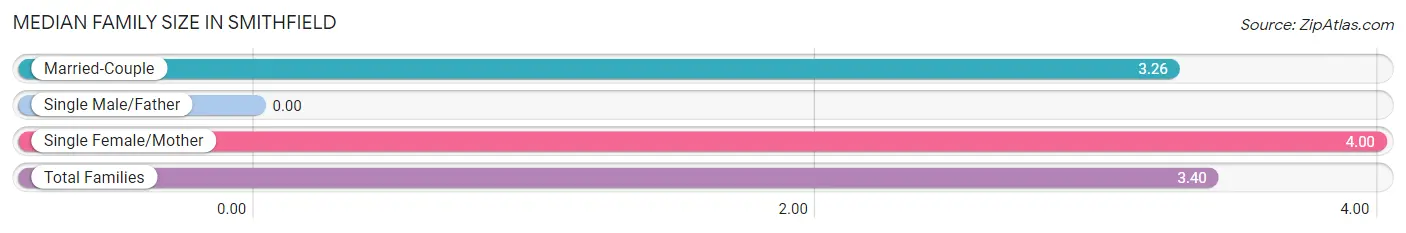
| Family Type | # Families | Family Size |
| Married-Couple | 39 (81.2%) | 3.26 |
| Single Male/Father | 0 (0.0%) | - |
| Single Female/Mother | 9 (18.8%) | 4.00 |
| Total Families | 48 (100.0%) | 3.40 |
Median Household Size in Smithfield
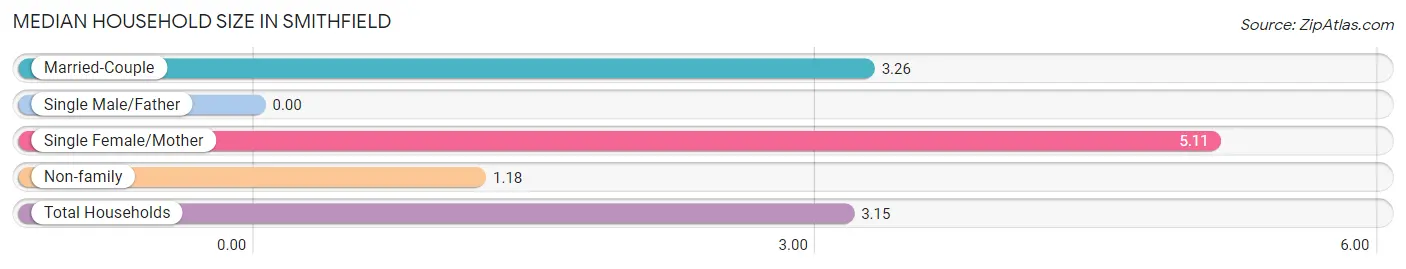
| Household Type | # Households | Household Size |
| Married-Couple | 39 (66.1%) | 3.26 |
| Single Male/Father | 0 (0.0%) | - |
| Single Female/Mother | 9 (15.2%) | 5.11 |
| Non-family | 11 (18.6%) | 1.18 |
| Total Households | 59 (100.0%) | 3.15 |
Household Size by Marriage Status in Smithfield
Out of a total of 59 households in Smithfield, 48 (81.4%) are family households, while 11 (18.6%) are nonfamily households. The most numerous type of family households are 2-person households, comprising 27, and the most common type of nonfamily households are 1-person households, comprising 9.
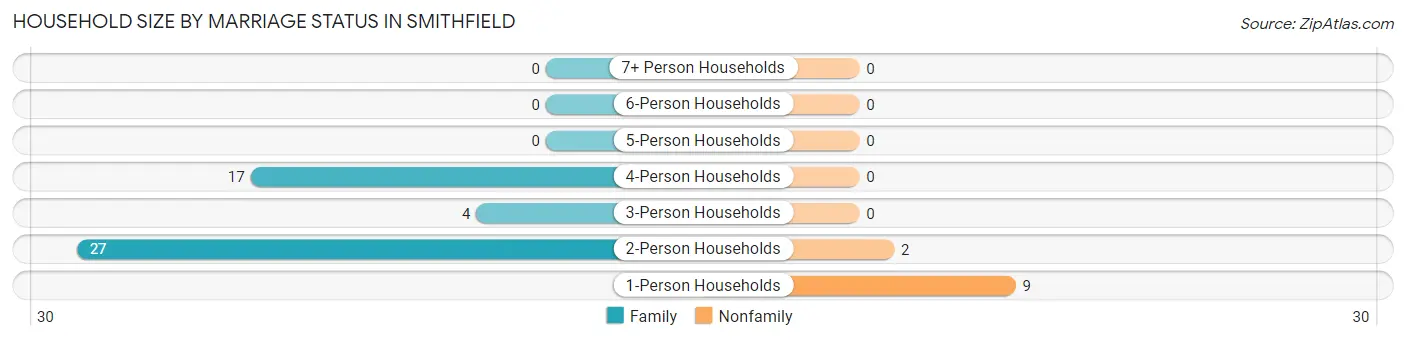
| Household Size | Family Households | Nonfamily Households |
| 1-Person Households | - | 9 (15.2%) |
| 2-Person Households | 27 (45.8%) | 2 (3.4%) |
| 3-Person Households | 4 (6.8%) | 0 (0.0%) |
| 4-Person Households | 17 (28.8%) | 0 (0.0%) |
| 5-Person Households | 0 (0.0%) | 0 (0.0%) |
| 6-Person Households | 0 (0.0%) | 0 (0.0%) |
| 7+ Person Households | 0 (0.0%) | 0 (0.0%) |
| Total | 48 (81.4%) | 11 (18.6%) |
Female Fertility in Smithfield
Fertility by Age in Smithfield
| Age Bracket | Women with Births | Births / 1,000 Women |
| 15 to 19 years | 0 (0.0%) | 0.0 |
| 20 to 34 years | 0 (0.0%) | 0.0 |
| 35 to 50 years | 0 (0.0%) | 0.0 |
| Total | 0 (0.0%) | 0.0 |
Fertility by Age by Marriage Status in Smithfield
| Age Bracket | Married | Unmarried |
| 15 to 19 years | 0 (0.0%) | 0 (0.0%) |
| 20 to 34 years | 0 (0.0%) | 0 (0.0%) |
| 35 to 50 years | 0 (0.0%) | 0 (0.0%) |
| Total | 0 (0.0%) | 0 (0.0%) |
Fertility by Education in Smithfield
| Educational Attainment | Women with Births | Births / 1,000 Women |
| Less than High School | 0 (0.0%) | 0.0 |
| High School Diploma | 0 (0.0%) | 0.0 |
| College or Associate's Degree | 0 (0.0%) | 0.0 |
| Bachelor's Degree | 0 (0.0%) | 0.0 |
| Graduate Degree | 0 (0.0%) | 0.0 |
| Total | 0 (0.0%) | 0.0 |
Fertility by Education by Marriage Status in Smithfield
| Educational Attainment | Married | Unmarried |
| Less than High School | 0 (0.0%) | 0 (0.0%) |
| High School Diploma | 0 (0.0%) | 0 (0.0%) |
| College or Associate's Degree | 0 (0.0%) | 0 (0.0%) |
| Bachelor's Degree | 0 (0.0%) | 0 (0.0%) |
| Graduate Degree | 0 (0.0%) | 0 (0.0%) |
| Total | 0 (0.0%) | 0 (0.0%) |
Employment Characteristics in Smithfield
Employment by Class of Employer in Smithfield
Among the 118 employed individuals in Smithfield, private company employees (90 | 76.3%), self-employed (not incorporated) (8 | 6.8%), and local government employees (8 | 6.8%) make up the most common classes of employment.
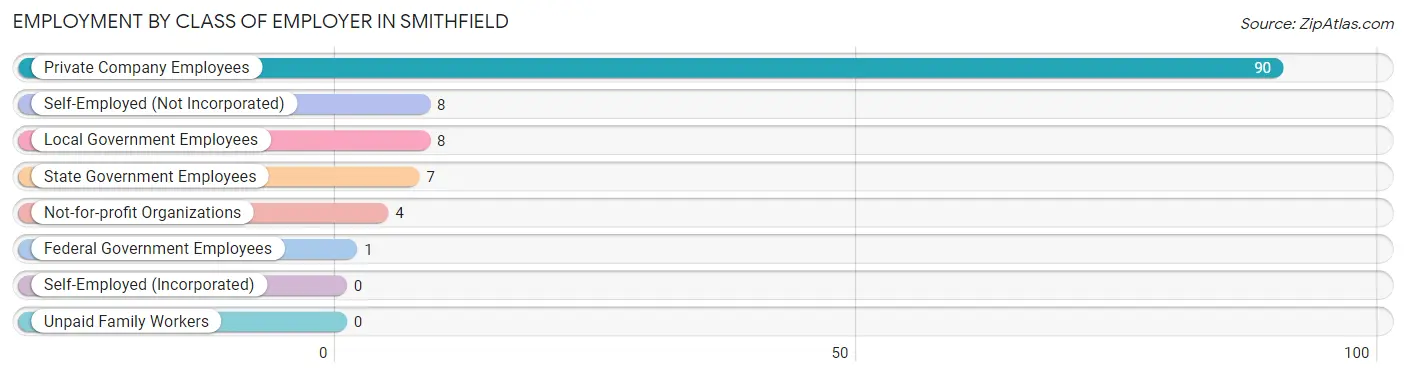
| Employer Class | # Employees | % Employees |
| Private Company Employees | 90 | 76.3% |
| Self-Employed (Incorporated) | 0 | 0.0% |
| Self-Employed (Not Incorporated) | 8 | 6.8% |
| Not-for-profit Organizations | 4 | 3.4% |
| Local Government Employees | 8 | 6.8% |
| State Government Employees | 7 | 5.9% |
| Federal Government Employees | 1 | 0.9% |
| Unpaid Family Workers | 0 | 0.0% |
| Total | 118 | 100.0% |
Employment Status by Age in Smithfield
According to the labor force statistics for Smithfield, out of the total population over 16 years of age (146), 82.9% or 121 individuals are in the labor force, with 2.5% or 3 of them unemployed. The age group with the highest labor force participation rate is 16 to 19 years, with 100.0% or 2 individuals in the labor force. Within the labor force, the 25 to 29 years age range has the highest percentage of unemployed individuals, with 20.0% or 3 of them being unemployed.
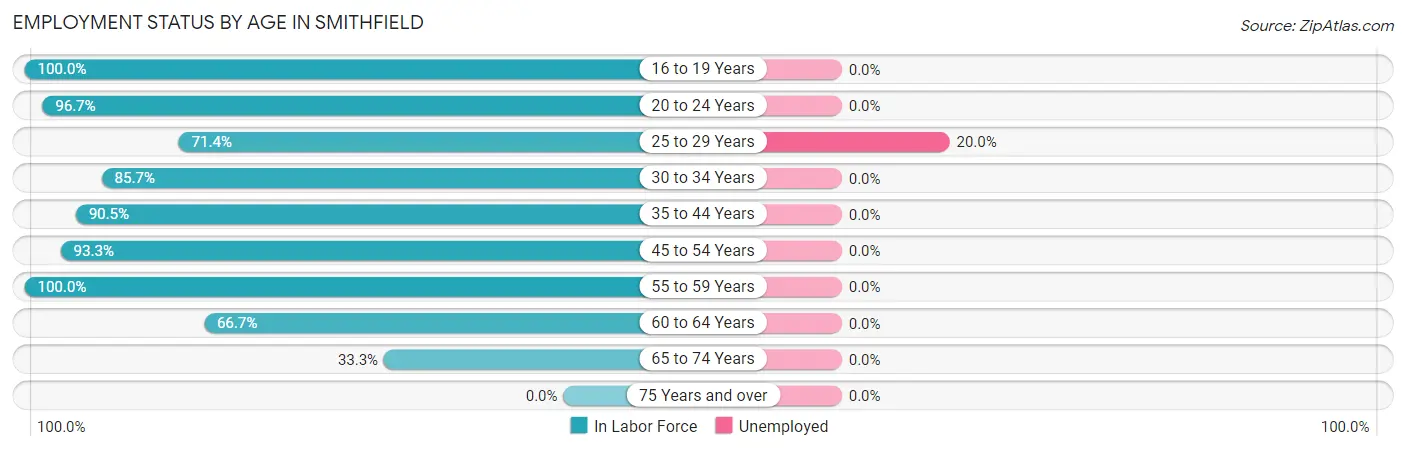
| Age Bracket | In Labor Force | Unemployed |
| 16 to 19 Years | 2 (100.0%) | 0 (0.0%) |
| 20 to 24 Years | 29 (96.7%) | 0 (0.0%) |
| 25 to 29 Years | 15 (71.4%) | 3 (20.0%) |
| 30 to 34 Years | 6 (85.7%) | 0 (0.0%) |
| 35 to 44 Years | 19 (90.5%) | 0 (0.0%) |
| 45 to 54 Years | 42 (93.3%) | 0 (0.0%) |
| 55 to 59 Years | 1 (100.0%) | 0 (0.0%) |
| 60 to 64 Years | 4 (66.7%) | 0 (0.0%) |
| 65 to 74 Years | 3 (33.3%) | 0 (0.0%) |
| 75 Years and over | 0 (0.0%) | 0 (0.0%) |
| Total | 121 (82.9%) | 3 (2.5%) |
Employment Status by Educational Attainment in Smithfield
According to labor force statistics for Smithfield, 86.1% of individuals (87) out of the total population between 25 and 64 years of age (101) are in the labor force, with 3.4% or 3 of them being unemployed. The group with the highest labor force participation rate are those with the educational attainment of bachelor's degree or higher, with 100.0% or 2 individuals in the labor force. Within the labor force, individuals with high school diploma education have the highest percentage of unemployment, with 5.5% or 3 of them being unemployed.
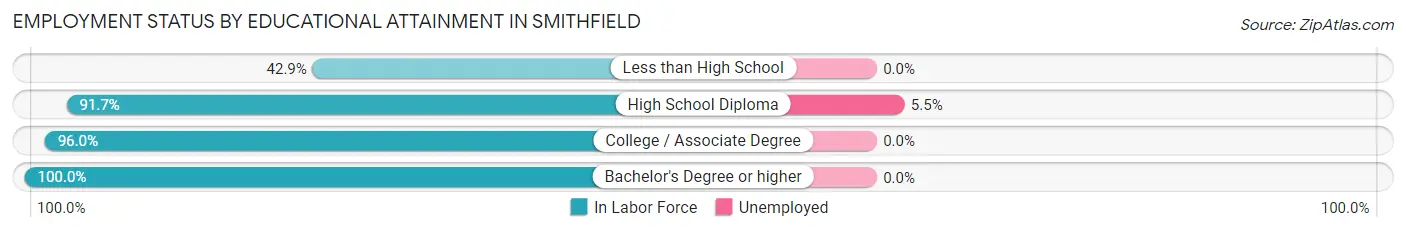
| Educational Attainment | In Labor Force | Unemployed |
| Less than High School | 6 (42.9%) | 0 (0.0%) |
| High School Diploma | 55 (91.7%) | 3 (5.5%) |
| College / Associate Degree | 24 (96.0%) | 0 (0.0%) |
| Bachelor's Degree or higher | 2 (100.0%) | 0 (0.0%) |
| Total | 87 (86.1%) | 3 (3.4%) |
Employment Occupations by Sex in Smithfield
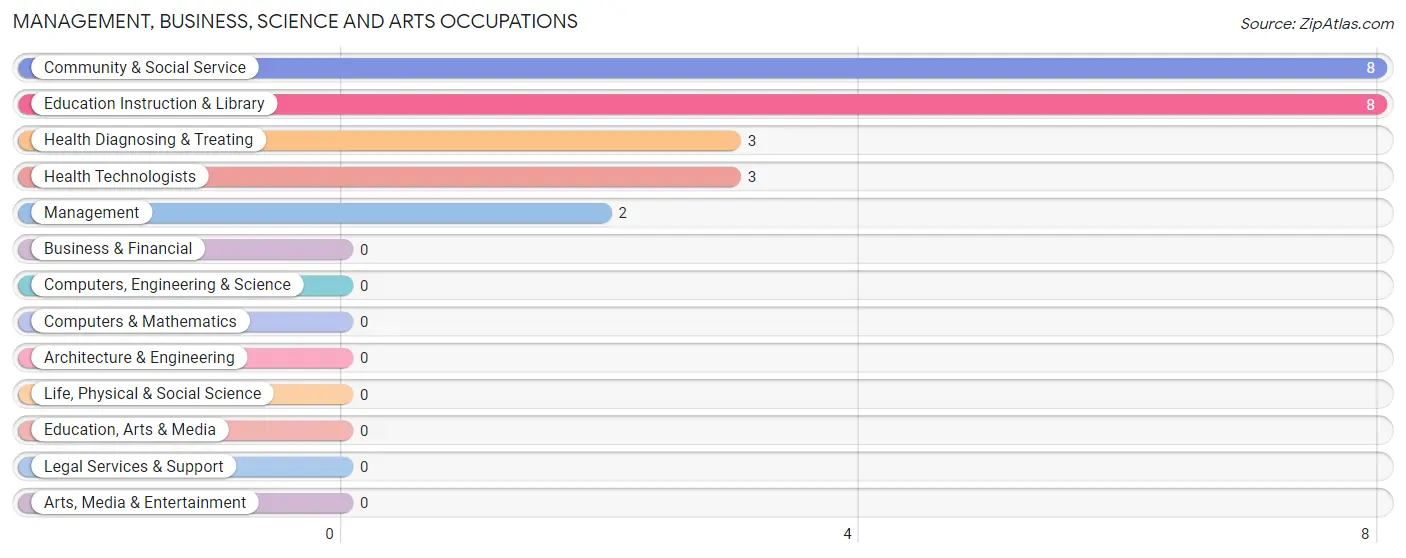
Management, Business, Science and Arts Occupations
The most common Management, Business, Science and Arts occupations in Smithfield are Community & Social Service (8 | 6.8%), Education Instruction & Library (8 | 6.8%), Health Diagnosing & Treating (3 | 2.5%), Health Technologists (3 | 2.5%), and Management (2 | 1.7%).
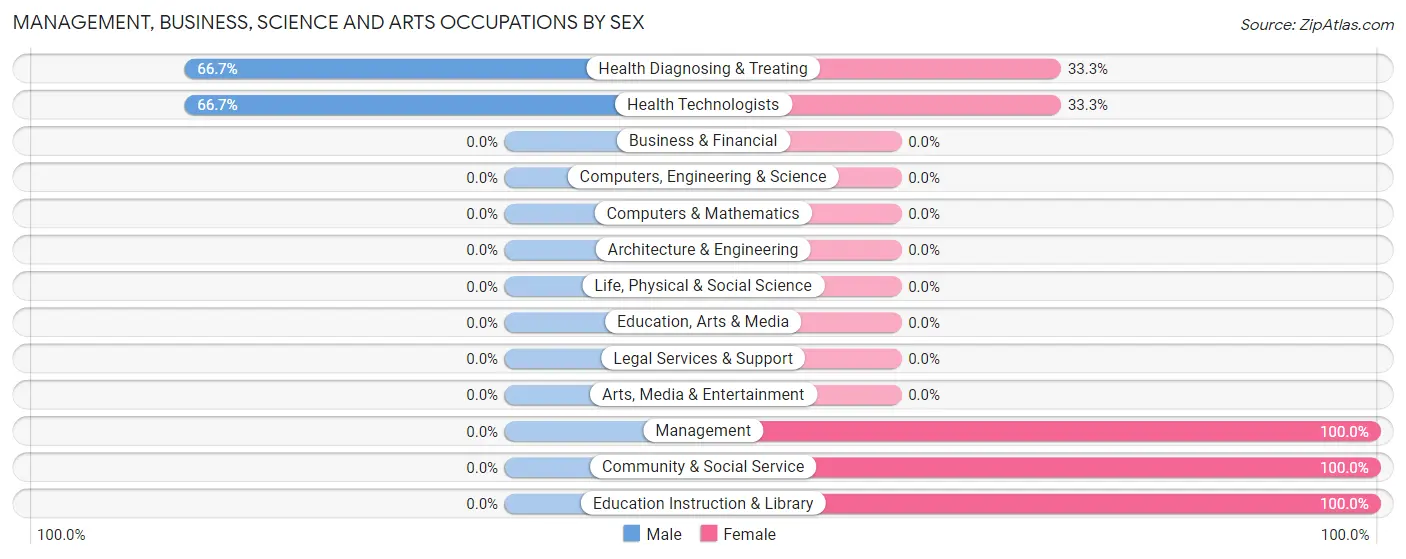
Management, Business, Science and Arts Occupations by Sex
Within the Management, Business, Science and Arts occupations in Smithfield, the most male-oriented occupations are Health Diagnosing & Treating (66.7%), and Health Technologists (66.7%), while the most female-oriented occupations are Management (100.0%), Community & Social Service (100.0%), and Education Instruction & Library (100.0%).
| Occupation | Male | Female |
| Management | 0 (0.0%) | 2 (100.0%) |
| Business & Financial | 0 (0.0%) | 0 (0.0%) |
| Computers, Engineering & Science | 0 (0.0%) | 0 (0.0%) |
| Computers & Mathematics | 0 (0.0%) | 0 (0.0%) |
| Architecture & Engineering | 0 (0.0%) | 0 (0.0%) |
| Life, Physical & Social Science | 0 (0.0%) | 0 (0.0%) |
| Community & Social Service | 0 (0.0%) | 8 (100.0%) |
| Education, Arts & Media | 0 (0.0%) | 0 (0.0%) |
| Legal Services & Support | 0 (0.0%) | 0 (0.0%) |
| Education Instruction & Library | 0 (0.0%) | 8 (100.0%) |
| Arts, Media & Entertainment | 0 (0.0%) | 0 (0.0%) |
| Health Diagnosing & Treating | 2 (66.7%) | 1 (33.3%) |
| Health Technologists | 2 (66.7%) | 1 (33.3%) |
| Total (Category) | 2 (15.4%) | 11 (84.6%) |
| Total (Overall) | 73 (61.9%) | 45 (38.1%) |
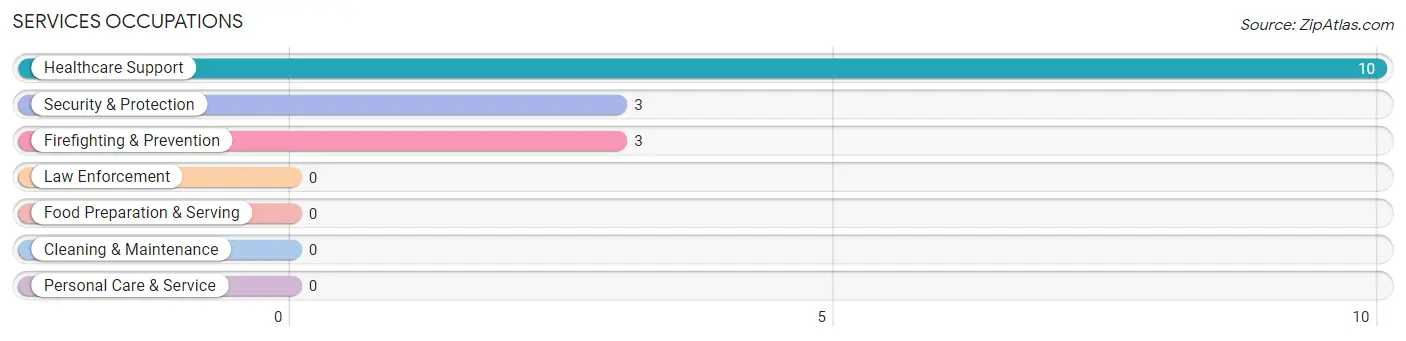
Services Occupations
The most common Services occupations in Smithfield are Healthcare Support (10 | 8.5%), Security & Protection (3 | 2.5%), and Firefighting & Prevention (3 | 2.5%).
Services Occupations by Sex
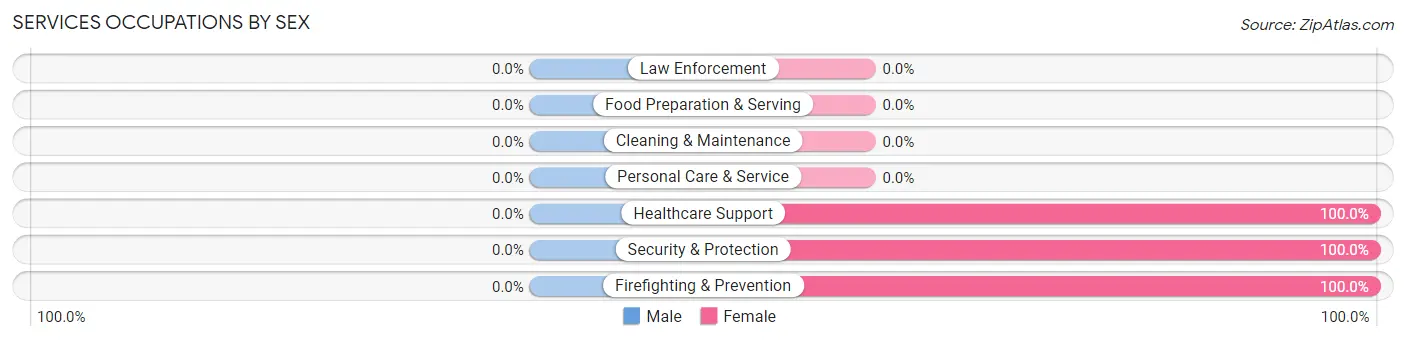
| Occupation | Male | Female |
| Healthcare Support | 0 (0.0%) | 10 (100.0%) |
| Security & Protection | 0 (0.0%) | 3 (100.0%) |
| Firefighting & Prevention | 0 (0.0%) | 3 (100.0%) |
| Law Enforcement | 0 (0.0%) | 0 (0.0%) |
| Food Preparation & Serving | 0 (0.0%) | 0 (0.0%) |
| Cleaning & Maintenance | 0 (0.0%) | 0 (0.0%) |
| Personal Care & Service | 0 (0.0%) | 0 (0.0%) |
| Total (Category) | 0 (0.0%) | 13 (100.0%) |
| Total (Overall) | 73 (61.9%) | 45 (38.1%) |
Sales and Office Occupations
The most common Sales and Office occupations in Smithfield are Office & Administration (8 | 6.8%), and Sales & Related (2 | 1.7%).
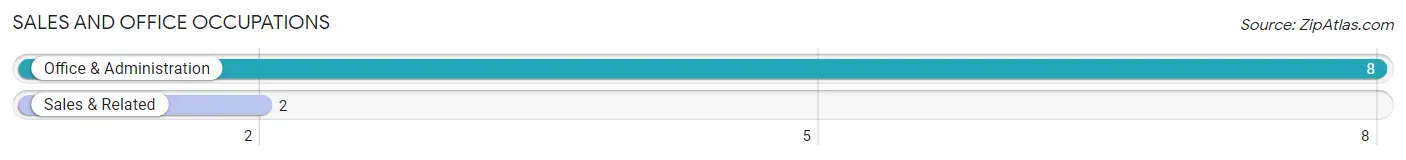
Sales and Office Occupations by Sex
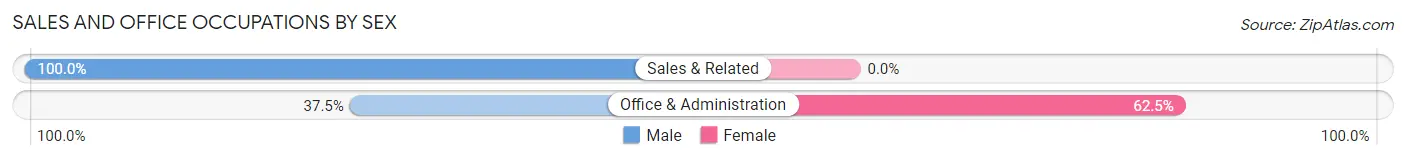
| Occupation | Male | Female |
| Sales & Related | 2 (100.0%) | 0 (0.0%) |
| Office & Administration | 3 (37.5%) | 5 (62.5%) |
| Total (Category) | 5 (50.0%) | 5 (50.0%) |
| Total (Overall) | 73 (61.9%) | 45 (38.1%) |
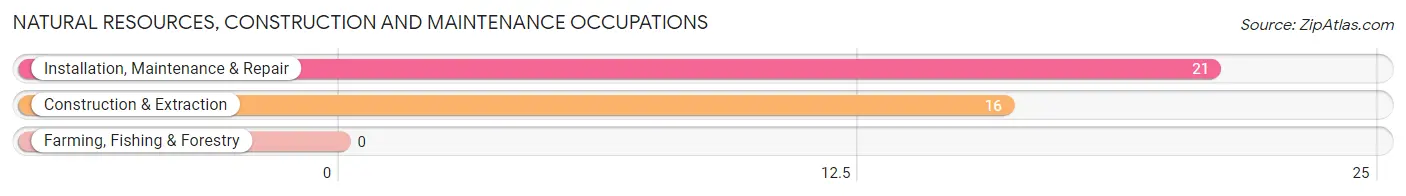
Natural Resources, Construction and Maintenance Occupations
The most common Natural Resources, Construction and Maintenance occupations in Smithfield are Installation, Maintenance & Repair (21 | 17.8%), and Construction & Extraction (16 | 13.6%).
Natural Resources, Construction and Maintenance Occupations by Sex
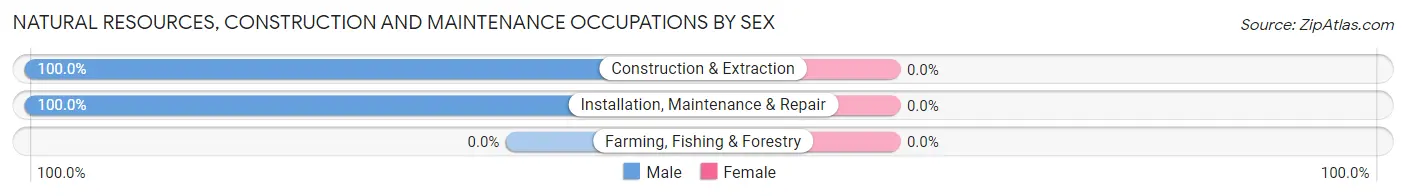
| Occupation | Male | Female |
| Farming, Fishing & Forestry | 0 (0.0%) | 0 (0.0%) |
| Construction & Extraction | 16 (100.0%) | 0 (0.0%) |
| Installation, Maintenance & Repair | 21 (100.0%) | 0 (0.0%) |
| Total (Category) | 37 (100.0%) | 0 (0.0%) |
| Total (Overall) | 73 (61.9%) | 45 (38.1%) |
Production, Transportation and Moving Occupations
The most common Production, Transportation and Moving occupations in Smithfield are Transportation (33 | 28.0%), and Material Moving (12 | 10.2%).
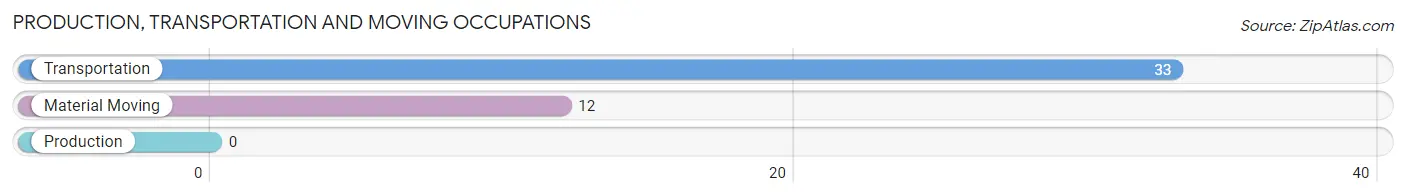
Production, Transportation and Moving Occupations by Sex
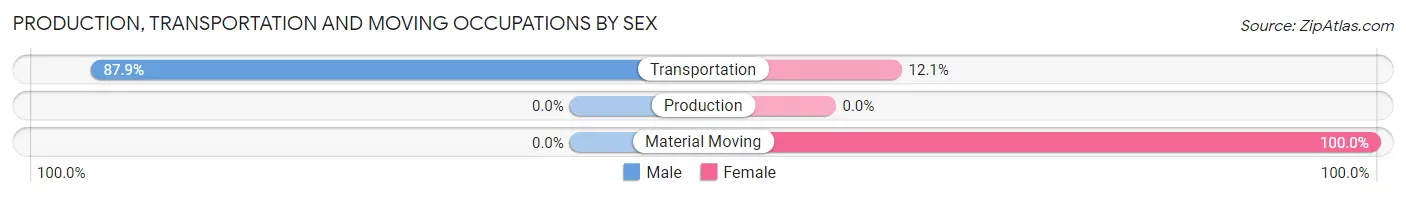
| Occupation | Male | Female |
| Production | 0 (0.0%) | 0 (0.0%) |
| Transportation | 29 (87.9%) | 4 (12.1%) |
| Material Moving | 0 (0.0%) | 12 (100.0%) |
| Total (Category) | 29 (64.4%) | 16 (35.6%) |
| Total (Overall) | 73 (61.9%) | 45 (38.1%) |
Employment Industries by Sex in Smithfield
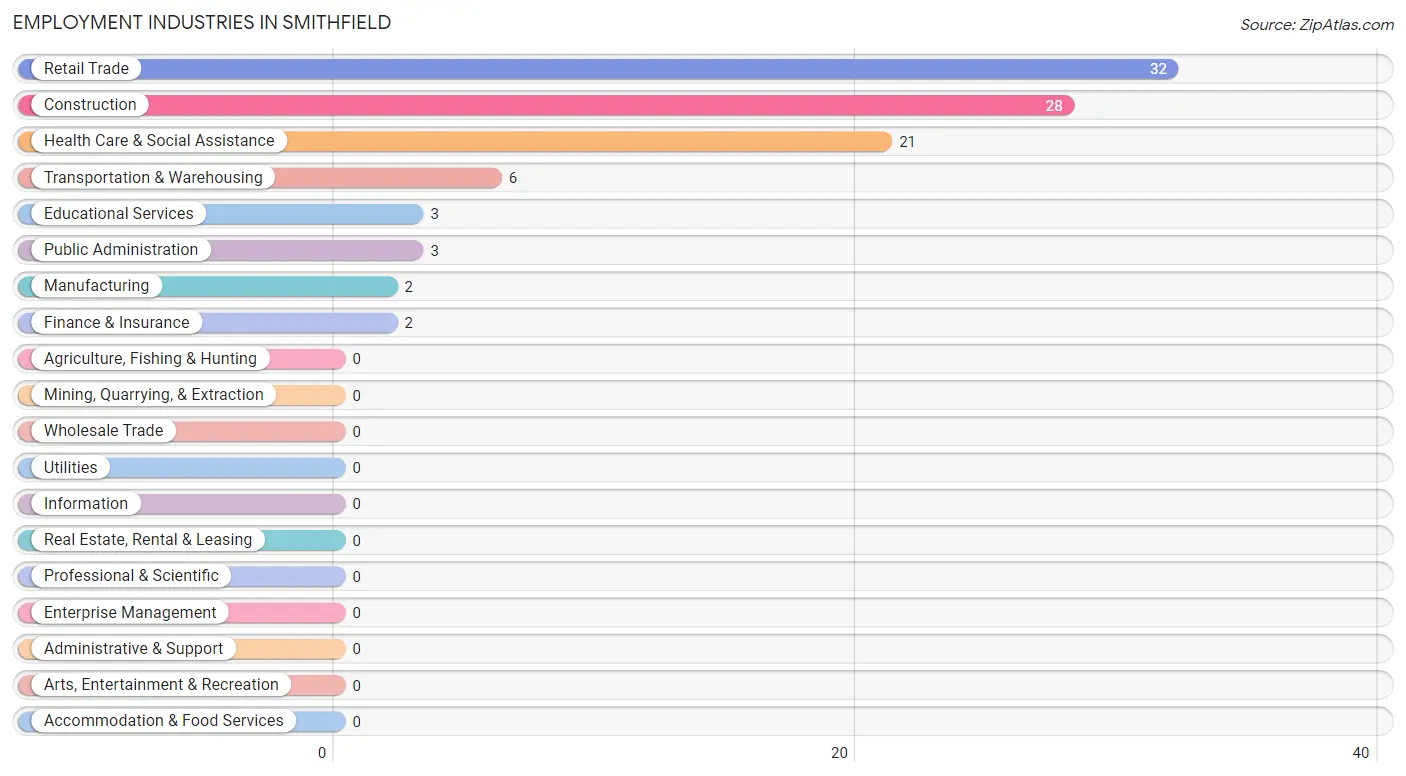
Employment Industries in Smithfield
The major employment industries in Smithfield include Retail Trade (32 | 27.1%), Construction (28 | 23.7%), Health Care & Social Assistance (21 | 17.8%), Transportation & Warehousing (6 | 5.1%), and Educational Services (3 | 2.5%).
Employment Industries by Sex in Smithfield
The Smithfield industries that see more men than women are Manufacturing (100.0%), Construction (85.7%), and Transportation & Warehousing (83.3%), whereas the industries that tend to have a higher number of women are Finance & Insurance (100.0%), Educational Services (100.0%), and Public Administration (100.0%).
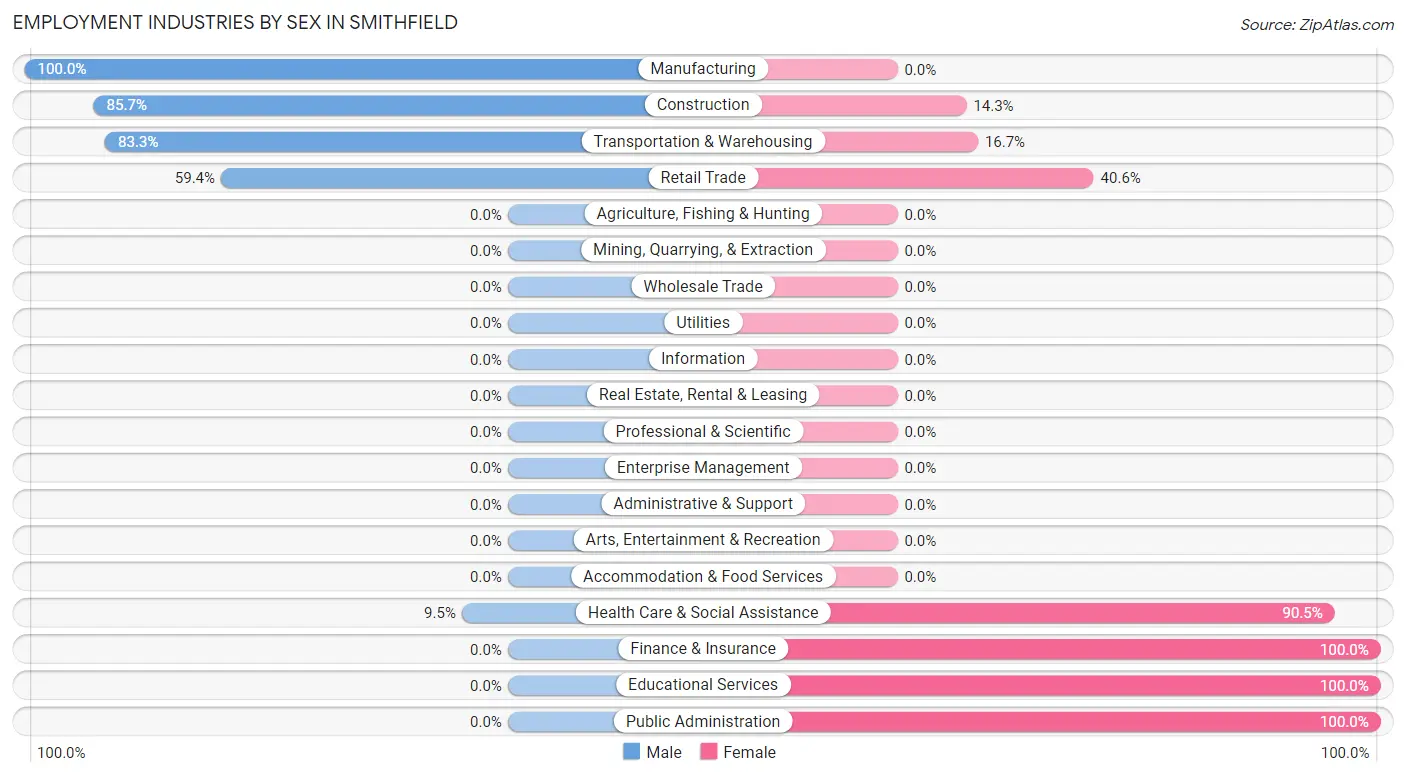
| Industry | Male | Female |
| Agriculture, Fishing & Hunting | 0 (0.0%) | 0 (0.0%) |
| Mining, Quarrying, & Extraction | 0 (0.0%) | 0 (0.0%) |
| Construction | 24 (85.7%) | 4 (14.3%) |
| Manufacturing | 2 (100.0%) | 0 (0.0%) |
| Wholesale Trade | 0 (0.0%) | 0 (0.0%) |
| Retail Trade | 19 (59.4%) | 13 (40.6%) |
| Transportation & Warehousing | 5 (83.3%) | 1 (16.7%) |
| Utilities | 0 (0.0%) | 0 (0.0%) |
| Information | 0 (0.0%) | 0 (0.0%) |
| Finance & Insurance | 0 (0.0%) | 2 (100.0%) |
| Real Estate, Rental & Leasing | 0 (0.0%) | 0 (0.0%) |
| Professional & Scientific | 0 (0.0%) | 0 (0.0%) |
| Enterprise Management | 0 (0.0%) | 0 (0.0%) |
| Administrative & Support | 0 (0.0%) | 0 (0.0%) |
| Educational Services | 0 (0.0%) | 3 (100.0%) |
| Health Care & Social Assistance | 2 (9.5%) | 19 (90.5%) |
| Arts, Entertainment & Recreation | 0 (0.0%) | 0 (0.0%) |
| Accommodation & Food Services | 0 (0.0%) | 0 (0.0%) |
| Public Administration | 0 (0.0%) | 3 (100.0%) |
| Total | 73 (61.9%) | 45 (38.1%) |
Education in Smithfield
School Enrollment in Smithfield
The most common levels of schooling among the 42 students in Smithfield are elementary school (16 | 38.1%), college / undergraduate (9 | 21.4%), and high school (7 | 16.7%).
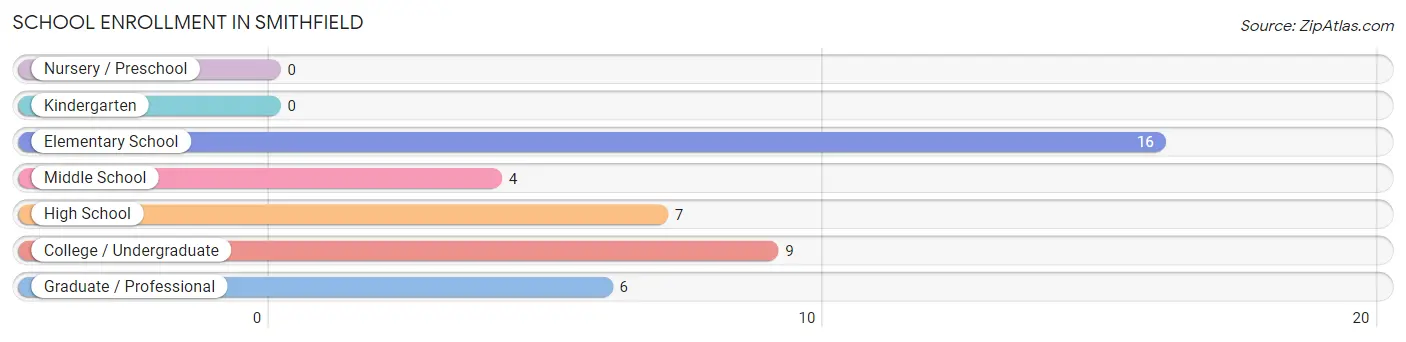
| School Level | # Students | % Students |
| Nursery / Preschool | 0 | 0.0% |
| Kindergarten | 0 | 0.0% |
| Elementary School | 16 | 38.1% |
| Middle School | 4 | 9.5% |
| High School | 7 | 16.7% |
| College / Undergraduate | 9 | 21.4% |
| Graduate / Professional | 6 | 14.3% |
| Total | 42 | 100.0% |
School Enrollment by Age by Funding Source in Smithfield
Out of a total of 42 students who are enrolled in schools in Smithfield, 11 (26.2%) attend a private institution, while the remaining 31 (73.8%) are enrolled in public schools. The age group of 5 to 9 year old has the highest likelihood of being enrolled in private schools, with 11 (68.8% in the age bracket) enrolled. Conversely, the age group of 10 to 14 year olds has the lowest likelihood of being enrolled in a private school, with 10 (100.0% in the age bracket) attending a public institution.
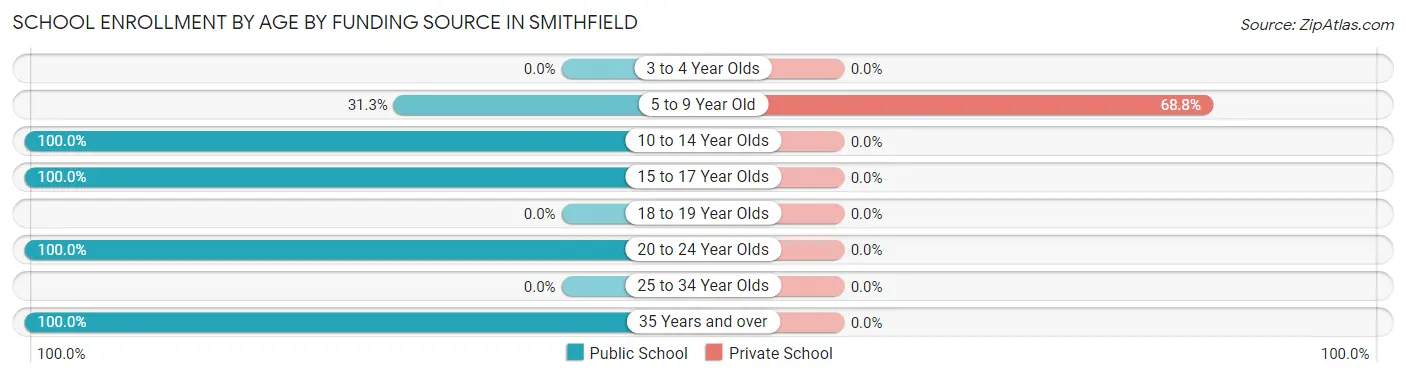
| Age Bracket | Public School | Private School |
| 3 to 4 Year Olds | 0 (0.0%) | 0 (0.0%) |
| 5 to 9 Year Old | 5 (31.2%) | 11 (68.8%) |
| 10 to 14 Year Olds | 10 (100.0%) | 0 (0.0%) |
| 15 to 17 Year Olds | 1 (100.0%) | 0 (0.0%) |
| 18 to 19 Year Olds | 0 (0.0%) | 0 (0.0%) |
| 20 to 24 Year Olds | 14 (100.0%) | 0 (0.0%) |
| 25 to 34 Year Olds | 0 (0.0%) | 0 (0.0%) |
| 35 Years and over | 1 (100.0%) | 0 (0.0%) |
| Total | 31 (73.8%) | 11 (26.2%) |
Educational Attainment by Field of Study in Smithfield
Business (2 | 66.7%), and education (1 | 33.3%) are the most common fields of study among 3 individuals in Smithfield who have obtained a bachelor's degree or higher.
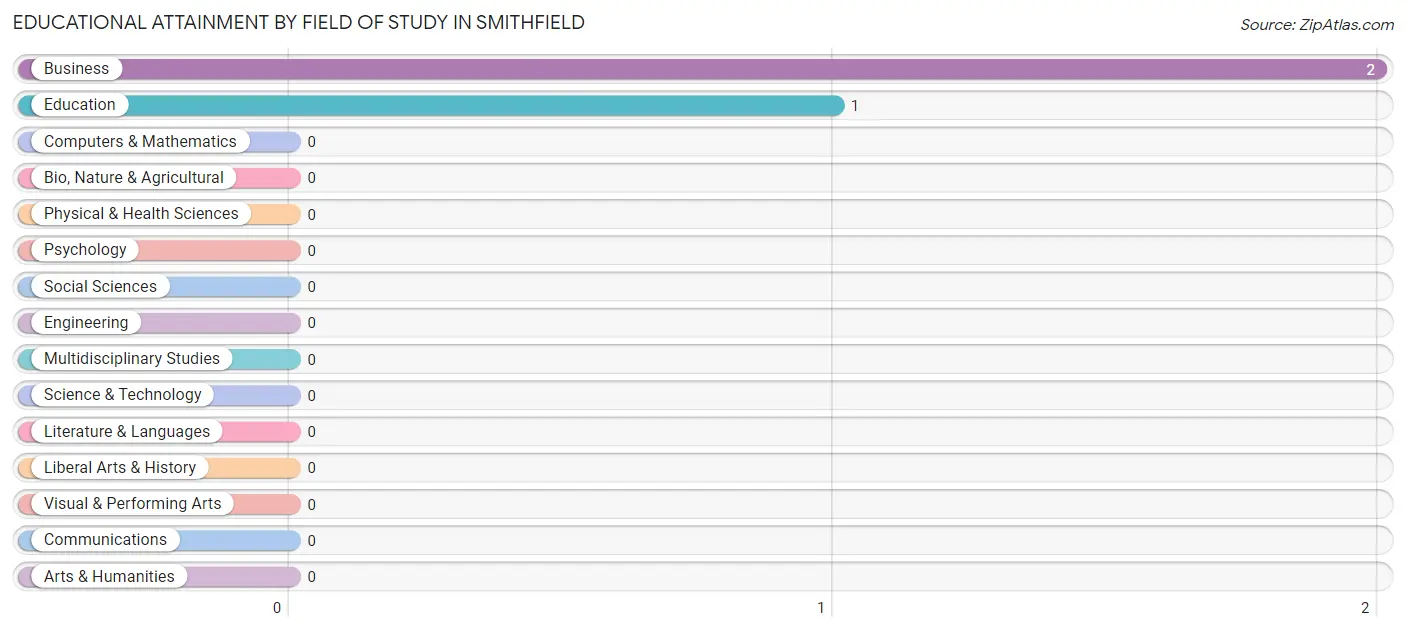
| Field of Study | # Graduates | % Graduates |
| Computers & Mathematics | 0 | 0.0% |
| Bio, Nature & Agricultural | 0 | 0.0% |
| Physical & Health Sciences | 0 | 0.0% |
| Psychology | 0 | 0.0% |
| Social Sciences | 0 | 0.0% |
| Engineering | 0 | 0.0% |
| Multidisciplinary Studies | 0 | 0.0% |
| Science & Technology | 0 | 0.0% |
| Business | 2 | 66.7% |
| Education | 1 | 33.3% |
| Literature & Languages | 0 | 0.0% |
| Liberal Arts & History | 0 | 0.0% |
| Visual & Performing Arts | 0 | 0.0% |
| Communications | 0 | 0.0% |
| Arts & Humanities | 0 | 0.0% |
| Total | 3 | 100.0% |
Transportation & Commute in Smithfield
Vehicle Availability by Sex in Smithfield
The most prevalent vehicle ownership categories in Smithfield are males with 2 vehicles (35, accounting for 47.9%) and females with 2 vehicles (23, making up 77.8%).
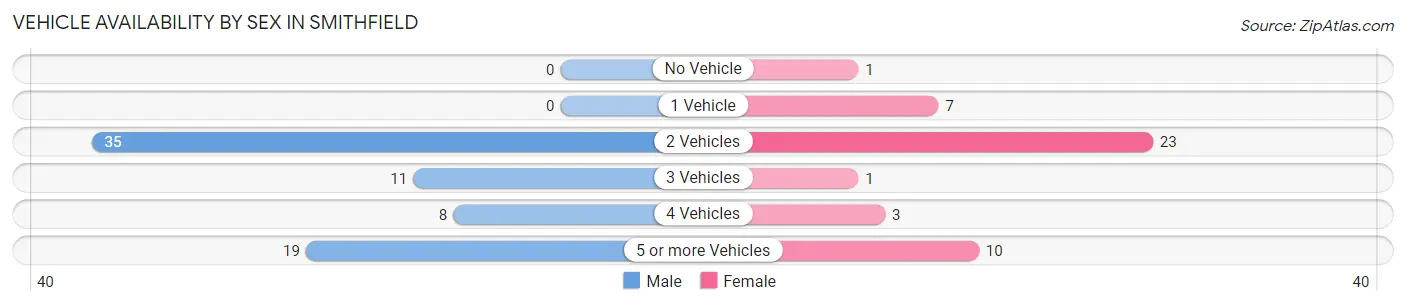
| Vehicles Available | Male | Female |
| No Vehicle | 0 (0.0%) | 1 (2.2%) |
| 1 Vehicle | 0 (0.0%) | 7 (15.6%) |
| 2 Vehicles | 35 (47.9%) | 23 (51.1%) |
| 3 Vehicles | 11 (15.1%) | 1 (2.2%) |
| 4 Vehicles | 8 (11.0%) | 3 (6.7%) |
| 5 or more Vehicles | 19 (26.0%) | 10 (22.2%) |
| Total | 73 (100.0%) | 45 (100.0%) |
Commute Time in Smithfield
The most frequently occuring commute durations in Smithfield are 20 to 24 minutes (38 commuters, 32.2%), 15 to 19 minutes (30 commuters, 25.4%), and 45 to 59 minutes (16 commuters, 13.6%).
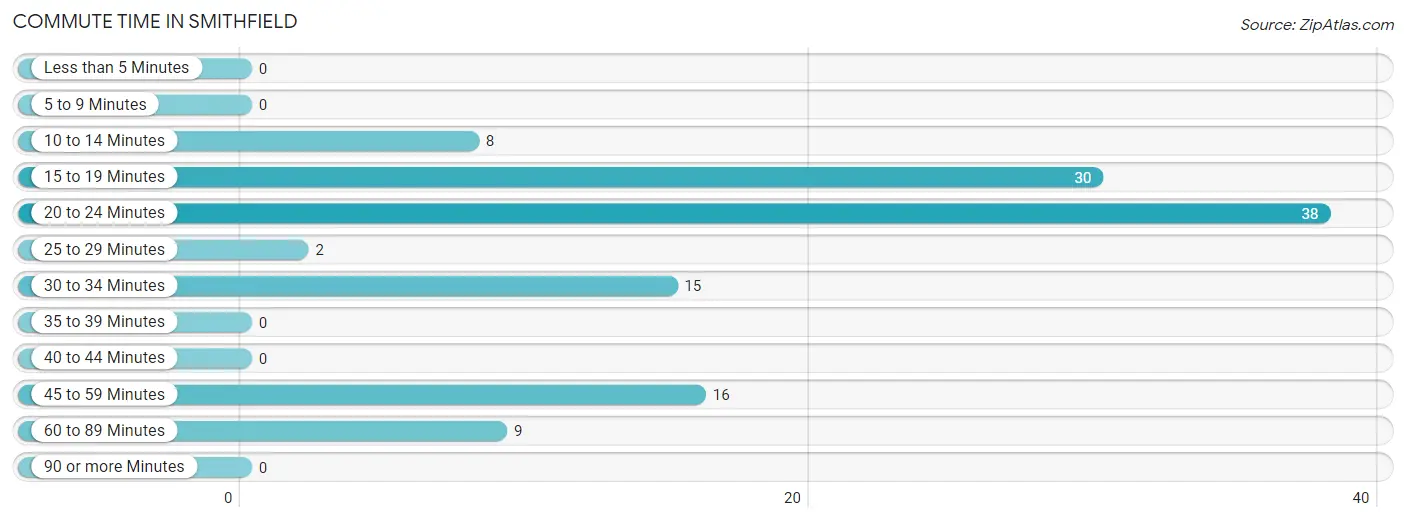
| Commute Time | # Commuters | % Commuters |
| Less than 5 Minutes | 0 | 0.0% |
| 5 to 9 Minutes | 0 | 0.0% |
| 10 to 14 Minutes | 8 | 6.8% |
| 15 to 19 Minutes | 30 | 25.4% |
| 20 to 24 Minutes | 38 | 32.2% |
| 25 to 29 Minutes | 2 | 1.7% |
| 30 to 34 Minutes | 15 | 12.7% |
| 35 to 39 Minutes | 0 | 0.0% |
| 40 to 44 Minutes | 0 | 0.0% |
| 45 to 59 Minutes | 16 | 13.6% |
| 60 to 89 Minutes | 9 | 7.6% |
| 90 or more Minutes | 0 | 0.0% |
Commute Time by Sex in Smithfield
The most common commute times in Smithfield are 20 to 24 minutes (26 commuters, 35.6%) for males and 30 to 34 minutes (15 commuters, 33.3%) for females.
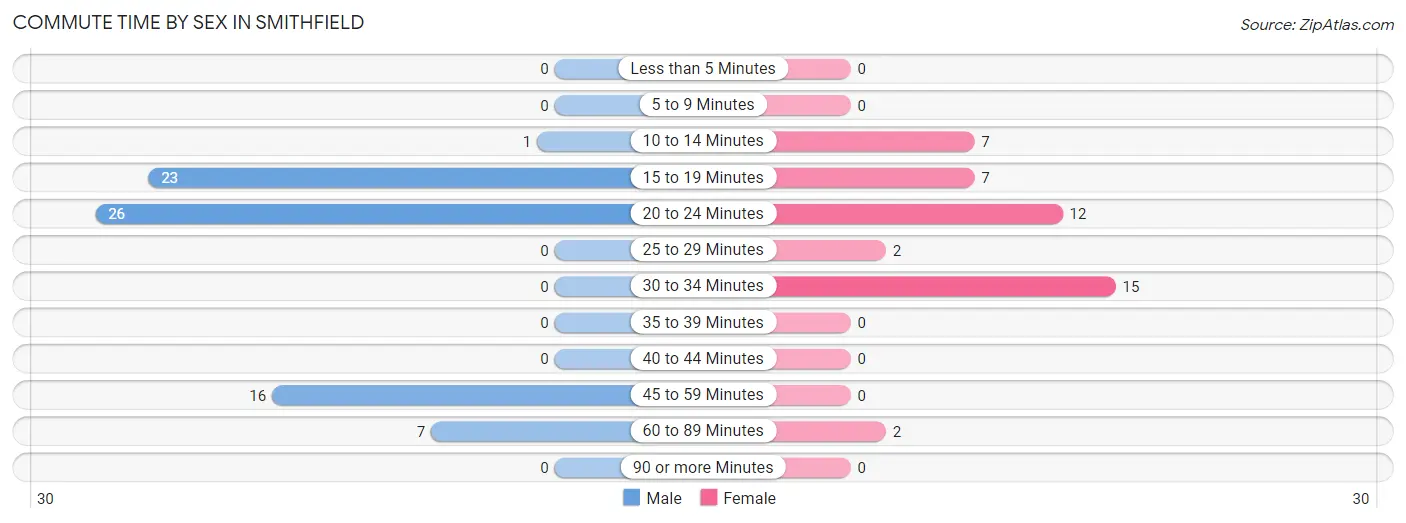
| Commute Time | Male | Female |
| Less than 5 Minutes | 0 (0.0%) | 0 (0.0%) |
| 5 to 9 Minutes | 0 (0.0%) | 0 (0.0%) |
| 10 to 14 Minutes | 1 (1.4%) | 7 (15.6%) |
| 15 to 19 Minutes | 23 (31.5%) | 7 (15.6%) |
| 20 to 24 Minutes | 26 (35.6%) | 12 (26.7%) |
| 25 to 29 Minutes | 0 (0.0%) | 2 (4.4%) |
| 30 to 34 Minutes | 0 (0.0%) | 15 (33.3%) |
| 35 to 39 Minutes | 0 (0.0%) | 0 (0.0%) |
| 40 to 44 Minutes | 0 (0.0%) | 0 (0.0%) |
| 45 to 59 Minutes | 16 (21.9%) | 0 (0.0%) |
| 60 to 89 Minutes | 7 (9.6%) | 2 (4.4%) |
| 90 or more Minutes | 0 (0.0%) | 0 (0.0%) |
Time of Departure to Work by Sex in Smithfield
The most frequent times of departure to work in Smithfield are 8:30 AM to 8:59 AM (21, 28.8%) for males and 4:00 PM to 11:59 PM (14, 31.1%) for females.
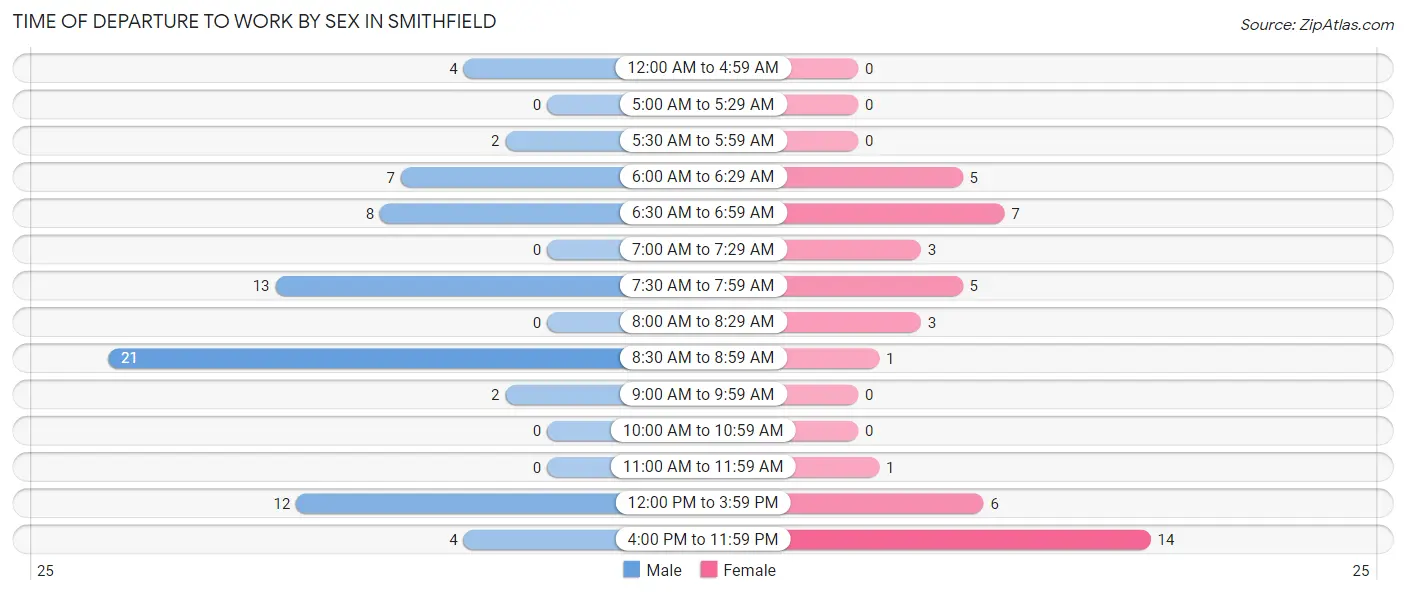
| Time of Departure | Male | Female |
| 12:00 AM to 4:59 AM | 4 (5.5%) | 0 (0.0%) |
| 5:00 AM to 5:29 AM | 0 (0.0%) | 0 (0.0%) |
| 5:30 AM to 5:59 AM | 2 (2.7%) | 0 (0.0%) |
| 6:00 AM to 6:29 AM | 7 (9.6%) | 5 (11.1%) |
| 6:30 AM to 6:59 AM | 8 (11.0%) | 7 (15.6%) |
| 7:00 AM to 7:29 AM | 0 (0.0%) | 3 (6.7%) |
| 7:30 AM to 7:59 AM | 13 (17.8%) | 5 (11.1%) |
| 8:00 AM to 8:29 AM | 0 (0.0%) | 3 (6.7%) |
| 8:30 AM to 8:59 AM | 21 (28.8%) | 1 (2.2%) |
| 9:00 AM to 9:59 AM | 2 (2.7%) | 0 (0.0%) |
| 10:00 AM to 10:59 AM | 0 (0.0%) | 0 (0.0%) |
| 11:00 AM to 11:59 AM | 0 (0.0%) | 1 (2.2%) |
| 12:00 PM to 3:59 PM | 12 (16.4%) | 6 (13.3%) |
| 4:00 PM to 11:59 PM | 4 (5.5%) | 14 (31.1%) |
| Total | 73 (100.0%) | 45 (100.0%) |
Housing Occupancy in Smithfield
Occupancy by Ownership in Smithfield
Of the total 59 dwellings in Smithfield, owner-occupied units account for 29 (49.1%), while renter-occupied units make up 30 (50.8%).
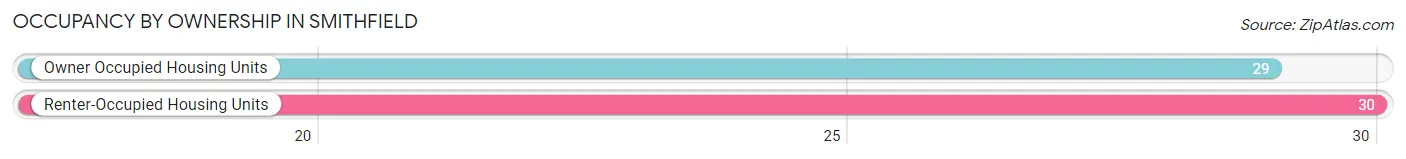
| Occupancy | # Housing Units | % Housing Units |
| Owner Occupied Housing Units | 29 | 49.1% |
| Renter-Occupied Housing Units | 30 | 50.8% |
| Total Occupied Housing Units | 59 | 100.0% |
Occupancy by Household Size in Smithfield
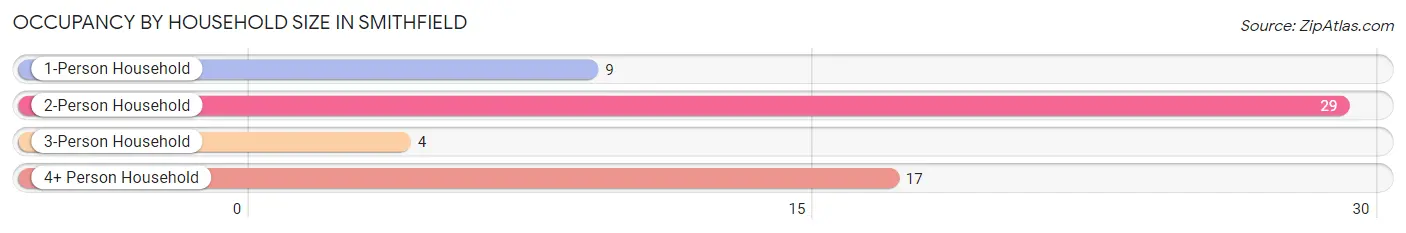
| Household Size | # Housing Units | % Housing Units |
| 1-Person Household | 9 | 15.2% |
| 2-Person Household | 29 | 49.1% |
| 3-Person Household | 4 | 6.8% |
| 4+ Person Household | 17 | 28.8% |
| Total Housing Units | 59 | 100.0% |
Occupancy by Ownership by Household Size in Smithfield
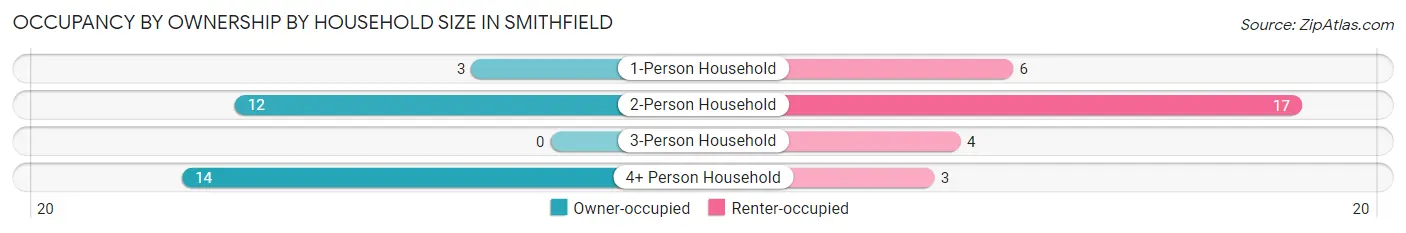
| Household Size | Owner-occupied | Renter-occupied |
| 1-Person Household | 3 (33.3%) | 6 (66.7%) |
| 2-Person Household | 12 (41.4%) | 17 (58.6%) |
| 3-Person Household | 0 (0.0%) | 4 (100.0%) |
| 4+ Person Household | 14 (82.4%) | 3 (17.6%) |
| Total Housing Units | 29 (49.1%) | 30 (50.8%) |
Occupancy by Educational Attainment in Smithfield
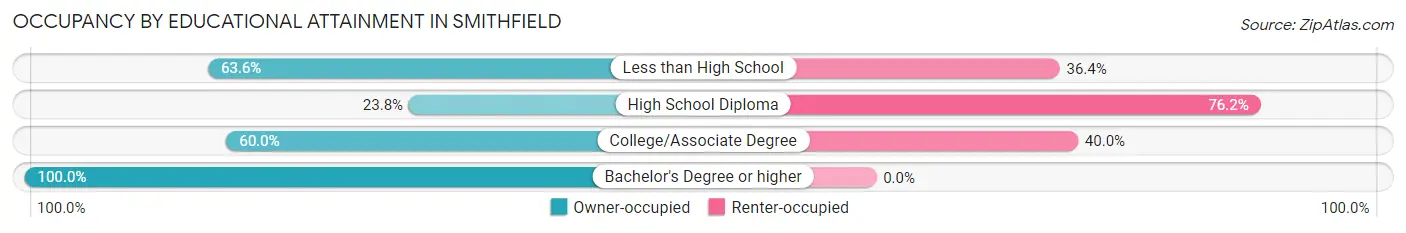
| Household Size | Owner-occupied | Renter-occupied |
| Less than High School | 7 (63.6%) | 4 (36.4%) |
| High School Diploma | 5 (23.8%) | 16 (76.2%) |
| College/Associate Degree | 15 (60.0%) | 10 (40.0%) |
| Bachelor's Degree or higher | 2 (100.0%) | 0 (0.0%) |
Occupancy by Age of Householder in Smithfield
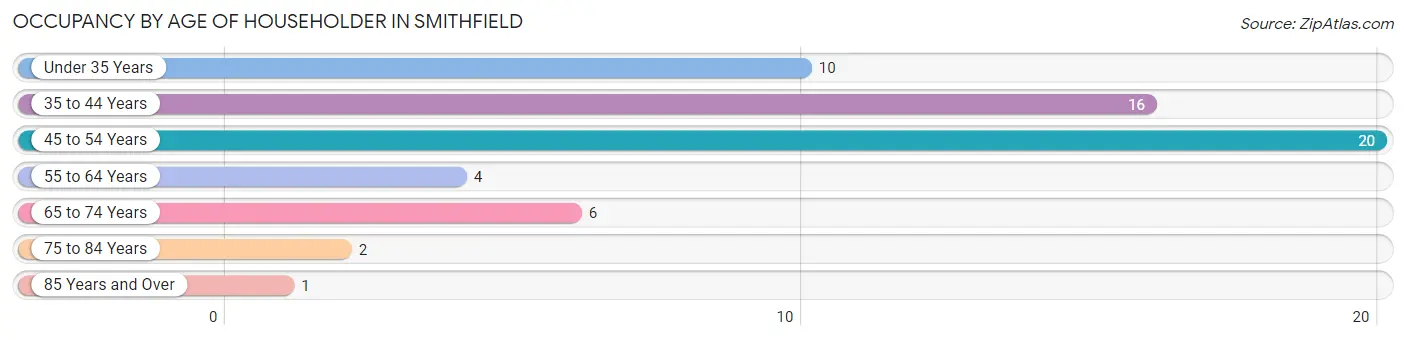
| Age Bracket | # Households | % Households |
| Under 35 Years | 10 | 17.0% |
| 35 to 44 Years | 16 | 27.1% |
| 45 to 54 Years | 20 | 33.9% |
| 55 to 64 Years | 4 | 6.8% |
| 65 to 74 Years | 6 | 10.2% |
| 75 to 84 Years | 2 | 3.4% |
| 85 Years and Over | 1 | 1.7% |
| Total | 59 | 100.0% |
Housing Finances in Smithfield
Median Income by Occupancy in Smithfield
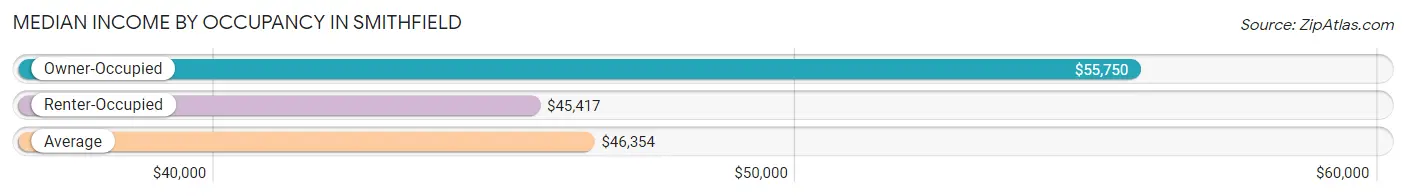
| Occupancy Type | # Households | Median Income |
| Owner-Occupied | 29 (49.1%) | $55,750 |
| Renter-Occupied | 30 (50.8%) | $45,417 |
| Average | 59 (100.0%) | $46,354 |
Occupancy by Householder Income Bracket in Smithfield
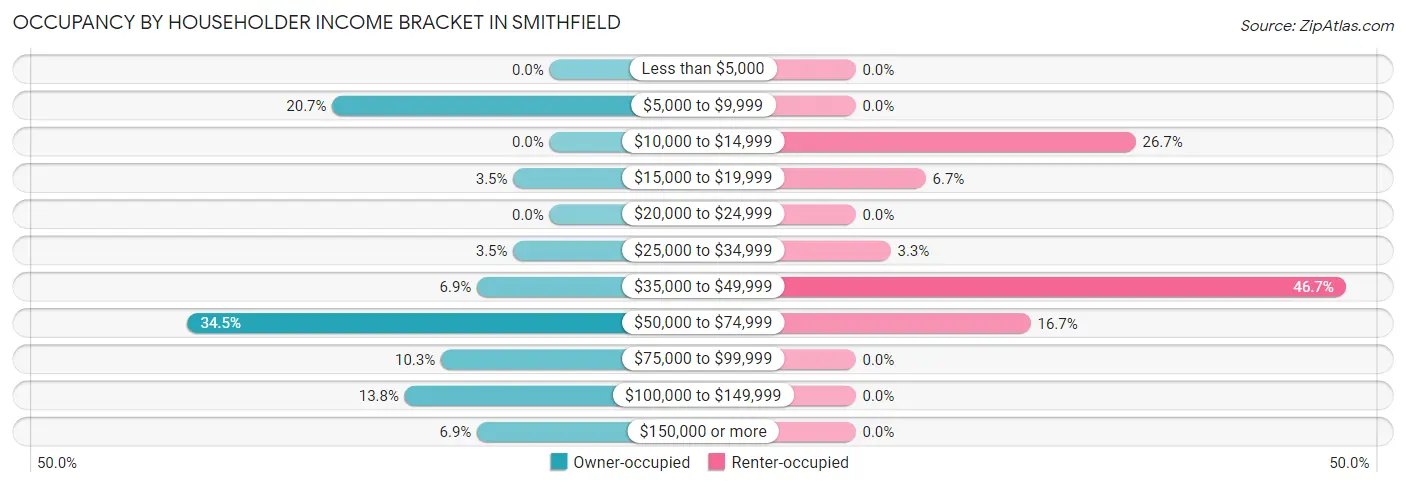
| Income Bracket | Owner-occupied | Renter-occupied |
| Less than $5,000 | 0 (0.0%) | 0 (0.0%) |
| $5,000 to $9,999 | 6 (20.7%) | 0 (0.0%) |
| $10,000 to $14,999 | 0 (0.0%) | 8 (26.7%) |
| $15,000 to $19,999 | 1 (3.5%) | 2 (6.7%) |
| $20,000 to $24,999 | 0 (0.0%) | 0 (0.0%) |
| $25,000 to $34,999 | 1 (3.5%) | 1 (3.3%) |
| $35,000 to $49,999 | 2 (6.9%) | 14 (46.7%) |
| $50,000 to $74,999 | 10 (34.5%) | 5 (16.7%) |
| $75,000 to $99,999 | 3 (10.3%) | 0 (0.0%) |
| $100,000 to $149,999 | 4 (13.8%) | 0 (0.0%) |
| $150,000 or more | 2 (6.9%) | 0 (0.0%) |
| Total | 29 (100.0%) | 30 (100.0%) |
Monthly Housing Cost Tiers in Smithfield
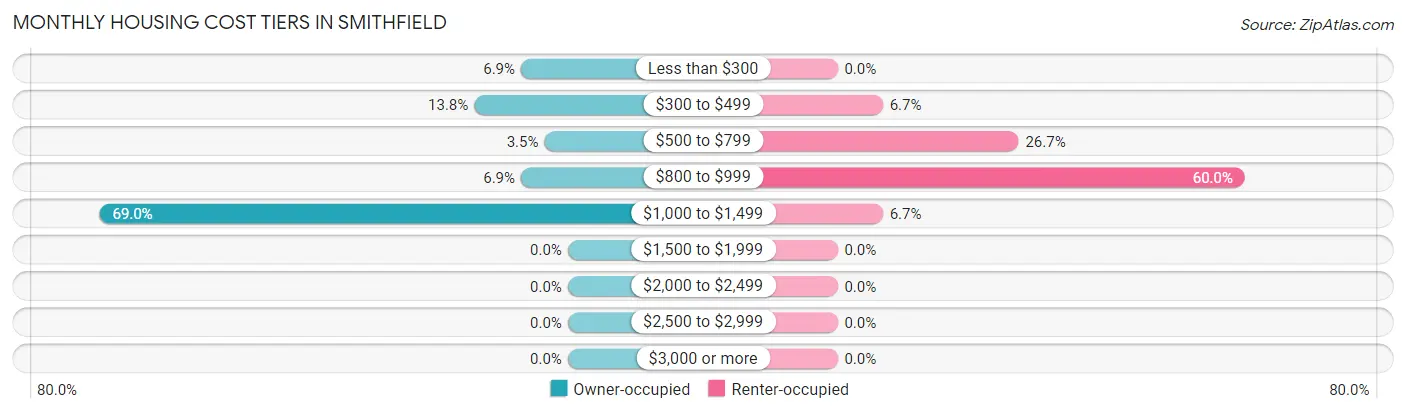
| Monthly Cost | Owner-occupied | Renter-occupied |
| Less than $300 | 2 (6.9%) | 0 (0.0%) |
| $300 to $499 | 4 (13.8%) | 2 (6.7%) |
| $500 to $799 | 1 (3.5%) | 8 (26.7%) |
| $800 to $999 | 2 (6.9%) | 18 (60.0%) |
| $1,000 to $1,499 | 20 (69.0%) | 2 (6.7%) |
| $1,500 to $1,999 | 0 (0.0%) | 0 (0.0%) |
| $2,000 to $2,499 | 0 (0.0%) | 0 (0.0%) |
| $2,500 to $2,999 | 0 (0.0%) | 0 (0.0%) |
| $3,000 or more | 0 (0.0%) | 0 (0.0%) |
| Total | 29 (100.0%) | 30 (100.0%) |
Physical Housing Characteristics in Smithfield
Housing Structures in Smithfield
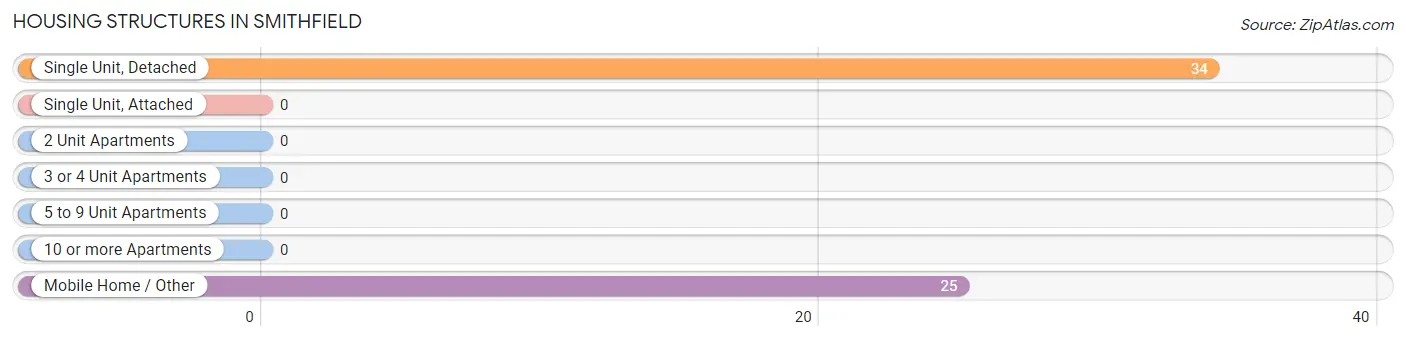
| Structure Type | # Housing Units | % Housing Units |
| Single Unit, Detached | 34 | 57.6% |
| Single Unit, Attached | 0 | 0.0% |
| 2 Unit Apartments | 0 | 0.0% |
| 3 or 4 Unit Apartments | 0 | 0.0% |
| 5 to 9 Unit Apartments | 0 | 0.0% |
| 10 or more Apartments | 0 | 0.0% |
| Mobile Home / Other | 25 | 42.4% |
| Total | 59 | 100.0% |
Housing Structures by Occupancy in Smithfield
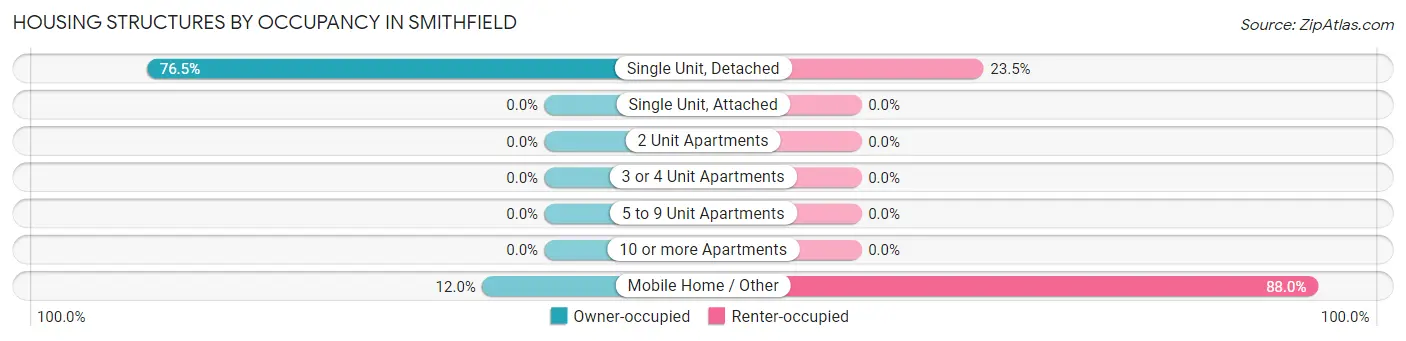
| Structure Type | Owner-occupied | Renter-occupied |
| Single Unit, Detached | 26 (76.5%) | 8 (23.5%) |
| Single Unit, Attached | 0 (0.0%) | 0 (0.0%) |
| 2 Unit Apartments | 0 (0.0%) | 0 (0.0%) |
| 3 or 4 Unit Apartments | 0 (0.0%) | 0 (0.0%) |
| 5 to 9 Unit Apartments | 0 (0.0%) | 0 (0.0%) |
| 10 or more Apartments | 0 (0.0%) | 0 (0.0%) |
| Mobile Home / Other | 3 (12.0%) | 22 (88.0%) |
| Total | 29 (49.1%) | 30 (50.8%) |
Housing Structures by Number of Rooms in Smithfield
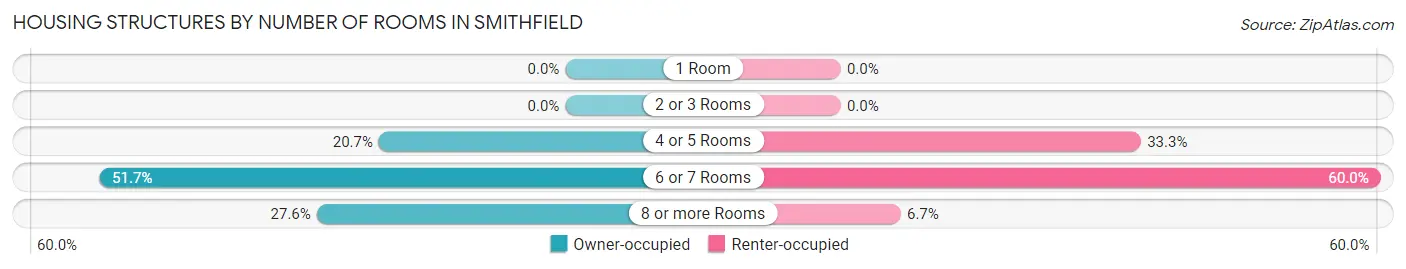
| Number of Rooms | Owner-occupied | Renter-occupied |
| 1 Room | 0 (0.0%) | 0 (0.0%) |
| 2 or 3 Rooms | 0 (0.0%) | 0 (0.0%) |
| 4 or 5 Rooms | 6 (20.7%) | 10 (33.3%) |
| 6 or 7 Rooms | 15 (51.7%) | 18 (60.0%) |
| 8 or more Rooms | 8 (27.6%) | 2 (6.7%) |
| Total | 29 (100.0%) | 30 (100.0%) |
Housing Structure by Heating Type in Smithfield
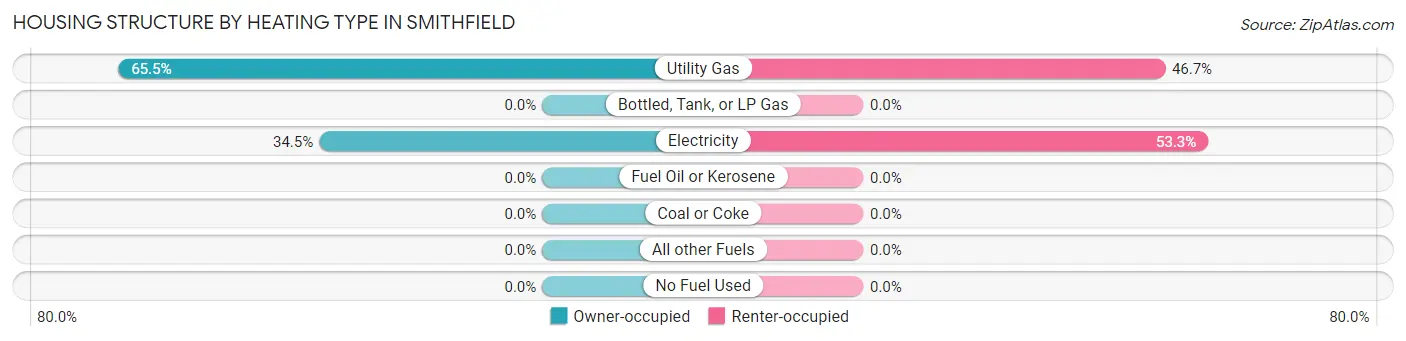
| Heating Type | Owner-occupied | Renter-occupied |
| Utility Gas | 19 (65.5%) | 14 (46.7%) |
| Bottled, Tank, or LP Gas | 0 (0.0%) | 0 (0.0%) |
| Electricity | 10 (34.5%) | 16 (53.3%) |
| Fuel Oil or Kerosene | 0 (0.0%) | 0 (0.0%) |
| Coal or Coke | 0 (0.0%) | 0 (0.0%) |
| All other Fuels | 0 (0.0%) | 0 (0.0%) |
| No Fuel Used | 0 (0.0%) | 0 (0.0%) |
| Total | 29 (100.0%) | 30 (100.0%) |
Household Vehicle Usage in Smithfield
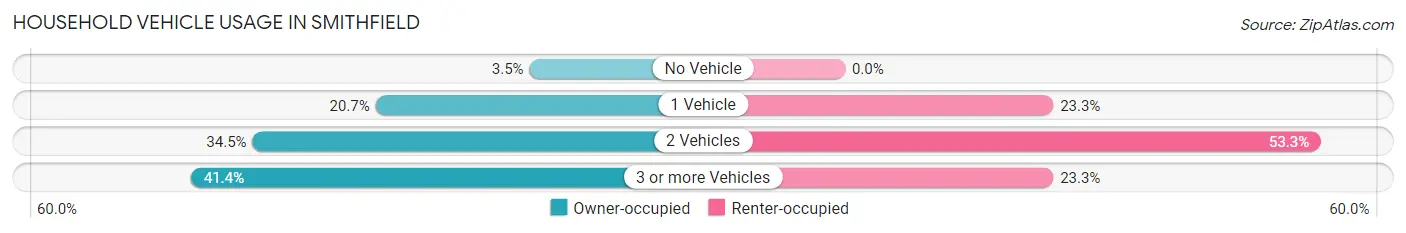
| Vehicles per Household | Owner-occupied | Renter-occupied |
| No Vehicle | 1 (3.5%) | 0 (0.0%) |
| 1 Vehicle | 6 (20.7%) | 7 (23.3%) |
| 2 Vehicles | 10 (34.5%) | 16 (53.3%) |
| 3 or more Vehicles | 12 (41.4%) | 7 (23.3%) |
| Total | 29 (100.0%) | 30 (100.0%) |
Real Estate & Mortgages in Smithfield
Real Estate and Mortgage Overview in Smithfield
| Characteristic | Without Mortgage | With Mortgage |
| Housing Units | 6 | 23 |
| Median Property Value | $137,500 | $151,800 |
| Median Household Income | $57,500 | $2 |
| Monthly Housing Costs | $375 | $0 |
| Real Estate Taxes | $900 | $0 |
Property Value by Mortgage Status in Smithfield
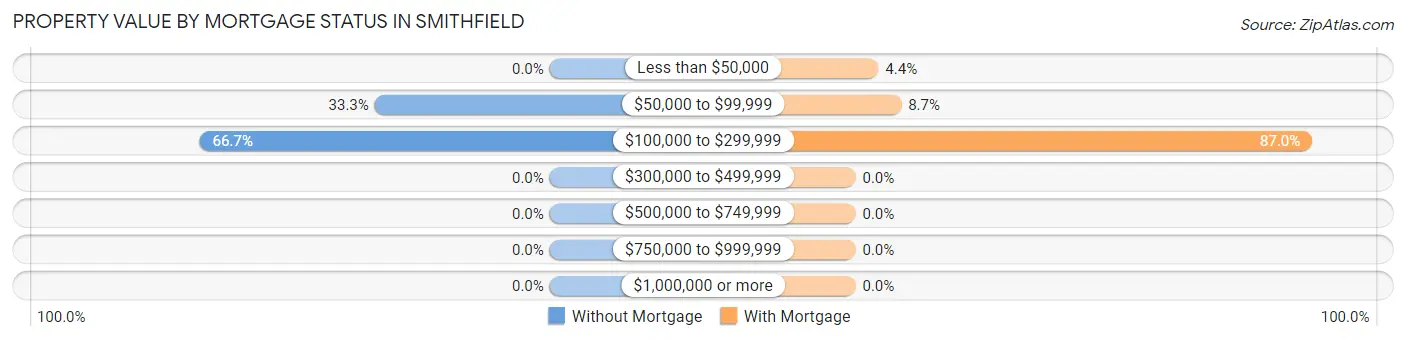
| Property Value | Without Mortgage | With Mortgage |
| Less than $50,000 | 0 (0.0%) | 1 (4.3%) |
| $50,000 to $99,999 | 2 (33.3%) | 2 (8.7%) |
| $100,000 to $299,999 | 4 (66.7%) | 20 (87.0%) |
| $300,000 to $499,999 | 0 (0.0%) | 0 (0.0%) |
| $500,000 to $749,999 | 0 (0.0%) | 0 (0.0%) |
| $750,000 to $999,999 | 0 (0.0%) | 0 (0.0%) |
| $1,000,000 or more | 0 (0.0%) | 0 (0.0%) |
| Total | 6 (100.0%) | 23 (100.0%) |
Household Income by Mortgage Status in Smithfield
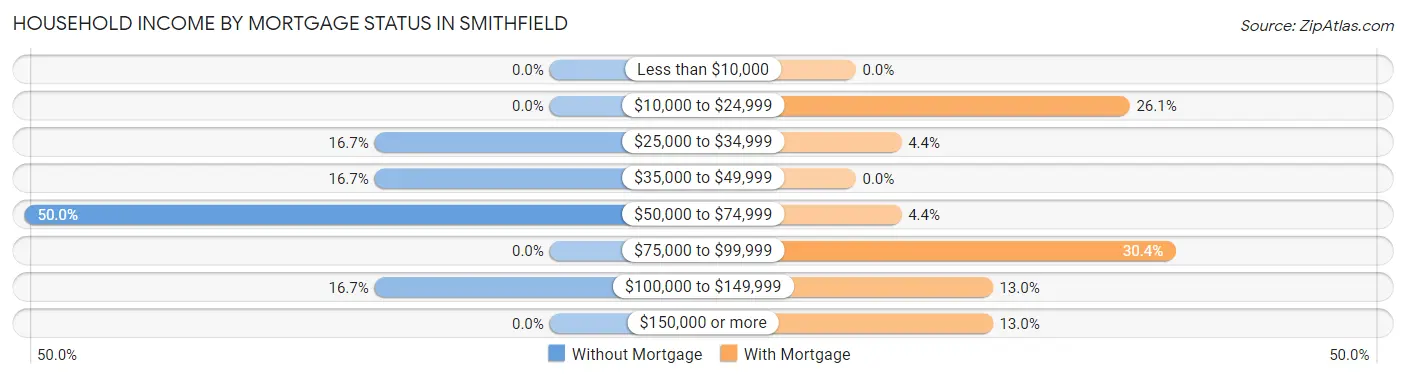
| Household Income | Without Mortgage | With Mortgage |
| Less than $10,000 | 0 (0.0%) | 0 (0.0%) |
| $10,000 to $24,999 | 0 (0.0%) | 6 (26.1%) |
| $25,000 to $34,999 | 1 (16.7%) | 1 (4.3%) |
| $35,000 to $49,999 | 1 (16.7%) | 0 (0.0%) |
| $50,000 to $74,999 | 3 (50.0%) | 1 (4.3%) |
| $75,000 to $99,999 | 0 (0.0%) | 7 (30.4%) |
| $100,000 to $149,999 | 1 (16.7%) | 3 (13.0%) |
| $150,000 or more | 0 (0.0%) | 3 (13.0%) |
| Total | 6 (100.0%) | 23 (100.0%) |
Property Value to Household Income Ratio in Smithfield
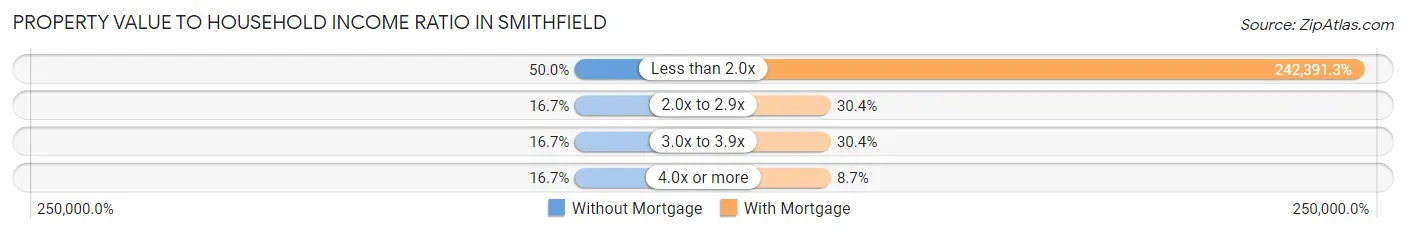
| Value-to-Income Ratio | Without Mortgage | With Mortgage |
| Less than 2.0x | 3 (50.0%) | 55,750 (242,391.3%) |
| 2.0x to 2.9x | 1 (16.7%) | 7 (30.4%) |
| 3.0x to 3.9x | 1 (16.7%) | 7 (30.4%) |
| 4.0x or more | 1 (16.7%) | 2 (8.7%) |
| Total | 6 (100.0%) | 23 (100.0%) |
Real Estate Taxes by Mortgage Status in Smithfield
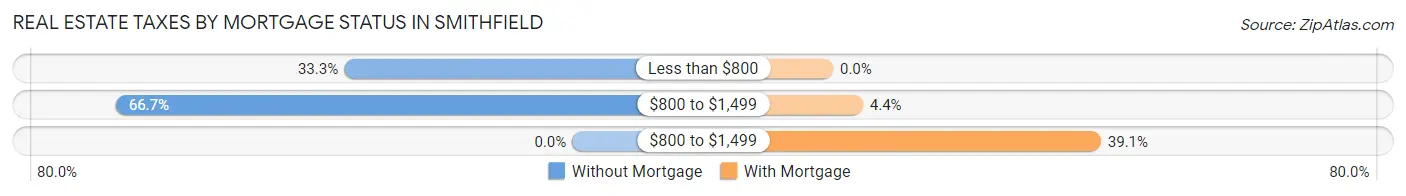
| Property Taxes | Without Mortgage | With Mortgage |
| Less than $800 | 2 (33.3%) | 0 (0.0%) |
| $800 to $1,499 | 4 (66.7%) | 1 (4.3%) |
| $800 to $1,499 | 0 (0.0%) | 9 (39.1%) |
| Total | 6 (100.0%) | 23 (100.0%) |
Health & Disability in Smithfield
Health Insurance Coverage by Age in Smithfield
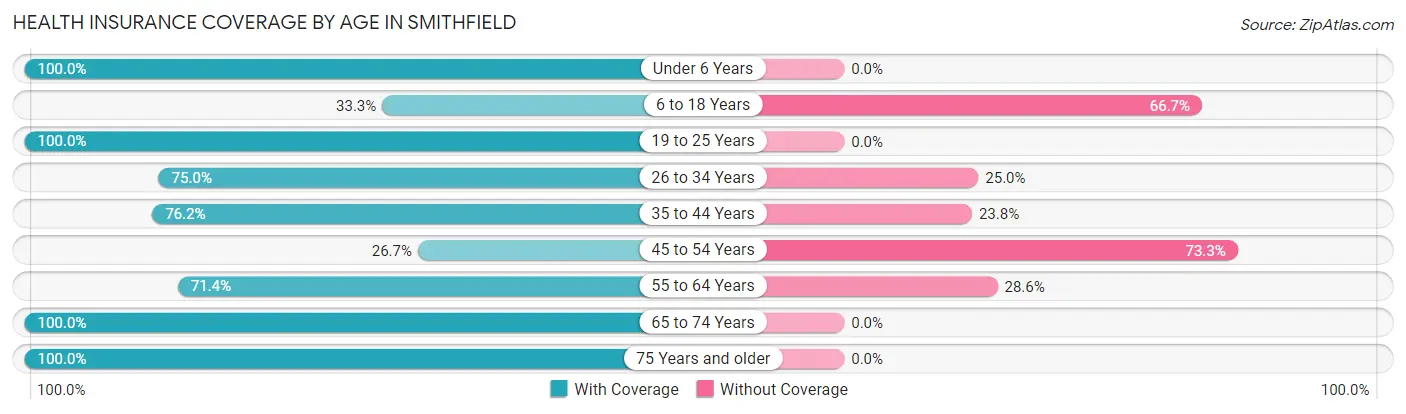
| Age Bracket | With Coverage | Without Coverage |
| Under 6 Years | 13 (100.0%) | 0 (0.0%) |
| 6 to 18 Years | 9 (33.3%) | 18 (66.7%) |
| 19 to 25 Years | 32 (100.0%) | 0 (0.0%) |
| 26 to 34 Years | 21 (75.0%) | 7 (25.0%) |
| 35 to 44 Years | 16 (76.2%) | 5 (23.8%) |
| 45 to 54 Years | 12 (26.7%) | 33 (73.3%) |
| 55 to 64 Years | 5 (71.4%) | 2 (28.6%) |
| 65 to 74 Years | 9 (100.0%) | 0 (0.0%) |
| 75 Years and older | 4 (100.0%) | 0 (0.0%) |
| Total | 121 (65.0%) | 65 (34.9%) |
Health Insurance Coverage by Citizenship Status in Smithfield
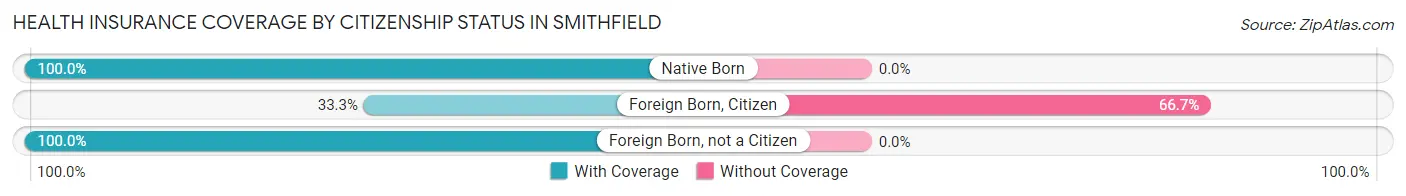
| Citizenship Status | With Coverage | Without Coverage |
| Native Born | 13 (100.0%) | 0 (0.0%) |
| Foreign Born, Citizen | 9 (33.3%) | 18 (66.7%) |
| Foreign Born, not a Citizen | 32 (100.0%) | 0 (0.0%) |
Health Insurance Coverage by Household Income in Smithfield
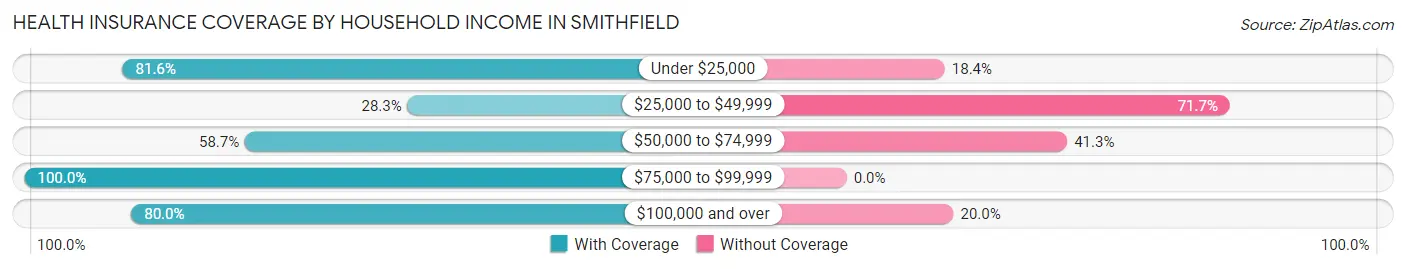
| Household Income | With Coverage | Without Coverage |
| Under $25,000 | 40 (81.6%) | 9 (18.4%) |
| $25,000 to $49,999 | 13 (28.3%) | 33 (71.7%) |
| $50,000 to $74,999 | 27 (58.7%) | 19 (41.3%) |
| $75,000 to $99,999 | 25 (100.0%) | 0 (0.0%) |
| $100,000 and over | 16 (80.0%) | 4 (20.0%) |
Public vs Private Health Insurance Coverage by Age in Smithfield
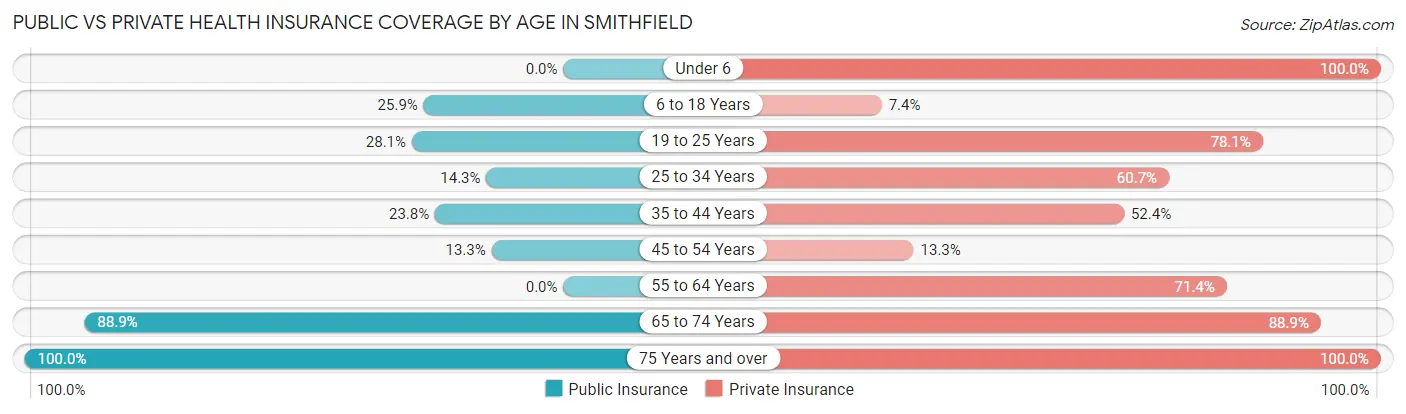
| Age Bracket | Public Insurance | Private Insurance |
| Under 6 | 0 (0.0%) | 13 (100.0%) |
| 6 to 18 Years | 7 (25.9%) | 2 (7.4%) |
| 19 to 25 Years | 9 (28.1%) | 25 (78.1%) |
| 25 to 34 Years | 4 (14.3%) | 17 (60.7%) |
| 35 to 44 Years | 5 (23.8%) | 11 (52.4%) |
| 45 to 54 Years | 6 (13.3%) | 6 (13.3%) |
| 55 to 64 Years | 0 (0.0%) | 5 (71.4%) |
| 65 to 74 Years | 8 (88.9%) | 8 (88.9%) |
| 75 Years and over | 4 (100.0%) | 4 (100.0%) |
| Total | 43 (23.1%) | 91 (48.9%) |
Disability Status by Sex by Age in Smithfield
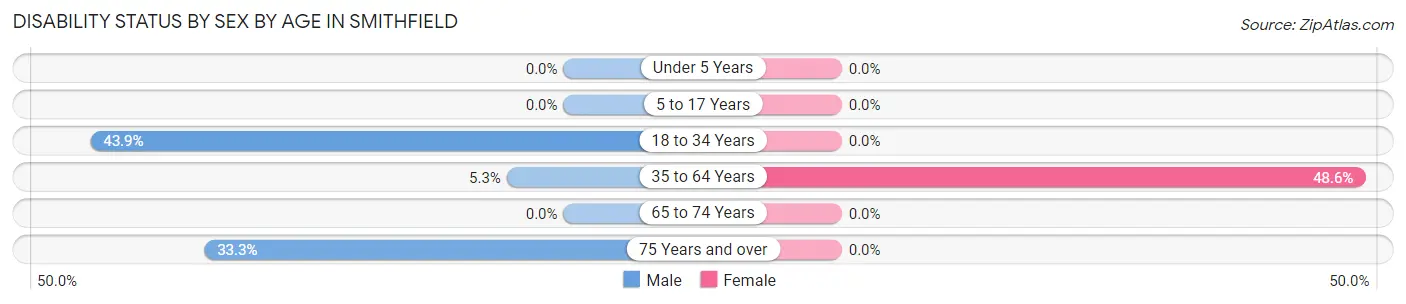
| Age Bracket | Male | Female |
| Under 5 Years | 0 (0.0%) | 0 (0.0%) |
| 5 to 17 Years | 0 (0.0%) | 0 (0.0%) |
| 18 to 34 Years | 18 (43.9%) | 0 (0.0%) |
| 35 to 64 Years | 2 (5.3%) | 17 (48.6%) |
| 65 to 74 Years | 0 (0.0%) | 0 (0.0%) |
| 75 Years and over | 1 (33.3%) | 0 (0.0%) |
Disability Class by Sex by Age in Smithfield
Disability Class: Hearing Difficulty
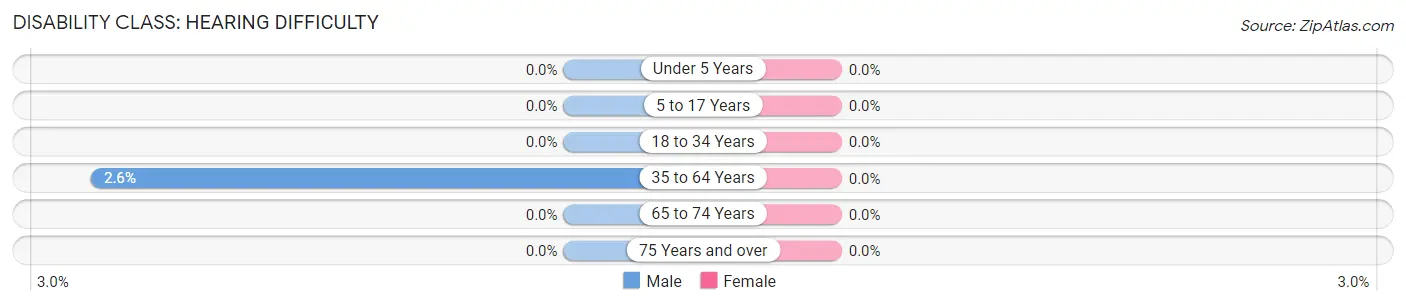
| Age Bracket | Male | Female |
| Under 5 Years | 0 (0.0%) | 0 (0.0%) |
| 5 to 17 Years | 0 (0.0%) | 0 (0.0%) |
| 18 to 34 Years | 0 (0.0%) | 0 (0.0%) |
| 35 to 64 Years | 1 (2.6%) | 0 (0.0%) |
| 65 to 74 Years | 0 (0.0%) | 0 (0.0%) |
| 75 Years and over | 0 (0.0%) | 0 (0.0%) |
Disability Class: Vision Difficulty
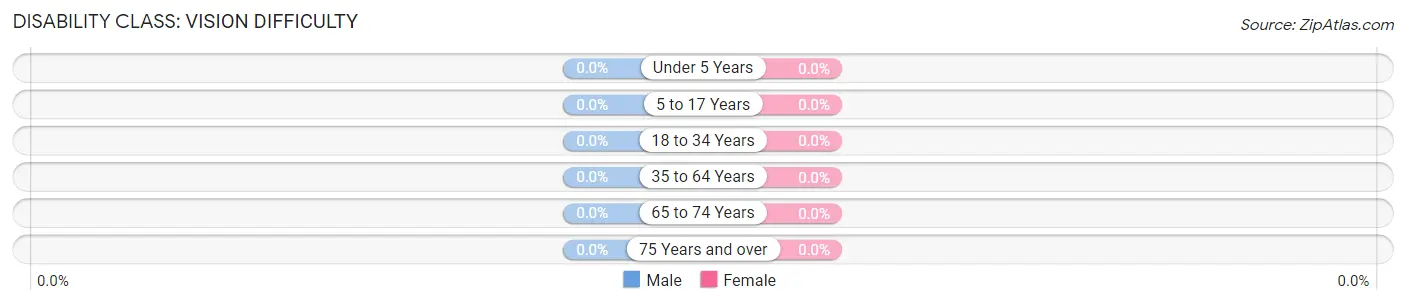
| Age Bracket | Male | Female |
| Under 5 Years | 0 (0.0%) | 0 (0.0%) |
| 5 to 17 Years | 0 (0.0%) | 0 (0.0%) |
| 18 to 34 Years | 0 (0.0%) | 0 (0.0%) |
| 35 to 64 Years | 0 (0.0%) | 0 (0.0%) |
| 65 to 74 Years | 0 (0.0%) | 0 (0.0%) |
| 75 Years and over | 0 (0.0%) | 0 (0.0%) |
Disability Class: Cognitive Difficulty
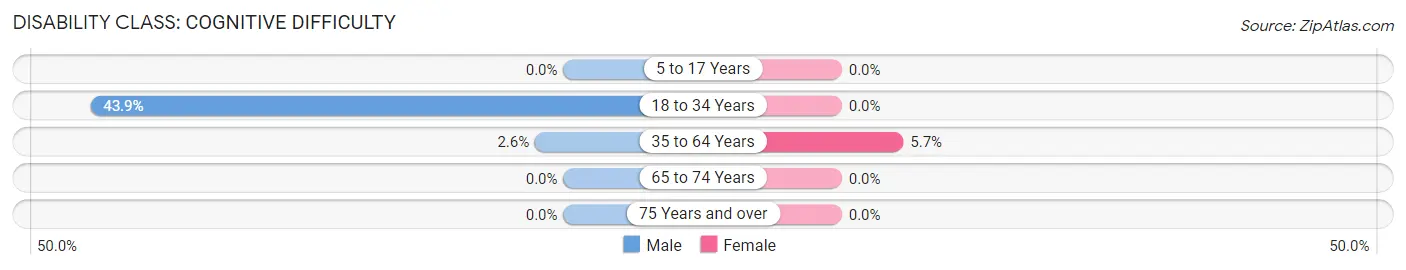
| Age Bracket | Male | Female |
| 5 to 17 Years | 0 (0.0%) | 0 (0.0%) |
| 18 to 34 Years | 18 (43.9%) | 0 (0.0%) |
| 35 to 64 Years | 1 (2.6%) | 2 (5.7%) |
| 65 to 74 Years | 0 (0.0%) | 0 (0.0%) |
| 75 Years and over | 0 (0.0%) | 0 (0.0%) |
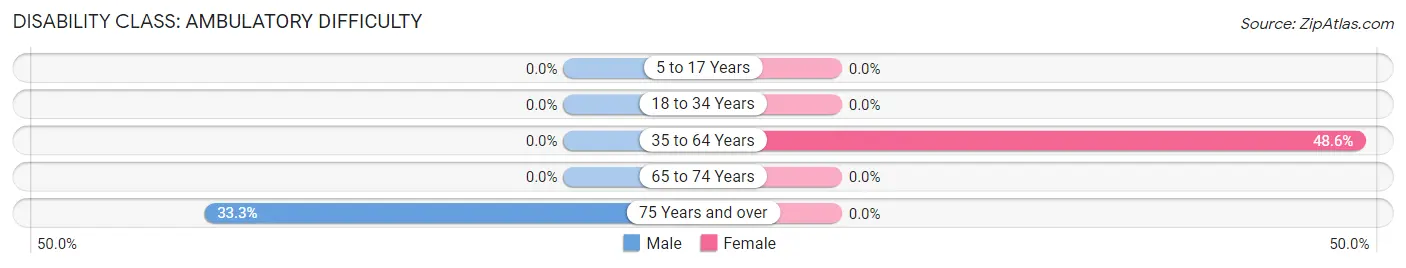
Disability Class: Ambulatory Difficulty
| Age Bracket | Male | Female |
| 5 to 17 Years | 0 (0.0%) | 0 (0.0%) |
| 18 to 34 Years | 0 (0.0%) | 0 (0.0%) |
| 35 to 64 Years | 0 (0.0%) | 17 (48.6%) |
| 65 to 74 Years | 0 (0.0%) | 0 (0.0%) |
| 75 Years and over | 1 (33.3%) | 0 (0.0%) |
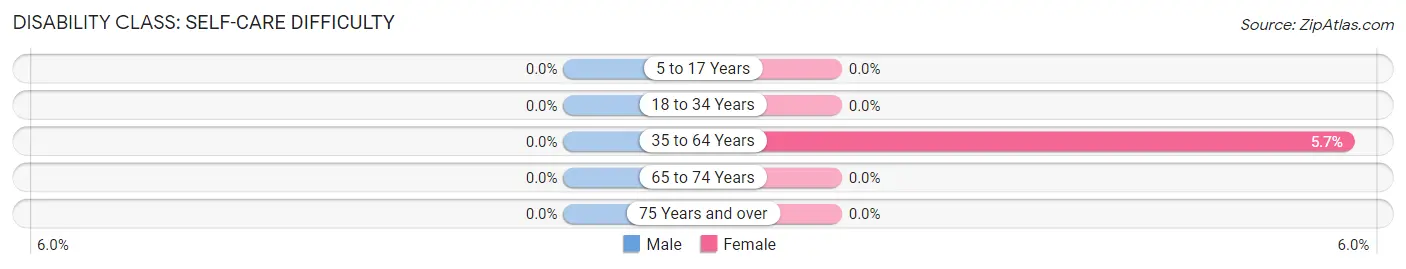
Disability Class: Self-Care Difficulty
| Age Bracket | Male | Female |
| 5 to 17 Years | 0 (0.0%) | 0 (0.0%) |
| 18 to 34 Years | 0 (0.0%) | 0 (0.0%) |
| 35 to 64 Years | 0 (0.0%) | 2 (5.7%) |
| 65 to 74 Years | 0 (0.0%) | 0 (0.0%) |
| 75 Years and over | 0 (0.0%) | 0 (0.0%) |
Technology Access in Smithfield
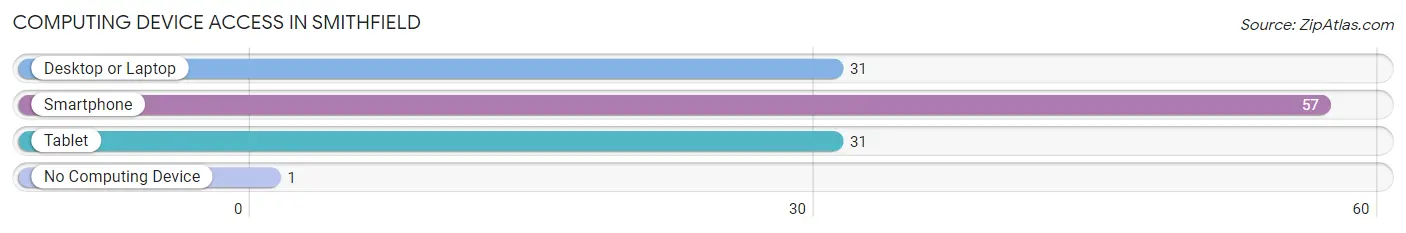
Computing Device Access in Smithfield
| Device Type | # Households | % Households |
| Desktop or Laptop | 31 | 52.5% |
| Smartphone | 57 | 96.6% |
| Tablet | 31 | 52.5% |
| No Computing Device | 1 | 1.7% |
| Total | 59 | 100.0% |
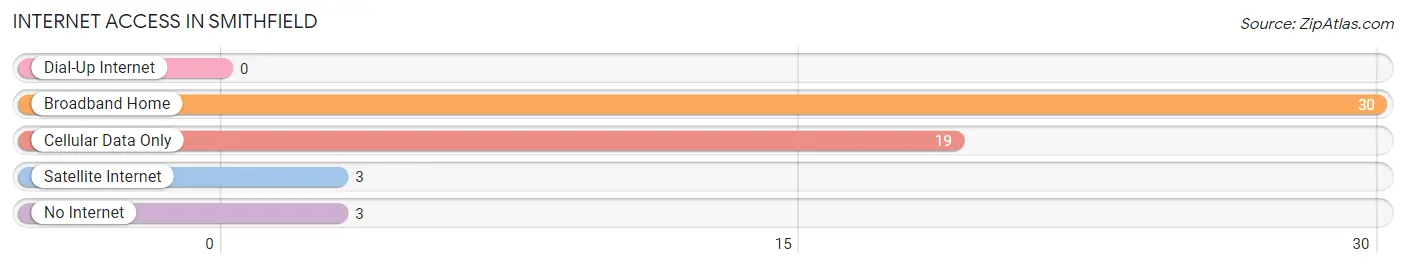
Internet Access in Smithfield
| Internet Type | # Households | % Households |
| Dial-Up Internet | 0 | 0.0% |
| Broadband Home | 30 | 50.8% |
| Cellular Data Only | 19 | 32.2% |
| Satellite Internet | 3 | 5.1% |
| No Internet | 3 | 5.1% |
| Total | 59 | 100.0% |
Smithfield Summary
Smithfield, Kentucky is a small town located in the heart of the Bluegrass region of Kentucky. It is situated in the northern part of the state, just south of Lexington. The town was founded in 1817 and has a population of just over 1,000 people.
History
Smithfield was founded in 1817 by a group of settlers from Virginia. The town was named after the Smith family, who were among the first settlers. The town was originally a farming community, but it soon became a center for the production of tobacco and other agricultural products. The town was also home to a number of small businesses, including a blacksmith shop, a general store, and a mill.
In the late 19th century, Smithfield became a popular destination for tourists. The town was known for its picturesque scenery and its proximity to the Kentucky River. The town was also home to a number of resorts and hotels, which attracted visitors from all over the country.
Geography
Smithfield is located in the northern part of Kentucky, just south of Lexington. The town is situated in the Bluegrass region of the state, which is known for its rolling hills and lush green pastures. The town is located on the Kentucky River, which provides a scenic backdrop for the town.
The town is surrounded by a number of small towns and villages, including Paris, Cynthiana, and Winchester. The town is also close to the Kentucky Horse Park, which is a popular tourist destination.
Economy
The economy of Smithfield is largely based on agriculture. The town is home to a number of farms, which produce a variety of crops, including tobacco, corn, and soybeans. The town is also home to a number of small businesses, including restaurants, shops, and other services.
The town is also home to a number of manufacturing companies, which produce a variety of products, including furniture, clothing, and automotive parts. The town is also home to a number of educational institutions, including a community college and a vocational school.
Demographics
As of the 2010 census, the population of Smithfield was 1,072. The town is predominantly white, with a small African American population. The median household income in the town is $37,000, and the median home value is $125,000.
The town is home to a number of churches, including Baptist, Methodist, and Presbyterian. The town is also home to a number of schools, including a public elementary school and a private high school.
Conclusion
Smithfield, Kentucky is a small town located in the heart of the Bluegrass region of Kentucky. The town was founded in 1817 and has a population of just over 1,000 people. The town is known for its picturesque scenery and its proximity to the Kentucky River. The economy of Smithfield is largely based on agriculture, and the town is home to a number of small businesses. The town is predominantly white, with a small African American population. Smithfield is home to a number of churches, schools, and other institutions, making it a great place to live and work.
Common Questions
What is Per Capita Income in Smithfield?
Per Capita income in Smithfield is $19,169.
What is the Median Family Income in Smithfield?
Median Family Income in Smithfield is $46,458.
What is the Median Household income in Smithfield?
Median Household Income in Smithfield is $46,354.
What is Income or Wage Gap in Smithfield?
Income or Wage Gap in Smithfield is 25.3%.
Women in Smithfield earn 74.7 cents for every dollar earned by a man.
What is Inequality or Gini Index in Smithfield?
Inequality or Gini Index in Smithfield is 0.40.
What is the Total Population of Smithfield?
Total Population of Smithfield is 186.
What is the Total Male Population of Smithfield?
Total Male Population of Smithfield is 113.
What is the Total Female Population of Smithfield?
Total Female Population of Smithfield is 73.
What is the Ratio of Males per 100 Females in Smithfield?
There are 154.79 Males per 100 Females in Smithfield.
What is the Ratio of Females per 100 Males in Smithfield?
There are 64.60 Females per 100 Males in Smithfield.
What is the Median Population Age in Smithfield?
Median Population Age in Smithfield is 31.5 Years.
What is the Average Family Size in Smithfield
Average Family Size in Smithfield is 3.4 People.
What is the Average Household Size in Smithfield
Average Household Size in Smithfield is 3.1 People.
How Large is the Labor Force in Smithfield?
There are 121 People in the Labor Forcein in Smithfield.
What is the Percentage of People in the Labor Force in Smithfield?
82.9% of People are in the Labor Force in Smithfield.
What is the Unemployment Rate in Smithfield?
Unemployment Rate in Smithfield is 2.5%.