Hyden, KY Map & Demographics
Hyden Map
Hyden Overview
$29,221
PER CAPITA INCOME
$52,125
AVG FAMILY INCOME
62.8%
WAGE / INCOME GAP [ % ]
37.2¢/ $1
WAGE / INCOME GAP [ $ ]
0.39
INEQUALITY / GINI INDEX
547
TOTAL POPULATION
186
MALE POPULATION
361
FEMALE POPULATION
51.52
MALES / 100 FEMALES
194.09
FEMALES / 100 MALES
46.9
MEDIAN AGE
3.4
AVG FAMILY SIZE
2.2
AVG HOUSEHOLD SIZE
262
LABOR FORCE [ PEOPLE ]
52.4%
PERCENT IN LABOR FORCE
9.9%
UNEMPLOYMENT RATE
Hyden Zip Codes
Hyden Area Codes
Income in Hyden
Income Overview in Hyden
| Characteristic | Number | Measure |
| Per Capita Income | 547 | $29,221 |
| Median Family Income | 91 | $52,125 |
| Mean Family Income | 91 | $70,325 |
| Median Household Income | 194 | $0 |
| Mean Household Income | 194 | $64,304 |
| Income Deficit | 91 | $0 |
| Wage / Income Gap (%) | 547 | 62.81% |
| Wage / Income Gap ($) | 547 | 37.19¢ per $1 |
| Gini / Inequality Index | 547 | 0.39 |
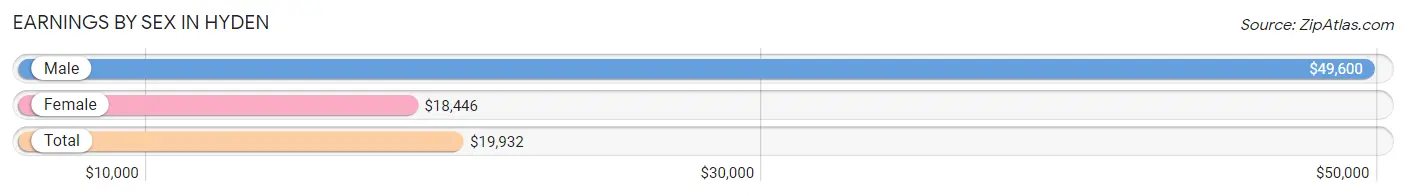
Earnings by Sex in Hyden
Average Earnings in Hyden are $19,932, $49,600 for men and $18,446 for women, a difference of 62.8%.
| Sex | Number | Average Earnings |
| Male | 84 (33.1%) | $49,600 |
| Female | 170 (66.9%) | $18,446 |
| Total | 254 (100.0%) | $19,932 |
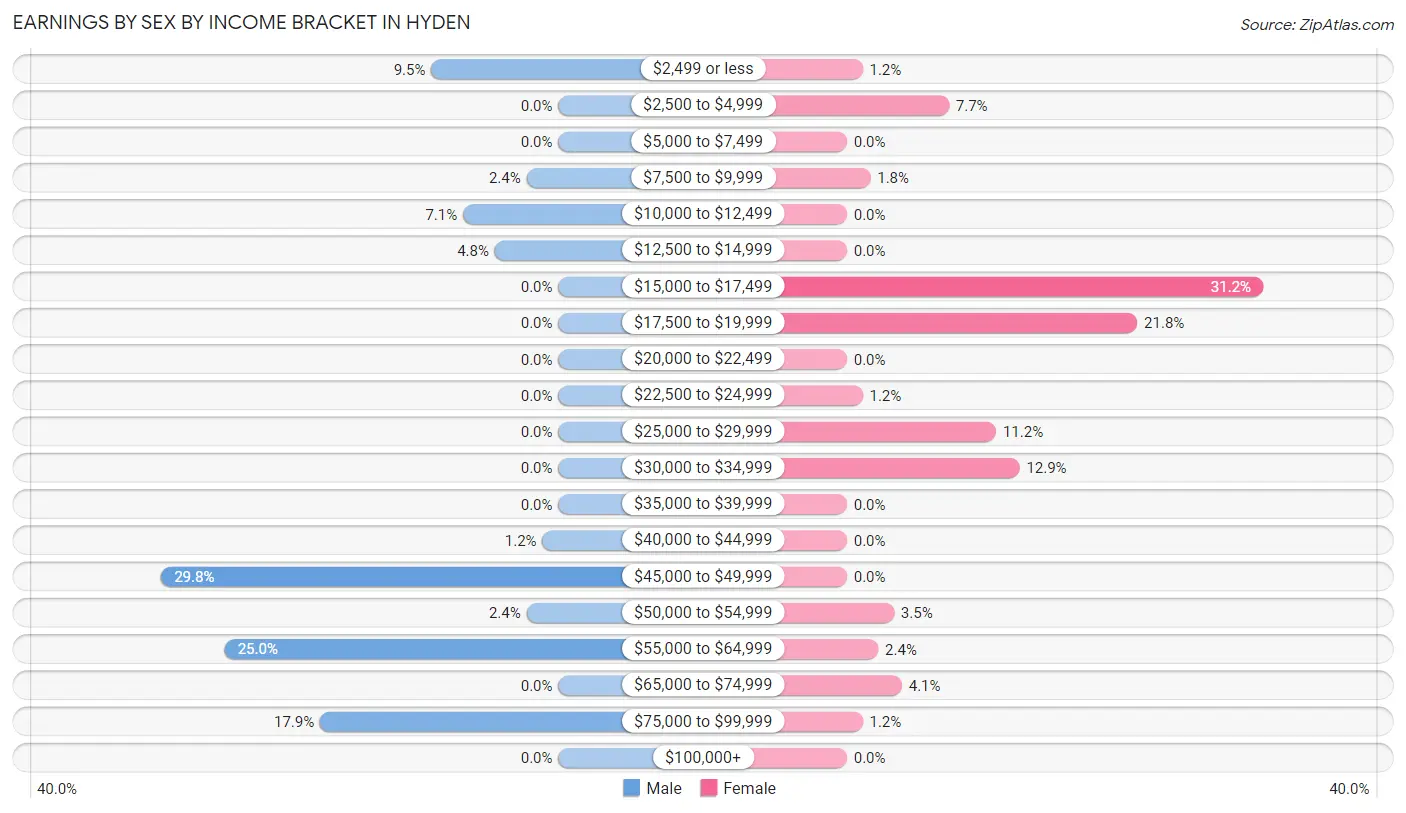
Earnings by Sex by Income Bracket in Hyden
The most common earnings brackets in Hyden are $45,000 to $49,999 for men (25 | 29.8%) and $15,000 to $17,499 for women (53 | 31.2%).
| Income | Male | Female |
| $2,499 or less | 8 (9.5%) | 2 (1.2%) |
| $2,500 to $4,999 | 0 (0.0%) | 13 (7.6%) |
| $5,000 to $7,499 | 0 (0.0%) | 0 (0.0%) |
| $7,500 to $9,999 | 2 (2.4%) | 3 (1.8%) |
| $10,000 to $12,499 | 6 (7.1%) | 0 (0.0%) |
| $12,500 to $14,999 | 4 (4.8%) | 0 (0.0%) |
| $15,000 to $17,499 | 0 (0.0%) | 53 (31.2%) |
| $17,500 to $19,999 | 0 (0.0%) | 37 (21.8%) |
| $20,000 to $22,499 | 0 (0.0%) | 0 (0.0%) |
| $22,500 to $24,999 | 0 (0.0%) | 2 (1.2%) |
| $25,000 to $29,999 | 0 (0.0%) | 19 (11.2%) |
| $30,000 to $34,999 | 0 (0.0%) | 22 (12.9%) |
| $35,000 to $39,999 | 0 (0.0%) | 0 (0.0%) |
| $40,000 to $44,999 | 1 (1.2%) | 0 (0.0%) |
| $45,000 to $49,999 | 25 (29.8%) | 0 (0.0%) |
| $50,000 to $54,999 | 2 (2.4%) | 6 (3.5%) |
| $55,000 to $64,999 | 21 (25.0%) | 4 (2.4%) |
| $65,000 to $74,999 | 0 (0.0%) | 7 (4.1%) |
| $75,000 to $99,999 | 15 (17.9%) | 2 (1.2%) |
| $100,000+ | 0 (0.0%) | 0 (0.0%) |
| Total | 84 (100.0%) | 170 (100.0%) |
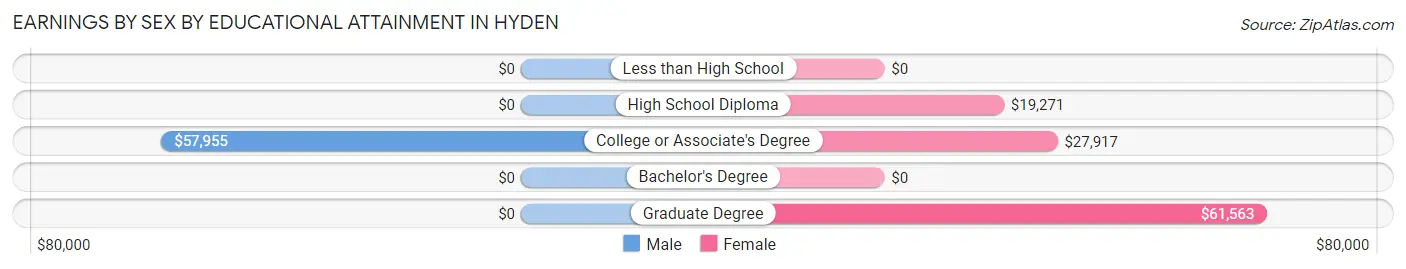
Earnings by Sex by Educational Attainment in Hyden
Average earnings in Hyden are $51,250 for men and $26,607 for women, a difference of 48.1%. Men with an educational attainment of college or associate's degree enjoy the highest average annual earnings of $57,955, while those with college or associate's degree education earn the least with $57,955. Women with an educational attainment of graduate degree earn the most with the average annual earnings of $61,563, while those with high school diploma education have the smallest earnings of $19,271.
| Educational Attainment | Male Income | Female Income |
| Less than High School | - | - |
| High School Diploma | - | - |
| College or Associate's Degree | $57,955 | $27,917 |
| Bachelor's Degree | - | - |
| Graduate Degree | - | - |
| Total | $51,250 | $26,607 |
Family Income in Hyden
Family Income Brackets in Hyden
According to the Hyden family income data, there are 24 families falling into the $50,000 to $74,999 income range, which is the most common income bracket and makes up 26.4% of all families.
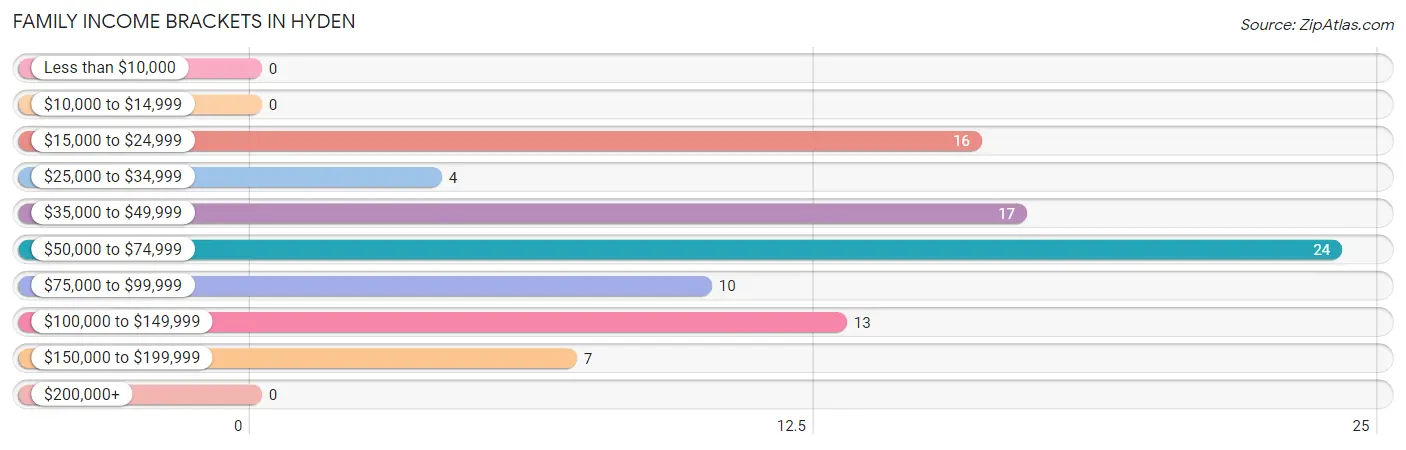
| Income Bracket | # Families | % Families |
| Less than $10,000 | 0 | 0.0% |
| $10,000 to $14,999 | 0 | 0.0% |
| $15,000 to $24,999 | 16 | 17.6% |
| $25,000 to $34,999 | 4 | 4.4% |
| $35,000 to $49,999 | 17 | 18.7% |
| $50,000 to $74,999 | 24 | 26.4% |
| $75,000 to $99,999 | 10 | 11.0% |
| $100,000 to $149,999 | 13 | 14.3% |
| $150,000 to $199,999 | 7 | 7.7% |
| $200,000+ | 0 | 0.0% |
Family Income by Famaliy Size in Hyden
2-person families (53 | 58.2%) account for the highest median family income in Hyden with $70,208 per family, while 2-person families (53 | 58.2%) have the highest median income of $35,104 per family member.
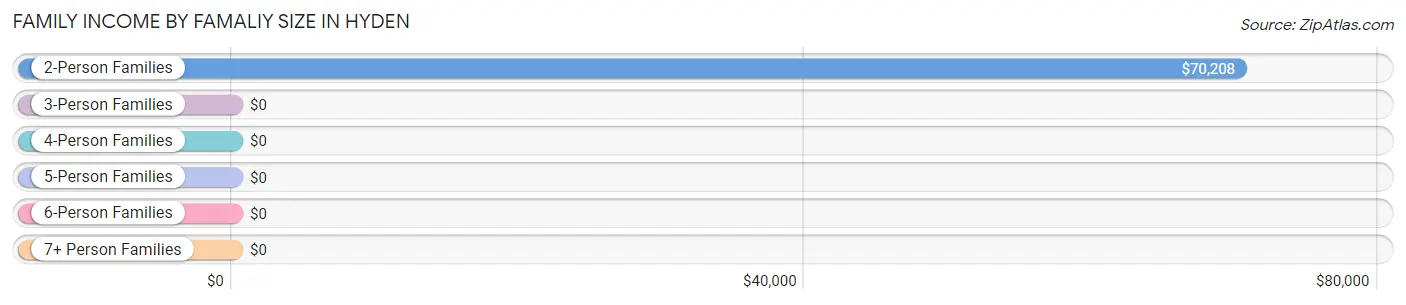
| Income Bracket | # Families | Median Income |
| 2-Person Families | 53 (58.2%) | $70,208 |
| 3-Person Families | 26 (28.6%) | $0 |
| 4-Person Families | 12 (13.2%) | $0 |
| 5-Person Families | 0 (0.0%) | $0 |
| 6-Person Families | 0 (0.0%) | $0 |
| 7+ Person Families | 0 (0.0%) | $0 |
| Total | 91 (100.0%) | $52,125 |
Family Income by Number of Earners in Hyden
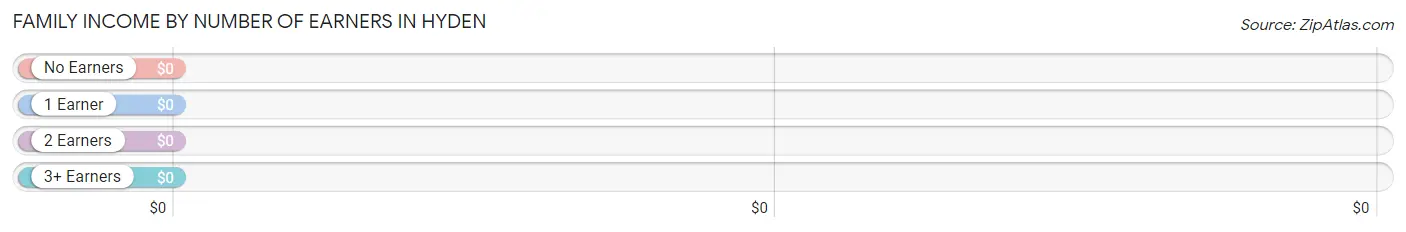
| Number of Earners | # Families | Median Income |
| No Earners | 7 (7.7%) | $0 |
| 1 Earner | 25 (27.5%) | $0 |
| 2 Earners | 50 (54.9%) | $0 |
| 3+ Earners | 9 (9.9%) | $0 |
| Total | 91 (100.0%) | $52,125 |
Household Income in Hyden
Household Income Brackets in Hyden
With 53 households falling in the category, the $75,000 to $99,999 income range is the most frequent in Hyden, accounting for 27.3% of all households.
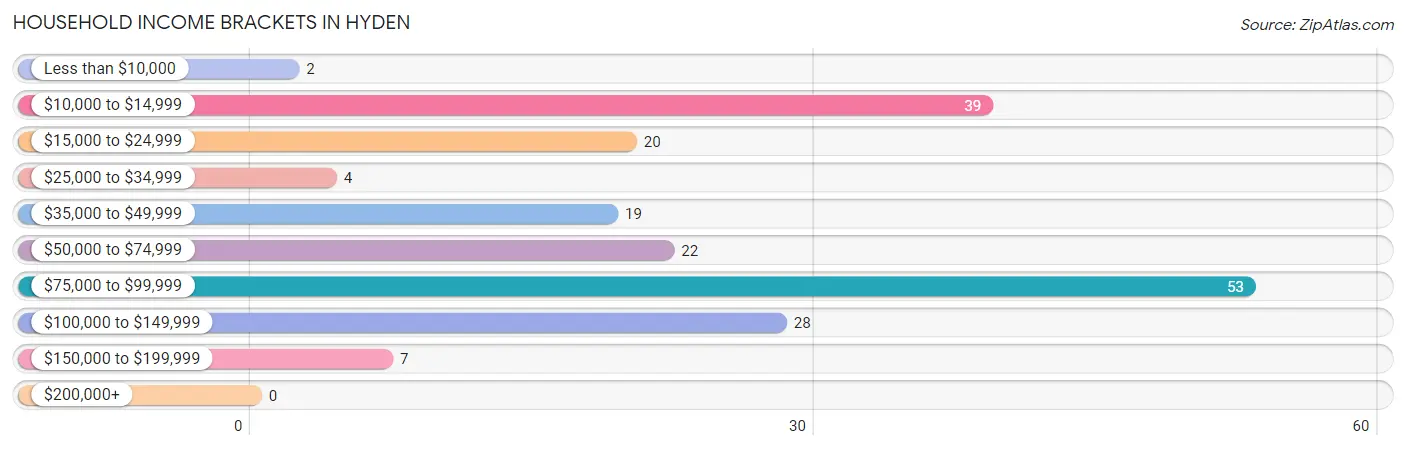
| Income Bracket | # Households | % Households |
| Less than $10,000 | 2 | 1.0% |
| $10,000 to $14,999 | 39 | 20.1% |
| $15,000 to $24,999 | 20 | 10.3% |
| $25,000 to $34,999 | 4 | 2.1% |
| $35,000 to $49,999 | 19 | 9.8% |
| $50,000 to $74,999 | 22 | 11.3% |
| $75,000 to $99,999 | 53 | 27.3% |
| $100,000 to $149,999 | 28 | 14.4% |
| $150,000 to $199,999 | 7 | 3.6% |
| $200,000+ | 0 | 0.0% |
Household Income by Householder Age in Hyden
The median household income in Hyden is $0, with the highest median household income of $88,694 found in the 65+ years age bracket for the primary householder. A total of 81 households (41.7%) fall into this category. Meanwhile, the 15 to 24 years age bracket for the primary householder has the lowest median household income of $0, with 2 households (1.0%) in this group.
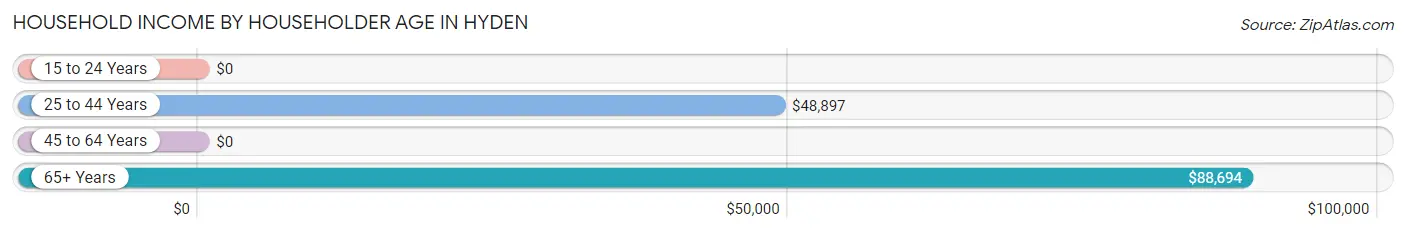
| Income Bracket | # Households | Median Income |
| 15 to 24 Years | 2 (1.0%) | $0 |
| 25 to 44 Years | 51 (26.3%) | $48,897 |
| 45 to 64 Years | 60 (30.9%) | $0 |
| 65+ Years | 81 (41.7%) | $88,694 |
| Total | 194 (100.0%) | $0 |
Poverty in Hyden
Income Below Poverty by Sex and Age in Hyden
With 38.6% poverty level for males and 16.9% for females among the residents of Hyden, 55 to 64 year old males and 5 year old females are the most vulnerable to poverty, with 37 males (94.9%) and 14 females (100.0%) in their respective age groups living below the poverty level.
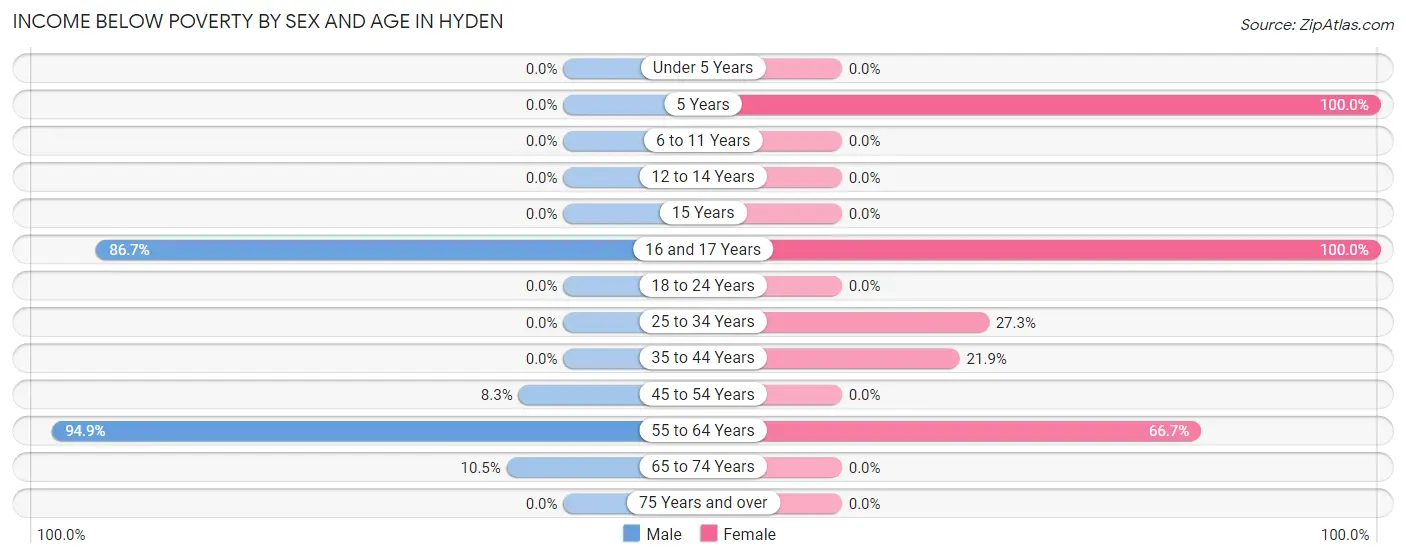
| Age Bracket | Male | Female |
| Under 5 Years | 0 (0.0%) | 0 (0.0%) |
| 5 Years | 0 (0.0%) | 14 (100.0%) |
| 6 to 11 Years | 0 (0.0%) | 0 (0.0%) |
| 12 to 14 Years | 0 (0.0%) | 0 (0.0%) |
| 15 Years | 0 (0.0%) | 0 (0.0%) |
| 16 and 17 Years | 13 (86.7%) | 13 (100.0%) |
| 18 to 24 Years | 0 (0.0%) | 0 (0.0%) |
| 25 to 34 Years | 0 (0.0%) | 12 (27.3%) |
| 35 to 44 Years | 0 (0.0%) | 7 (21.9%) |
| 45 to 54 Years | 2 (8.3%) | 0 (0.0%) |
| 55 to 64 Years | 37 (94.9%) | 4 (66.7%) |
| 65 to 74 Years | 2 (10.5%) | 0 (0.0%) |
| 75 Years and over | 0 (0.0%) | 0 (0.0%) |
| Total | 54 (38.6%) | 50 (16.9%) |
Income Above Poverty by Sex and Age in Hyden
According to the poverty statistics in Hyden, males aged 25 to 34 years and females aged under 5 years are the age groups that are most secure financially, with 100.0% of males and 100.0% of females in these age groups living above the poverty line.
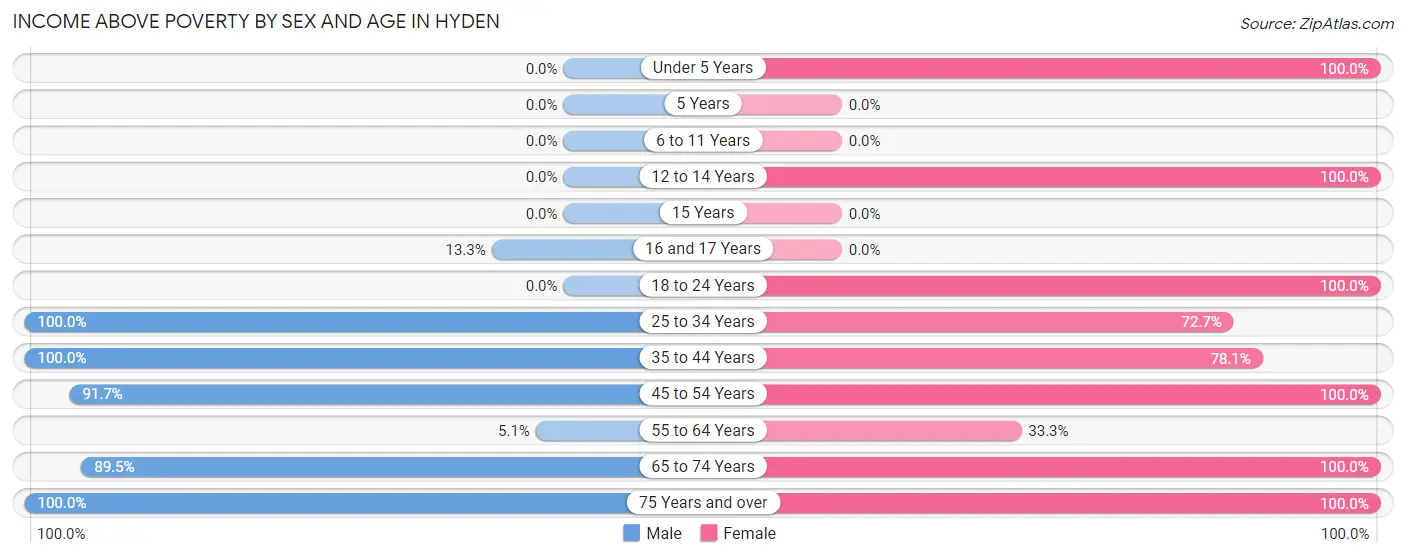
| Age Bracket | Male | Female |
| Under 5 Years | 0 (0.0%) | 9 (100.0%) |
| 5 Years | 0 (0.0%) | 0 (0.0%) |
| 6 to 11 Years | 0 (0.0%) | 0 (0.0%) |
| 12 to 14 Years | 0 (0.0%) | 24 (100.0%) |
| 15 Years | 0 (0.0%) | 0 (0.0%) |
| 16 and 17 Years | 2 (13.3%) | 0 (0.0%) |
| 18 to 24 Years | 0 (0.0%) | 51 (100.0%) |
| 25 to 34 Years | 8 (100.0%) | 32 (72.7%) |
| 35 to 44 Years | 29 (100.0%) | 25 (78.1%) |
| 45 to 54 Years | 22 (91.7%) | 22 (100.0%) |
| 55 to 64 Years | 2 (5.1%) | 2 (33.3%) |
| 65 to 74 Years | 17 (89.5%) | 24 (100.0%) |
| 75 Years and over | 6 (100.0%) | 57 (100.0%) |
| Total | 86 (61.4%) | 246 (83.1%) |
Income Below Poverty Among Married-Couple Families in Hyden
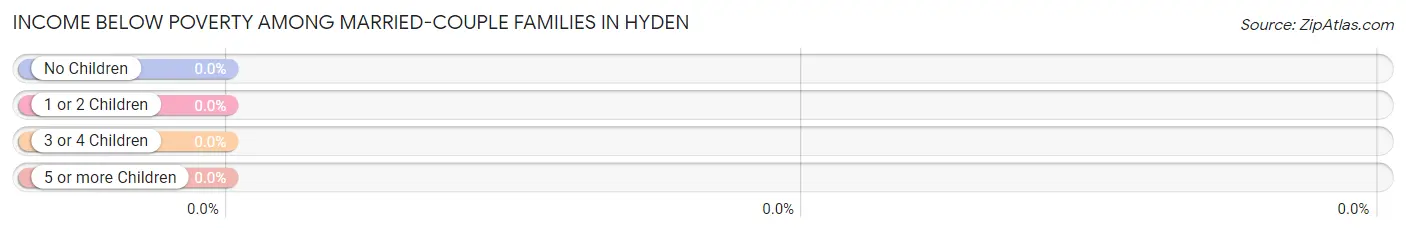
| Children | Above Poverty | Below Poverty |
| No Children | 30 (100.0%) | 0 (0.0%) |
| 1 or 2 Children | 0 (0.0%) | 0 (0.0%) |
| 3 or 4 Children | 0 (0.0%) | 0 (0.0%) |
| 5 or more Children | 0 (0.0%) | 0 (0.0%) |
| Total | 30 (100.0%) | 0 (0.0%) |
Income Below Poverty Among Single-Parent Households in Hyden
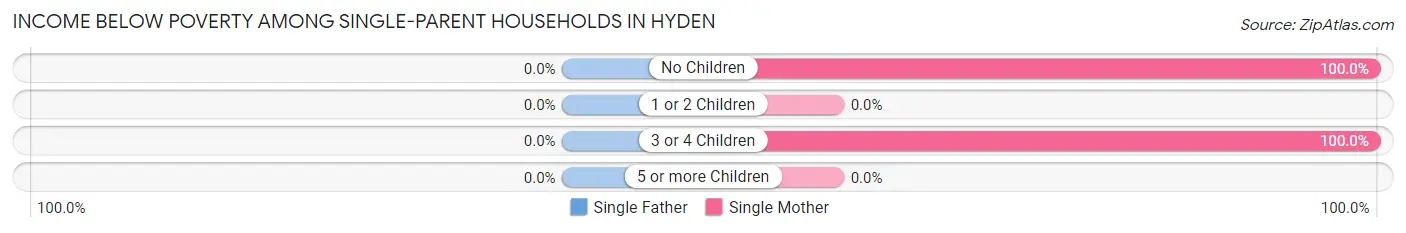
| Children | Single Father | Single Mother |
| No Children | 0 (0.0%) | 4 (100.0%) |
| 1 or 2 Children | 0 (0.0%) | 0 (0.0%) |
| 3 or 4 Children | 0 (0.0%) | 12 (100.0%) |
| 5 or more Children | 0 (0.0%) | 0 (0.0%) |
| Total | 0 (0.0%) | 16 (41.0%) |
Income Below Poverty Among Married-Couple vs Single-Parent Households in Hyden
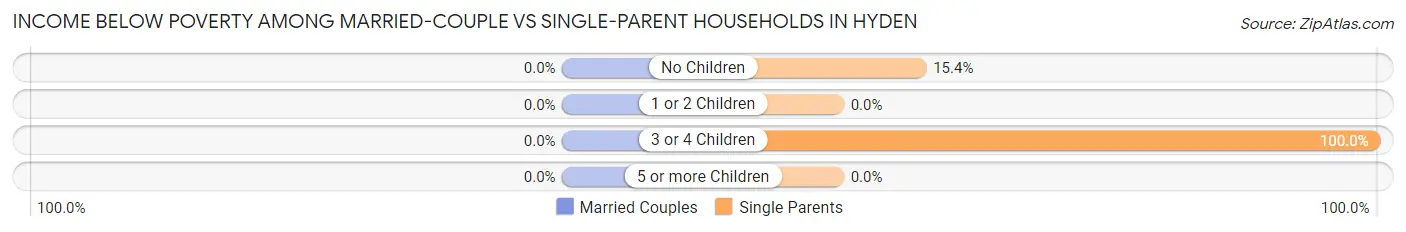
| Children | Married-Couple Families | Single-Parent Households |
| No Children | 0 (0.0%) | 4 (15.4%) |
| 1 or 2 Children | 0 (0.0%) | 0 (0.0%) |
| 3 or 4 Children | 0 (0.0%) | 12 (100.0%) |
| 5 or more Children | 0 (0.0%) | 0 (0.0%) |
| Total | 0 (0.0%) | 16 (26.2%) |
Race in Hyden
The most populous races in Hyden are White / Caucasian (452 | 82.6%), Hispanic or Latino (65 | 11.9%), and Two or more Races (58 | 10.6%).
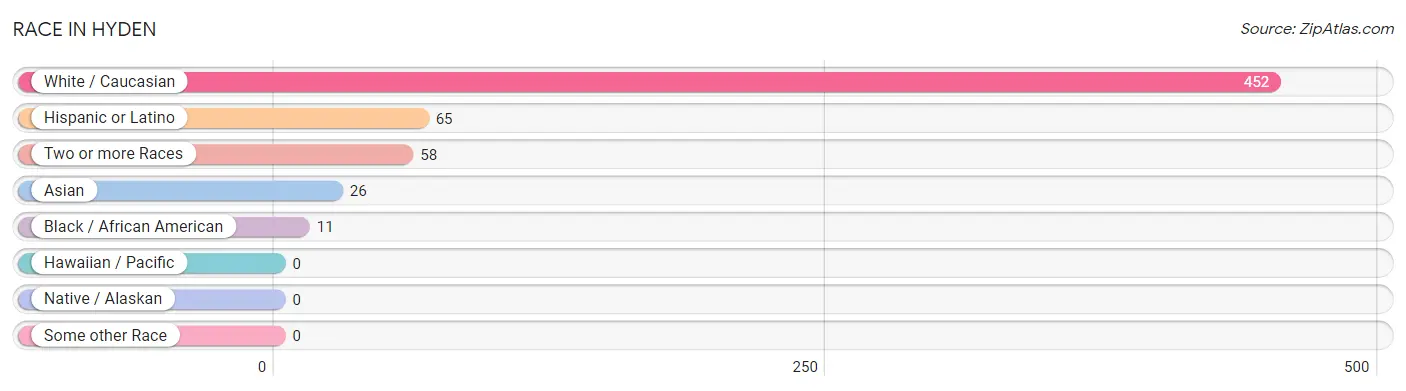
| Race | # Population | % Population |
| Asian | 26 | 4.8% |
| Black / African American | 11 | 2.0% |
| Hawaiian / Pacific | 0 | 0.0% |
| Hispanic or Latino | 65 | 11.9% |
| Native / Alaskan | 0 | 0.0% |
| White / Caucasian | 452 | 82.6% |
| Two or more Races | 58 | 10.6% |
| Some other Race | 0 | 0.0% |
| Total | 547 | 100.0% |
Ancestry in Hyden
The most populous ancestries reported in Hyden are Irish (73 | 13.4%), Mexican (65 | 11.9%), American (58 | 10.6%), English (41 | 7.5%), and Scotch-Irish (33 | 6.0%), together accounting for 49.4% of all Hyden residents.
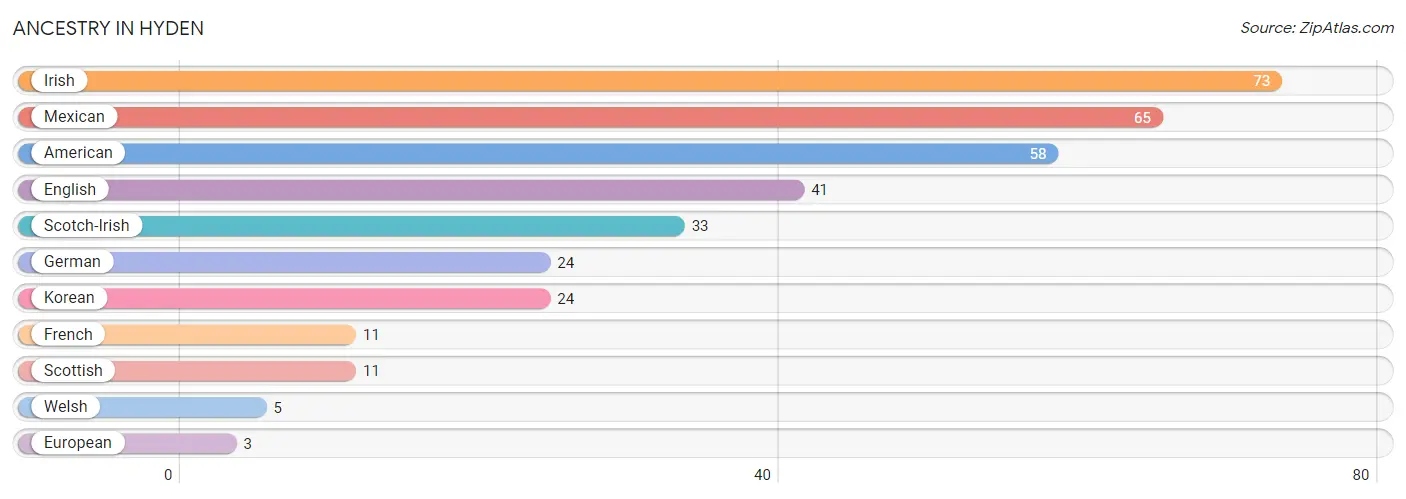
| Ancestry | # Population | % Population |
| American | 58 | 10.6% |
| English | 41 | 7.5% |
| European | 3 | 0.5% |
| French | 11 | 2.0% |
| German | 24 | 4.4% |
| Irish | 73 | 13.4% |
| Korean | 24 | 4.4% |
| Mexican | 65 | 11.9% |
| Scotch-Irish | 33 | 6.0% |
| Scottish | 11 | 2.0% |
| Welsh | 5 | 0.9% | View All 11 Rows |
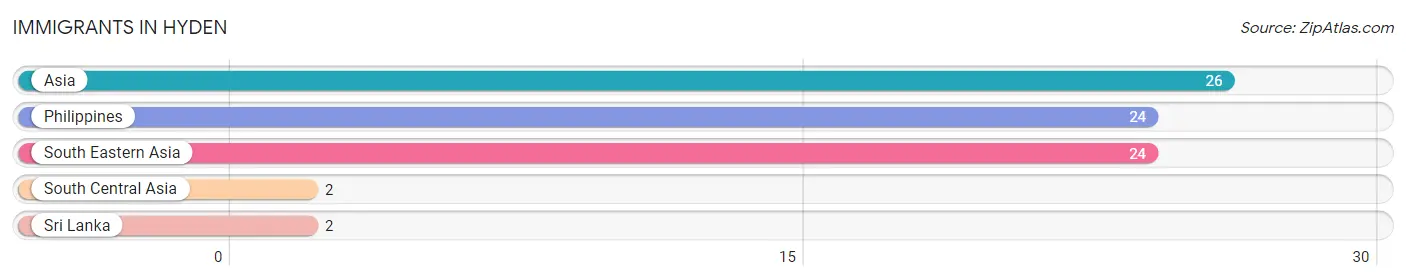
Immigrants in Hyden
The most numerous immigrant groups reported in Hyden came from Asia (26 | 4.8%), Philippines (24 | 4.4%), South Eastern Asia (24 | 4.4%), South Central Asia (2 | 0.4%), and Sri Lanka (2 | 0.4%), together accounting for 14.3% of all Hyden residents.
| Immigration Origin | # Population | % Population |
| Asia | 26 | 4.8% |
| Philippines | 24 | 4.4% |
| South Central Asia | 2 | 0.4% |
| South Eastern Asia | 24 | 4.4% |
| Sri Lanka | 2 | 0.4% | View All 5 Rows |
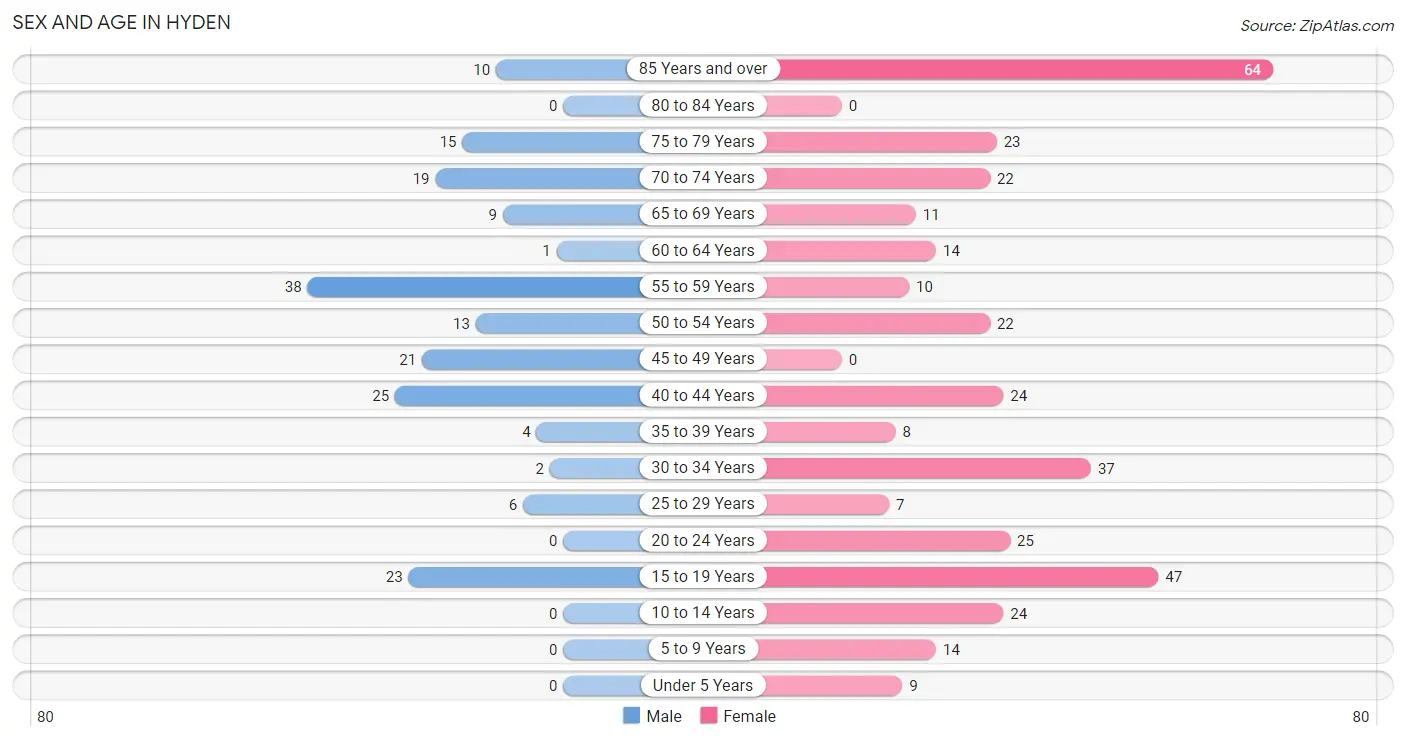
Sex and Age in Hyden
Sex and Age in Hyden
The most populous age groups in Hyden are 55 to 59 Years (38 | 20.4%) for men and 85 Years and over (64 | 17.7%) for women.
| Age Bracket | Male | Female |
| Under 5 Years | 0 (0.0%) | 9 (2.5%) |
| 5 to 9 Years | 0 (0.0%) | 14 (3.9%) |
| 10 to 14 Years | 0 (0.0%) | 24 (6.7%) |
| 15 to 19 Years | 23 (12.4%) | 47 (13.0%) |
| 20 to 24 Years | 0 (0.0%) | 25 (6.9%) |
| 25 to 29 Years | 6 (3.2%) | 7 (1.9%) |
| 30 to 34 Years | 2 (1.1%) | 37 (10.2%) |
| 35 to 39 Years | 4 (2.1%) | 8 (2.2%) |
| 40 to 44 Years | 25 (13.4%) | 24 (6.7%) |
| 45 to 49 Years | 21 (11.3%) | 0 (0.0%) |
| 50 to 54 Years | 13 (7.0%) | 22 (6.1%) |
| 55 to 59 Years | 38 (20.4%) | 10 (2.8%) |
| 60 to 64 Years | 1 (0.5%) | 14 (3.9%) |
| 65 to 69 Years | 9 (4.8%) | 11 (3.0%) |
| 70 to 74 Years | 19 (10.2%) | 22 (6.1%) |
| 75 to 79 Years | 15 (8.1%) | 23 (6.4%) |
| 80 to 84 Years | 0 (0.0%) | 0 (0.0%) |
| 85 Years and over | 10 (5.4%) | 64 (17.7%) |
| Total | 186 (100.0%) | 361 (100.0%) |
Families and Households in Hyden
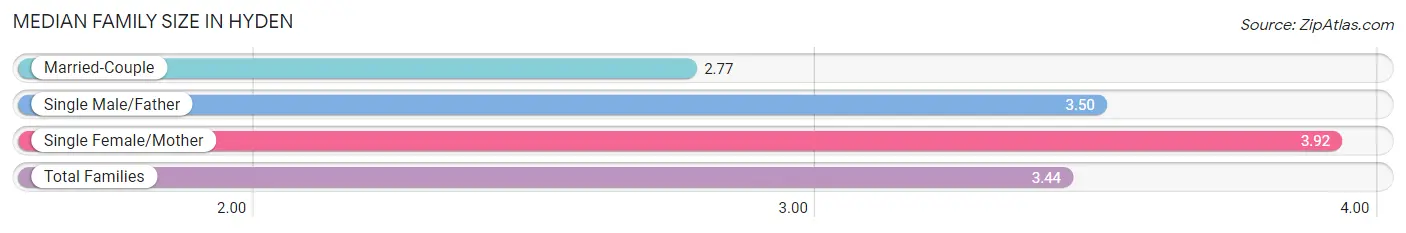
Median Family Size in Hyden
The median family size in Hyden is 3.44 persons per family, with single female/mother families (39 | 42.9%) accounting for the largest median family size of 3.92 persons per family. On the other hand, married-couple families (30 | 33.0%) represent the smallest median family size with 2.77 persons per family.
| Family Type | # Families | Family Size |
| Married-Couple | 30 (33.0%) | 2.77 |
| Single Male/Father | 22 (24.2%) | 3.50 |
| Single Female/Mother | 39 (42.9%) | 3.92 |
| Total Families | 91 (100.0%) | 3.44 |
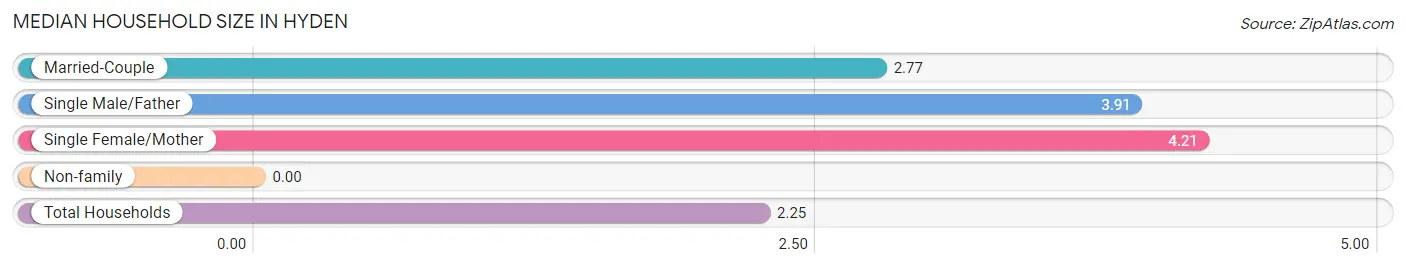
Median Household Size in Hyden
| Household Type | # Households | Household Size |
| Married-Couple | 30 (15.5%) | 2.77 |
| Single Male/Father | 22 (11.3%) | 3.91 |
| Single Female/Mother | 39 (20.1%) | 4.21 |
| Non-family | 103 (53.1%) | - |
| Total Households | 194 (100.0%) | 2.25 |
Household Size by Marriage Status in Hyden
Out of a total of 194 households in Hyden, 91 (46.9%) are family households, while 103 (53.1%) are nonfamily households. The most numerous type of family households are 3-person households, comprising 41, and the most common type of nonfamily households are 1-person households, comprising 103.
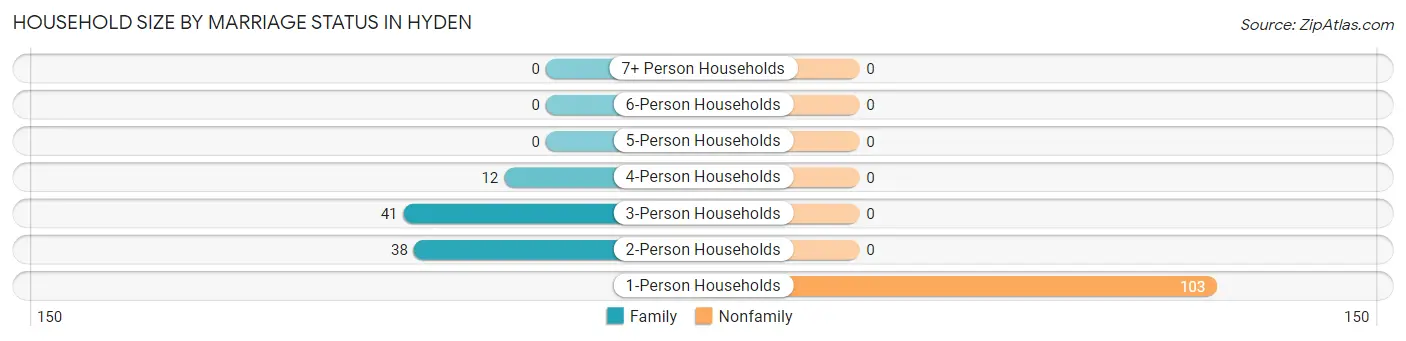
| Household Size | Family Households | Nonfamily Households |
| 1-Person Households | - | 103 (53.1%) |
| 2-Person Households | 38 (19.6%) | 0 (0.0%) |
| 3-Person Households | 41 (21.1%) | 0 (0.0%) |
| 4-Person Households | 12 (6.2%) | 0 (0.0%) |
| 5-Person Households | 0 (0.0%) | 0 (0.0%) |
| 6-Person Households | 0 (0.0%) | 0 (0.0%) |
| 7+ Person Households | 0 (0.0%) | 0 (0.0%) |
| Total | 91 (46.9%) | 103 (53.1%) |
Female Fertility in Hyden
Fertility by Age in Hyden
Average fertility rate in Hyden is 264.0 births per 1,000 women. Women in the age bracket of 20 to 34 years have the highest fertility rate with 565.0 births per 1,000 women. Women in the age bracket of 20 to 34 years acount for 100.0% of all women with births.
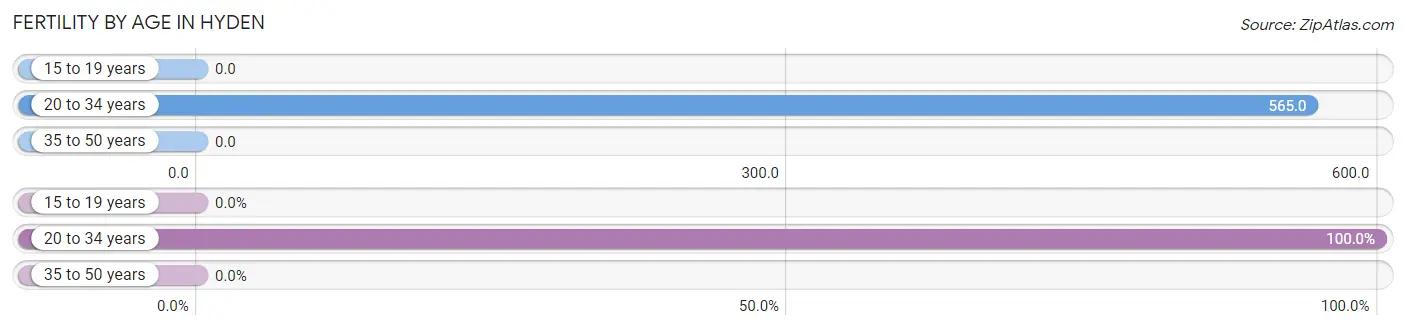
| Age Bracket | Women with Births | Births / 1,000 Women |
| 15 to 19 years | 0 (0.0%) | 0.0 |
| 20 to 34 years | 39 (100.0%) | 565.0 |
| 35 to 50 years | 0 (0.0%) | 0.0 |
| Total | 39 (100.0%) | 264.0 |
Fertility by Age by Marriage Status in Hyden
35.9% of women with births (39) in Hyden are married. The highest percentage of unmarried women with births falls into 20 to 34 years age bracket with 64.1% of them unmarried at the time of birth, while the lowest percentage of unmarried women with births belong to 20 to 34 years age bracket with 64.1% of them unmarried.
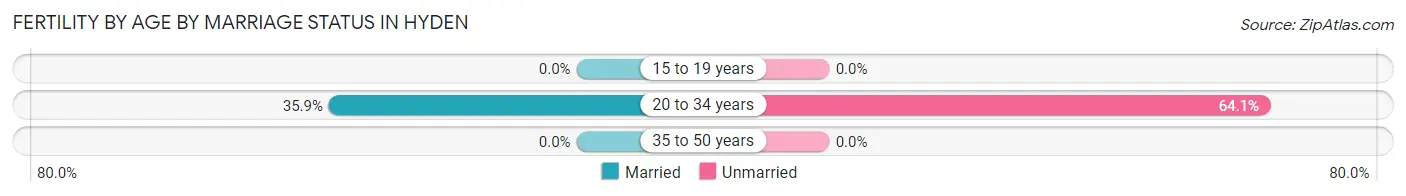
| Age Bracket | Married | Unmarried |
| 15 to 19 years | 0 (0.0%) | 0 (0.0%) |
| 20 to 34 years | 14 (35.9%) | 25 (64.1%) |
| 35 to 50 years | 0 (0.0%) | 0 (0.0%) |
| Total | 14 (35.9%) | 25 (64.1%) |
Fertility by Education in Hyden
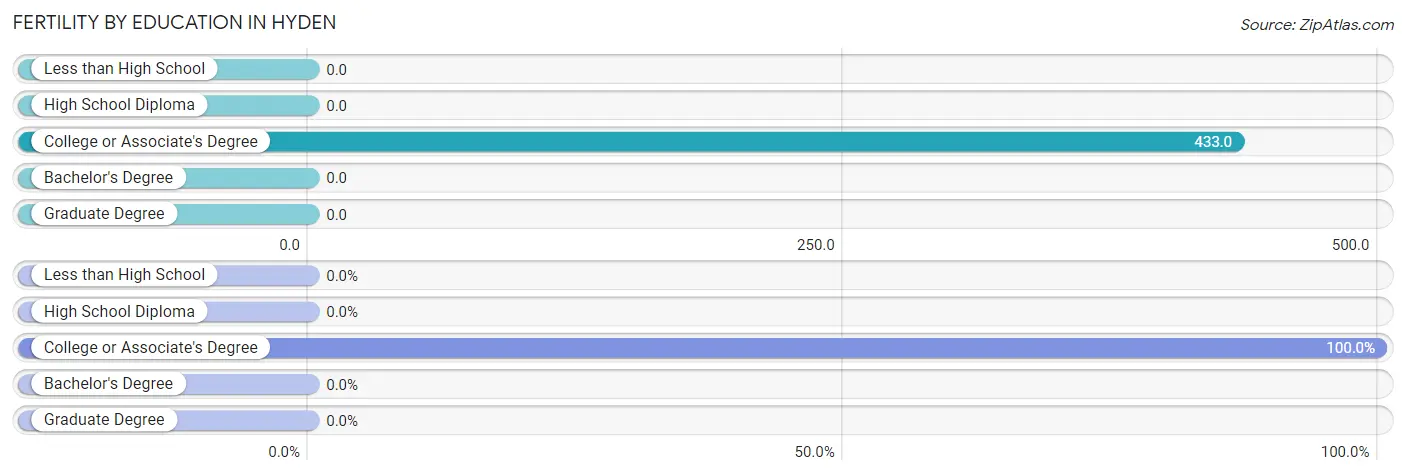
| Educational Attainment | Women with Births | Births / 1,000 Women |
| Less than High School | 0 (0.0%) | 0.0 |
| High School Diploma | 0 (0.0%) | 0.0 |
| College or Associate's Degree | 39 (100.0%) | 433.0 |
| Bachelor's Degree | 0 (0.0%) | 0.0 |
| Graduate Degree | 0 (0.0%) | 0.0 |
| Total | 39 (100.0%) | 264.0 |
Fertility by Education by Marriage Status in Hyden
64.1% of women with births in Hyden are unmarried. Women with the educational attainment of college or associate's degree are most likely to be married with 35.9% of them married at childbirth, while women with the educational attainment of college or associate's degree are least likely to be married with 64.1% of them unmarried at childbirth.
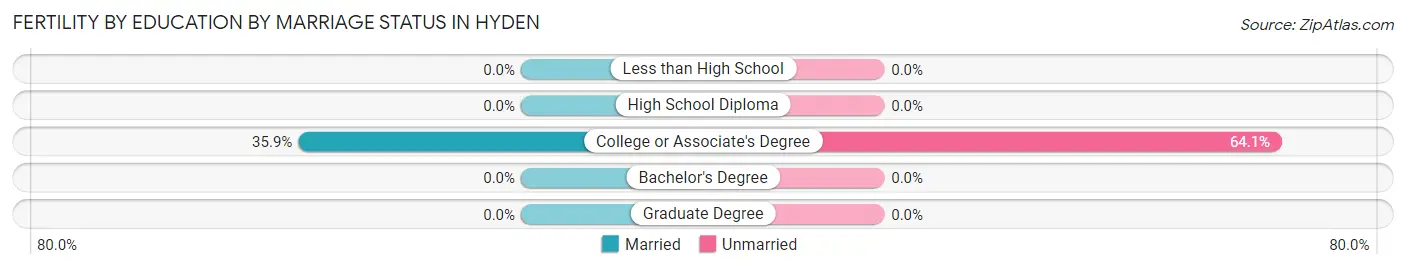
| Educational Attainment | Married | Unmarried |
| Less than High School | 0 (0.0%) | 0 (0.0%) |
| High School Diploma | 0 (0.0%) | 0 (0.0%) |
| College or Associate's Degree | 14 (35.9%) | 25 (64.1%) |
| Bachelor's Degree | 0 (0.0%) | 0 (0.0%) |
| Graduate Degree | 0 (0.0%) | 0 (0.0%) |
| Total | 14 (35.9%) | 25 (64.1%) |
Employment Characteristics in Hyden
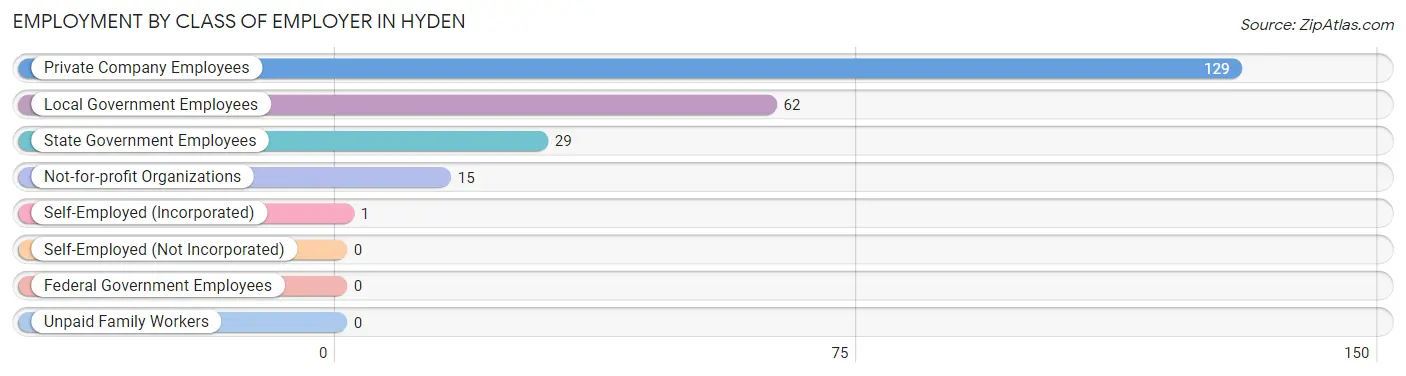
Employment by Class of Employer in Hyden
Among the 236 employed individuals in Hyden, private company employees (129 | 54.7%), local government employees (62 | 26.3%), and state government employees (29 | 12.3%) make up the most common classes of employment.
| Employer Class | # Employees | % Employees |
| Private Company Employees | 129 | 54.7% |
| Self-Employed (Incorporated) | 1 | 0.4% |
| Self-Employed (Not Incorporated) | 0 | 0.0% |
| Not-for-profit Organizations | 15 | 6.4% |
| Local Government Employees | 62 | 26.3% |
| State Government Employees | 29 | 12.3% |
| Federal Government Employees | 0 | 0.0% |
| Unpaid Family Workers | 0 | 0.0% |
| Total | 236 | 100.0% |
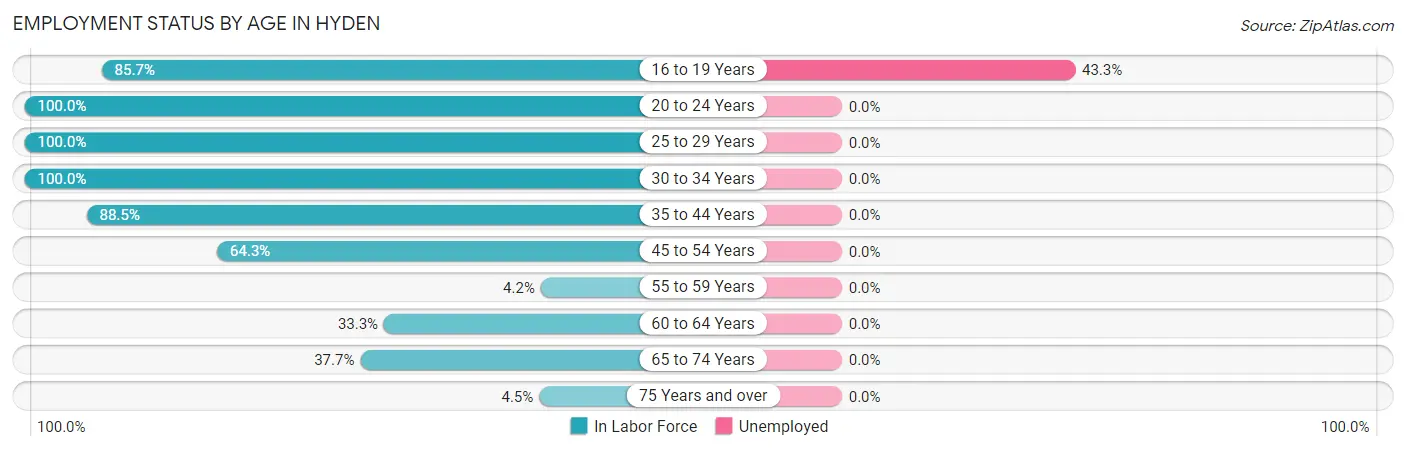
Employment Status by Age in Hyden
According to the labor force statistics for Hyden, out of the total population over 16 years of age (500), 52.4% or 262 individuals are in the labor force, with 9.9% or 26 of them unemployed. The age group with the highest labor force participation rate is 20 to 24 years, with 100.0% or 25 individuals in the labor force. Within the labor force, the 16 to 19 years age range has the highest percentage of unemployed individuals, with 43.3% or 26 of them being unemployed.
| Age Bracket | In Labor Force | Unemployed |
| 16 to 19 Years | 60 (85.7%) | 26 (43.3%) |
| 20 to 24 Years | 25 (100.0%) | 0 (0.0%) |
| 25 to 29 Years | 13 (100.0%) | 0 (0.0%) |
| 30 to 34 Years | 39 (100.0%) | 0 (0.0%) |
| 35 to 44 Years | 54 (88.5%) | 0 (0.0%) |
| 45 to 54 Years | 36 (64.3%) | 0 (0.0%) |
| 55 to 59 Years | 2 (4.2%) | 0 (0.0%) |
| 60 to 64 Years | 5 (33.3%) | 0 (0.0%) |
| 65 to 74 Years | 23 (37.7%) | 0 (0.0%) |
| 75 Years and over | 5 (4.5%) | 0 (0.0%) |
| Total | 262 (52.4%) | 26 (9.9%) |
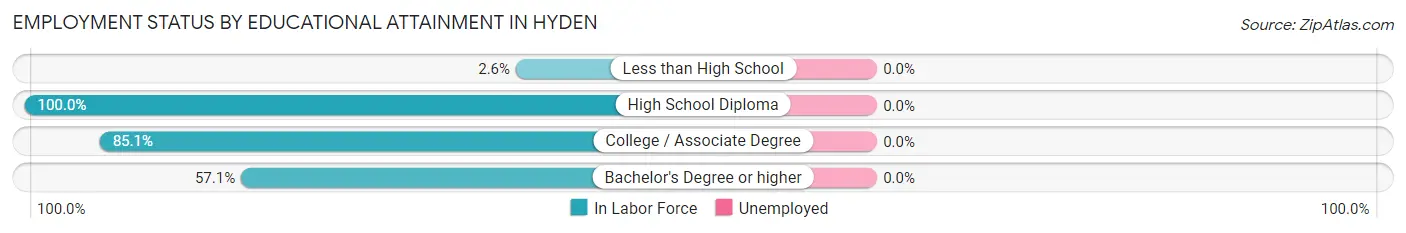
Employment Status by Educational Attainment in Hyden
| Educational Attainment | In Labor Force | Unemployed |
| Less than High School | 1 (2.6%) | 0 (0.0%) |
| High School Diploma | 30 (100.0%) | 0 (0.0%) |
| College / Associate Degree | 74 (85.1%) | 0 (0.0%) |
| Bachelor's Degree or higher | 44 (57.1%) | 0 (0.0%) |
| Total | 149 (64.2%) | 0 (0.0%) |
Employment Occupations by Sex in Hyden
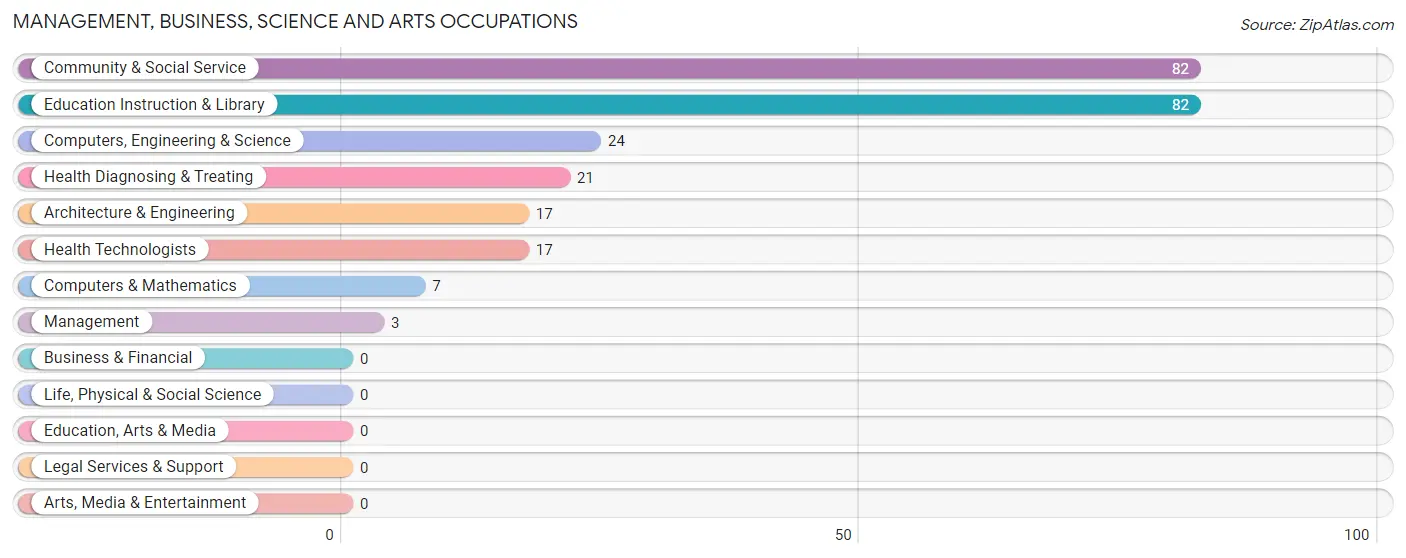
Management, Business, Science and Arts Occupations
The most common Management, Business, Science and Arts occupations in Hyden are Community & Social Service (82 | 34.7%), Education Instruction & Library (82 | 34.7%), Computers, Engineering & Science (24 | 10.2%), Health Diagnosing & Treating (21 | 8.9%), and Architecture & Engineering (17 | 7.2%).
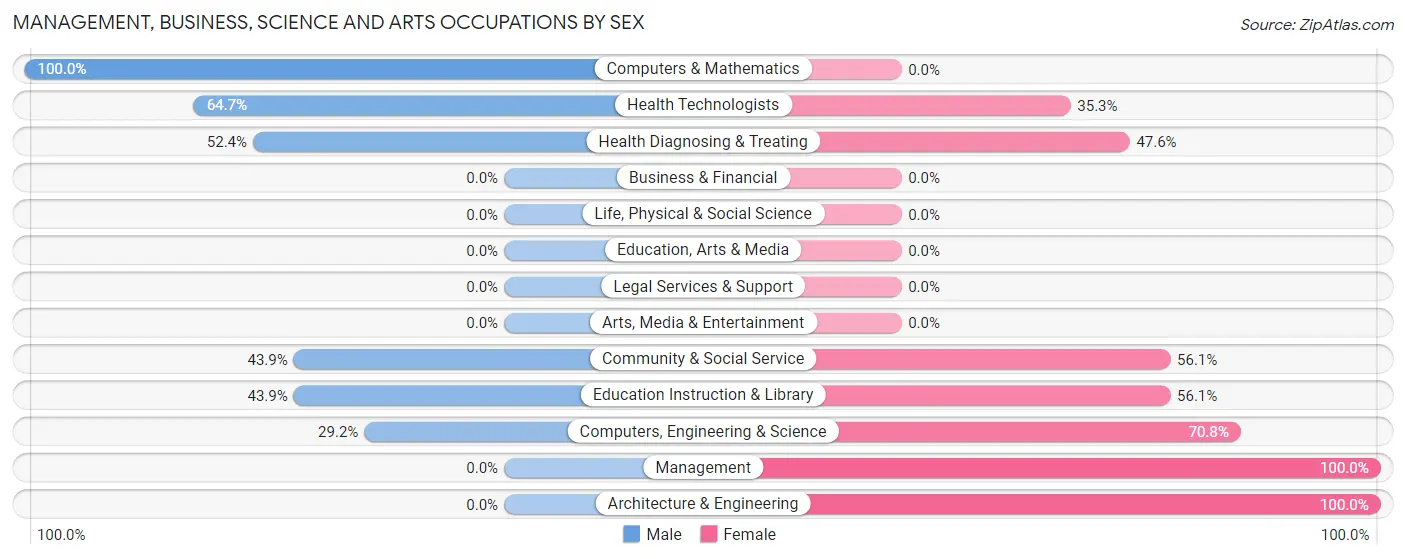
Management, Business, Science and Arts Occupations by Sex
Within the Management, Business, Science and Arts occupations in Hyden, the most male-oriented occupations are Computers & Mathematics (100.0%), Health Technologists (64.7%), and Health Diagnosing & Treating (52.4%), while the most female-oriented occupations are Management (100.0%), Architecture & Engineering (100.0%), and Computers, Engineering & Science (70.8%).
| Occupation | Male | Female |
| Management | 0 (0.0%) | 3 (100.0%) |
| Business & Financial | 0 (0.0%) | 0 (0.0%) |
| Computers, Engineering & Science | 7 (29.2%) | 17 (70.8%) |
| Computers & Mathematics | 7 (100.0%) | 0 (0.0%) |
| Architecture & Engineering | 0 (0.0%) | 17 (100.0%) |
| Life, Physical & Social Science | 0 (0.0%) | 0 (0.0%) |
| Community & Social Service | 36 (43.9%) | 46 (56.1%) |
| Education, Arts & Media | 0 (0.0%) | 0 (0.0%) |
| Legal Services & Support | 0 (0.0%) | 0 (0.0%) |
| Education Instruction & Library | 36 (43.9%) | 46 (56.1%) |
| Arts, Media & Entertainment | 0 (0.0%) | 0 (0.0%) |
| Health Diagnosing & Treating | 11 (52.4%) | 10 (47.6%) |
| Health Technologists | 11 (64.7%) | 6 (35.3%) |
| Total (Category) | 54 (41.5%) | 76 (58.5%) |
| Total (Overall) | 68 (28.8%) | 168 (71.2%) |
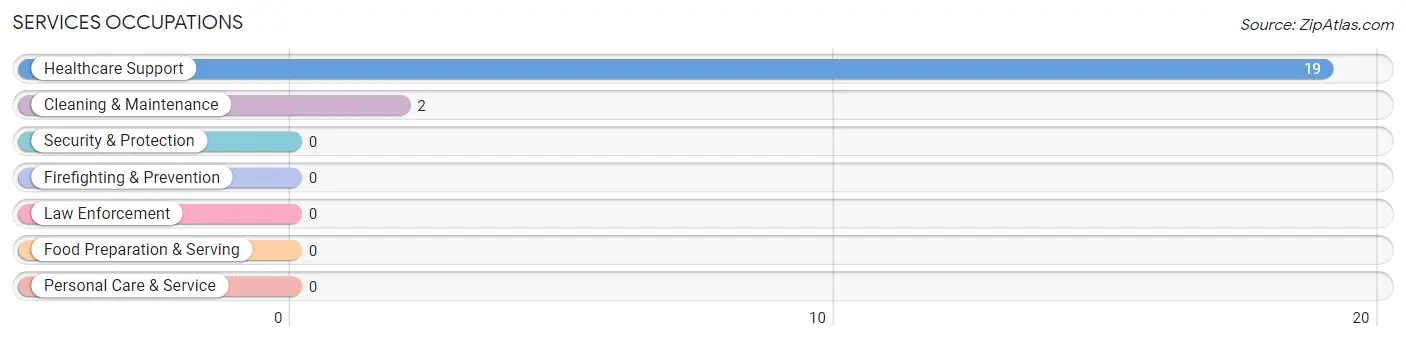
Services Occupations
The most common Services occupations in Hyden are Healthcare Support (19 | 8.1%), and Cleaning & Maintenance (2 | 0.9%).
Services Occupations by Sex
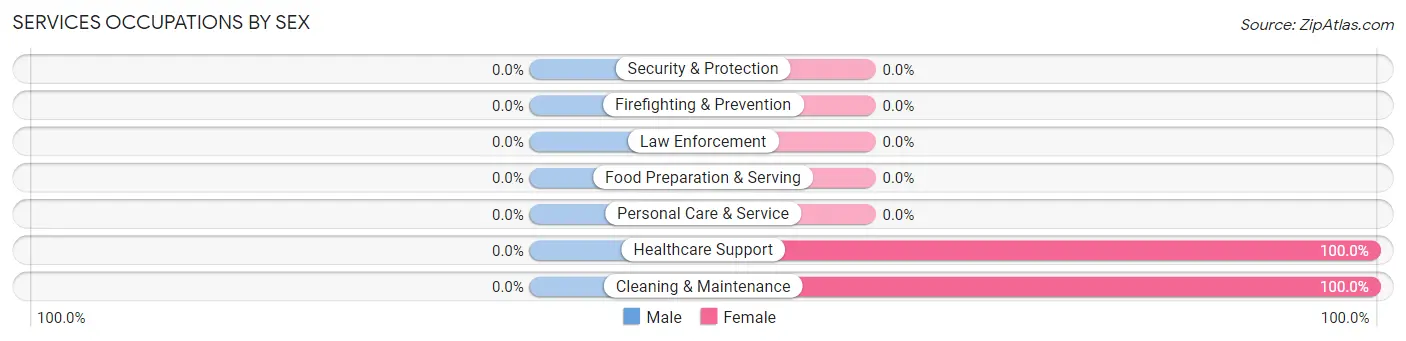
| Occupation | Male | Female |
| Healthcare Support | 0 (0.0%) | 19 (100.0%) |
| Security & Protection | 0 (0.0%) | 0 (0.0%) |
| Firefighting & Prevention | 0 (0.0%) | 0 (0.0%) |
| Law Enforcement | 0 (0.0%) | 0 (0.0%) |
| Food Preparation & Serving | 0 (0.0%) | 0 (0.0%) |
| Cleaning & Maintenance | 0 (0.0%) | 2 (100.0%) |
| Personal Care & Service | 0 (0.0%) | 0 (0.0%) |
| Total (Category) | 0 (0.0%) | 21 (100.0%) |
| Total (Overall) | 68 (28.8%) | 168 (71.2%) |
Sales and Office Occupations
The most common Sales and Office occupations in Hyden are Sales & Related (34 | 14.4%), and Office & Administration (24 | 10.2%).
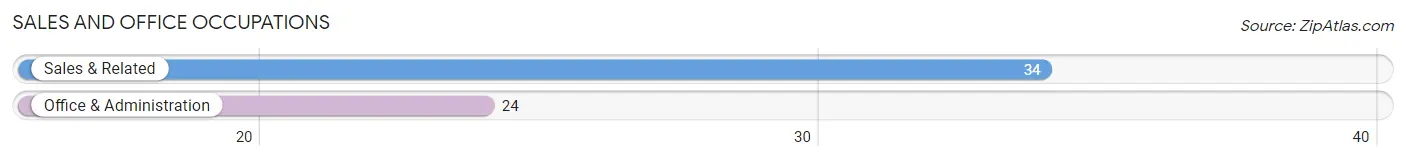
Sales and Office Occupations by Sex
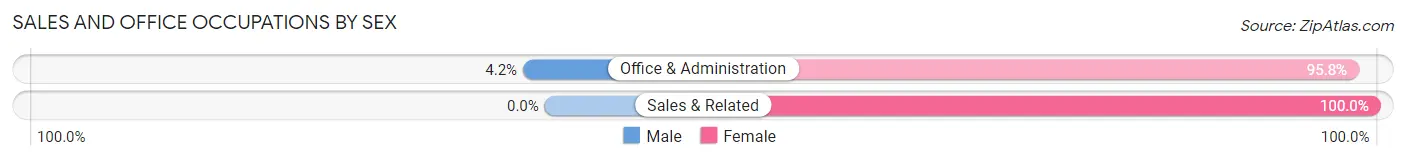
| Occupation | Male | Female |
| Sales & Related | 0 (0.0%) | 34 (100.0%) |
| Office & Administration | 1 (4.2%) | 23 (95.8%) |
| Total (Category) | 1 (1.7%) | 57 (98.3%) |
| Total (Overall) | 68 (28.8%) | 168 (71.2%) |
Natural Resources, Construction and Maintenance Occupations
The most common Natural Resources, Construction and Maintenance occupations in Hyden are , and Construction & Extraction (3 | 1.3%).
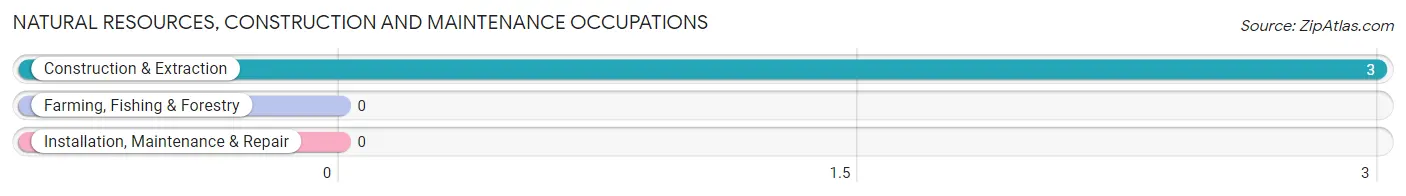
Natural Resources, Construction and Maintenance Occupations by Sex
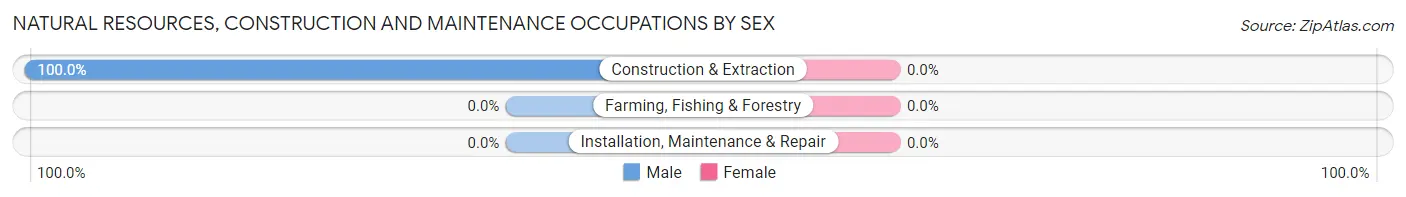
| Occupation | Male | Female |
| Farming, Fishing & Forestry | 0 (0.0%) | 0 (0.0%) |
| Construction & Extraction | 3 (100.0%) | 0 (0.0%) |
| Installation, Maintenance & Repair | 0 (0.0%) | 0 (0.0%) |
| Total (Category) | 3 (100.0%) | 0 (0.0%) |
| Total (Overall) | 68 (28.8%) | 168 (71.2%) |
Production, Transportation and Moving Occupations
The most common Production, Transportation and Moving occupations in Hyden are Transportation (18 | 7.6%), and Material Moving (6 | 2.5%).
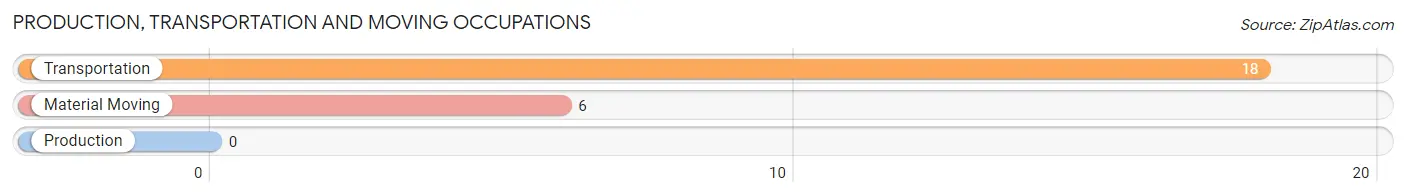
Production, Transportation and Moving Occupations by Sex
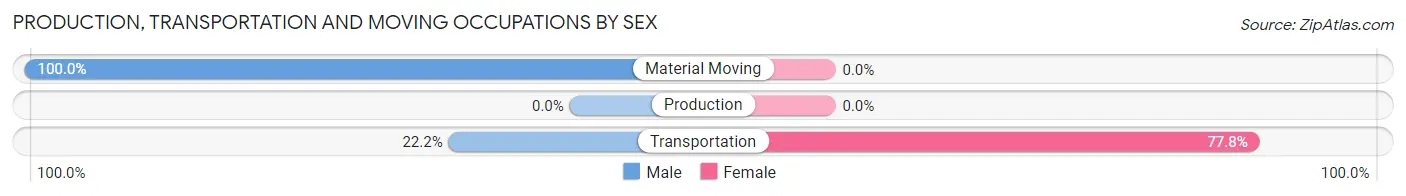
| Occupation | Male | Female |
| Production | 0 (0.0%) | 0 (0.0%) |
| Transportation | 4 (22.2%) | 14 (77.8%) |
| Material Moving | 6 (100.0%) | 0 (0.0%) |
| Total (Category) | 10 (41.7%) | 14 (58.3%) |
| Total (Overall) | 68 (28.8%) | 168 (71.2%) |
Employment Industries by Sex in Hyden
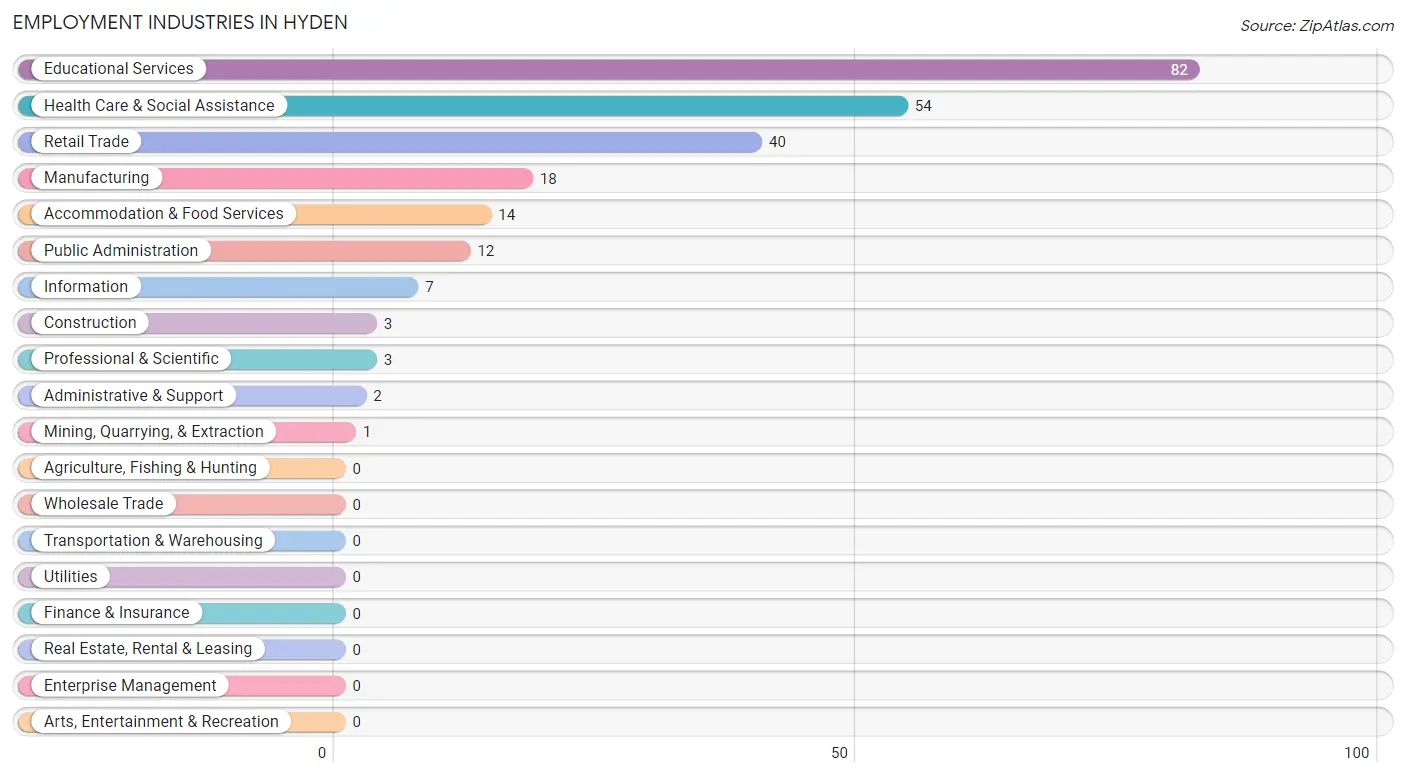
Employment Industries in Hyden
The major employment industries in Hyden include Educational Services (82 | 34.7%), Health Care & Social Assistance (54 | 22.9%), Retail Trade (40 | 17.0%), Manufacturing (18 | 7.6%), and Accommodation & Food Services (14 | 5.9%).
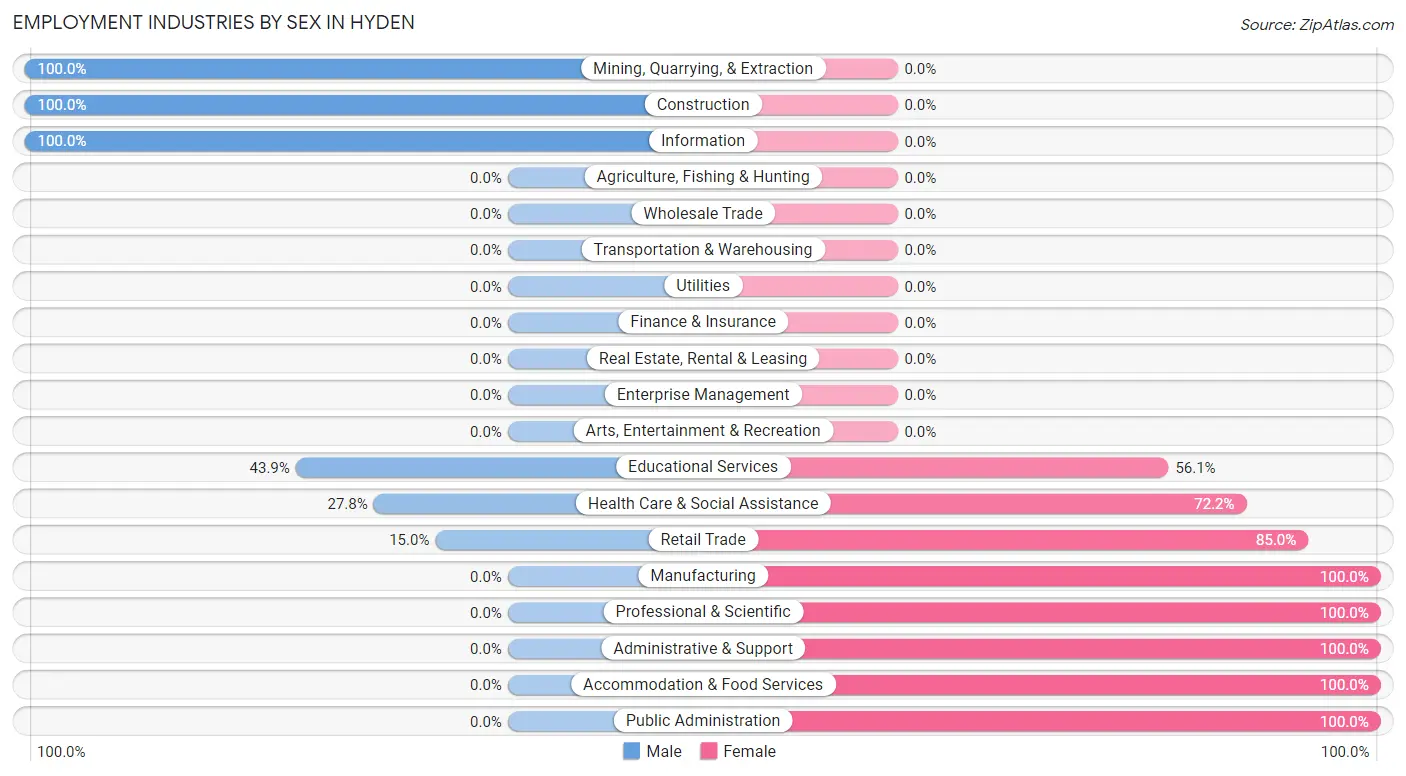
Employment Industries by Sex in Hyden
The Hyden industries that see more men than women are Mining, Quarrying, & Extraction (100.0%), Construction (100.0%), and Information (100.0%), whereas the industries that tend to have a higher number of women are Manufacturing (100.0%), Professional & Scientific (100.0%), and Administrative & Support (100.0%).
| Industry | Male | Female |
| Agriculture, Fishing & Hunting | 0 (0.0%) | 0 (0.0%) |
| Mining, Quarrying, & Extraction | 1 (100.0%) | 0 (0.0%) |
| Construction | 3 (100.0%) | 0 (0.0%) |
| Manufacturing | 0 (0.0%) | 18 (100.0%) |
| Wholesale Trade | 0 (0.0%) | 0 (0.0%) |
| Retail Trade | 6 (15.0%) | 34 (85.0%) |
| Transportation & Warehousing | 0 (0.0%) | 0 (0.0%) |
| Utilities | 0 (0.0%) | 0 (0.0%) |
| Information | 7 (100.0%) | 0 (0.0%) |
| Finance & Insurance | 0 (0.0%) | 0 (0.0%) |
| Real Estate, Rental & Leasing | 0 (0.0%) | 0 (0.0%) |
| Professional & Scientific | 0 (0.0%) | 3 (100.0%) |
| Enterprise Management | 0 (0.0%) | 0 (0.0%) |
| Administrative & Support | 0 (0.0%) | 2 (100.0%) |
| Educational Services | 36 (43.9%) | 46 (56.1%) |
| Health Care & Social Assistance | 15 (27.8%) | 39 (72.2%) |
| Arts, Entertainment & Recreation | 0 (0.0%) | 0 (0.0%) |
| Accommodation & Food Services | 0 (0.0%) | 14 (100.0%) |
| Public Administration | 0 (0.0%) | 12 (100.0%) |
| Total | 68 (28.8%) | 168 (71.2%) |
Education in Hyden
School Enrollment in Hyden
The most common levels of schooling among the 96 students in Hyden are college / undergraduate (30 | 31.2%), high school (28 | 29.2%), and middle school (24 | 25.0%).
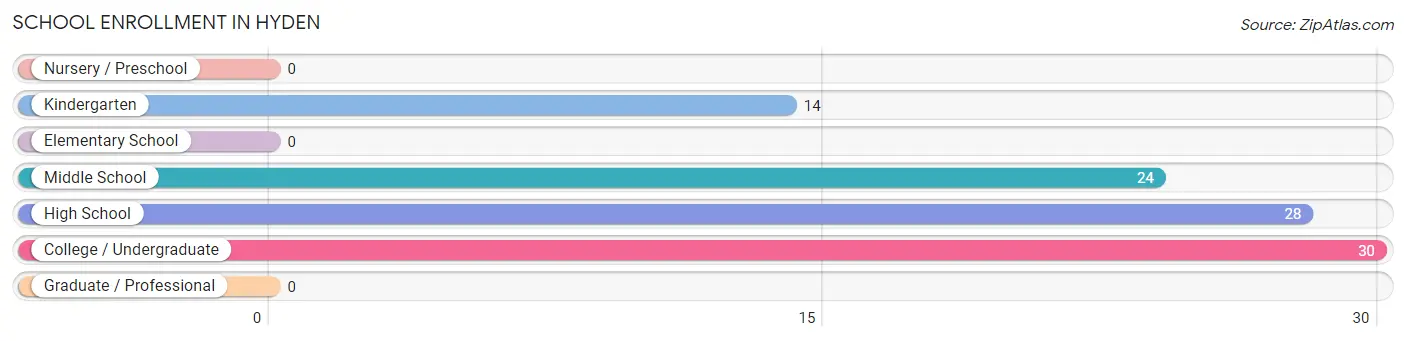
| School Level | # Students | % Students |
| Nursery / Preschool | 0 | 0.0% |
| Kindergarten | 14 | 14.6% |
| Elementary School | 0 | 0.0% |
| Middle School | 24 | 25.0% |
| High School | 28 | 29.2% |
| College / Undergraduate | 30 | 31.2% |
| Graduate / Professional | 0 | 0.0% |
| Total | 96 | 100.0% |
School Enrollment by Age by Funding Source in Hyden
Out of a total of 96 students who are enrolled in schools in Hyden, 8 (8.3%) attend a private institution, while the remaining 88 (91.7%) are enrolled in public schools. The age group of 20 to 24 year olds has the highest likelihood of being enrolled in private schools, with 8 (36.4% in the age bracket) enrolled. Conversely, the age group of 5 to 9 year old has the lowest likelihood of being enrolled in a private school, with 14 (100.0% in the age bracket) attending a public institution.
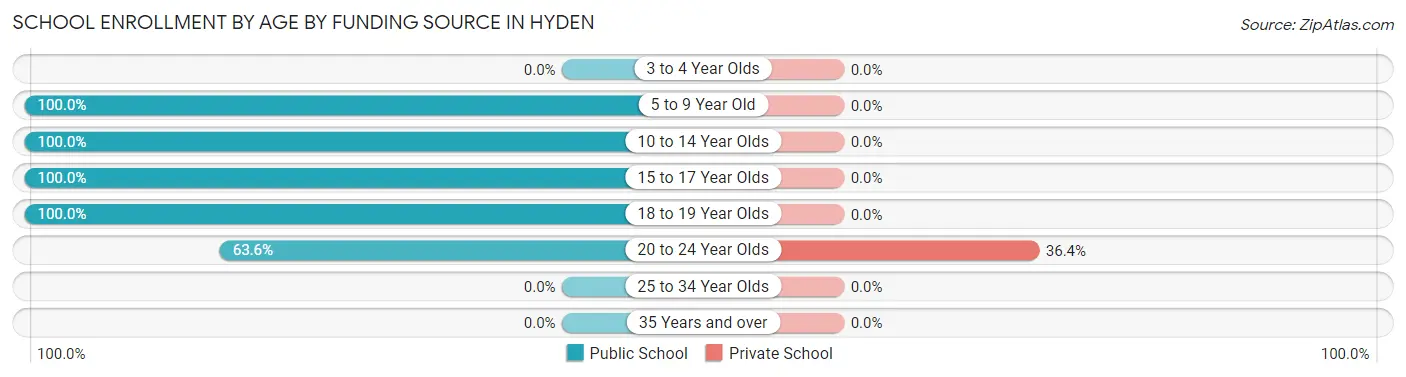
| Age Bracket | Public School | Private School |
| 3 to 4 Year Olds | 0 (0.0%) | 0 (0.0%) |
| 5 to 9 Year Old | 14 (100.0%) | 0 (0.0%) |
| 10 to 14 Year Olds | 24 (100.0%) | 0 (0.0%) |
| 15 to 17 Year Olds | 28 (100.0%) | 0 (0.0%) |
| 18 to 19 Year Olds | 8 (100.0%) | 0 (0.0%) |
| 20 to 24 Year Olds | 14 (63.6%) | 8 (36.4%) |
| 25 to 34 Year Olds | 0 (0.0%) | 0 (0.0%) |
| 35 Years and over | 0 (0.0%) | 0 (0.0%) |
| Total | 88 (91.7%) | 8 (8.3%) |
Educational Attainment by Field of Study in Hyden
Education (61 | 38.9%), business (27 | 17.2%), science & technology (21 | 13.4%), social sciences (18 | 11.5%), and literature & languages (13 | 8.3%) are the most common fields of study among 157 individuals in Hyden who have obtained a bachelor's degree or higher.
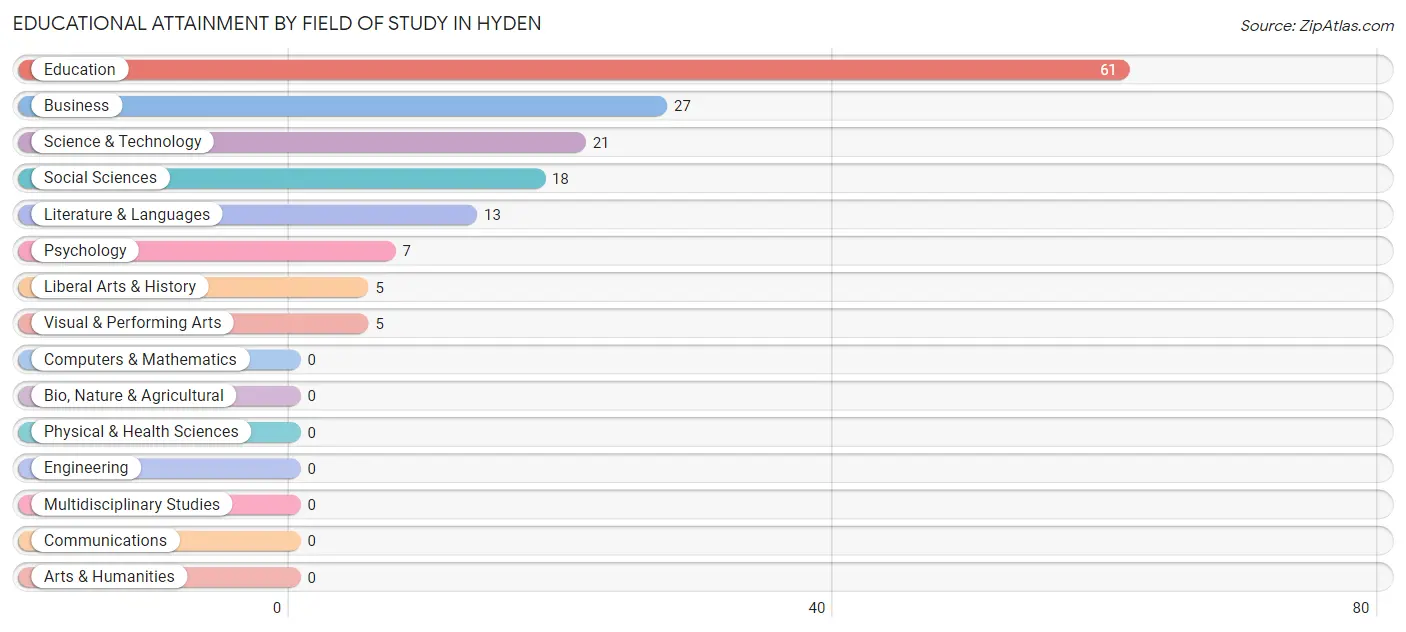
| Field of Study | # Graduates | % Graduates |
| Computers & Mathematics | 0 | 0.0% |
| Bio, Nature & Agricultural | 0 | 0.0% |
| Physical & Health Sciences | 0 | 0.0% |
| Psychology | 7 | 4.5% |
| Social Sciences | 18 | 11.5% |
| Engineering | 0 | 0.0% |
| Multidisciplinary Studies | 0 | 0.0% |
| Science & Technology | 21 | 13.4% |
| Business | 27 | 17.2% |
| Education | 61 | 38.9% |
| Literature & Languages | 13 | 8.3% |
| Liberal Arts & History | 5 | 3.2% |
| Visual & Performing Arts | 5 | 3.2% |
| Communications | 0 | 0.0% |
| Arts & Humanities | 0 | 0.0% |
| Total | 157 | 100.0% |
Transportation & Commute in Hyden
Vehicle Availability by Sex in Hyden
The most prevalent vehicle ownership categories in Hyden are males with 2 vehicles (54, accounting for 79.4%) and females with 2 vehicles (101, making up 33.8%).
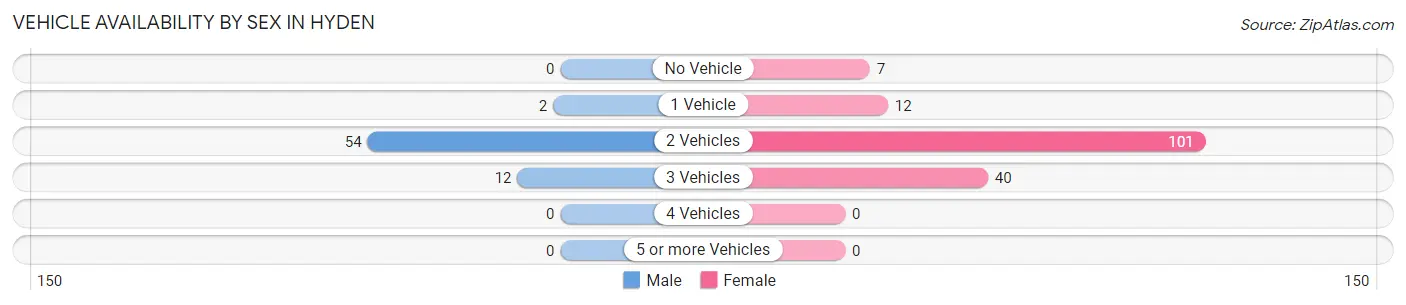
| Vehicles Available | Male | Female |
| No Vehicle | 0 (0.0%) | 7 (4.4%) |
| 1 Vehicle | 2 (2.9%) | 12 (7.5%) |
| 2 Vehicles | 54 (79.4%) | 101 (63.1%) |
| 3 Vehicles | 12 (17.6%) | 40 (25.0%) |
| 4 Vehicles | 0 (0.0%) | 0 (0.0%) |
| 5 or more Vehicles | 0 (0.0%) | 0 (0.0%) |
| Total | 68 (100.0%) | 160 (100.0%) |
Commute Time in Hyden
The most frequently occuring commute durations in Hyden are less than 5 minutes (64 commuters, 28.3%), 5 to 9 minutes (61 commuters, 27.0%), and 60 to 89 minutes (34 commuters, 15.0%).
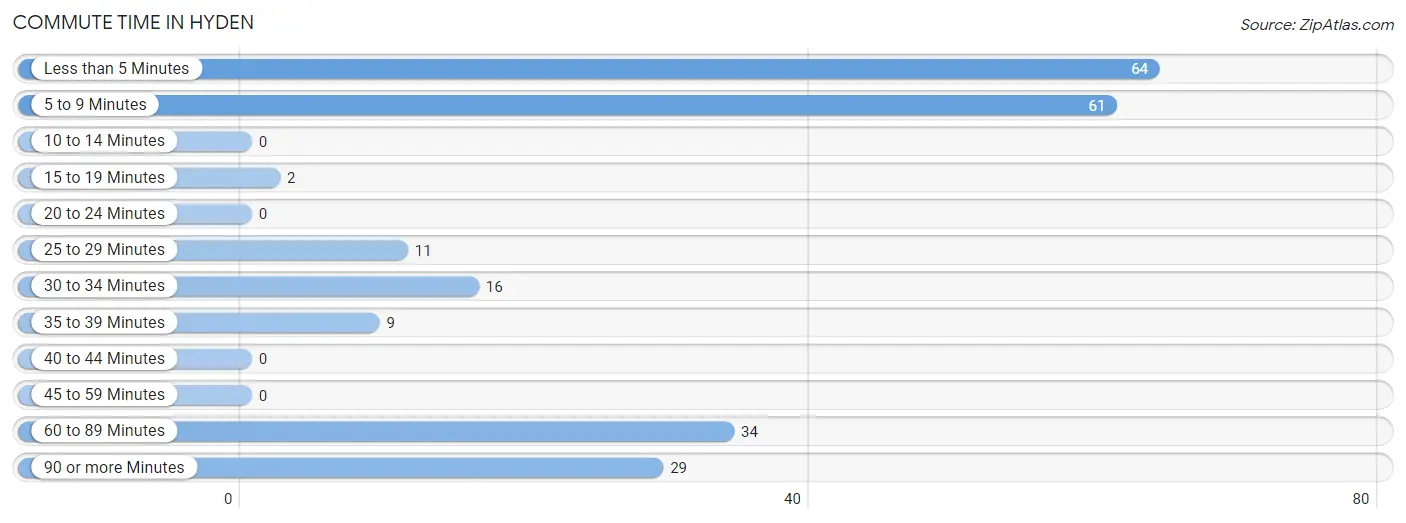
| Commute Time | # Commuters | % Commuters |
| Less than 5 Minutes | 64 | 28.3% |
| 5 to 9 Minutes | 61 | 27.0% |
| 10 to 14 Minutes | 0 | 0.0% |
| 15 to 19 Minutes | 2 | 0.9% |
| 20 to 24 Minutes | 0 | 0.0% |
| 25 to 29 Minutes | 11 | 4.9% |
| 30 to 34 Minutes | 16 | 7.1% |
| 35 to 39 Minutes | 9 | 4.0% |
| 40 to 44 Minutes | 0 | 0.0% |
| 45 to 59 Minutes | 0 | 0.0% |
| 60 to 89 Minutes | 34 | 15.0% |
| 90 or more Minutes | 29 | 12.8% |
Commute Time by Sex in Hyden
The most common commute times in Hyden are less than 5 minutes (24 commuters, 35.3%) for males and less than 5 minutes (40 commuters, 25.3%) for females.
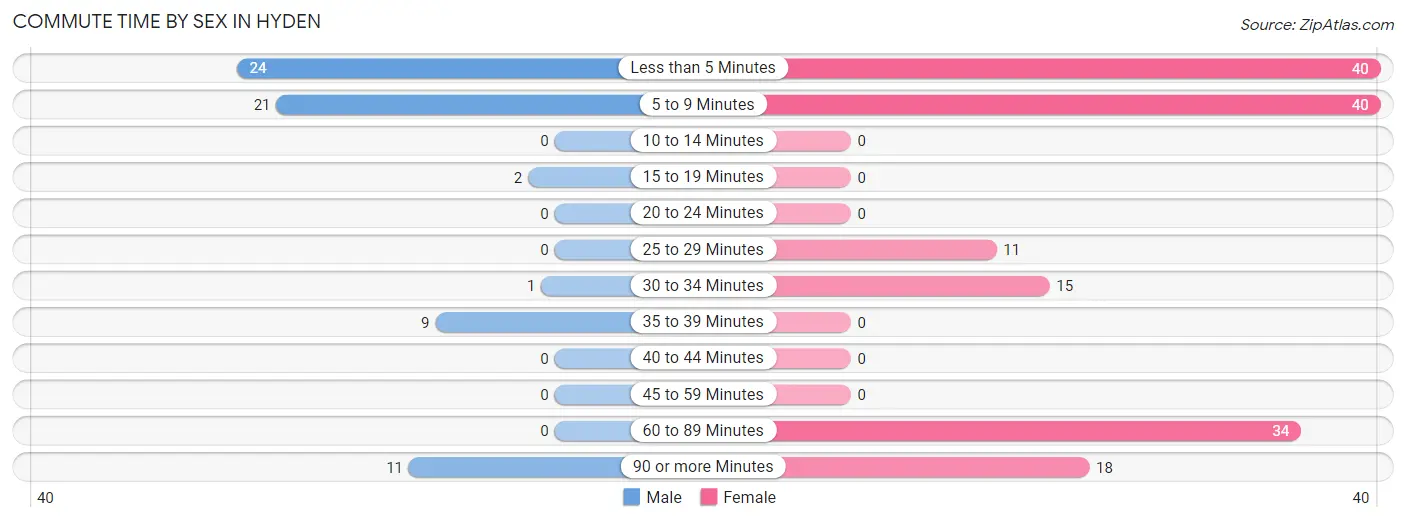
| Commute Time | Male | Female |
| Less than 5 Minutes | 24 (35.3%) | 40 (25.3%) |
| 5 to 9 Minutes | 21 (30.9%) | 40 (25.3%) |
| 10 to 14 Minutes | 0 (0.0%) | 0 (0.0%) |
| 15 to 19 Minutes | 2 (2.9%) | 0 (0.0%) |
| 20 to 24 Minutes | 0 (0.0%) | 0 (0.0%) |
| 25 to 29 Minutes | 0 (0.0%) | 11 (7.0%) |
| 30 to 34 Minutes | 1 (1.5%) | 15 (9.5%) |
| 35 to 39 Minutes | 9 (13.2%) | 0 (0.0%) |
| 40 to 44 Minutes | 0 (0.0%) | 0 (0.0%) |
| 45 to 59 Minutes | 0 (0.0%) | 0 (0.0%) |
| 60 to 89 Minutes | 0 (0.0%) | 34 (21.5%) |
| 90 or more Minutes | 11 (16.2%) | 18 (11.4%) |
Time of Departure to Work by Sex in Hyden
The most frequent times of departure to work in Hyden are 7:30 AM to 7:59 AM (27, 39.7%) for males and 7:30 AM to 7:59 AM (42, 26.6%) for females.
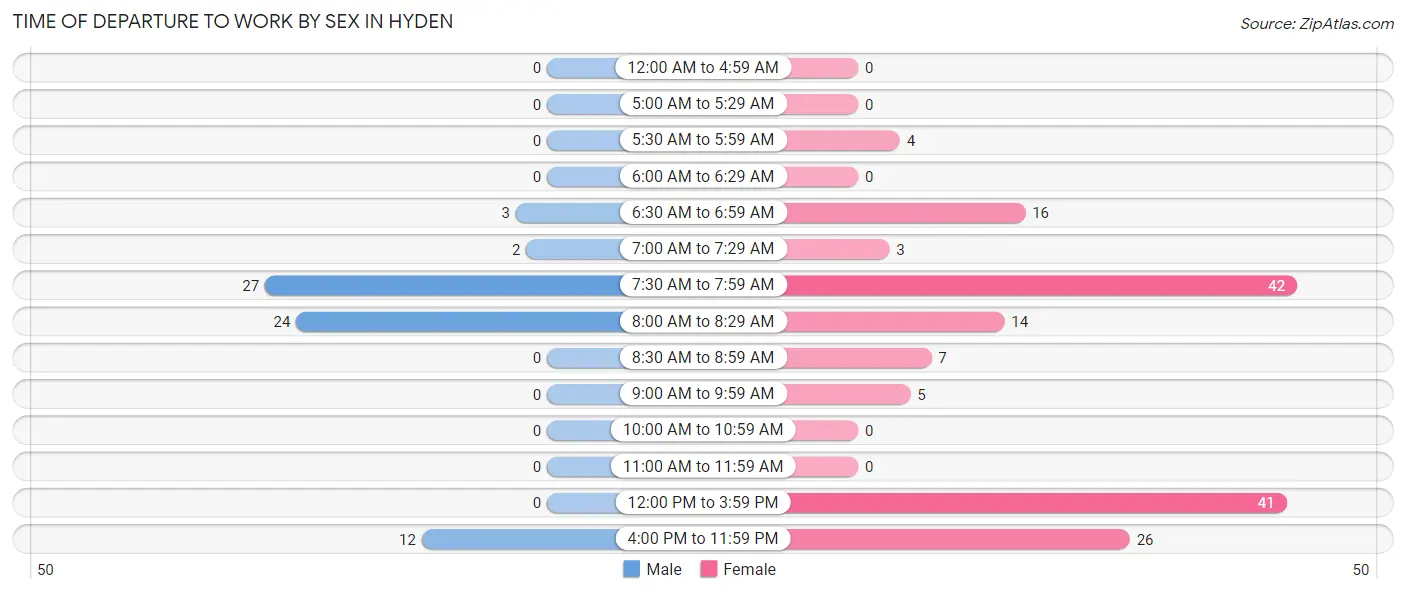
| Time of Departure | Male | Female |
| 12:00 AM to 4:59 AM | 0 (0.0%) | 0 (0.0%) |
| 5:00 AM to 5:29 AM | 0 (0.0%) | 0 (0.0%) |
| 5:30 AM to 5:59 AM | 0 (0.0%) | 4 (2.5%) |
| 6:00 AM to 6:29 AM | 0 (0.0%) | 0 (0.0%) |
| 6:30 AM to 6:59 AM | 3 (4.4%) | 16 (10.1%) |
| 7:00 AM to 7:29 AM | 2 (2.9%) | 3 (1.9%) |
| 7:30 AM to 7:59 AM | 27 (39.7%) | 42 (26.6%) |
| 8:00 AM to 8:29 AM | 24 (35.3%) | 14 (8.9%) |
| 8:30 AM to 8:59 AM | 0 (0.0%) | 7 (4.4%) |
| 9:00 AM to 9:59 AM | 0 (0.0%) | 5 (3.2%) |
| 10:00 AM to 10:59 AM | 0 (0.0%) | 0 (0.0%) |
| 11:00 AM to 11:59 AM | 0 (0.0%) | 0 (0.0%) |
| 12:00 PM to 3:59 PM | 0 (0.0%) | 41 (26.0%) |
| 4:00 PM to 11:59 PM | 12 (17.6%) | 26 (16.5%) |
| Total | 68 (100.0%) | 158 (100.0%) |
Housing Occupancy in Hyden
Occupancy by Ownership in Hyden
Of the total 194 dwellings in Hyden, owner-occupied units account for 121 (62.4%), while renter-occupied units make up 73 (37.6%).
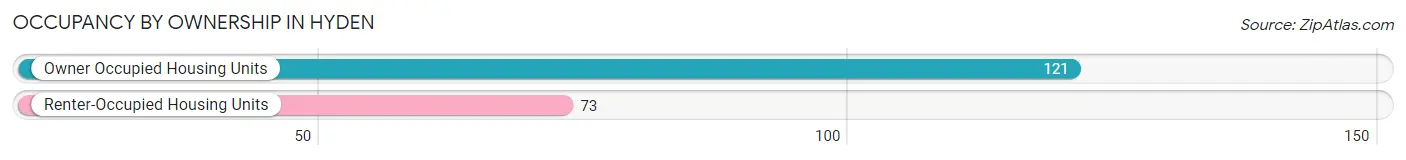
| Occupancy | # Housing Units | % Housing Units |
| Owner Occupied Housing Units | 121 | 62.4% |
| Renter-Occupied Housing Units | 73 | 37.6% |
| Total Occupied Housing Units | 194 | 100.0% |
Occupancy by Household Size in Hyden
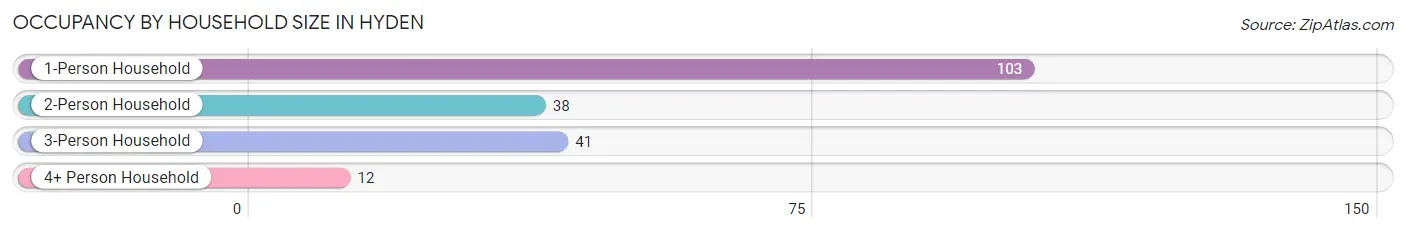
| Household Size | # Housing Units | % Housing Units |
| 1-Person Household | 103 | 53.1% |
| 2-Person Household | 38 | 19.6% |
| 3-Person Household | 41 | 21.1% |
| 4+ Person Household | 12 | 6.2% |
| Total Housing Units | 194 | 100.0% |
Occupancy by Ownership by Household Size in Hyden
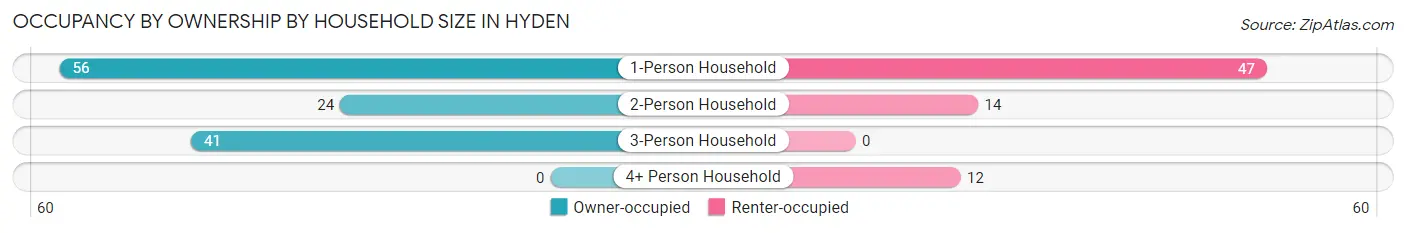
| Household Size | Owner-occupied | Renter-occupied |
| 1-Person Household | 56 (54.4%) | 47 (45.6%) |
| 2-Person Household | 24 (63.2%) | 14 (36.8%) |
| 3-Person Household | 41 (100.0%) | 0 (0.0%) |
| 4+ Person Household | 0 (0.0%) | 12 (100.0%) |
| Total Housing Units | 121 (62.4%) | 73 (37.6%) |
Occupancy by Educational Attainment in Hyden
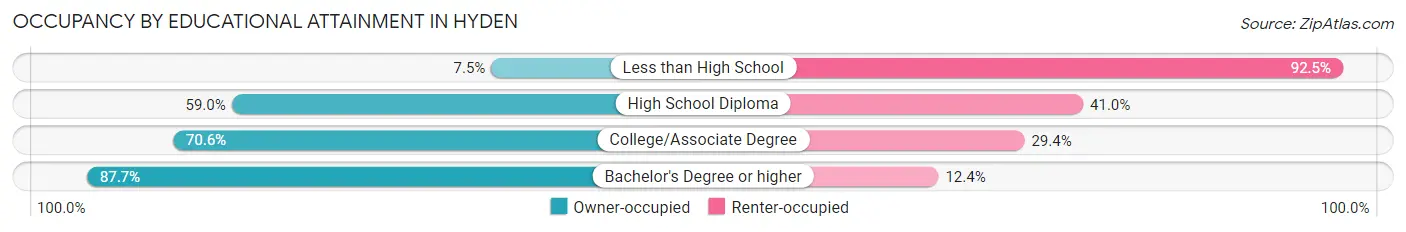
| Household Size | Owner-occupied | Renter-occupied |
| Less than High School | 3 (7.5%) | 37 (92.5%) |
| High School Diploma | 23 (59.0%) | 16 (41.0%) |
| College/Associate Degree | 24 (70.6%) | 10 (29.4%) |
| Bachelor's Degree or higher | 71 (87.6%) | 10 (12.3%) |
Occupancy by Age of Householder in Hyden
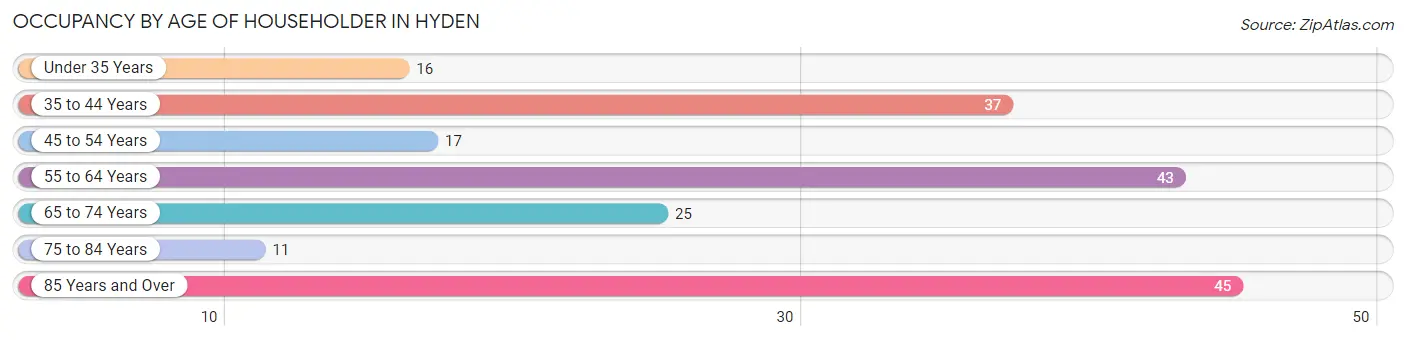
| Age Bracket | # Households | % Households |
| Under 35 Years | 16 | 8.3% |
| 35 to 44 Years | 37 | 19.1% |
| 45 to 54 Years | 17 | 8.8% |
| 55 to 64 Years | 43 | 22.2% |
| 65 to 74 Years | 25 | 12.9% |
| 75 to 84 Years | 11 | 5.7% |
| 85 Years and Over | 45 | 23.2% |
| Total | 194 | 100.0% |
Housing Finances in Hyden
Median Income by Occupancy in Hyden
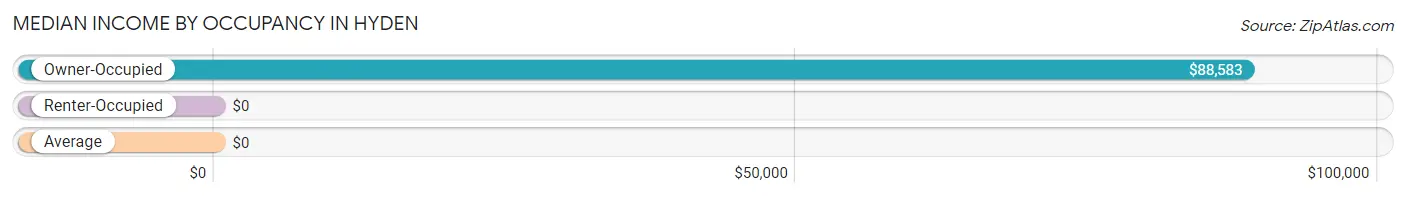
| Occupancy Type | # Households | Median Income |
| Owner-Occupied | 121 (62.4%) | $88,583 |
| Renter-Occupied | 73 (37.6%) | $0 |
| Average | 194 (100.0%) | $0 |
Occupancy by Householder Income Bracket in Hyden
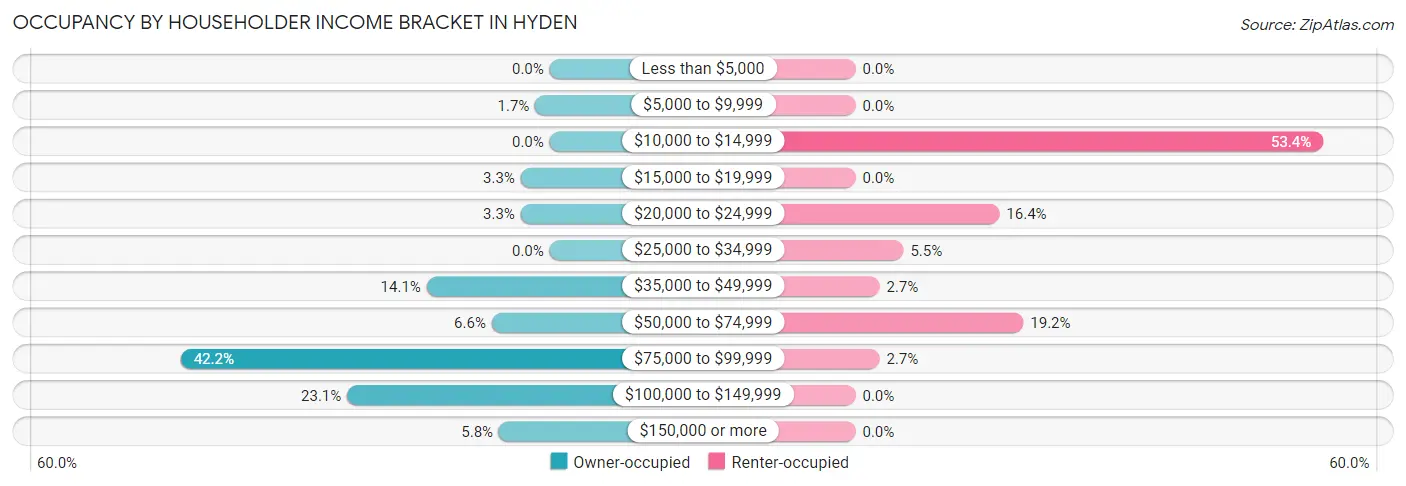
| Income Bracket | Owner-occupied | Renter-occupied |
| Less than $5,000 | 0 (0.0%) | 0 (0.0%) |
| $5,000 to $9,999 | 2 (1.7%) | 0 (0.0%) |
| $10,000 to $14,999 | 0 (0.0%) | 39 (53.4%) |
| $15,000 to $19,999 | 4 (3.3%) | 0 (0.0%) |
| $20,000 to $24,999 | 4 (3.3%) | 12 (16.4%) |
| $25,000 to $34,999 | 0 (0.0%) | 4 (5.5%) |
| $35,000 to $49,999 | 17 (14.1%) | 2 (2.7%) |
| $50,000 to $74,999 | 8 (6.6%) | 14 (19.2%) |
| $75,000 to $99,999 | 51 (42.1%) | 2 (2.7%) |
| $100,000 to $149,999 | 28 (23.1%) | 0 (0.0%) |
| $150,000 or more | 7 (5.8%) | 0 (0.0%) |
| Total | 121 (100.0%) | 73 (100.0%) |
Monthly Housing Cost Tiers in Hyden
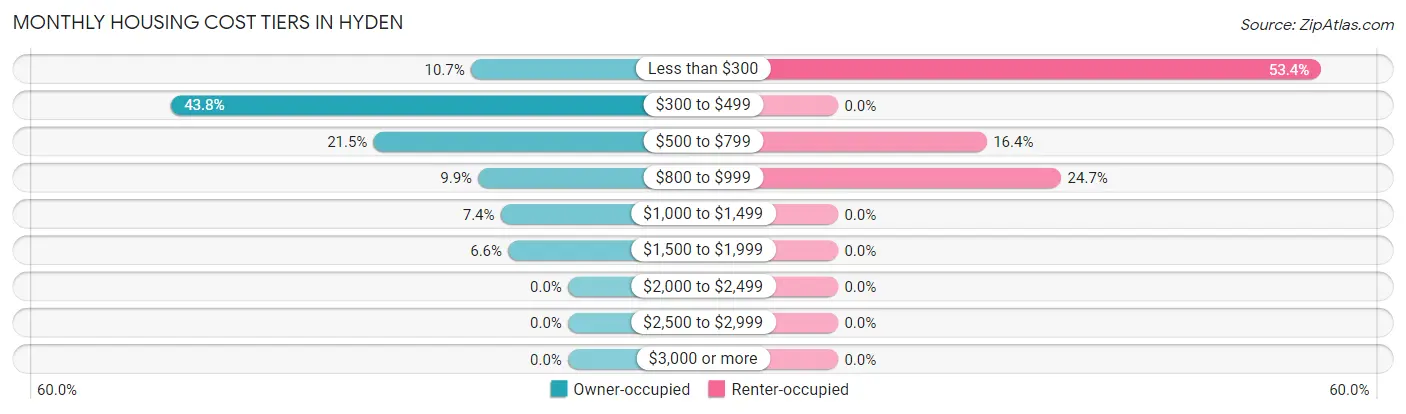
| Monthly Cost | Owner-occupied | Renter-occupied |
| Less than $300 | 13 (10.7%) | 39 (53.4%) |
| $300 to $499 | 53 (43.8%) | 0 (0.0%) |
| $500 to $799 | 26 (21.5%) | 12 (16.4%) |
| $800 to $999 | 12 (9.9%) | 18 (24.7%) |
| $1,000 to $1,499 | 9 (7.4%) | 0 (0.0%) |
| $1,500 to $1,999 | 8 (6.6%) | 0 (0.0%) |
| $2,000 to $2,499 | 0 (0.0%) | 0 (0.0%) |
| $2,500 to $2,999 | 0 (0.0%) | 0 (0.0%) |
| $3,000 or more | 0 (0.0%) | 0 (0.0%) |
| Total | 121 (100.0%) | 73 (100.0%) |
Physical Housing Characteristics in Hyden
Housing Structures in Hyden
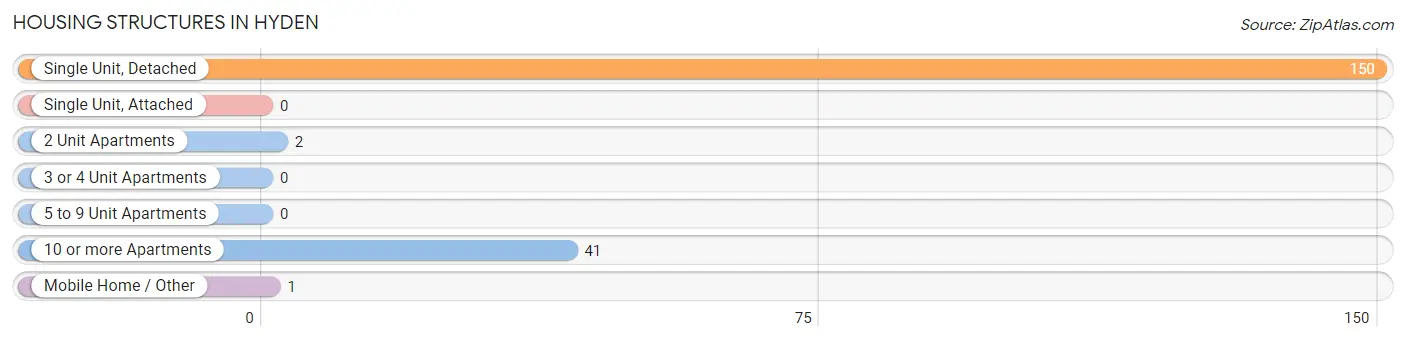
| Structure Type | # Housing Units | % Housing Units |
| Single Unit, Detached | 150 | 77.3% |
| Single Unit, Attached | 0 | 0.0% |
| 2 Unit Apartments | 2 | 1.0% |
| 3 or 4 Unit Apartments | 0 | 0.0% |
| 5 to 9 Unit Apartments | 0 | 0.0% |
| 10 or more Apartments | 41 | 21.1% |
| Mobile Home / Other | 1 | 0.5% |
| Total | 194 | 100.0% |
Housing Structures by Occupancy in Hyden
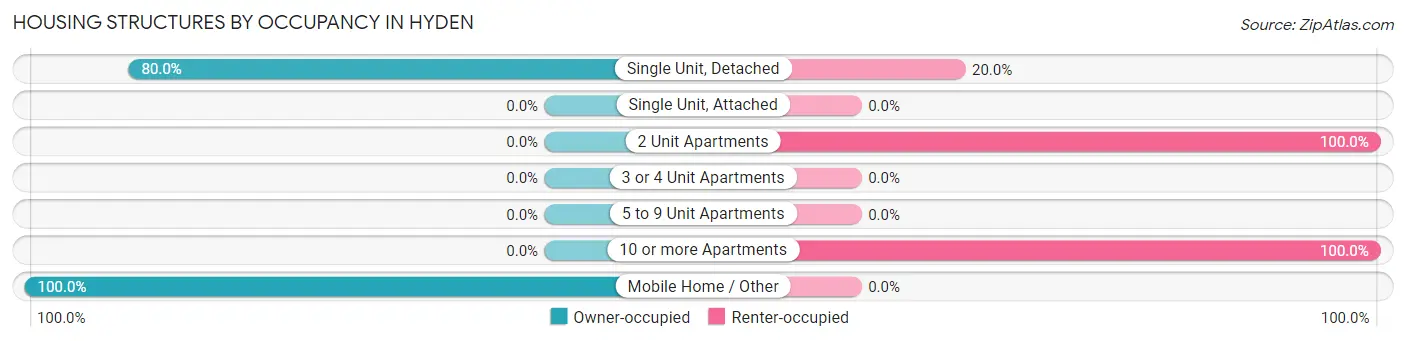
| Structure Type | Owner-occupied | Renter-occupied |
| Single Unit, Detached | 120 (80.0%) | 30 (20.0%) |
| Single Unit, Attached | 0 (0.0%) | 0 (0.0%) |
| 2 Unit Apartments | 0 (0.0%) | 2 (100.0%) |
| 3 or 4 Unit Apartments | 0 (0.0%) | 0 (0.0%) |
| 5 to 9 Unit Apartments | 0 (0.0%) | 0 (0.0%) |
| 10 or more Apartments | 0 (0.0%) | 41 (100.0%) |
| Mobile Home / Other | 1 (100.0%) | 0 (0.0%) |
| Total | 121 (62.4%) | 73 (37.6%) |
Housing Structures by Number of Rooms in Hyden
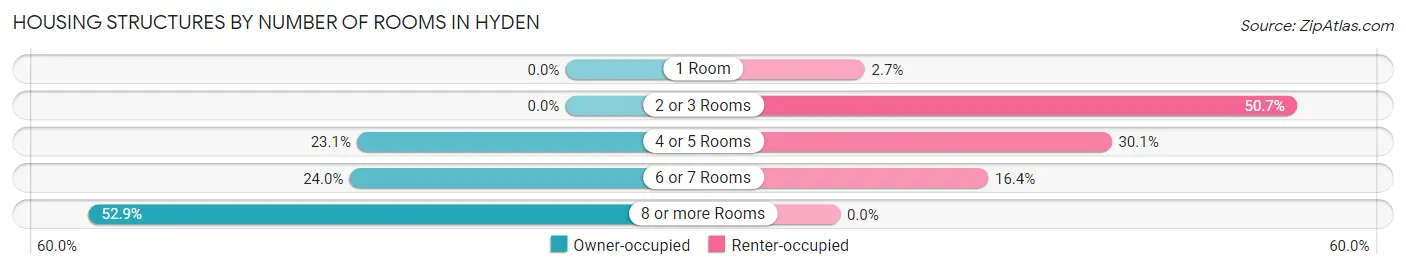
| Number of Rooms | Owner-occupied | Renter-occupied |
| 1 Room | 0 (0.0%) | 2 (2.7%) |
| 2 or 3 Rooms | 0 (0.0%) | 37 (50.7%) |
| 4 or 5 Rooms | 28 (23.1%) | 22 (30.1%) |
| 6 or 7 Rooms | 29 (24.0%) | 12 (16.4%) |
| 8 or more Rooms | 64 (52.9%) | 0 (0.0%) |
| Total | 121 (100.0%) | 73 (100.0%) |
Housing Structure by Heating Type in Hyden
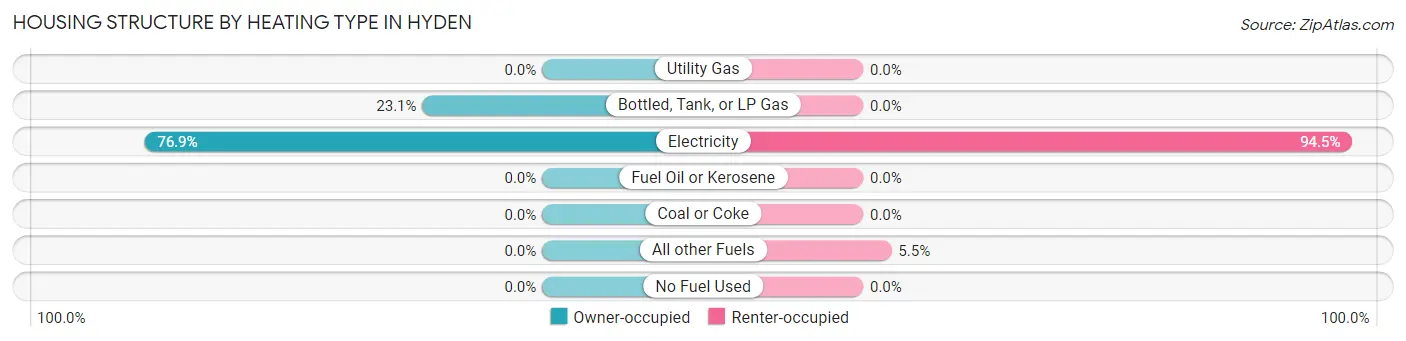
| Heating Type | Owner-occupied | Renter-occupied |
| Utility Gas | 0 (0.0%) | 0 (0.0%) |
| Bottled, Tank, or LP Gas | 28 (23.1%) | 0 (0.0%) |
| Electricity | 93 (76.9%) | 69 (94.5%) |
| Fuel Oil or Kerosene | 0 (0.0%) | 0 (0.0%) |
| Coal or Coke | 0 (0.0%) | 0 (0.0%) |
| All other Fuels | 0 (0.0%) | 4 (5.5%) |
| No Fuel Used | 0 (0.0%) | 0 (0.0%) |
| Total | 121 (100.0%) | 73 (100.0%) |
Household Vehicle Usage in Hyden
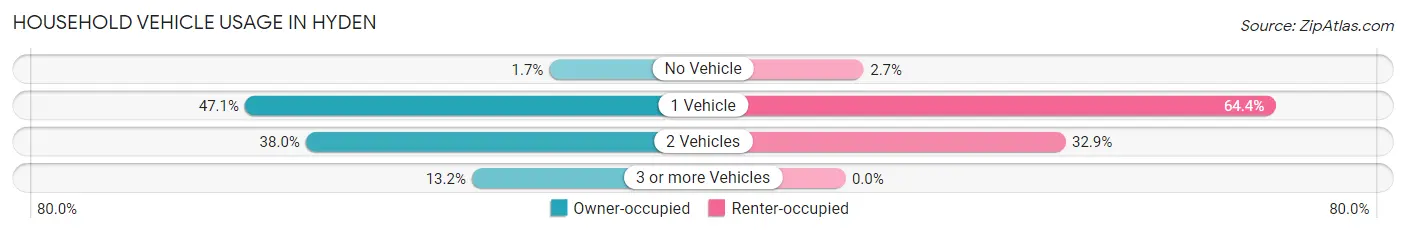
| Vehicles per Household | Owner-occupied | Renter-occupied |
| No Vehicle | 2 (1.7%) | 2 (2.7%) |
| 1 Vehicle | 57 (47.1%) | 47 (64.4%) |
| 2 Vehicles | 46 (38.0%) | 24 (32.9%) |
| 3 or more Vehicles | 16 (13.2%) | 0 (0.0%) |
| Total | 121 (100.0%) | 73 (100.0%) |
Real Estate & Mortgages in Hyden
Real Estate and Mortgage Overview in Hyden
| Characteristic | Without Mortgage | With Mortgage |
| Housing Units | 73 | 48 |
| Median Property Value | $93,200 | $95,800 |
| Median Household Income | $88,417 | $0 |
| Monthly Housing Costs | $434 | $0 |
| Real Estate Taxes | $667 | $2 |
Property Value by Mortgage Status in Hyden
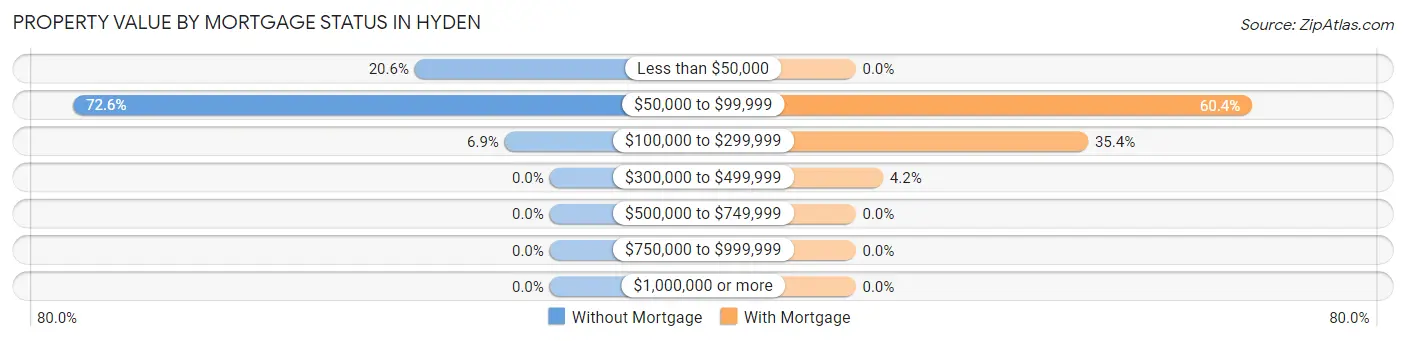
| Property Value | Without Mortgage | With Mortgage |
| Less than $50,000 | 15 (20.5%) | 0 (0.0%) |
| $50,000 to $99,999 | 53 (72.6%) | 29 (60.4%) |
| $100,000 to $299,999 | 5 (6.9%) | 17 (35.4%) |
| $300,000 to $499,999 | 0 (0.0%) | 2 (4.2%) |
| $500,000 to $749,999 | 0 (0.0%) | 0 (0.0%) |
| $750,000 to $999,999 | 0 (0.0%) | 0 (0.0%) |
| $1,000,000 or more | 0 (0.0%) | 0 (0.0%) |
| Total | 73 (100.0%) | 48 (100.0%) |
Household Income by Mortgage Status in Hyden
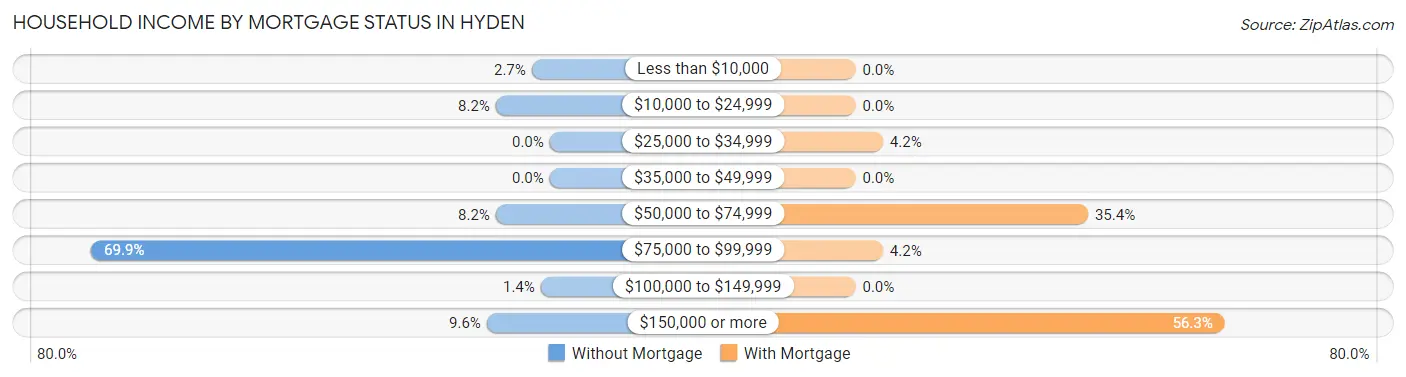
| Household Income | Without Mortgage | With Mortgage |
| Less than $10,000 | 2 (2.7%) | 0 (0.0%) |
| $10,000 to $24,999 | 6 (8.2%) | 0 (0.0%) |
| $25,000 to $34,999 | 0 (0.0%) | 2 (4.2%) |
| $35,000 to $49,999 | 0 (0.0%) | 0 (0.0%) |
| $50,000 to $74,999 | 6 (8.2%) | 17 (35.4%) |
| $75,000 to $99,999 | 51 (69.9%) | 2 (4.2%) |
| $100,000 to $149,999 | 1 (1.4%) | 0 (0.0%) |
| $150,000 or more | 7 (9.6%) | 27 (56.2%) |
| Total | 73 (100.0%) | 48 (100.0%) |
Property Value to Household Income Ratio in Hyden
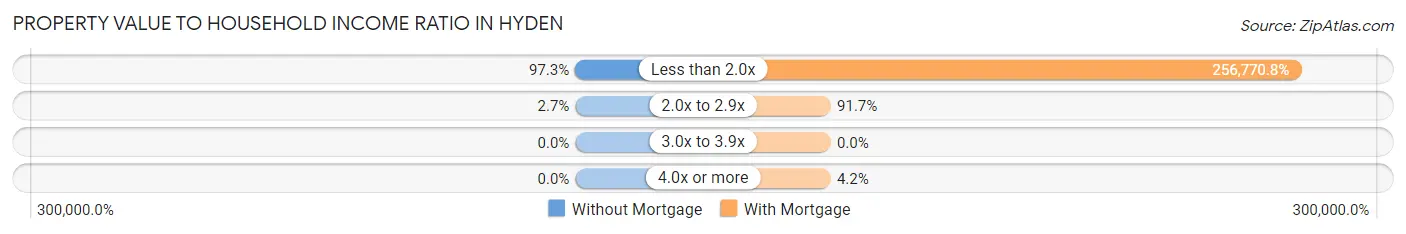
| Value-to-Income Ratio | Without Mortgage | With Mortgage |
| Less than 2.0x | 71 (97.3%) | 123,250 (256,770.8%) |
| 2.0x to 2.9x | 2 (2.7%) | 44 (91.7%) |
| 3.0x to 3.9x | 0 (0.0%) | 0 (0.0%) |
| 4.0x or more | 0 (0.0%) | 2 (4.2%) |
| Total | 73 (100.0%) | 48 (100.0%) |
Real Estate Taxes by Mortgage Status in Hyden
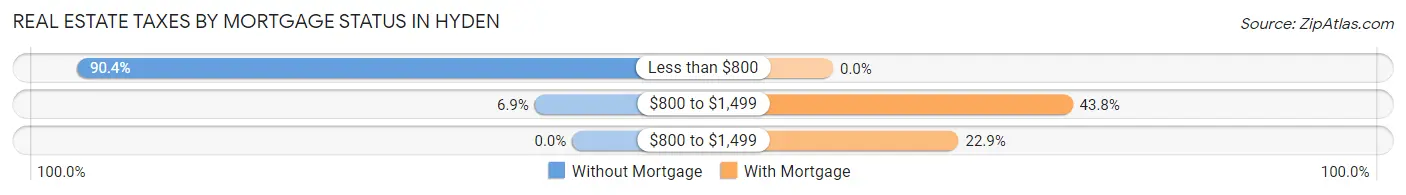
| Property Taxes | Without Mortgage | With Mortgage |
| Less than $800 | 66 (90.4%) | 0 (0.0%) |
| $800 to $1,499 | 5 (6.9%) | 21 (43.8%) |
| $800 to $1,499 | 0 (0.0%) | 11 (22.9%) |
| Total | 73 (100.0%) | 48 (100.0%) |
Health & Disability in Hyden
Health Insurance Coverage by Age in Hyden
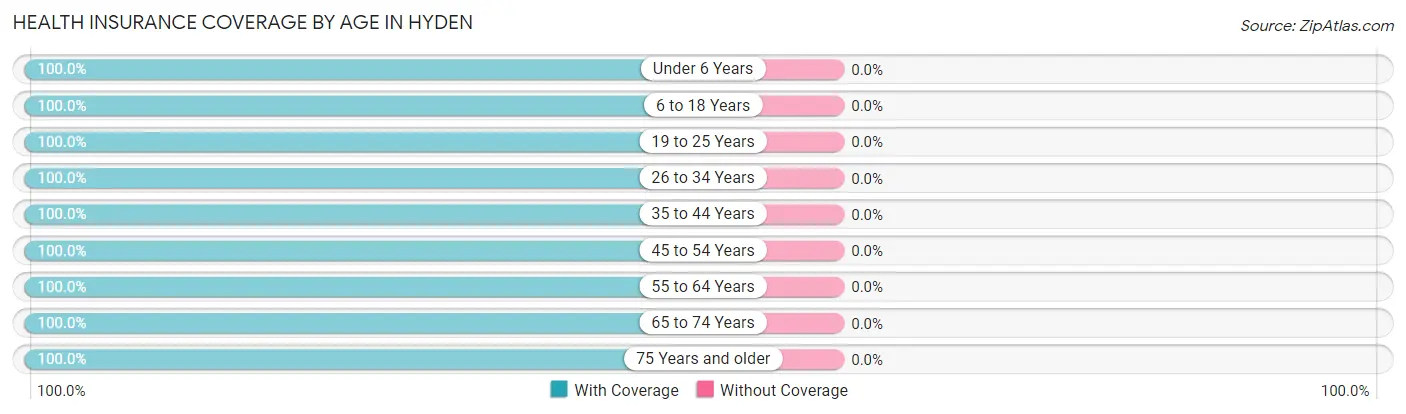
| Age Bracket | With Coverage | Without Coverage |
| Under 6 Years | 23 (100.0%) | 0 (0.0%) |
| 6 to 18 Years | 52 (100.0%) | 0 (0.0%) |
| 19 to 25 Years | 67 (100.0%) | 0 (0.0%) |
| 26 to 34 Years | 52 (100.0%) | 0 (0.0%) |
| 35 to 44 Years | 61 (100.0%) | 0 (0.0%) |
| 45 to 54 Years | 46 (100.0%) | 0 (0.0%) |
| 55 to 64 Years | 45 (100.0%) | 0 (0.0%) |
| 65 to 74 Years | 43 (100.0%) | 0 (0.0%) |
| 75 Years and older | 63 (100.0%) | 0 (0.0%) |
| Total | 452 (100.0%) | 0 (0.0%) |
Health Insurance Coverage by Citizenship Status in Hyden
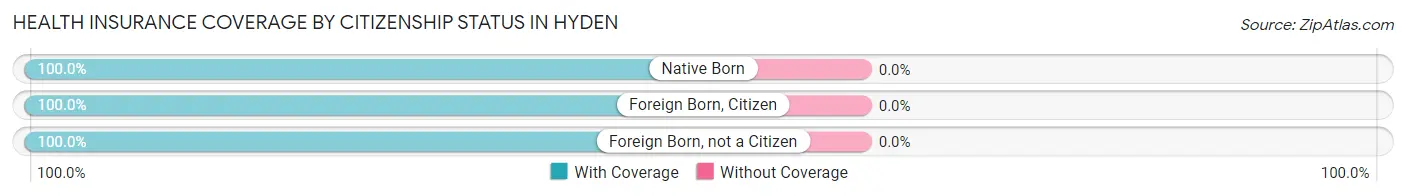
| Citizenship Status | With Coverage | Without Coverage |
| Native Born | 23 (100.0%) | 0 (0.0%) |
| Foreign Born, Citizen | 52 (100.0%) | 0 (0.0%) |
| Foreign Born, not a Citizen | 67 (100.0%) | 0 (0.0%) |
Health Insurance Coverage by Household Income in Hyden
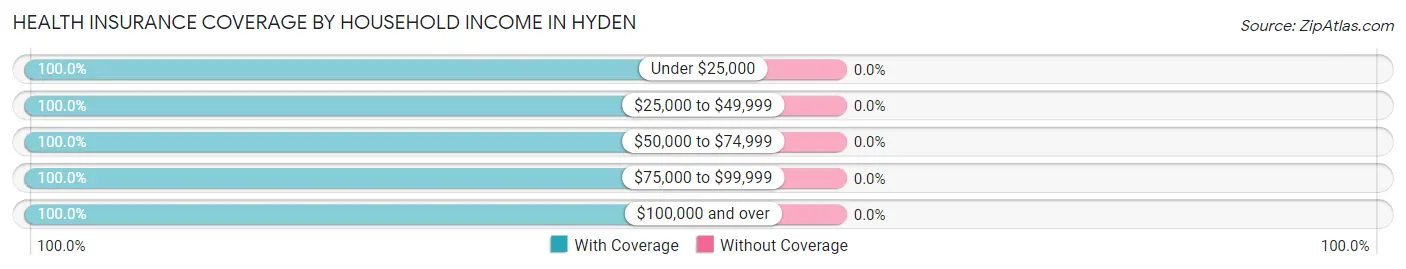
| Household Income | With Coverage | Without Coverage |
| Under $25,000 | 108 (100.0%) | 0 (0.0%) |
| $25,000 to $49,999 | 87 (100.0%) | 0 (0.0%) |
| $50,000 to $74,999 | 43 (100.0%) | 0 (0.0%) |
| $75,000 to $99,999 | 55 (100.0%) | 0 (0.0%) |
| $100,000 and over | 143 (100.0%) | 0 (0.0%) |
Public vs Private Health Insurance Coverage by Age in Hyden
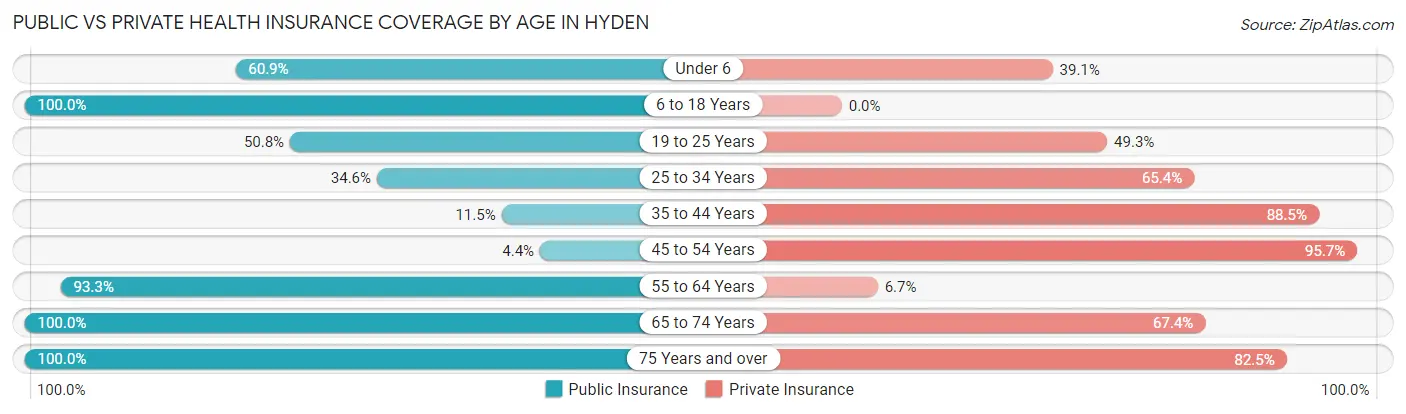
| Age Bracket | Public Insurance | Private Insurance |
| Under 6 | 14 (60.9%) | 9 (39.1%) |
| 6 to 18 Years | 52 (100.0%) | 0 (0.0%) |
| 19 to 25 Years | 34 (50.7%) | 33 (49.2%) |
| 25 to 34 Years | 18 (34.6%) | 34 (65.4%) |
| 35 to 44 Years | 7 (11.5%) | 54 (88.5%) |
| 45 to 54 Years | 2 (4.3%) | 44 (95.7%) |
| 55 to 64 Years | 42 (93.3%) | 3 (6.7%) |
| 65 to 74 Years | 43 (100.0%) | 29 (67.4%) |
| 75 Years and over | 63 (100.0%) | 52 (82.5%) |
| Total | 275 (60.8%) | 258 (57.1%) |
Disability Status by Sex by Age in Hyden
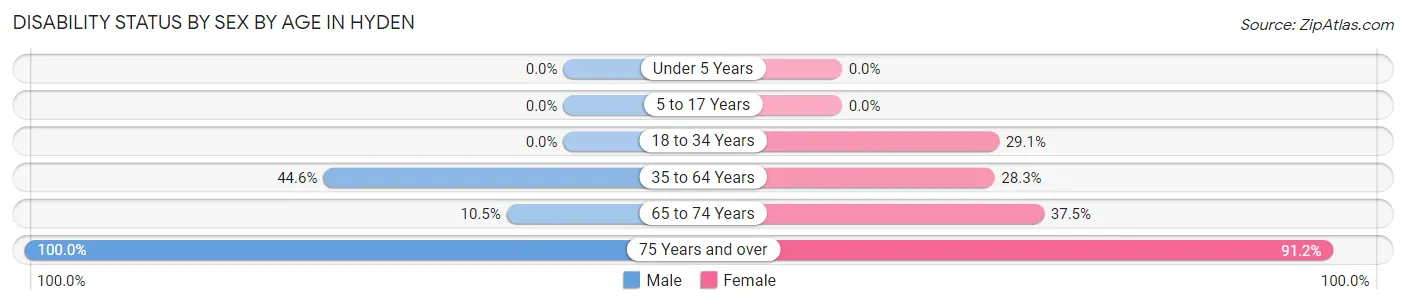
| Age Bracket | Male | Female |
| Under 5 Years | 0 (0.0%) | 0 (0.0%) |
| 5 to 17 Years | 0 (0.0%) | 0 (0.0%) |
| 18 to 34 Years | 0 (0.0%) | 30 (29.1%) |
| 35 to 64 Years | 41 (44.6%) | 17 (28.3%) |
| 65 to 74 Years | 2 (10.5%) | 9 (37.5%) |
| 75 Years and over | 6 (100.0%) | 52 (91.2%) |
Disability Class by Sex by Age in Hyden
Disability Class: Hearing Difficulty
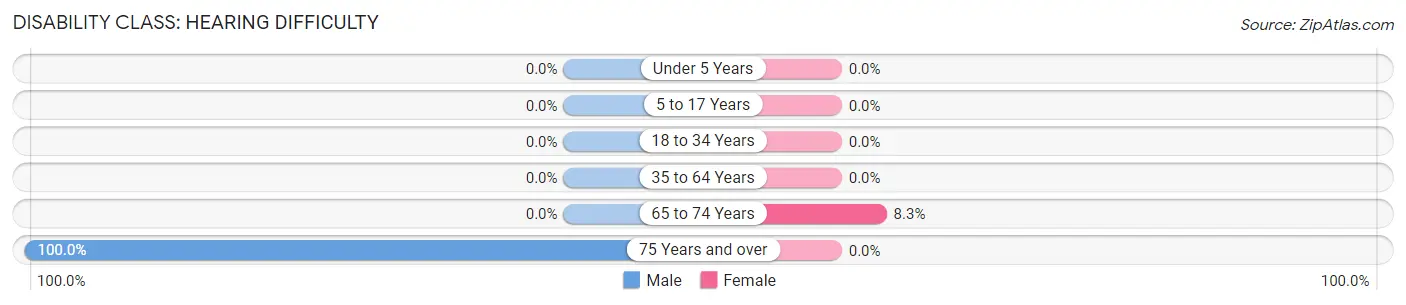
| Age Bracket | Male | Female |
| Under 5 Years | 0 (0.0%) | 0 (0.0%) |
| 5 to 17 Years | 0 (0.0%) | 0 (0.0%) |
| 18 to 34 Years | 0 (0.0%) | 0 (0.0%) |
| 35 to 64 Years | 0 (0.0%) | 0 (0.0%) |
| 65 to 74 Years | 0 (0.0%) | 2 (8.3%) |
| 75 Years and over | 6 (100.0%) | 0 (0.0%) |
Disability Class: Vision Difficulty
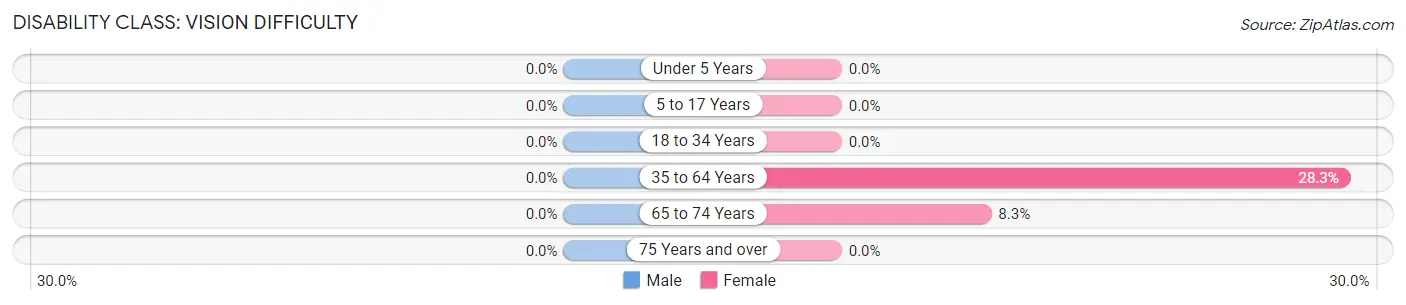
| Age Bracket | Male | Female |
| Under 5 Years | 0 (0.0%) | 0 (0.0%) |
| 5 to 17 Years | 0 (0.0%) | 0 (0.0%) |
| 18 to 34 Years | 0 (0.0%) | 0 (0.0%) |
| 35 to 64 Years | 0 (0.0%) | 17 (28.3%) |
| 65 to 74 Years | 0 (0.0%) | 2 (8.3%) |
| 75 Years and over | 0 (0.0%) | 0 (0.0%) |
Disability Class: Cognitive Difficulty
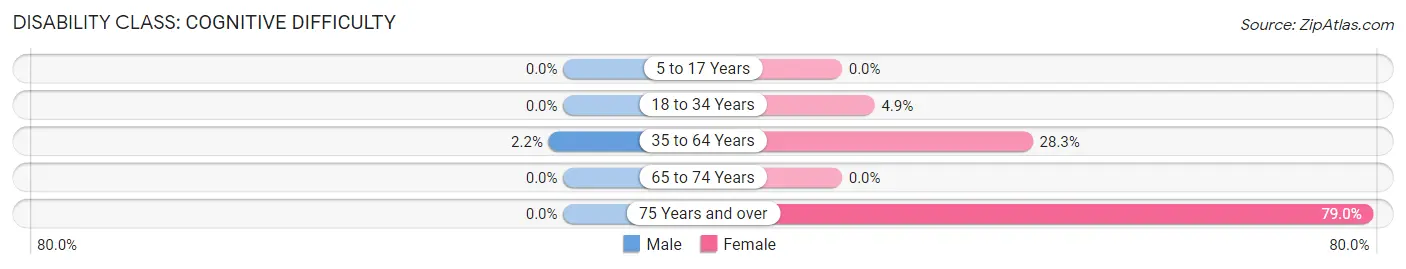
| Age Bracket | Male | Female |
| 5 to 17 Years | 0 (0.0%) | 0 (0.0%) |
| 18 to 34 Years | 0 (0.0%) | 5 (4.9%) |
| 35 to 64 Years | 2 (2.2%) | 17 (28.3%) |
| 65 to 74 Years | 0 (0.0%) | 0 (0.0%) |
| 75 Years and over | 0 (0.0%) | 45 (78.9%) |
Disability Class: Ambulatory Difficulty
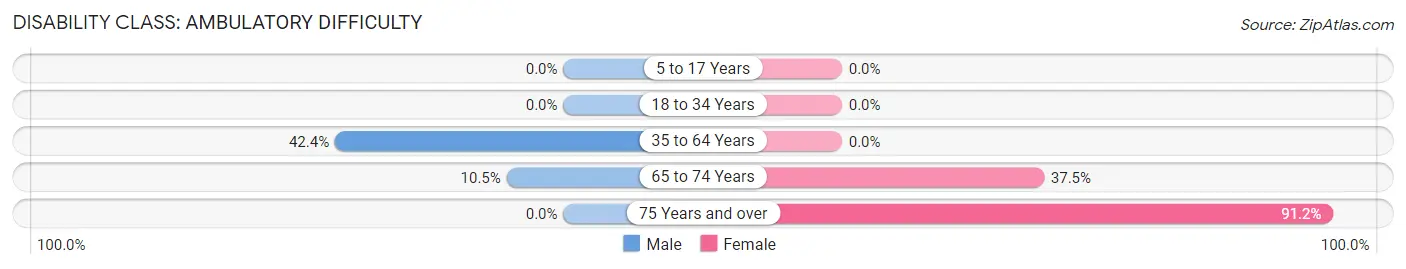
| Age Bracket | Male | Female |
| 5 to 17 Years | 0 (0.0%) | 0 (0.0%) |
| 18 to 34 Years | 0 (0.0%) | 0 (0.0%) |
| 35 to 64 Years | 39 (42.4%) | 0 (0.0%) |
| 65 to 74 Years | 2 (10.5%) | 9 (37.5%) |
| 75 Years and over | 0 (0.0%) | 52 (91.2%) |
Disability Class: Self-Care Difficulty
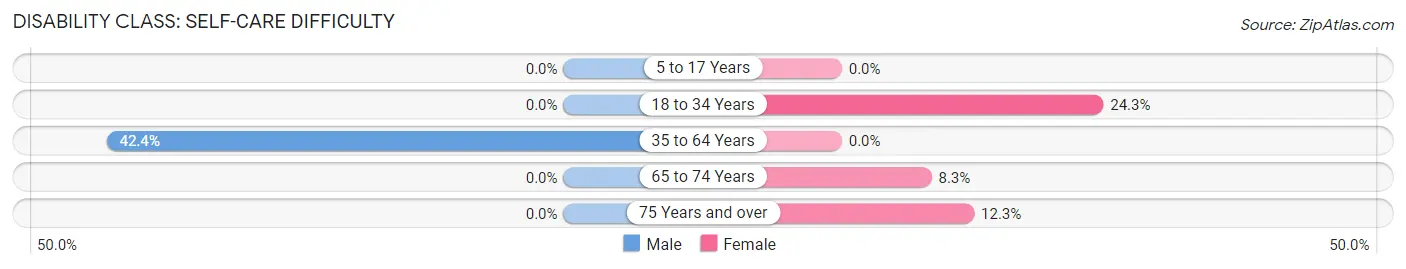
| Age Bracket | Male | Female |
| 5 to 17 Years | 0 (0.0%) | 0 (0.0%) |
| 18 to 34 Years | 0 (0.0%) | 25 (24.3%) |
| 35 to 64 Years | 39 (42.4%) | 0 (0.0%) |
| 65 to 74 Years | 0 (0.0%) | 2 (8.3%) |
| 75 Years and over | 0 (0.0%) | 7 (12.3%) |
Technology Access in Hyden
Computing Device Access in Hyden
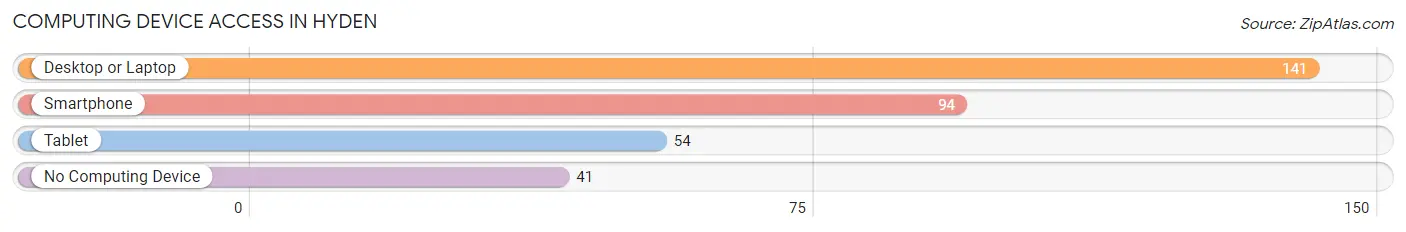
| Device Type | # Households | % Households |
| Desktop or Laptop | 141 | 72.7% |
| Smartphone | 94 | 48.4% |
| Tablet | 54 | 27.8% |
| No Computing Device | 41 | 21.1% |
| Total | 194 | 100.0% |
Internet Access in Hyden
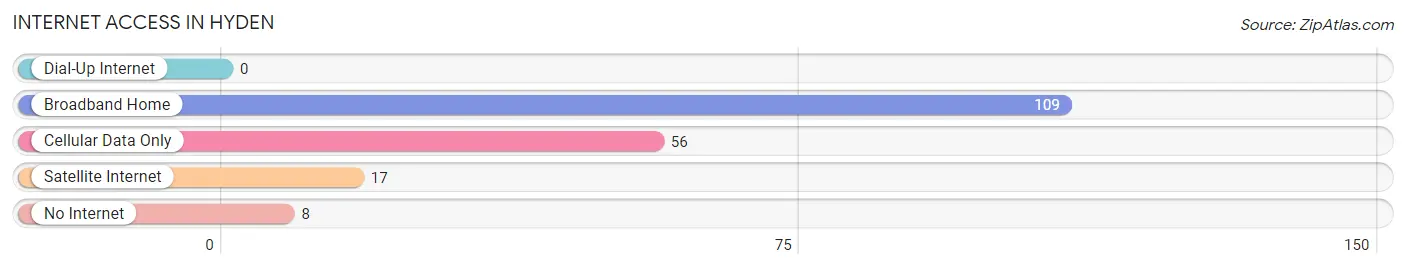
| Internet Type | # Households | % Households |
| Dial-Up Internet | 0 | 0.0% |
| Broadband Home | 109 | 56.2% |
| Cellular Data Only | 56 | 28.9% |
| Satellite Internet | 17 | 8.8% |
| No Internet | 8 | 4.1% |
| Total | 194 | 100.0% |
Hyden Summary
Hyden is a small town located in the western part of Kentucky, in the United States. It is situated in the heart of the Appalachian Mountains, and is part of the larger Leslie County. The town has a population of around 1,500 people, and is the county seat of Leslie County.
History
Hyden was founded in 1883 by a group of settlers from the nearby town of Hyden. The town was named after the nearby creek, which was named after the local Native American tribe, the Hyden. The town was originally a small farming community, and the first post office was established in 1884.
The town grew slowly over the years, and by the early 1900s, it had become a bustling center of commerce and industry. The town was home to several businesses, including a sawmill, a gristmill, a blacksmith shop, and a general store. The town also had a school, a church, and a hotel.
In the 1920s, the town began to experience a decline in population, as many of the businesses closed and people moved away. However, the town was revitalized in the 1950s, when the coal industry began to boom in the area. The town was home to several coal mines, and the population began to grow again.
Geography
Hyden is located in the western part of Kentucky, in the Appalachian Mountains. The town is situated in the heart of the mountains, and is surrounded by rolling hills and lush forests. The town is located near the headwaters of the Kentucky River, and is about 30 miles from the state capital of Frankfort.
The climate in Hyden is humid subtropical, with hot summers and mild winters. The average annual temperature is around 60 degrees Fahrenheit, and the average annual precipitation is around 40 inches.
Economy
The economy of Hyden is largely based on the coal industry. The town is home to several coal mines, and the coal industry is the main source of employment in the area. The town also has a few small businesses, including a general store, a restaurant, and a few other small shops.
The town is also home to a few tourist attractions, including the Hyden Wildlife Management Area, which is a popular destination for hunting and fishing. The town also has a few small museums, including the Hyden Coal Museum, which is dedicated to the history of the coal industry in the area.
Demographics
As of the 2010 census, the population of Hyden was 1,521. The racial makeup of the town was 97.3% White, 0.7% African American, 0.2% Native American, 0.2% Asian, 0.1% Pacific Islander, and 1.5% from other races. The median household income in the town was $25,972, and the median family income was $31,250. The per capita income in the town was $14,945.
Conclusion
Hyden is a small town located in the western part of Kentucky, in the United States. It is situated in the heart of the Appalachian Mountains, and is part of the larger Leslie County. The town has a population of around 1,500 people, and is the county seat of Leslie County. The economy of Hyden is largely based on the coal industry, and the town is home to several coal mines. The town also has a few small businesses, and is home to a few tourist attractions. The racial makeup of the town is mostly White, with a small percentage of African American, Native American, Asian, and Pacific Islander residents. The median household income in the town is $25,972, and the median family income is $31,250.
Common Questions
What is Per Capita Income in Hyden?
Per Capita income in Hyden is $29,221.
What is the Median Family Income in Hyden?
Median Family Income in Hyden is $52,125.
What is Income or Wage Gap in Hyden?
Income or Wage Gap in Hyden is 62.8%.
Women in Hyden earn 37.2 cents for every dollar earned by a man.
What is Inequality or Gini Index in Hyden?
Inequality or Gini Index in Hyden is 0.39.
What is the Total Population of Hyden?
Total Population of Hyden is 547.
What is the Total Male Population of Hyden?
Total Male Population of Hyden is 186.
What is the Total Female Population of Hyden?
Total Female Population of Hyden is 361.
What is the Ratio of Males per 100 Females in Hyden?
There are 51.52 Males per 100 Females in Hyden.
What is the Ratio of Females per 100 Males in Hyden?
There are 194.09 Females per 100 Males in Hyden.
What is the Median Population Age in Hyden?
Median Population Age in Hyden is 46.9 Years.
What is the Average Family Size in Hyden
Average Family Size in Hyden is 3.4 People.
What is the Average Household Size in Hyden
Average Household Size in Hyden is 2.2 People.
How Large is the Labor Force in Hyden?
There are 262 People in the Labor Forcein in Hyden.
What is the Percentage of People in the Labor Force in Hyden?
52.4% of People are in the Labor Force in Hyden.
What is the Unemployment Rate in Hyden?
Unemployment Rate in Hyden is 9.9%.