Silver Grove, KY Map & Demographics
Silver Grove Map
Silver Grove Overview
$25,753
PER CAPITA INCOME
$62,813
AVG FAMILY INCOME
$43,975
AVG HOUSEHOLD INCOME
2.2%
WAGE / INCOME GAP [ % ]
97.8¢/ $1
WAGE / INCOME GAP [ $ ]
0.38
INEQUALITY / GINI INDEX
1,335
TOTAL POPULATION
662
MALE POPULATION
673
FEMALE POPULATION
98.37
MALES / 100 FEMALES
101.66
FEMALES / 100 MALES
45.3
MEDIAN AGE
3.0
AVG FAMILY SIZE
2.0
AVG HOUSEHOLD SIZE
666
LABOR FORCE [ PEOPLE ]
61.0%
PERCENT IN LABOR FORCE
5.4%
UNEMPLOYMENT RATE
Silver Grove Zip Codes
Silver Grove Area Codes
Income in Silver Grove
Income Overview in Silver Grove
Per Capita Income in Silver Grove is $25,753, while median incomes of families and households are $62,813 and $43,975 respectively.
| Characteristic | Number | Measure |
| Per Capita Income | 1,335 | $25,753 |
| Median Family Income | 287 | $62,813 |
| Mean Family Income | 287 | $62,999 |
| Median Household Income | 633 | $43,975 |
| Mean Household Income | 633 | $51,964 |
| Income Deficit | 287 | $0 |
| Wage / Income Gap (%) | 1,335 | 2.20% |
| Wage / Income Gap ($) | 1,335 | 97.80¢ per $1 |
| Gini / Inequality Index | 1,335 | 0.38 |
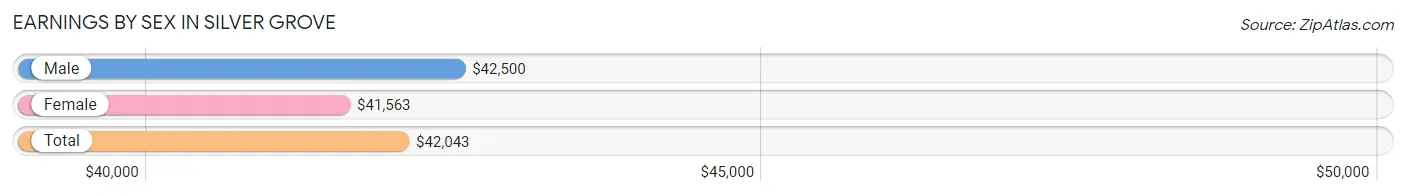
Earnings by Sex in Silver Grove
Average Earnings in Silver Grove are $42,043, $42,500 for men and $41,563 for women, a difference of 2.2%.
| Sex | Number | Average Earnings |
| Male | 334 (49.6%) | $42,500 |
| Female | 339 (50.4%) | $41,563 |
| Total | 673 (100.0%) | $42,043 |
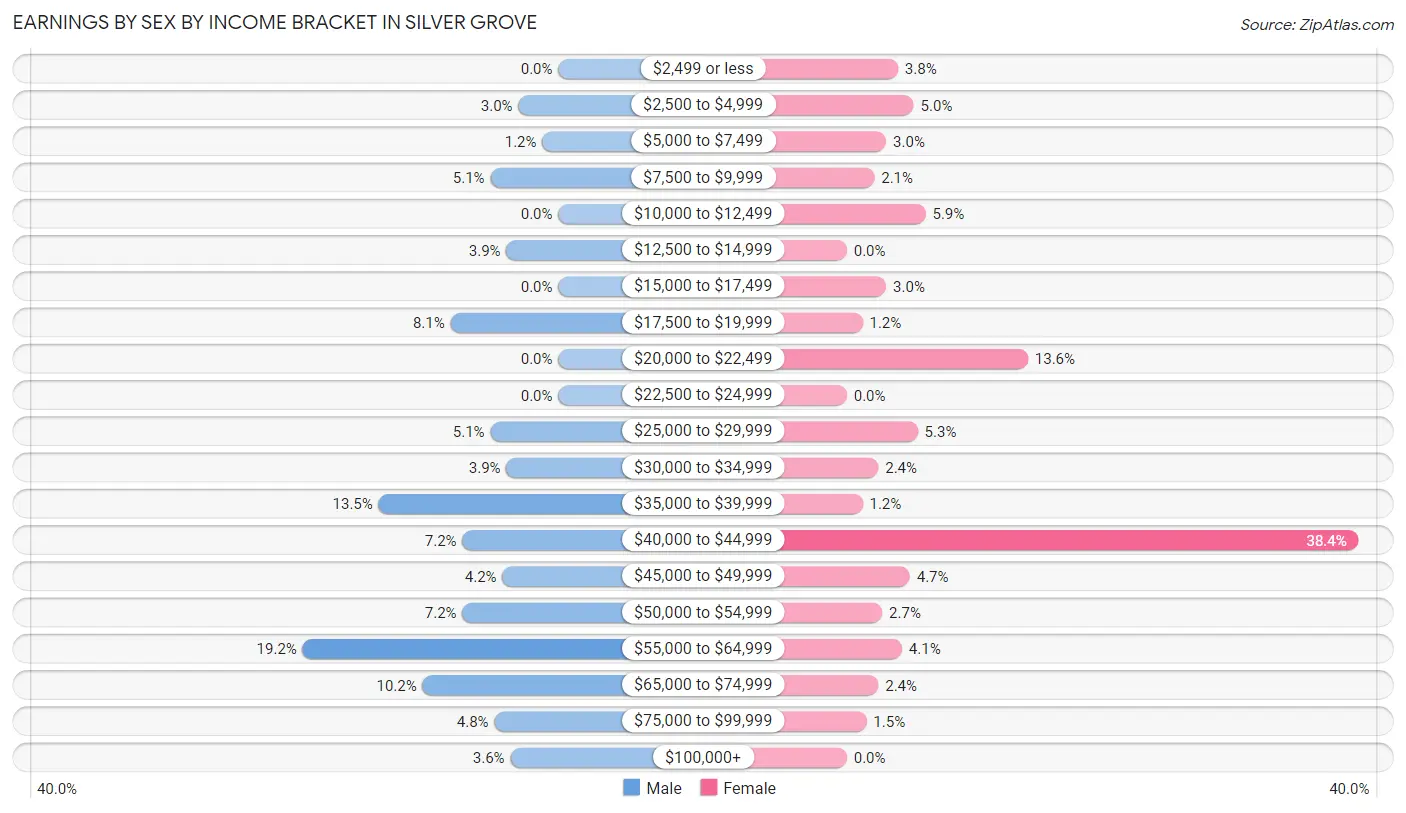
Earnings by Sex by Income Bracket in Silver Grove
The most common earnings brackets in Silver Grove are $55,000 to $64,999 for men (64 | 19.2%) and $40,000 to $44,999 for women (130 | 38.4%).
| Income | Male | Female |
| $2,499 or less | 0 (0.0%) | 13 (3.8%) |
| $2,500 to $4,999 | 10 (3.0%) | 17 (5.0%) |
| $5,000 to $7,499 | 4 (1.2%) | 10 (2.9%) |
| $7,500 to $9,999 | 17 (5.1%) | 7 (2.1%) |
| $10,000 to $12,499 | 0 (0.0%) | 20 (5.9%) |
| $12,500 to $14,999 | 13 (3.9%) | 0 (0.0%) |
| $15,000 to $17,499 | 0 (0.0%) | 10 (2.9%) |
| $17,500 to $19,999 | 27 (8.1%) | 4 (1.2%) |
| $20,000 to $22,499 | 0 (0.0%) | 46 (13.6%) |
| $22,500 to $24,999 | 0 (0.0%) | 0 (0.0%) |
| $25,000 to $29,999 | 17 (5.1%) | 18 (5.3%) |
| $30,000 to $34,999 | 13 (3.9%) | 8 (2.4%) |
| $35,000 to $39,999 | 45 (13.5%) | 4 (1.2%) |
| $40,000 to $44,999 | 24 (7.2%) | 130 (38.4%) |
| $45,000 to $49,999 | 14 (4.2%) | 16 (4.7%) |
| $50,000 to $54,999 | 24 (7.2%) | 9 (2.6%) |
| $55,000 to $64,999 | 64 (19.2%) | 14 (4.1%) |
| $65,000 to $74,999 | 34 (10.2%) | 8 (2.4%) |
| $75,000 to $99,999 | 16 (4.8%) | 5 (1.5%) |
| $100,000+ | 12 (3.6%) | 0 (0.0%) |
| Total | 334 (100.0%) | 339 (100.0%) |
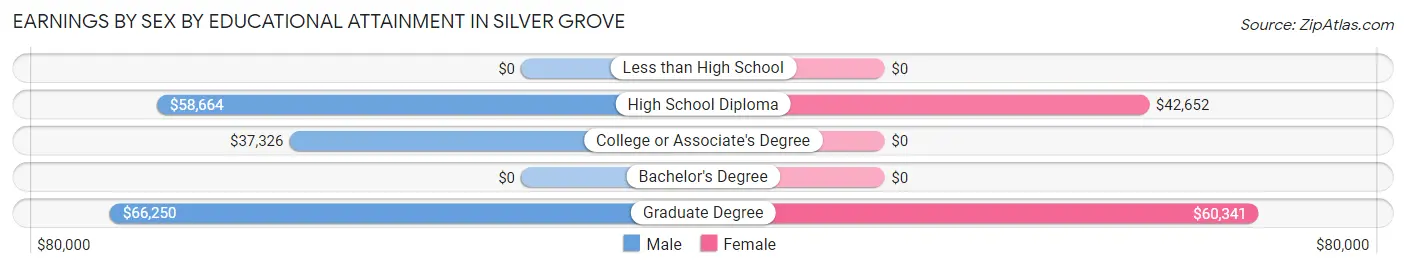
Earnings by Sex by Educational Attainment in Silver Grove
Average earnings in Silver Grove are $50,063 for men and $42,250 for women, a difference of 15.6%. Men with an educational attainment of graduate degree enjoy the highest average annual earnings of $66,250, while those with college or associate's degree education earn the least with $37,326. Women with an educational attainment of graduate degree earn the most with the average annual earnings of $60,341, while those with high school diploma education have the smallest earnings of $42,652.
| Educational Attainment | Male Income | Female Income |
| Less than High School | - | - |
| High School Diploma | $58,664 | $42,652 |
| College or Associate's Degree | $37,326 | $0 |
| Bachelor's Degree | - | - |
| Graduate Degree | $66,250 | $60,341 |
| Total | $50,063 | $42,250 |
Family Income in Silver Grove
Family Income Brackets in Silver Grove
According to the Silver Grove family income data, there are 60 families falling into the $35,000 to $49,999 income range, which is the most common income bracket and makes up 20.9% of all families. Conversely, the $200,000+ income bracket is the least frequent group with only 3 families (1.1%) belonging to this category.
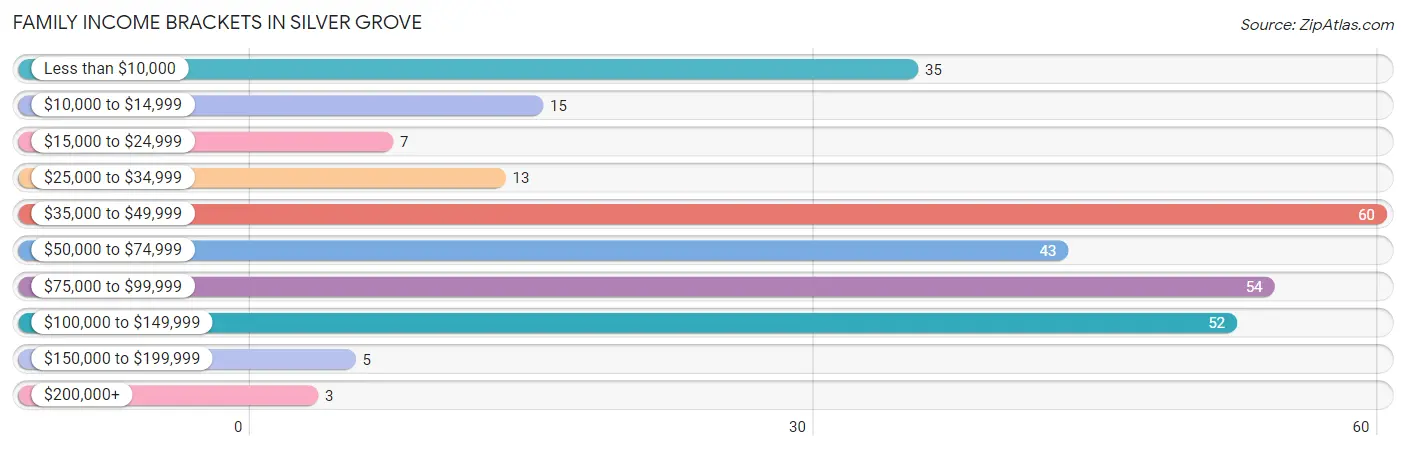
| Income Bracket | # Families | % Families |
| Less than $10,000 | 35 | 12.2% |
| $10,000 to $14,999 | 15 | 5.2% |
| $15,000 to $24,999 | 7 | 2.4% |
| $25,000 to $34,999 | 13 | 4.5% |
| $35,000 to $49,999 | 60 | 20.9% |
| $50,000 to $74,999 | 43 | 15.0% |
| $75,000 to $99,999 | 54 | 18.8% |
| $100,000 to $149,999 | 52 | 18.1% |
| $150,000 to $199,999 | 5 | 1.7% |
| $200,000+ | 3 | 1.0% |
Family Income by Famaliy Size in Silver Grove
5-person families (28 | 9.8%) account for the highest median family income in Silver Grove with $94,167 per family, while 2-person families (124 | 43.2%) have the highest median income of $29,375 per family member.
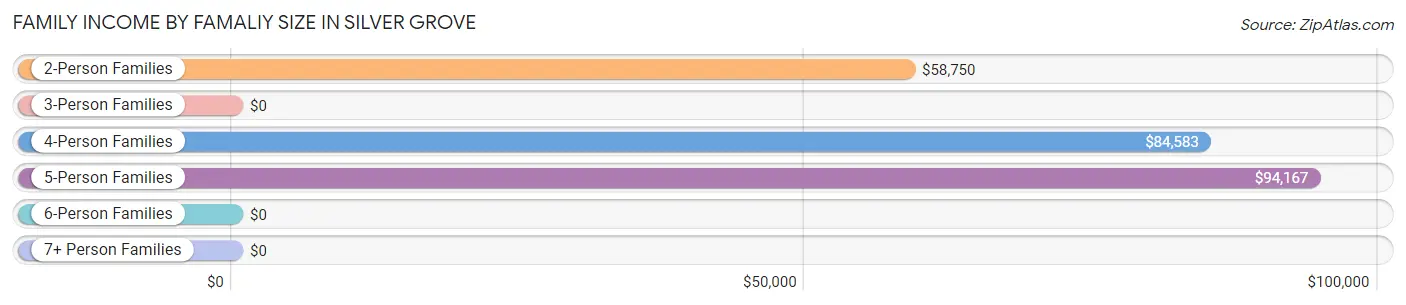
| Income Bracket | # Families | Median Income |
| 2-Person Families | 124 (43.2%) | $58,750 |
| 3-Person Families | 88 (30.7%) | $0 |
| 4-Person Families | 32 (11.2%) | $84,583 |
| 5-Person Families | 28 (9.8%) | $94,167 |
| 6-Person Families | 3 (1.1%) | $0 |
| 7+ Person Families | 12 (4.2%) | $0 |
| Total | 287 (100.0%) | $62,813 |
Family Income by Number of Earners in Silver Grove
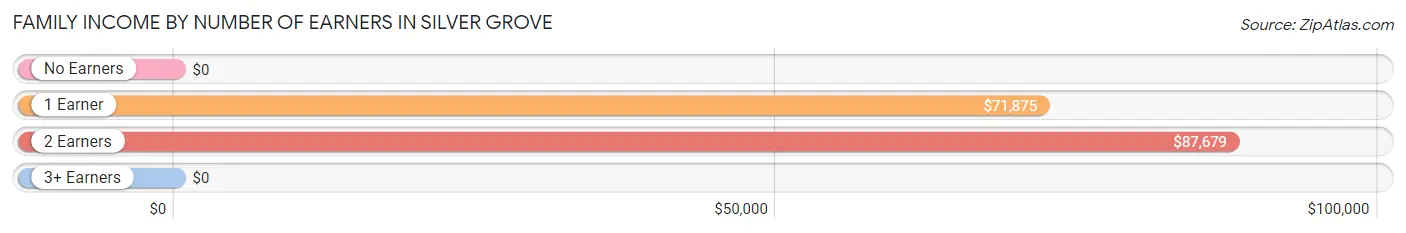
| Number of Earners | # Families | Median Income |
| No Earners | 73 (25.4%) | $0 |
| 1 Earner | 107 (37.3%) | $71,875 |
| 2 Earners | 92 (32.1%) | $87,679 |
| 3+ Earners | 15 (5.2%) | $0 |
| Total | 287 (100.0%) | $62,813 |
Household Income in Silver Grove
Household Income Brackets in Silver Grove
With 222 households falling in the category, the $35,000 to $49,999 income range is the most frequent in Silver Grove, accounting for 35.1% of all households. In contrast, only 3 households (0.5%) fall into the $200,000+ income bracket, making it the least populous group.
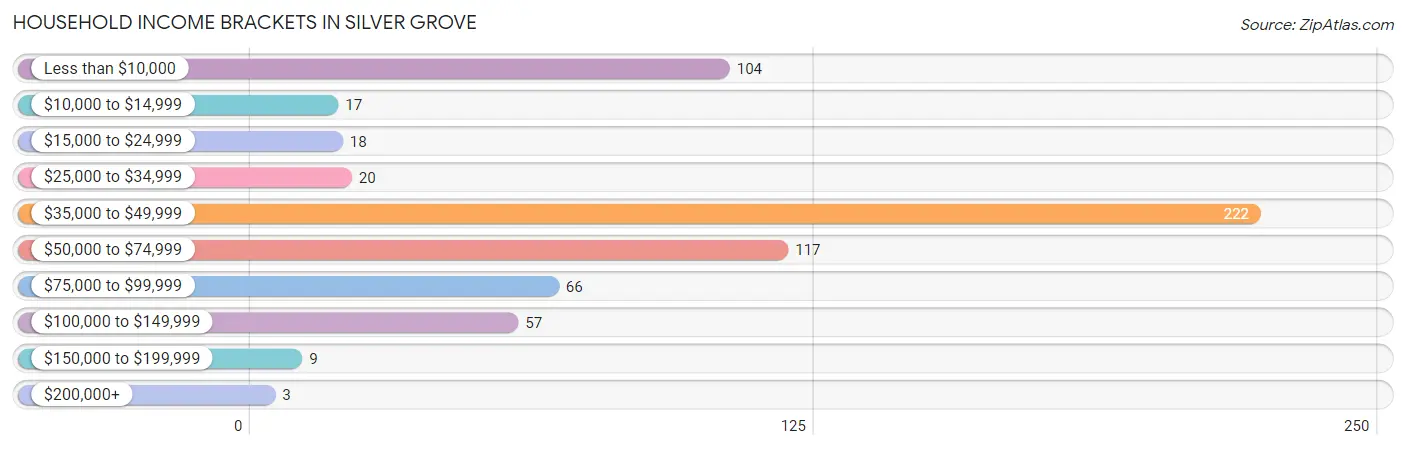
| Income Bracket | # Households | % Households |
| Less than $10,000 | 104 | 16.4% |
| $10,000 to $14,999 | 17 | 2.7% |
| $15,000 to $24,999 | 18 | 2.8% |
| $25,000 to $34,999 | 20 | 3.2% |
| $35,000 to $49,999 | 222 | 35.1% |
| $50,000 to $74,999 | 117 | 18.5% |
| $75,000 to $99,999 | 66 | 10.4% |
| $100,000 to $149,999 | 57 | 9.0% |
| $150,000 to $199,999 | 9 | 1.4% |
| $200,000+ | 3 | 0.5% |
Household Income by Householder Age in Silver Grove
The median household income in Silver Grove is $43,975, with the highest median household income of $78,854 found in the 65+ years age bracket for the primary householder. A total of 55 households (8.7%) fall into this category. Meanwhile, the 15 to 24 years age bracket for the primary householder has the lowest median household income of $0, with 8 households (1.3%) in this group.
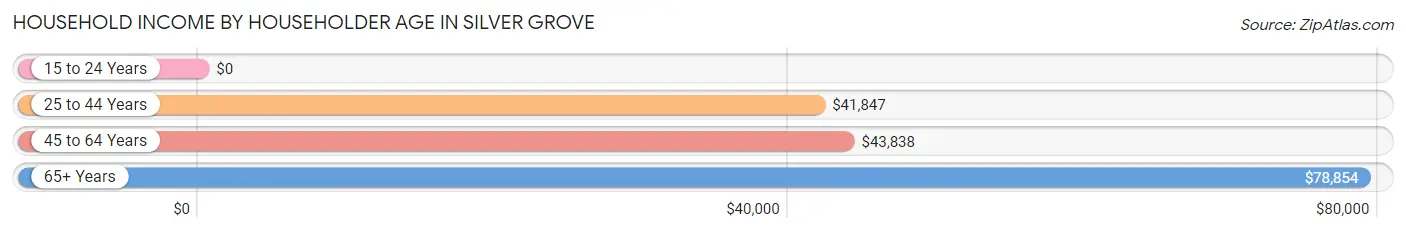
| Income Bracket | # Households | Median Income |
| 15 to 24 Years | 8 (1.3%) | $0 |
| 25 to 44 Years | 197 (31.1%) | $41,847 |
| 45 to 64 Years | 373 (58.9%) | $43,838 |
| 65+ Years | 55 (8.7%) | $78,854 |
| Total | 633 (100.0%) | $43,975 |
Poverty in Silver Grove
Income Below Poverty by Sex and Age in Silver Grove
With 25.1% poverty level for males and 24.4% for females among the residents of Silver Grove, 15 year old males and 6 to 11 year old females are the most vulnerable to poverty, with 5 males (100.0%) and 21 females (52.5%) in their respective age groups living below the poverty level.
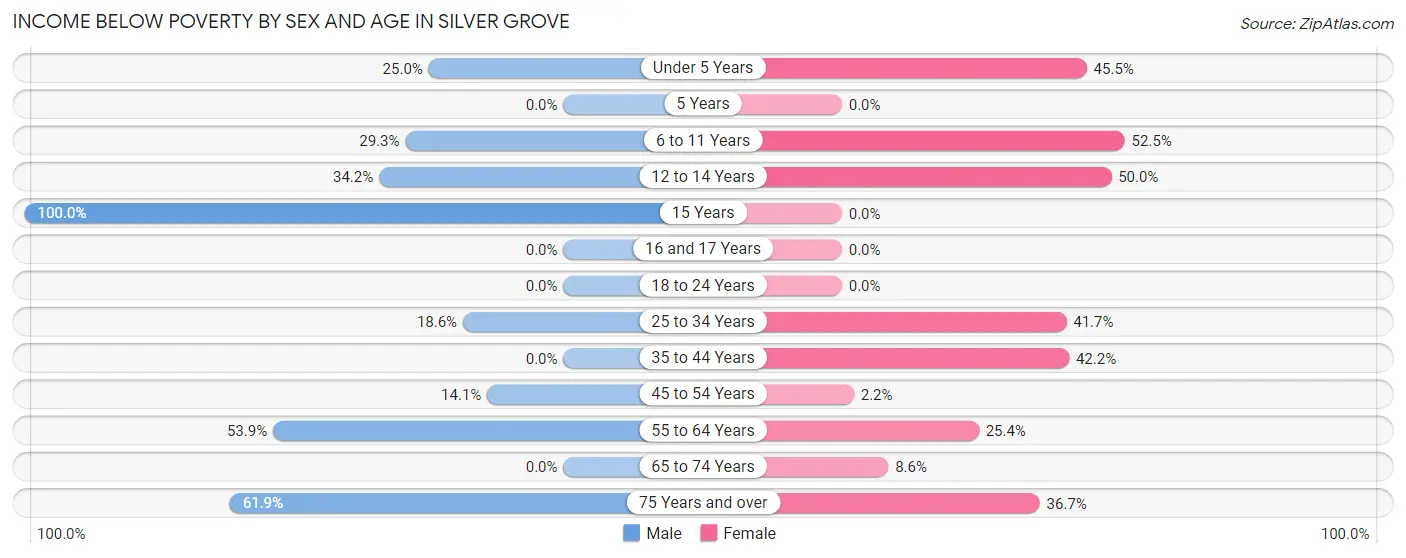
| Age Bracket | Male | Female |
| Under 5 Years | 1 (25.0%) | 30 (45.5%) |
| 5 Years | 0 (0.0%) | 0 (0.0%) |
| 6 to 11 Years | 22 (29.3%) | 21 (52.5%) |
| 12 to 14 Years | 13 (34.2%) | 4 (50.0%) |
| 15 Years | 5 (100.0%) | 0 (0.0%) |
| 16 and 17 Years | 0 (0.0%) | 0 (0.0%) |
| 18 to 24 Years | 0 (0.0%) | 0 (0.0%) |
| 25 to 34 Years | 22 (18.6%) | 15 (41.7%) |
| 35 to 44 Years | 0 (0.0%) | 35 (42.2%) |
| 45 to 54 Years | 14 (14.1%) | 4 (2.2%) |
| 55 to 64 Years | 76 (53.9%) | 31 (25.4%) |
| 65 to 74 Years | 0 (0.0%) | 5 (8.6%) |
| 75 Years and over | 13 (61.9%) | 18 (36.7%) |
| Total | 166 (25.1%) | 163 (24.4%) |
Income Above Poverty by Sex and Age in Silver Grove
According to the poverty statistics in Silver Grove, males aged 16 and 17 years and females aged 5 years are the age groups that are most secure financially, with 100.0% of males and 100.0% of females in these age groups living above the poverty line.
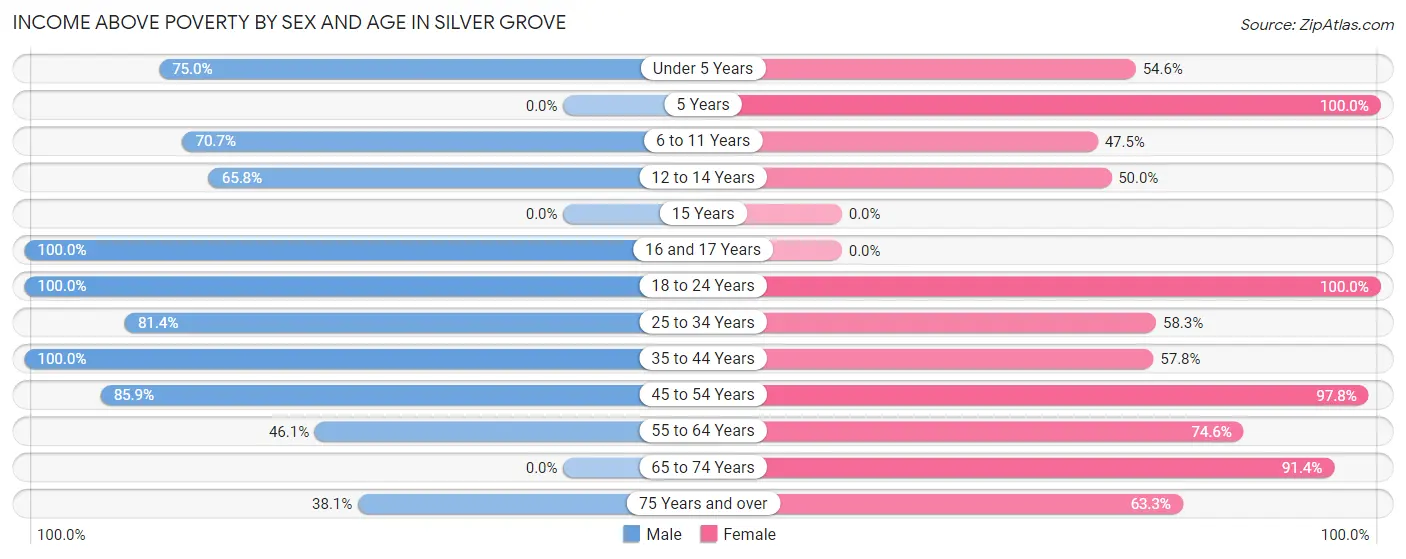
| Age Bracket | Male | Female |
| Under 5 Years | 3 (75.0%) | 36 (54.5%) |
| 5 Years | 0 (0.0%) | 3 (100.0%) |
| 6 to 11 Years | 53 (70.7%) | 19 (47.5%) |
| 12 to 14 Years | 25 (65.8%) | 4 (50.0%) |
| 15 Years | 0 (0.0%) | 0 (0.0%) |
| 16 and 17 Years | 20 (100.0%) | 0 (0.0%) |
| 18 to 24 Years | 44 (100.0%) | 23 (100.0%) |
| 25 to 34 Years | 96 (81.4%) | 21 (58.3%) |
| 35 to 44 Years | 97 (100.0%) | 48 (57.8%) |
| 45 to 54 Years | 85 (85.9%) | 176 (97.8%) |
| 55 to 64 Years | 65 (46.1%) | 91 (74.6%) |
| 65 to 74 Years | 0 (0.0%) | 53 (91.4%) |
| 75 Years and over | 8 (38.1%) | 31 (63.3%) |
| Total | 496 (74.9%) | 505 (75.6%) |
Income Below Poverty Among Married-Couple Families in Silver Grove
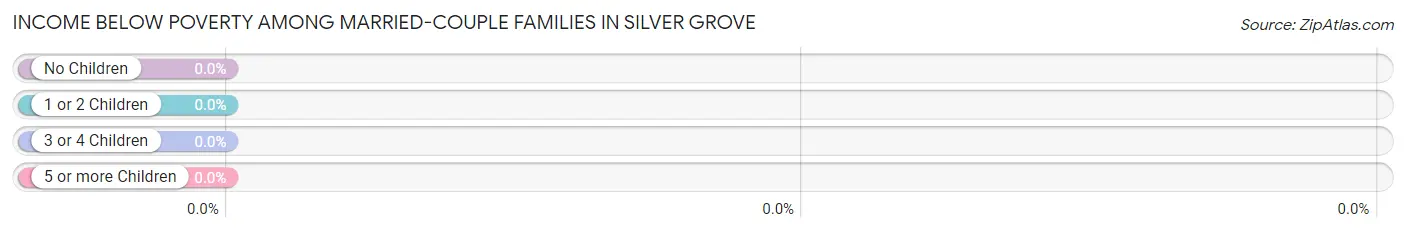
| Children | Above Poverty | Below Poverty |
| No Children | 57 (100.0%) | 0 (0.0%) |
| 1 or 2 Children | 62 (100.0%) | 0 (0.0%) |
| 3 or 4 Children | 3 (100.0%) | 0 (0.0%) |
| 5 or more Children | 0 (0.0%) | 0 (0.0%) |
| Total | 122 (100.0%) | 0 (0.0%) |
Income Below Poverty Among Single-Parent Households in Silver Grove
According to the poverty data in Silver Grove, 50.0% or 43 single-father households and 24.0% or 19 single-mother households are living below the poverty line. Among single-father households, those with 5 or more children have the highest poverty rate, with 12 households (100.0%) experiencing poverty. Likewise, among single-mother households, those with 1 or 2 children have the highest poverty rate, with 19 households (40.4%) falling below the poverty line.
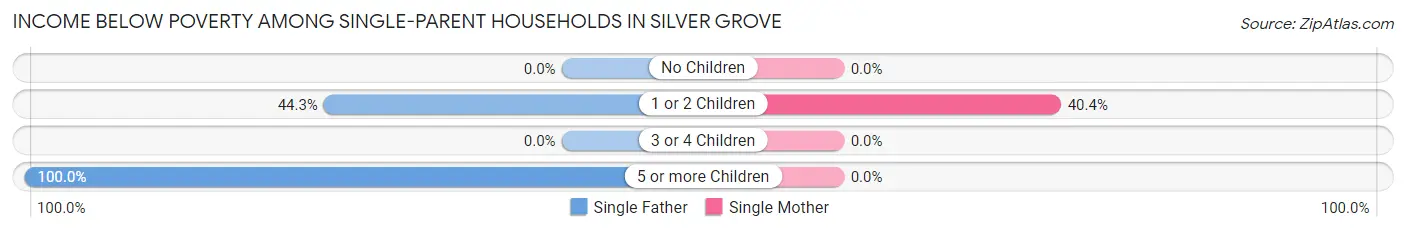
| Children | Single Father | Single Mother |
| No Children | 0 (0.0%) | 0 (0.0%) |
| 1 or 2 Children | 31 (44.3%) | 19 (40.4%) |
| 3 or 4 Children | 0 (0.0%) | 0 (0.0%) |
| 5 or more Children | 12 (100.0%) | 0 (0.0%) |
| Total | 43 (50.0%) | 19 (24.0%) |
Income Below Poverty Among Married-Couple vs Single-Parent Households in Silver Grove
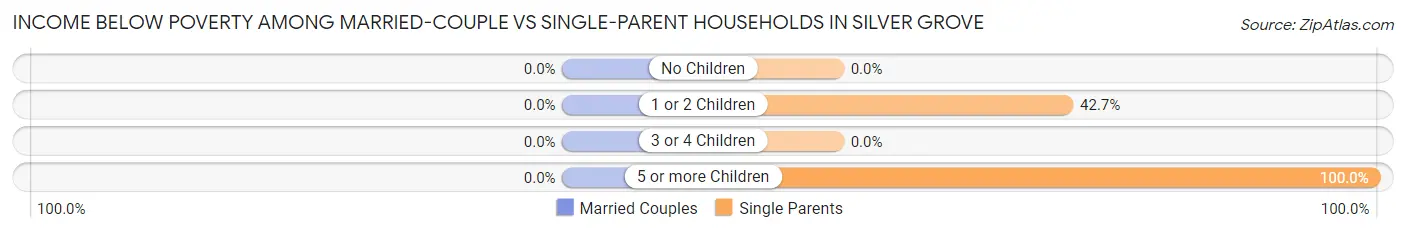
| Children | Married-Couple Families | Single-Parent Households |
| No Children | 0 (0.0%) | 0 (0.0%) |
| 1 or 2 Children | 0 (0.0%) | 50 (42.7%) |
| 3 or 4 Children | 0 (0.0%) | 0 (0.0%) |
| 5 or more Children | 0 (0.0%) | 12 (100.0%) |
| Total | 0 (0.0%) | 62 (37.6%) |
Race in Silver Grove
The most populous races in Silver Grove are White / Caucasian (1,301 | 97.5%), Hispanic or Latino (80 | 6.0%), and Black / African American (18 | 1.3%).
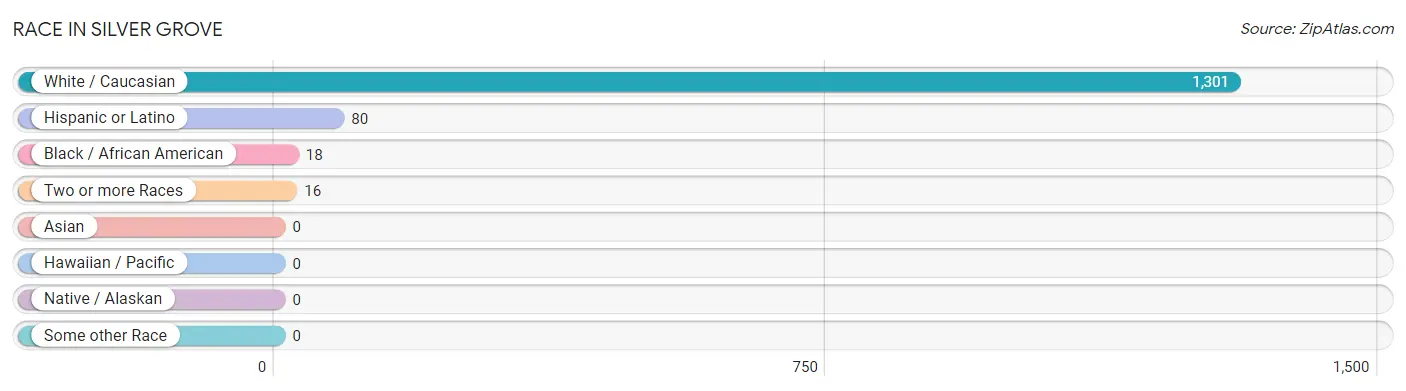
| Race | # Population | % Population |
| Asian | 0 | 0.0% |
| Black / African American | 18 | 1.3% |
| Hawaiian / Pacific | 0 | 0.0% |
| Hispanic or Latino | 80 | 6.0% |
| Native / Alaskan | 0 | 0.0% |
| White / Caucasian | 1,301 | 97.5% |
| Two or more Races | 16 | 1.2% |
| Some other Race | 0 | 0.0% |
| Total | 1,335 | 100.0% |
Ancestry in Silver Grove
The most populous ancestries reported in Silver Grove are German (333 | 24.9%), English (248 | 18.6%), Irish (236 | 17.7%), Polish (99 | 7.4%), and American (85 | 6.4%), together accounting for 75.0% of all Silver Grove residents.
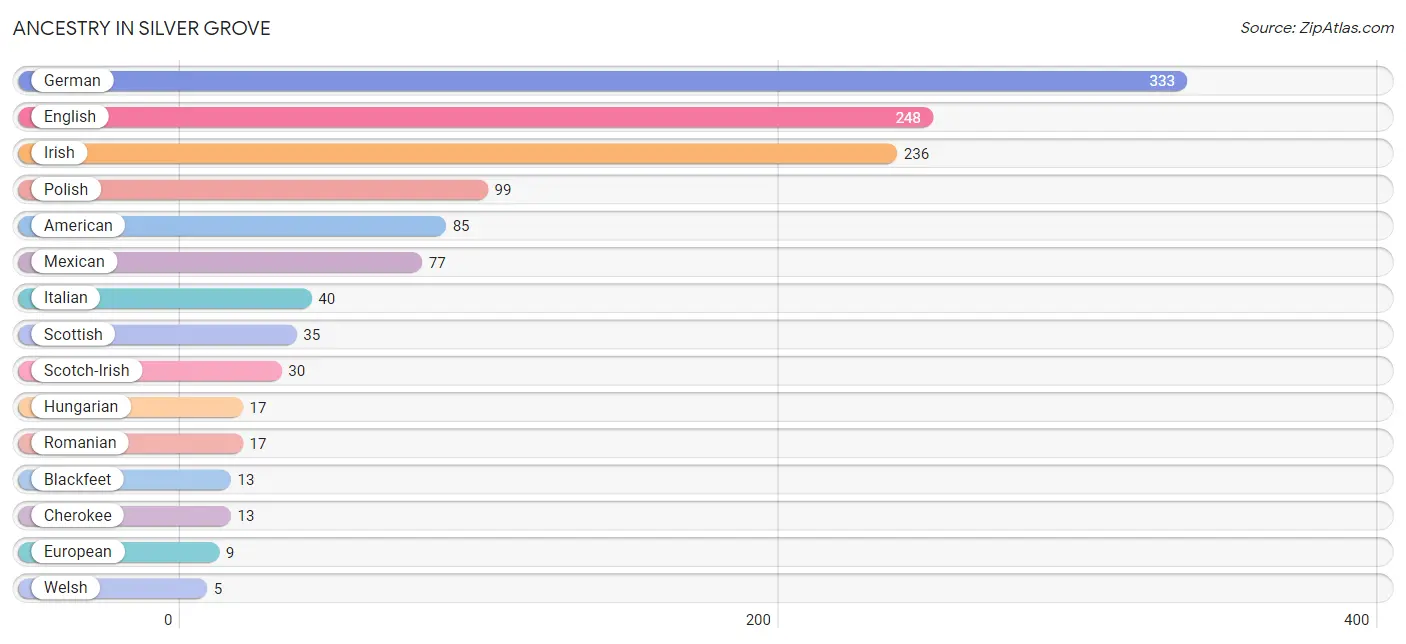
| Ancestry | # Population | % Population |
| American | 85 | 6.4% |
| Blackfeet | 13 | 1.0% |
| Central American | 3 | 0.2% |
| Cherokee | 13 | 1.0% |
| English | 248 | 18.6% |
| Ethiopian | 4 | 0.3% |
| European | 9 | 0.7% |
| German | 333 | 24.9% |
| Guatemalan | 3 | 0.2% |
| Hungarian | 17 | 1.3% |
| Irish | 236 | 17.7% |
| Italian | 40 | 3.0% |
| Mexican | 77 | 5.8% |
| Northern European | 4 | 0.3% |
| Polish | 99 | 7.4% |
| Romanian | 17 | 1.3% |
| Scotch-Irish | 30 | 2.2% |
| Scottish | 35 | 2.6% |
| Subsaharan African | 4 | 0.3% |
| Welsh | 5 | 0.4% | View All 20 Rows |
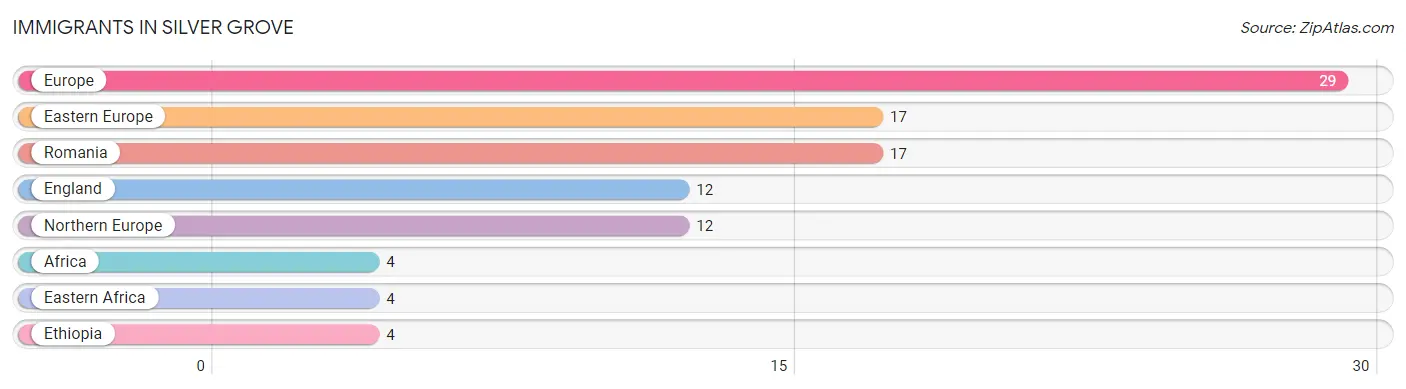
Immigrants in Silver Grove
The most numerous immigrant groups reported in Silver Grove came from Europe (29 | 2.2%), Eastern Europe (17 | 1.3%), Romania (17 | 1.3%), England (12 | 0.9%), and Northern Europe (12 | 0.9%), together accounting for 6.5% of all Silver Grove residents.
| Immigration Origin | # Population | % Population |
| Africa | 4 | 0.3% |
| Eastern Africa | 4 | 0.3% |
| Eastern Europe | 17 | 1.3% |
| England | 12 | 0.9% |
| Ethiopia | 4 | 0.3% |
| Europe | 29 | 2.2% |
| Northern Europe | 12 | 0.9% |
| Romania | 17 | 1.3% | View All 8 Rows |
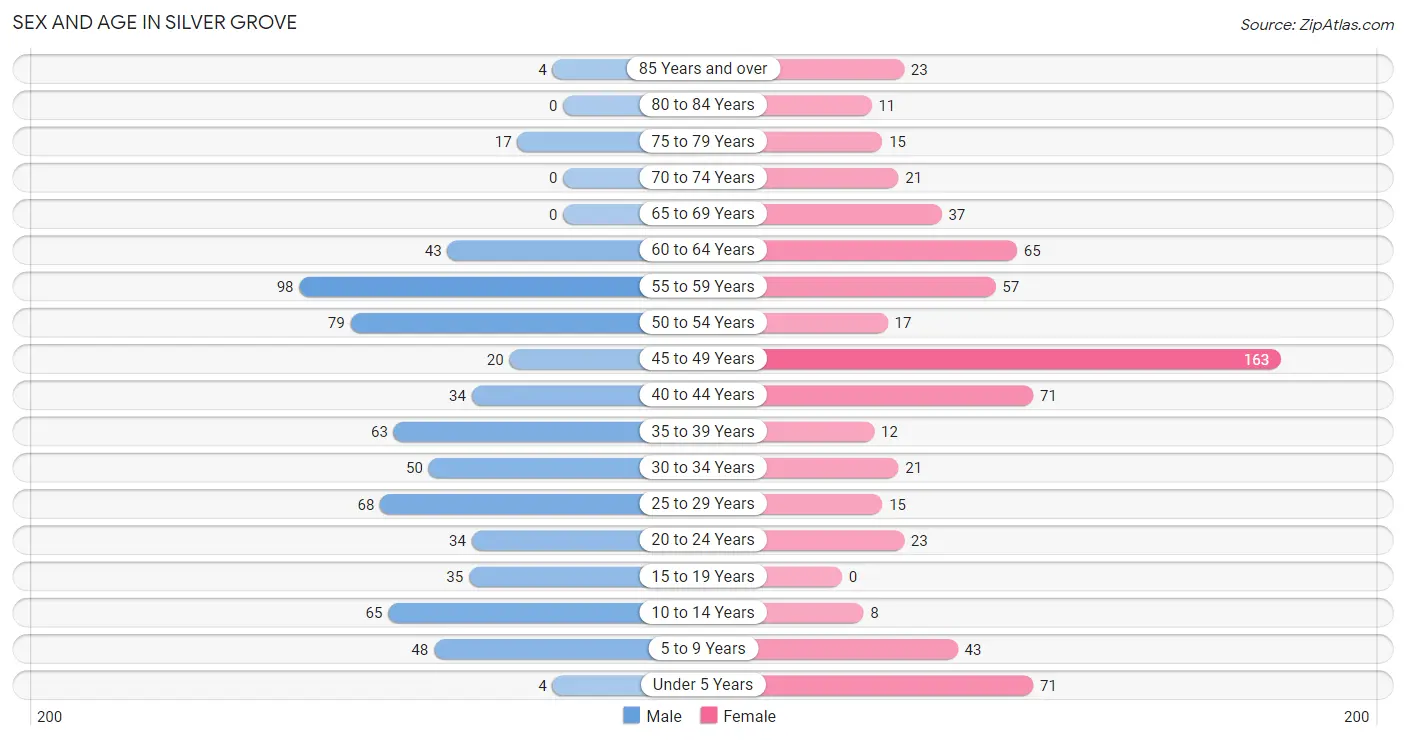
Sex and Age in Silver Grove
Sex and Age in Silver Grove
The most populous age groups in Silver Grove are 55 to 59 Years (98 | 14.8%) for men and 45 to 49 Years (163 | 24.2%) for women.
| Age Bracket | Male | Female |
| Under 5 Years | 4 (0.6%) | 71 (10.5%) |
| 5 to 9 Years | 48 (7.2%) | 43 (6.4%) |
| 10 to 14 Years | 65 (9.8%) | 8 (1.2%) |
| 15 to 19 Years | 35 (5.3%) | 0 (0.0%) |
| 20 to 24 Years | 34 (5.1%) | 23 (3.4%) |
| 25 to 29 Years | 68 (10.3%) | 15 (2.2%) |
| 30 to 34 Years | 50 (7.5%) | 21 (3.1%) |
| 35 to 39 Years | 63 (9.5%) | 12 (1.8%) |
| 40 to 44 Years | 34 (5.1%) | 71 (10.5%) |
| 45 to 49 Years | 20 (3.0%) | 163 (24.2%) |
| 50 to 54 Years | 79 (11.9%) | 17 (2.5%) |
| 55 to 59 Years | 98 (14.8%) | 57 (8.5%) |
| 60 to 64 Years | 43 (6.5%) | 65 (9.7%) |
| 65 to 69 Years | 0 (0.0%) | 37 (5.5%) |
| 70 to 74 Years | 0 (0.0%) | 21 (3.1%) |
| 75 to 79 Years | 17 (2.6%) | 15 (2.2%) |
| 80 to 84 Years | 0 (0.0%) | 11 (1.6%) |
| 85 Years and over | 4 (0.6%) | 23 (3.4%) |
| Total | 662 (100.0%) | 673 (100.0%) |
Families and Households in Silver Grove
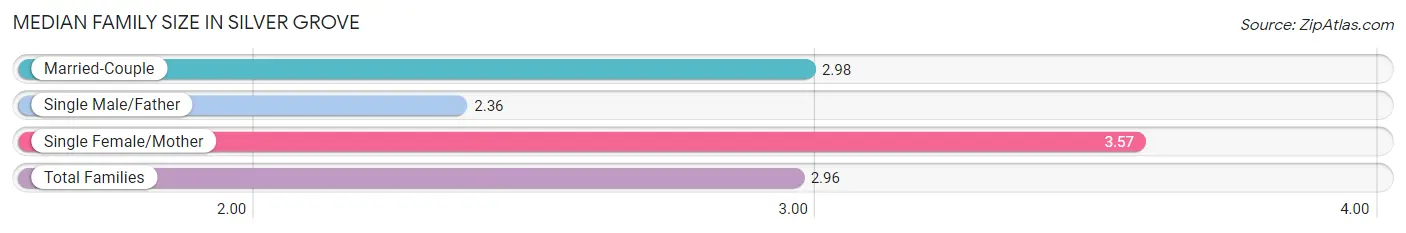
Median Family Size in Silver Grove
The median family size in Silver Grove is 2.96 persons per family, with single female/mother families (79 | 27.5%) accounting for the largest median family size of 3.57 persons per family. On the other hand, single male/father families (86 | 30.0%) represent the smallest median family size with 2.36 persons per family.
| Family Type | # Families | Family Size |
| Married-Couple | 122 (42.5%) | 2.98 |
| Single Male/Father | 86 (30.0%) | 2.36 |
| Single Female/Mother | 79 (27.5%) | 3.57 |
| Total Families | 287 (100.0%) | 2.96 |
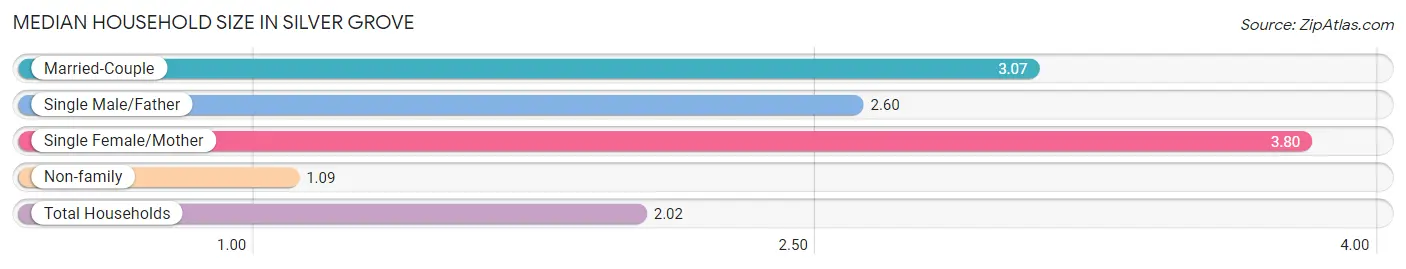
Median Household Size in Silver Grove
The median household size in Silver Grove is 2.02 persons per household, with single female/mother households (79 | 12.5%) accounting for the largest median household size of 3.8 persons per household. non-family households (346 | 54.7%) represent the smallest median household size with 1.09 persons per household.
| Household Type | # Households | Household Size |
| Married-Couple | 122 (19.3%) | 3.07 |
| Single Male/Father | 86 (13.6%) | 2.60 |
| Single Female/Mother | 79 (12.5%) | 3.80 |
| Non-family | 346 (54.7%) | 1.09 |
| Total Households | 633 (100.0%) | 2.02 |
Household Size by Marriage Status in Silver Grove
Out of a total of 633 households in Silver Grove, 287 (45.3%) are family households, while 346 (54.7%) are nonfamily households. The most numerous type of family households are 2-person households, comprising 107, and the most common type of nonfamily households are 1-person households, comprising 319.
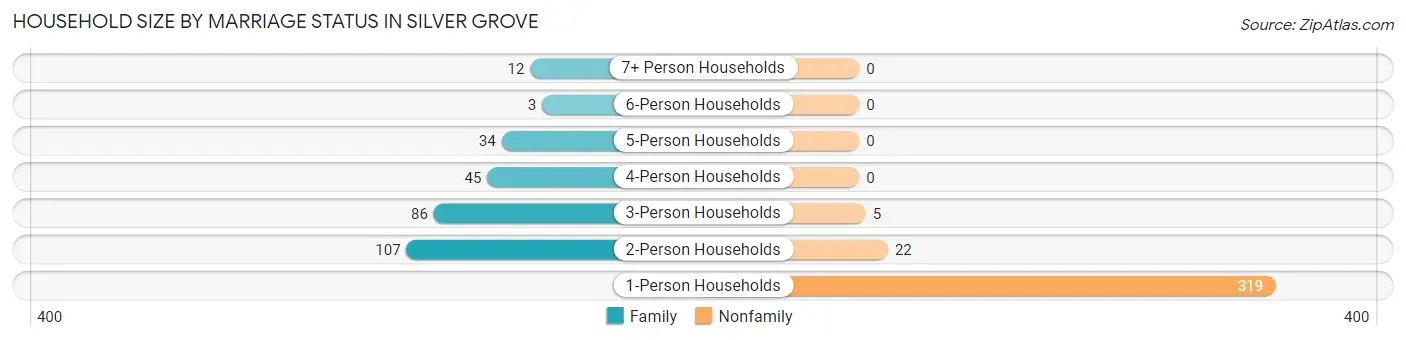
| Household Size | Family Households | Nonfamily Households |
| 1-Person Households | - | 319 (50.4%) |
| 2-Person Households | 107 (16.9%) | 22 (3.5%) |
| 3-Person Households | 86 (13.6%) | 5 (0.8%) |
| 4-Person Households | 45 (7.1%) | 0 (0.0%) |
| 5-Person Households | 34 (5.4%) | 0 (0.0%) |
| 6-Person Households | 3 (0.5%) | 0 (0.0%) |
| 7+ Person Households | 12 (1.9%) | 0 (0.0%) |
| Total | 287 (45.3%) | 346 (54.7%) |
Female Fertility in Silver Grove
Fertility by Age in Silver Grove
Average fertility rate in Silver Grove is 34.0 births per 1,000 women. Women in the age bracket of 20 to 34 years have the highest fertility rate with 186.0 births per 1,000 women. Women in the age bracket of 20 to 34 years acount for 100.0% of all women with births.
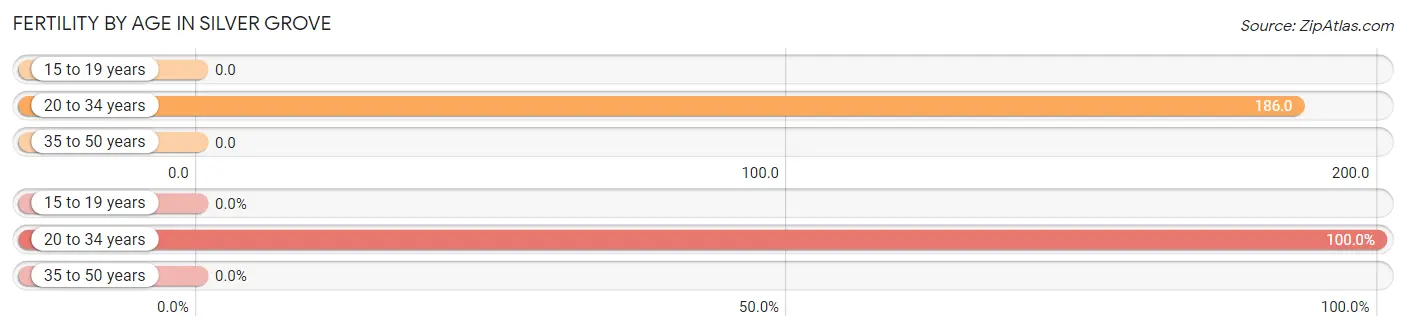
| Age Bracket | Women with Births | Births / 1,000 Women |
| 15 to 19 years | 0 (0.0%) | 0.0 |
| 20 to 34 years | 11 (100.0%) | 186.0 |
| 35 to 50 years | 0 (0.0%) | 0.0 |
| Total | 11 (100.0%) | 34.0 |
Fertility by Age by Marriage Status in Silver Grove
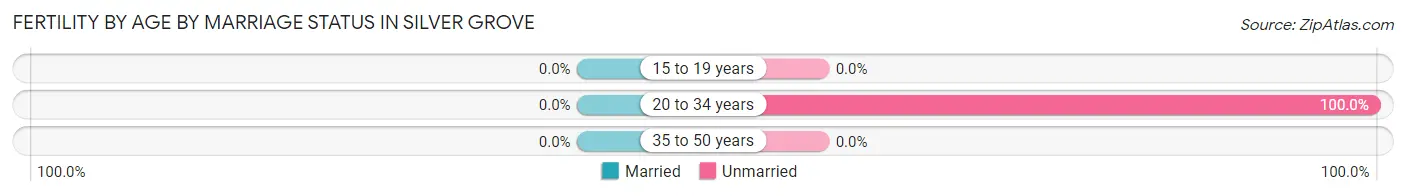
| Age Bracket | Married | Unmarried |
| 15 to 19 years | 0 (0.0%) | 0 (0.0%) |
| 20 to 34 years | 0 (0.0%) | 11 (100.0%) |
| 35 to 50 years | 0 (0.0%) | 0 (0.0%) |
| Total | 0 (0.0%) | 11 (100.0%) |
Fertility by Education in Silver Grove
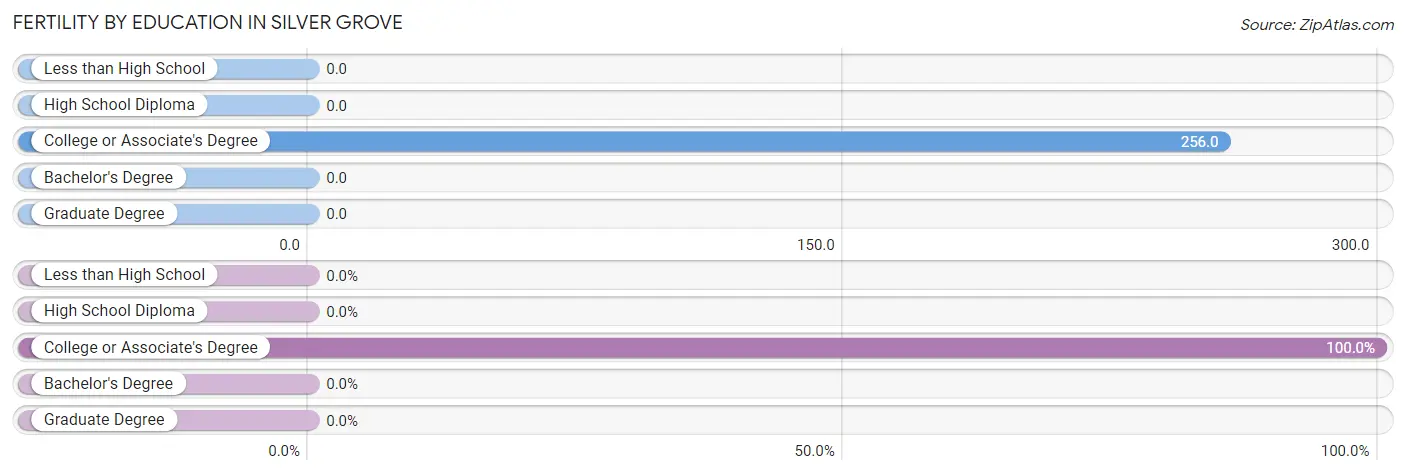
| Educational Attainment | Women with Births | Births / 1,000 Women |
| Less than High School | 0 (0.0%) | 0.0 |
| High School Diploma | 0 (0.0%) | 0.0 |
| College or Associate's Degree | 11 (100.0%) | 256.0 |
| Bachelor's Degree | 0 (0.0%) | 0.0 |
| Graduate Degree | 0 (0.0%) | 0.0 |
| Total | 11 (100.0%) | 34.0 |
Fertility by Education by Marriage Status in Silver Grove
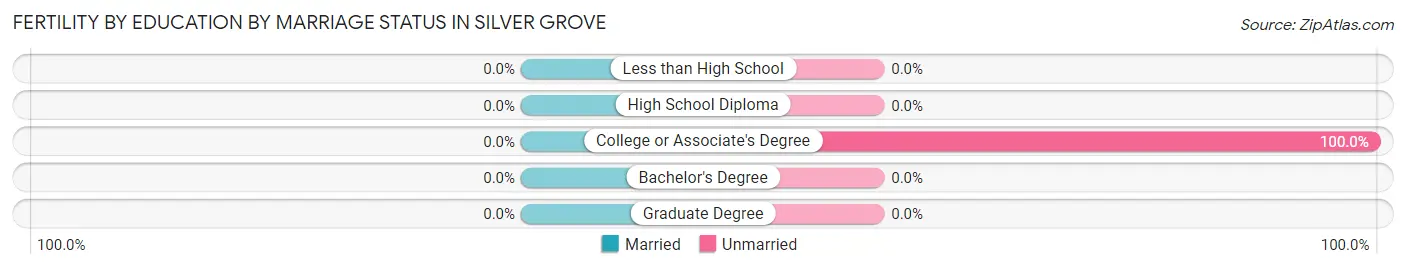
| Educational Attainment | Married | Unmarried |
| Less than High School | 0 (0.0%) | 0 (0.0%) |
| High School Diploma | 0 (0.0%) | 0 (0.0%) |
| College or Associate's Degree | 0 (0.0%) | 11 (100.0%) |
| Bachelor's Degree | 0 (0.0%) | 0 (0.0%) |
| Graduate Degree | 0 (0.0%) | 0 (0.0%) |
| Total | 0 (0.0%) | 11 (100.0%) |
Employment Characteristics in Silver Grove
Employment by Class of Employer in Silver Grove
Among the 630 employed individuals in Silver Grove, private company employees (464 | 73.7%), local government employees (117 | 18.6%), and not-for-profit organizations (34 | 5.4%) make up the most common classes of employment.
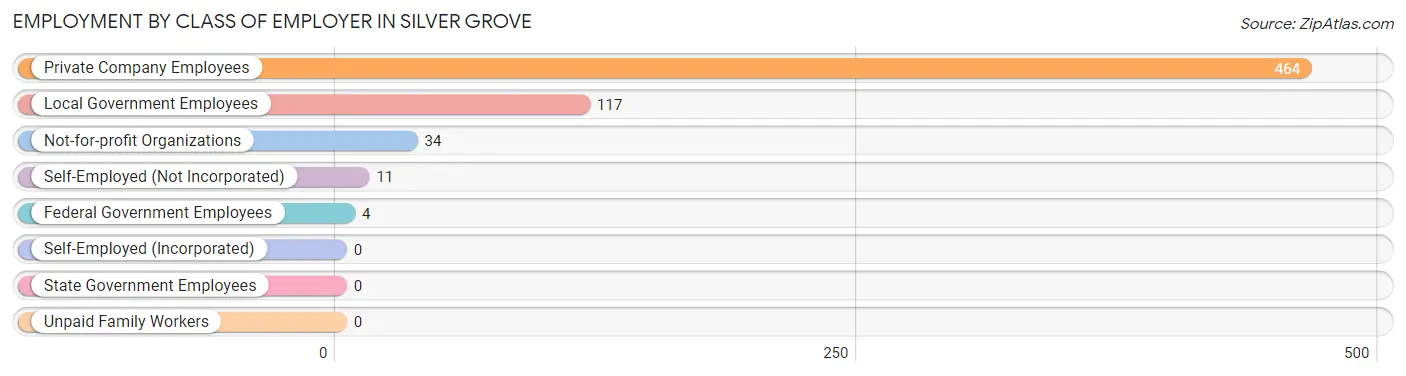
| Employer Class | # Employees | % Employees |
| Private Company Employees | 464 | 73.7% |
| Self-Employed (Incorporated) | 0 | 0.0% |
| Self-Employed (Not Incorporated) | 11 | 1.8% |
| Not-for-profit Organizations | 34 | 5.4% |
| Local Government Employees | 117 | 18.6% |
| State Government Employees | 0 | 0.0% |
| Federal Government Employees | 4 | 0.6% |
| Unpaid Family Workers | 0 | 0.0% |
| Total | 630 | 100.0% |
Employment Status by Age in Silver Grove
According to the labor force statistics for Silver Grove, out of the total population over 16 years of age (1,091), 61.0% or 666 individuals are in the labor force, with 5.4% or 36 of them unemployed. The age group with the highest labor force participation rate is 25 to 29 years, with 88.0% or 73 individuals in the labor force. Within the labor force, the 45 to 54 years age range has the highest percentage of unemployed individuals, with 13.3% or 32 of them being unemployed.
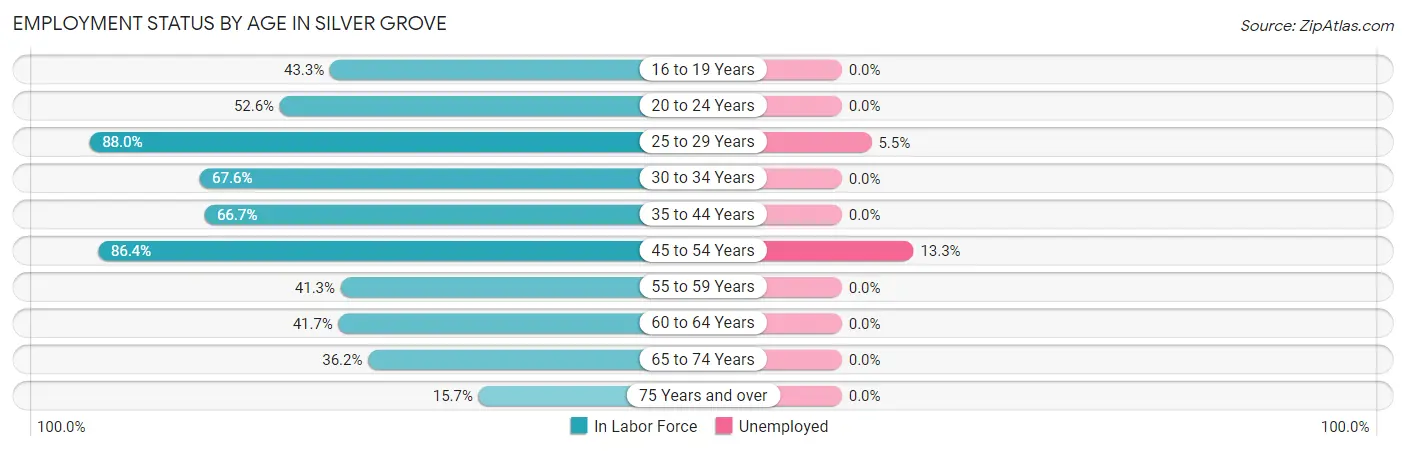
| Age Bracket | In Labor Force | Unemployed |
| 16 to 19 Years | 13 (43.3%) | 0 (0.0%) |
| 20 to 24 Years | 30 (52.6%) | 0 (0.0%) |
| 25 to 29 Years | 73 (88.0%) | 4 (5.5%) |
| 30 to 34 Years | 48 (67.6%) | 0 (0.0%) |
| 35 to 44 Years | 120 (66.7%) | 0 (0.0%) |
| 45 to 54 Years | 241 (86.4%) | 32 (13.3%) |
| 55 to 59 Years | 64 (41.3%) | 0 (0.0%) |
| 60 to 64 Years | 45 (41.7%) | 0 (0.0%) |
| 65 to 74 Years | 21 (36.2%) | 0 (0.0%) |
| 75 Years and over | 11 (15.7%) | 0 (0.0%) |
| Total | 666 (61.0%) | 36 (5.4%) |
Employment Status by Educational Attainment in Silver Grove
According to labor force statistics for Silver Grove, 67.5% of individuals (591) out of the total population between 25 and 64 years of age (876) are in the labor force, with 6.1% or 36 of them being unemployed. The group with the highest labor force participation rate are those with the educational attainment of bachelor's degree or higher, with 83.5% or 101 individuals in the labor force. Within the labor force, individuals with less than high school education have the highest percentage of unemployment, with 37.0% or 10 of them being unemployed.
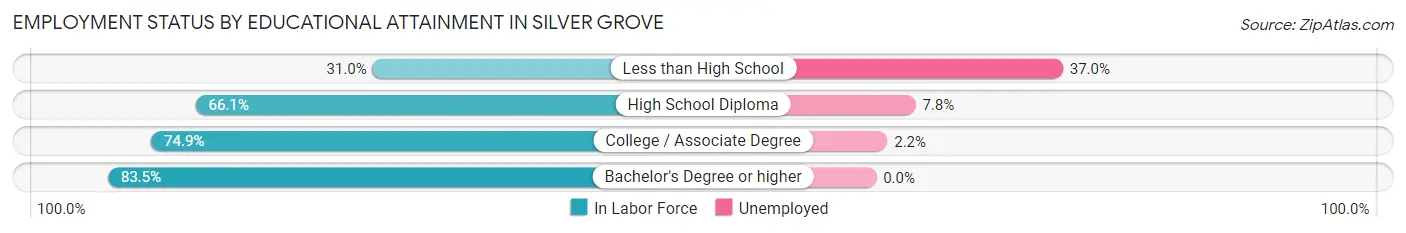
| Educational Attainment | In Labor Force | Unemployed |
| Less than High School | 27 (31.0%) | 32 (37.0%) |
| High School Diploma | 281 (66.1%) | 33 (7.8%) |
| College / Associate Degree | 182 (74.9%) | 5 (2.2%) |
| Bachelor's Degree or higher | 101 (83.5%) | 0 (0.0%) |
| Total | 591 (67.5%) | 53 (6.1%) |
Employment Occupations by Sex in Silver Grove
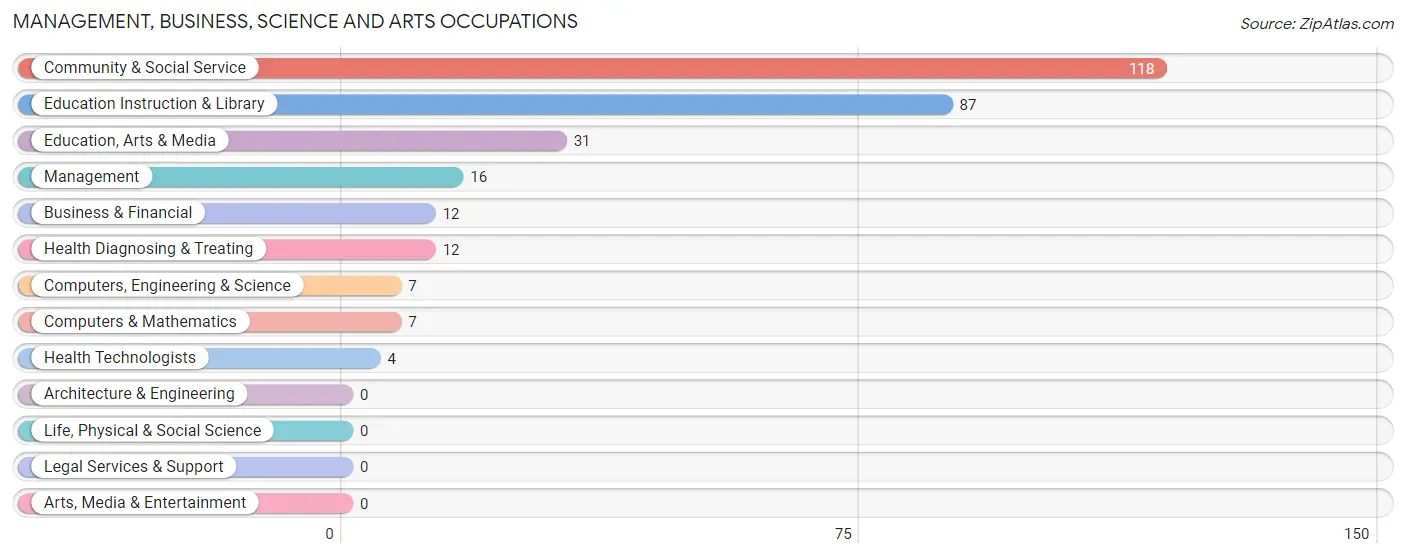
Management, Business, Science and Arts Occupations
The most common Management, Business, Science and Arts occupations in Silver Grove are Community & Social Service (118 | 18.7%), Education Instruction & Library (87 | 13.8%), Education, Arts & Media (31 | 4.9%), Management (16 | 2.5%), and Business & Financial (12 | 1.9%).
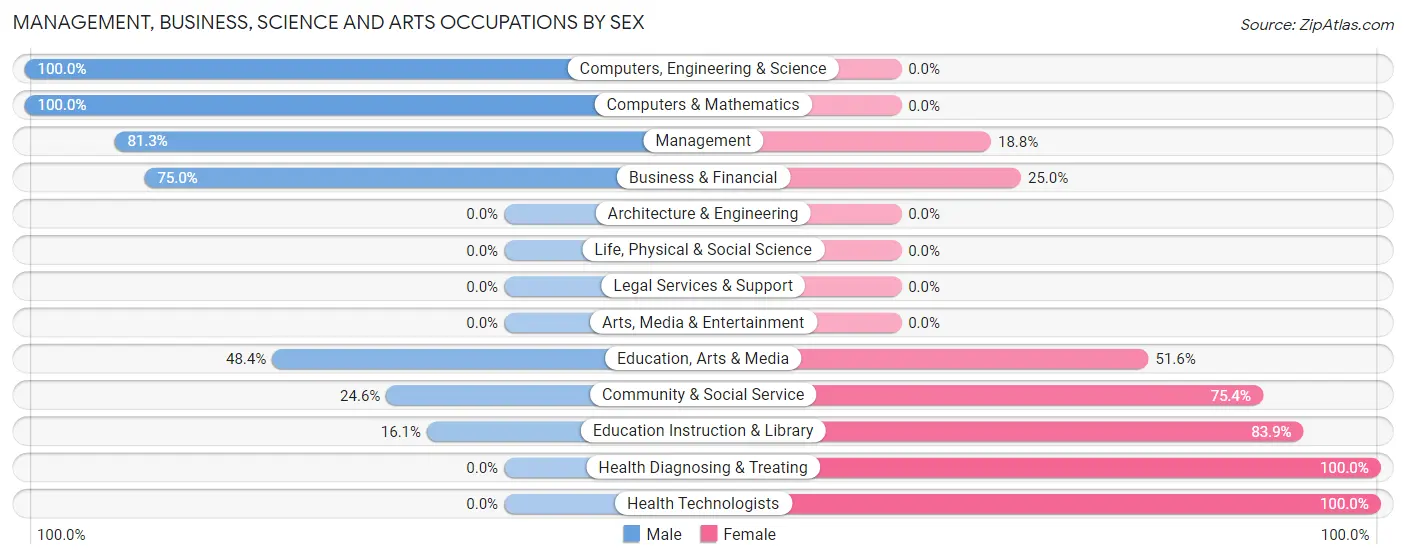
Management, Business, Science and Arts Occupations by Sex
Within the Management, Business, Science and Arts occupations in Silver Grove, the most male-oriented occupations are Computers, Engineering & Science (100.0%), Computers & Mathematics (100.0%), and Management (81.2%), while the most female-oriented occupations are Health Diagnosing & Treating (100.0%), Health Technologists (100.0%), and Education Instruction & Library (83.9%).
| Occupation | Male | Female |
| Management | 13 (81.2%) | 3 (18.8%) |
| Business & Financial | 9 (75.0%) | 3 (25.0%) |
| Computers, Engineering & Science | 7 (100.0%) | 0 (0.0%) |
| Computers & Mathematics | 7 (100.0%) | 0 (0.0%) |
| Architecture & Engineering | 0 (0.0%) | 0 (0.0%) |
| Life, Physical & Social Science | 0 (0.0%) | 0 (0.0%) |
| Community & Social Service | 29 (24.6%) | 89 (75.4%) |
| Education, Arts & Media | 15 (48.4%) | 16 (51.6%) |
| Legal Services & Support | 0 (0.0%) | 0 (0.0%) |
| Education Instruction & Library | 14 (16.1%) | 73 (83.9%) |
| Arts, Media & Entertainment | 0 (0.0%) | 0 (0.0%) |
| Health Diagnosing & Treating | 0 (0.0%) | 12 (100.0%) |
| Health Technologists | 0 (0.0%) | 4 (100.0%) |
| Total (Category) | 58 (35.1%) | 107 (64.8%) |
| Total (Overall) | 302 (47.9%) | 328 (52.1%) |
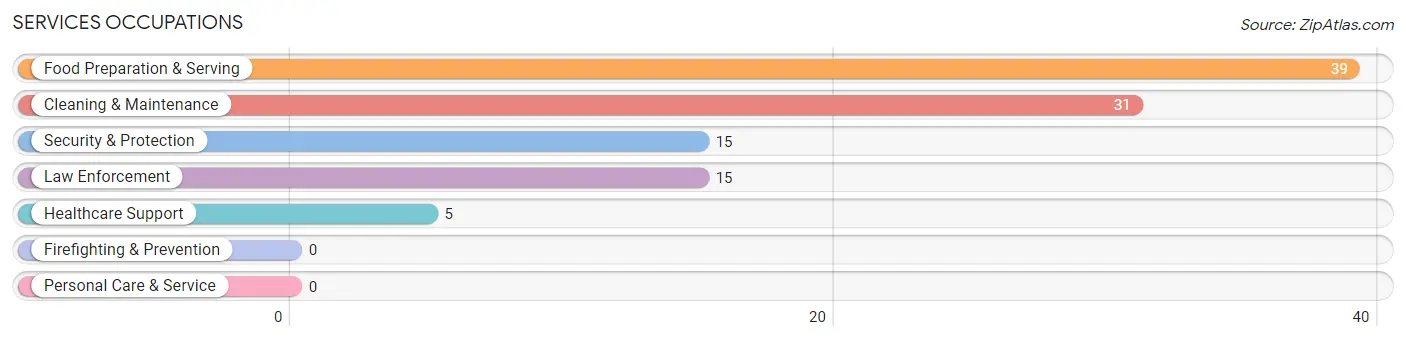
Services Occupations
The most common Services occupations in Silver Grove are Food Preparation & Serving (39 | 6.2%), Cleaning & Maintenance (31 | 4.9%), Security & Protection (15 | 2.4%), Law Enforcement (15 | 2.4%), and Healthcare Support (5 | 0.8%).
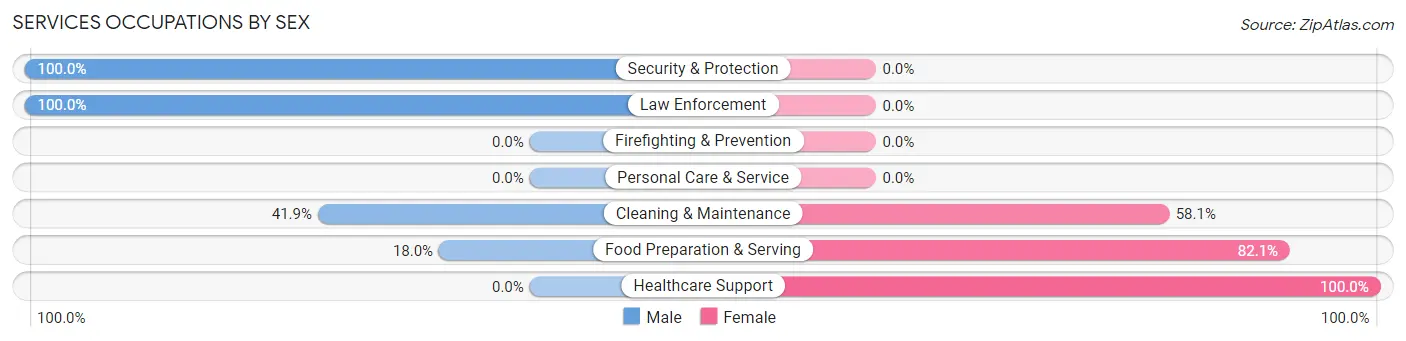
Services Occupations by Sex
Within the Services occupations in Silver Grove, the most male-oriented occupations are Security & Protection (100.0%), Law Enforcement (100.0%), and Cleaning & Maintenance (41.9%), while the most female-oriented occupations are Healthcare Support (100.0%), Food Preparation & Serving (82.1%), and Cleaning & Maintenance (58.1%).
| Occupation | Male | Female |
| Healthcare Support | 0 (0.0%) | 5 (100.0%) |
| Security & Protection | 15 (100.0%) | 0 (0.0%) |
| Firefighting & Prevention | 0 (0.0%) | 0 (0.0%) |
| Law Enforcement | 15 (100.0%) | 0 (0.0%) |
| Food Preparation & Serving | 7 (17.9%) | 32 (82.1%) |
| Cleaning & Maintenance | 13 (41.9%) | 18 (58.1%) |
| Personal Care & Service | 0 (0.0%) | 0 (0.0%) |
| Total (Category) | 35 (38.9%) | 55 (61.1%) |
| Total (Overall) | 302 (47.9%) | 328 (52.1%) |
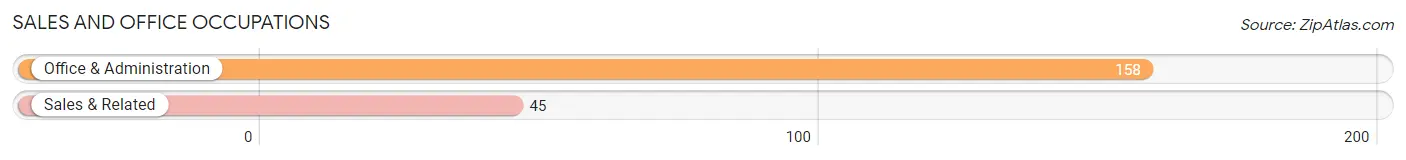
Sales and Office Occupations
The most common Sales and Office occupations in Silver Grove are Office & Administration (158 | 25.1%), and Sales & Related (45 | 7.1%).
Sales and Office Occupations by Sex
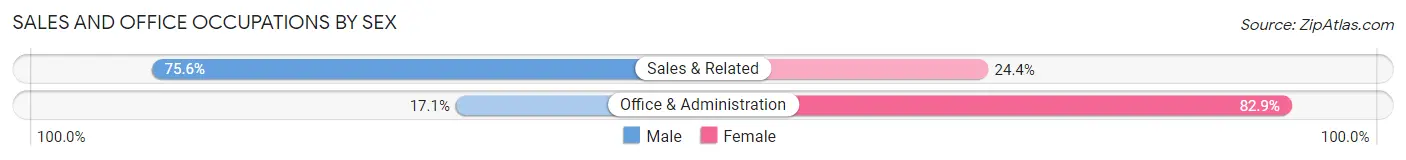
| Occupation | Male | Female |
| Sales & Related | 34 (75.6%) | 11 (24.4%) |
| Office & Administration | 27 (17.1%) | 131 (82.9%) |
| Total (Category) | 61 (30.0%) | 142 (70.0%) |
| Total (Overall) | 302 (47.9%) | 328 (52.1%) |
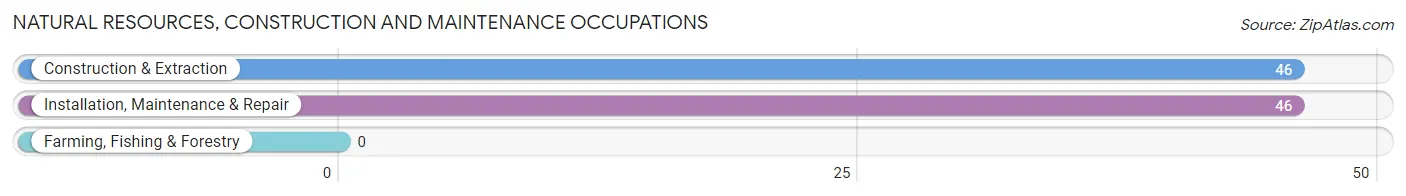
Natural Resources, Construction and Maintenance Occupations
The most common Natural Resources, Construction and Maintenance occupations in Silver Grove are Construction & Extraction (46 | 7.3%), and Installation, Maintenance & Repair (46 | 7.3%).
Natural Resources, Construction and Maintenance Occupations by Sex
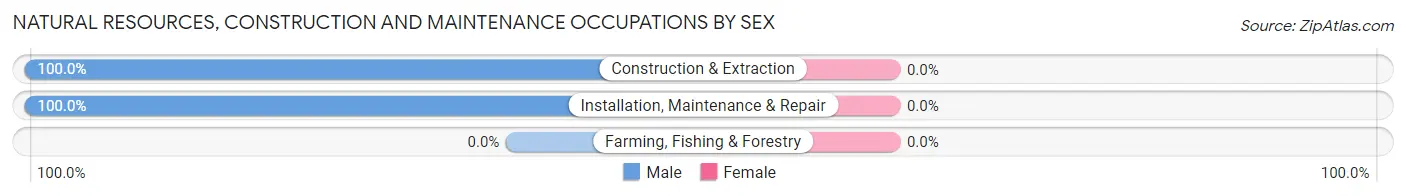
| Occupation | Male | Female |
| Farming, Fishing & Forestry | 0 (0.0%) | 0 (0.0%) |
| Construction & Extraction | 46 (100.0%) | 0 (0.0%) |
| Installation, Maintenance & Repair | 46 (100.0%) | 0 (0.0%) |
| Total (Category) | 92 (100.0%) | 0 (0.0%) |
| Total (Overall) | 302 (47.9%) | 328 (52.1%) |
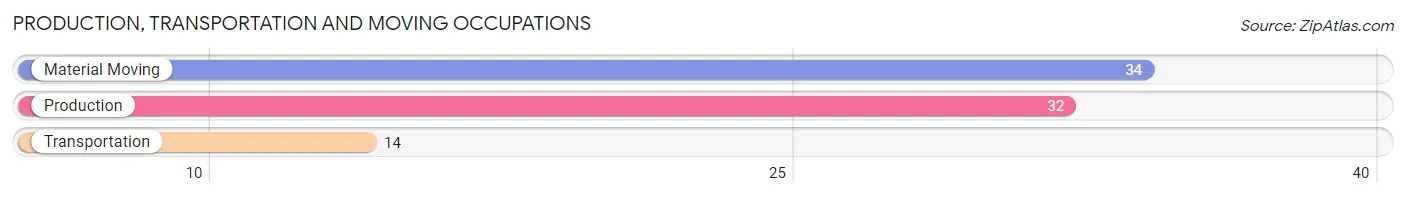
Production, Transportation and Moving Occupations
The most common Production, Transportation and Moving occupations in Silver Grove are Material Moving (34 | 5.4%), Production (32 | 5.1%), and Transportation (14 | 2.2%).
Production, Transportation and Moving Occupations by Sex
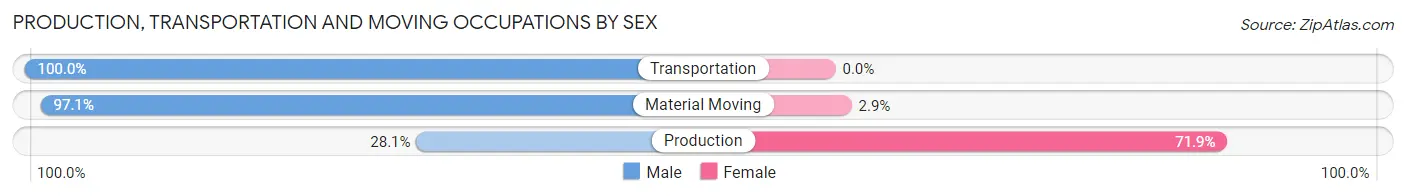
| Occupation | Male | Female |
| Production | 9 (28.1%) | 23 (71.9%) |
| Transportation | 14 (100.0%) | 0 (0.0%) |
| Material Moving | 33 (97.1%) | 1 (2.9%) |
| Total (Category) | 56 (70.0%) | 24 (30.0%) |
| Total (Overall) | 302 (47.9%) | 328 (52.1%) |
Employment Industries by Sex in Silver Grove
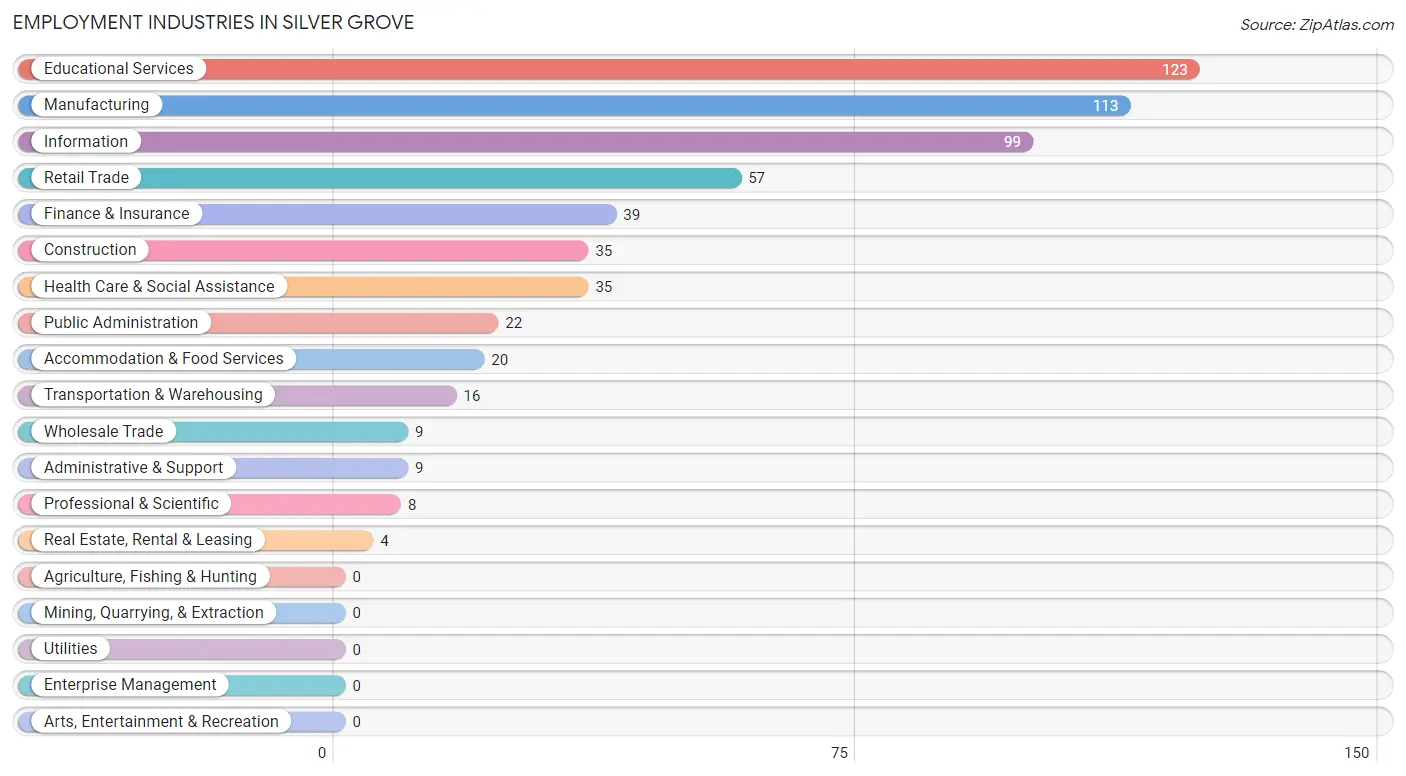
Employment Industries in Silver Grove
The major employment industries in Silver Grove include Educational Services (123 | 19.5%), Manufacturing (113 | 17.9%), Information (99 | 15.7%), Retail Trade (57 | 9.0%), and Finance & Insurance (39 | 6.2%).
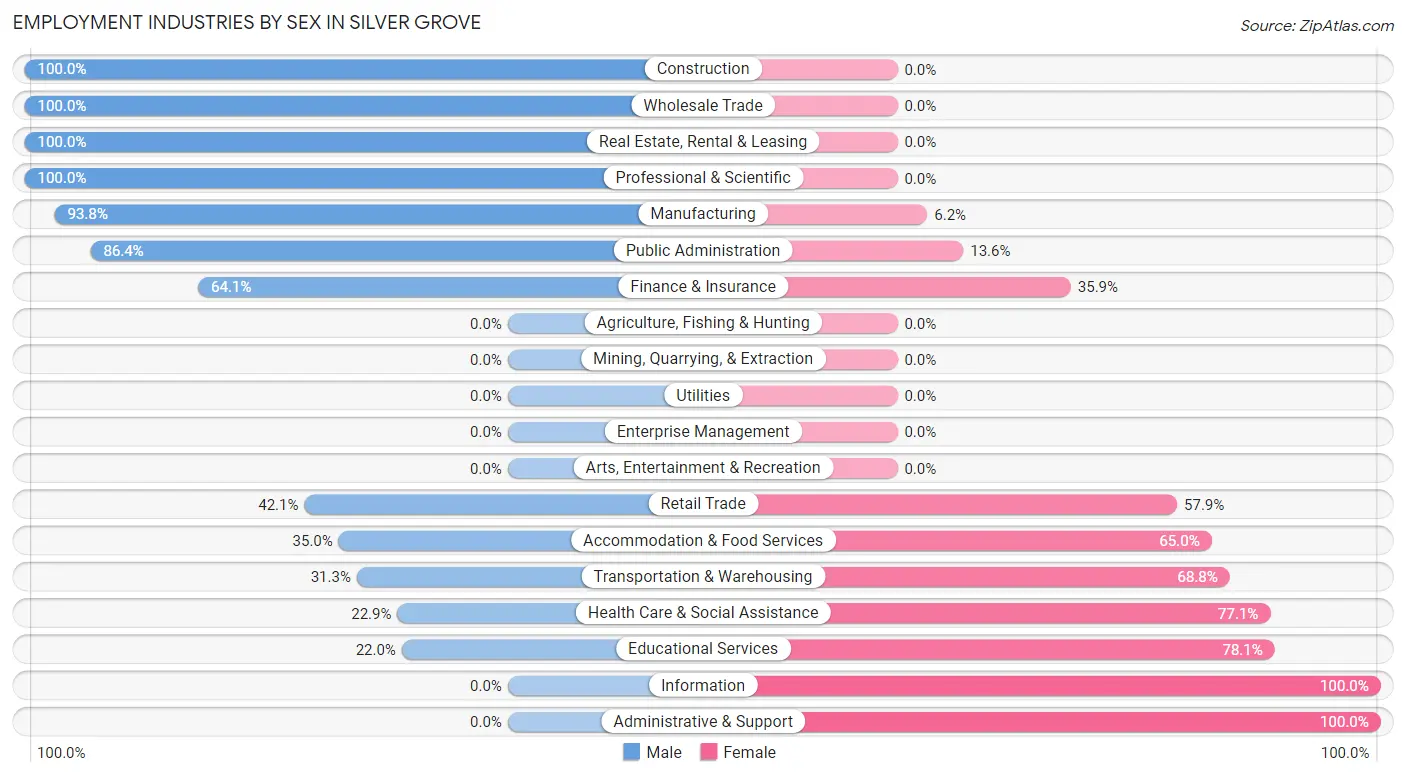
Employment Industries by Sex in Silver Grove
The Silver Grove industries that see more men than women are Construction (100.0%), Wholesale Trade (100.0%), and Real Estate, Rental & Leasing (100.0%), whereas the industries that tend to have a higher number of women are Information (100.0%), Administrative & Support (100.0%), and Educational Services (78.0%).
| Industry | Male | Female |
| Agriculture, Fishing & Hunting | 0 (0.0%) | 0 (0.0%) |
| Mining, Quarrying, & Extraction | 0 (0.0%) | 0 (0.0%) |
| Construction | 35 (100.0%) | 0 (0.0%) |
| Manufacturing | 106 (93.8%) | 7 (6.2%) |
| Wholesale Trade | 9 (100.0%) | 0 (0.0%) |
| Retail Trade | 24 (42.1%) | 33 (57.9%) |
| Transportation & Warehousing | 5 (31.2%) | 11 (68.8%) |
| Utilities | 0 (0.0%) | 0 (0.0%) |
| Information | 0 (0.0%) | 99 (100.0%) |
| Finance & Insurance | 25 (64.1%) | 14 (35.9%) |
| Real Estate, Rental & Leasing | 4 (100.0%) | 0 (0.0%) |
| Professional & Scientific | 8 (100.0%) | 0 (0.0%) |
| Enterprise Management | 0 (0.0%) | 0 (0.0%) |
| Administrative & Support | 0 (0.0%) | 9 (100.0%) |
| Educational Services | 27 (22.0%) | 96 (78.0%) |
| Health Care & Social Assistance | 8 (22.9%) | 27 (77.1%) |
| Arts, Entertainment & Recreation | 0 (0.0%) | 0 (0.0%) |
| Accommodation & Food Services | 7 (35.0%) | 13 (65.0%) |
| Public Administration | 19 (86.4%) | 3 (13.6%) |
| Total | 302 (47.9%) | 328 (52.1%) |
Education in Silver Grove
School Enrollment in Silver Grove
The most common levels of schooling among the 210 students in Silver Grove are elementary school (80 | 38.1%), middle school (52 | 24.8%), and high school (43 | 20.5%).
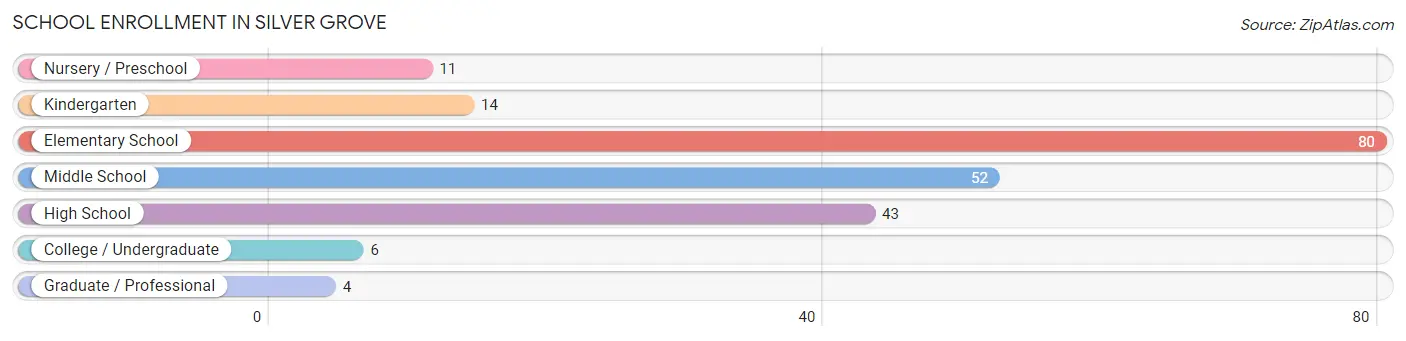
| School Level | # Students | % Students |
| Nursery / Preschool | 11 | 5.2% |
| Kindergarten | 14 | 6.7% |
| Elementary School | 80 | 38.1% |
| Middle School | 52 | 24.8% |
| High School | 43 | 20.5% |
| College / Undergraduate | 6 | 2.9% |
| Graduate / Professional | 4 | 1.9% |
| Total | 210 | 100.0% |
School Enrollment by Age by Funding Source in Silver Grove
Out of a total of 210 students who are enrolled in schools in Silver Grove, 18 (8.6%) attend a private institution, while the remaining 192 (91.4%) are enrolled in public schools. The age group of 5 to 9 year old has the highest likelihood of being enrolled in private schools, with 9 (9.9% in the age bracket) enrolled. Conversely, the age group of 3 to 4 year olds has the lowest likelihood of being enrolled in a private school, with 11 (100.0% in the age bracket) attending a public institution.
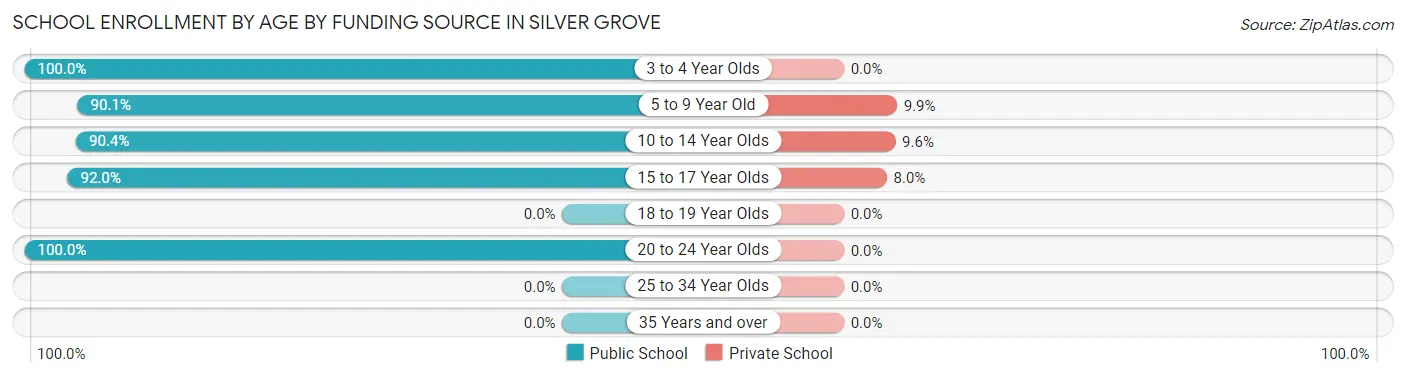
| Age Bracket | Public School | Private School |
| 3 to 4 Year Olds | 11 (100.0%) | 0 (0.0%) |
| 5 to 9 Year Old | 82 (90.1%) | 9 (9.9%) |
| 10 to 14 Year Olds | 66 (90.4%) | 7 (9.6%) |
| 15 to 17 Year Olds | 23 (92.0%) | 2 (8.0%) |
| 18 to 19 Year Olds | 0 (0.0%) | 0 (0.0%) |
| 20 to 24 Year Olds | 10 (100.0%) | 0 (0.0%) |
| 25 to 34 Year Olds | 0 (0.0%) | 0 (0.0%) |
| 35 Years and over | 0 (0.0%) | 0 (0.0%) |
| Total | 192 (91.4%) | 18 (8.6%) |
Educational Attainment by Field of Study in Silver Grove
Education (77 | 46.7%), liberal arts & history (22 | 13.3%), arts & humanities (17 | 10.3%), business (16 | 9.7%), and bio, nature & agricultural (14 | 8.5%) are the most common fields of study among 165 individuals in Silver Grove who have obtained a bachelor's degree or higher.
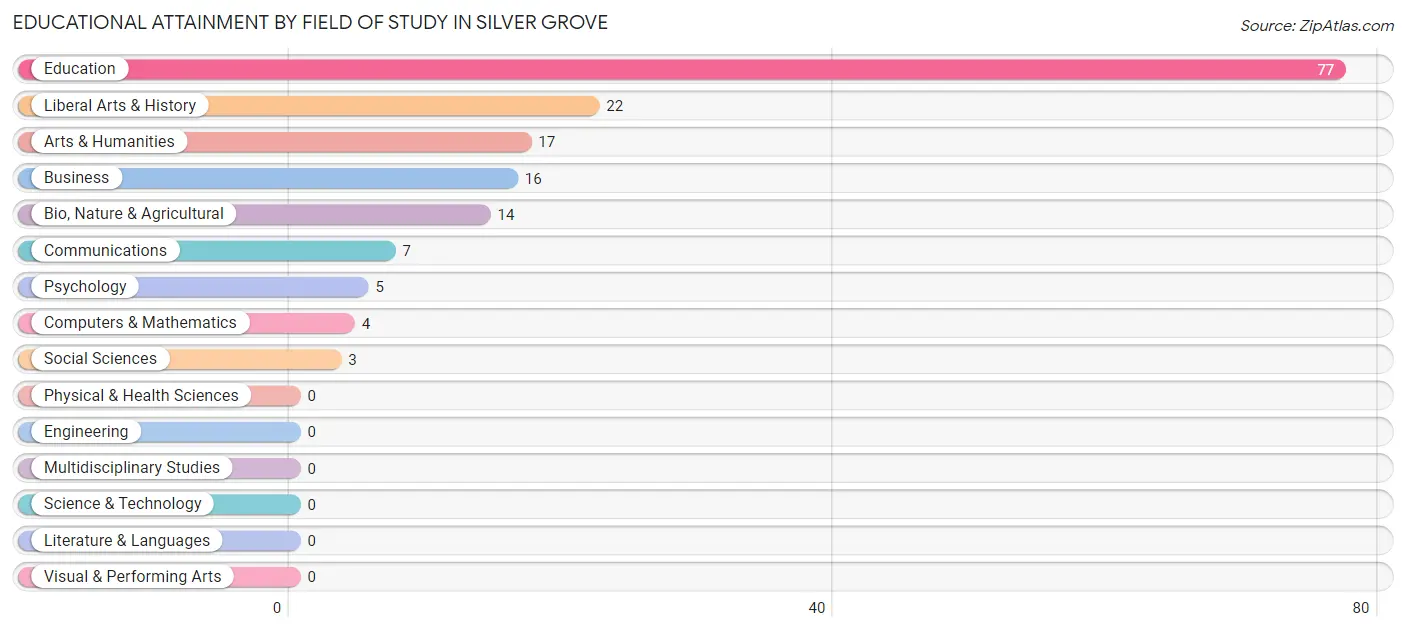
| Field of Study | # Graduates | % Graduates |
| Computers & Mathematics | 4 | 2.4% |
| Bio, Nature & Agricultural | 14 | 8.5% |
| Physical & Health Sciences | 0 | 0.0% |
| Psychology | 5 | 3.0% |
| Social Sciences | 3 | 1.8% |
| Engineering | 0 | 0.0% |
| Multidisciplinary Studies | 0 | 0.0% |
| Science & Technology | 0 | 0.0% |
| Business | 16 | 9.7% |
| Education | 77 | 46.7% |
| Literature & Languages | 0 | 0.0% |
| Liberal Arts & History | 22 | 13.3% |
| Visual & Performing Arts | 0 | 0.0% |
| Communications | 7 | 4.2% |
| Arts & Humanities | 17 | 10.3% |
| Total | 165 | 100.0% |
Transportation & Commute in Silver Grove
Vehicle Availability by Sex in Silver Grove
The most prevalent vehicle ownership categories in Silver Grove are males with 1 vehicle (112, accounting for 37.1%) and females with 1 vehicle (131, making up 37.2%).
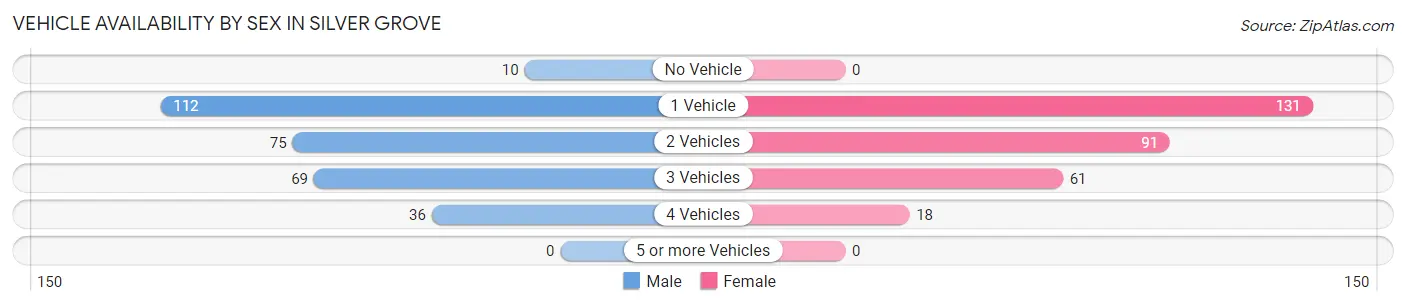
| Vehicles Available | Male | Female |
| No Vehicle | 10 (3.3%) | 0 (0.0%) |
| 1 Vehicle | 112 (37.1%) | 131 (43.5%) |
| 2 Vehicles | 75 (24.8%) | 91 (30.2%) |
| 3 Vehicles | 69 (22.9%) | 61 (20.3%) |
| 4 Vehicles | 36 (11.9%) | 18 (6.0%) |
| 5 or more Vehicles | 0 (0.0%) | 0 (0.0%) |
| Total | 302 (100.0%) | 301 (100.0%) |
Commute Time in Silver Grove
The most frequently occuring commute durations in Silver Grove are 20 to 24 minutes (156 commuters, 25.7%), 10 to 14 minutes (97 commuters, 16.0%), and less than 5 minutes (91 commuters, 15.0%).
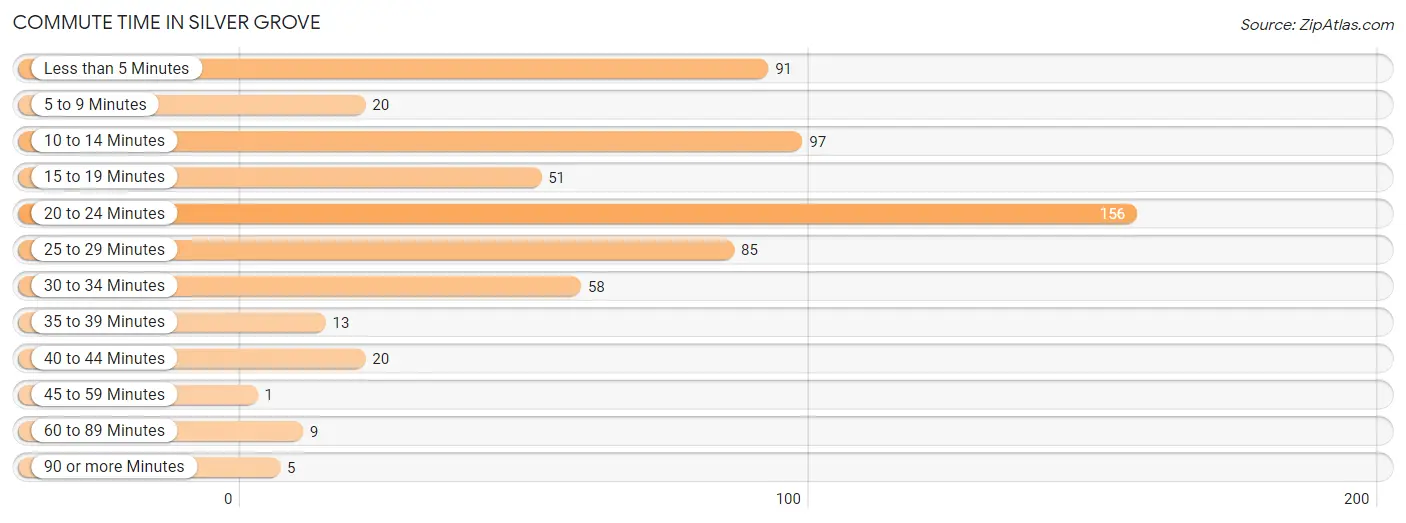
| Commute Time | # Commuters | % Commuters |
| Less than 5 Minutes | 91 | 15.0% |
| 5 to 9 Minutes | 20 | 3.3% |
| 10 to 14 Minutes | 97 | 16.0% |
| 15 to 19 Minutes | 51 | 8.4% |
| 20 to 24 Minutes | 156 | 25.7% |
| 25 to 29 Minutes | 85 | 14.0% |
| 30 to 34 Minutes | 58 | 9.6% |
| 35 to 39 Minutes | 13 | 2.1% |
| 40 to 44 Minutes | 20 | 3.3% |
| 45 to 59 Minutes | 1 | 0.2% |
| 60 to 89 Minutes | 9 | 1.5% |
| 90 or more Minutes | 5 | 0.8% |
Commute Time by Sex in Silver Grove
The most common commute times in Silver Grove are 25 to 29 minutes (69 commuters, 23.9%) for males and 20 to 24 minutes (127 commuters, 40.1%) for females.
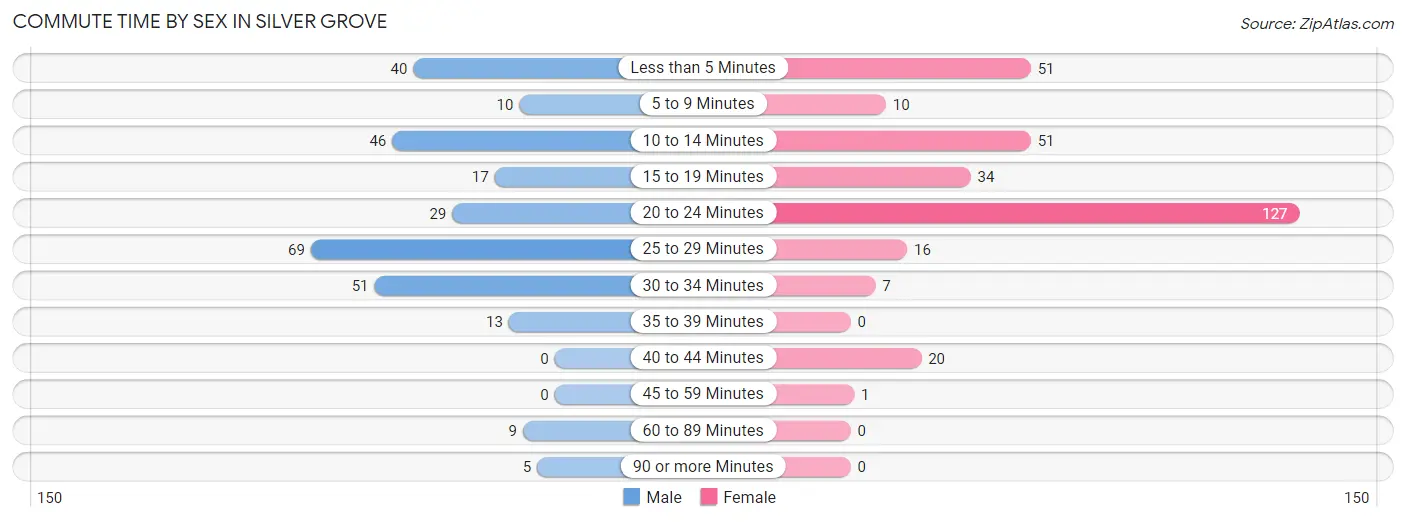
| Commute Time | Male | Female |
| Less than 5 Minutes | 40 (13.8%) | 51 (16.1%) |
| 5 to 9 Minutes | 10 (3.5%) | 10 (3.2%) |
| 10 to 14 Minutes | 46 (15.9%) | 51 (16.1%) |
| 15 to 19 Minutes | 17 (5.9%) | 34 (10.7%) |
| 20 to 24 Minutes | 29 (10.0%) | 127 (40.1%) |
| 25 to 29 Minutes | 69 (23.9%) | 16 (5.1%) |
| 30 to 34 Minutes | 51 (17.6%) | 7 (2.2%) |
| 35 to 39 Minutes | 13 (4.5%) | 0 (0.0%) |
| 40 to 44 Minutes | 0 (0.0%) | 20 (6.3%) |
| 45 to 59 Minutes | 0 (0.0%) | 1 (0.3%) |
| 60 to 89 Minutes | 9 (3.1%) | 0 (0.0%) |
| 90 or more Minutes | 5 (1.7%) | 0 (0.0%) |
Time of Departure to Work by Sex in Silver Grove
The most frequent times of departure to work in Silver Grove are 12:00 PM to 3:59 PM (76, 26.3%) for males and 7:00 AM to 7:29 AM (117, 36.9%) for females.
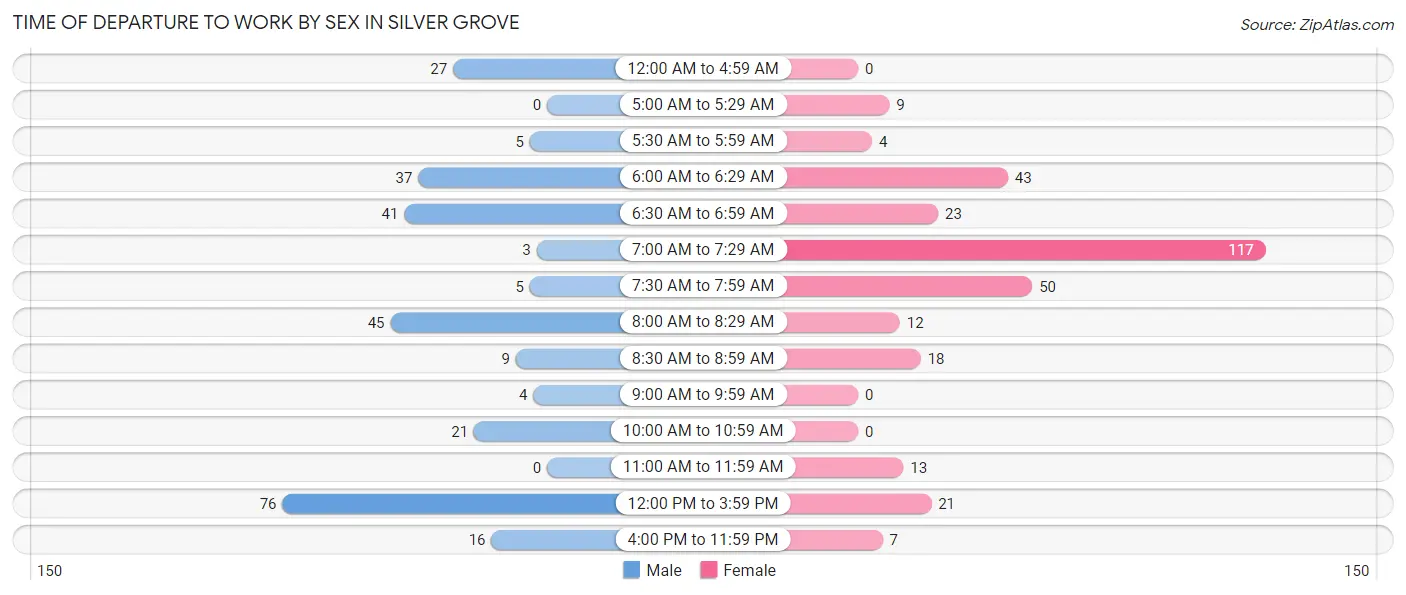
| Time of Departure | Male | Female |
| 12:00 AM to 4:59 AM | 27 (9.3%) | 0 (0.0%) |
| 5:00 AM to 5:29 AM | 0 (0.0%) | 9 (2.8%) |
| 5:30 AM to 5:59 AM | 5 (1.7%) | 4 (1.3%) |
| 6:00 AM to 6:29 AM | 37 (12.8%) | 43 (13.6%) |
| 6:30 AM to 6:59 AM | 41 (14.2%) | 23 (7.3%) |
| 7:00 AM to 7:29 AM | 3 (1.0%) | 117 (36.9%) |
| 7:30 AM to 7:59 AM | 5 (1.7%) | 50 (15.8%) |
| 8:00 AM to 8:29 AM | 45 (15.6%) | 12 (3.8%) |
| 8:30 AM to 8:59 AM | 9 (3.1%) | 18 (5.7%) |
| 9:00 AM to 9:59 AM | 4 (1.4%) | 0 (0.0%) |
| 10:00 AM to 10:59 AM | 21 (7.3%) | 0 (0.0%) |
| 11:00 AM to 11:59 AM | 0 (0.0%) | 13 (4.1%) |
| 12:00 PM to 3:59 PM | 76 (26.3%) | 21 (6.6%) |
| 4:00 PM to 11:59 PM | 16 (5.5%) | 7 (2.2%) |
| Total | 289 (100.0%) | 317 (100.0%) |
Housing Occupancy in Silver Grove
Occupancy by Ownership in Silver Grove
Of the total 633 dwellings in Silver Grove, owner-occupied units account for 362 (57.2%), while renter-occupied units make up 271 (42.8%).
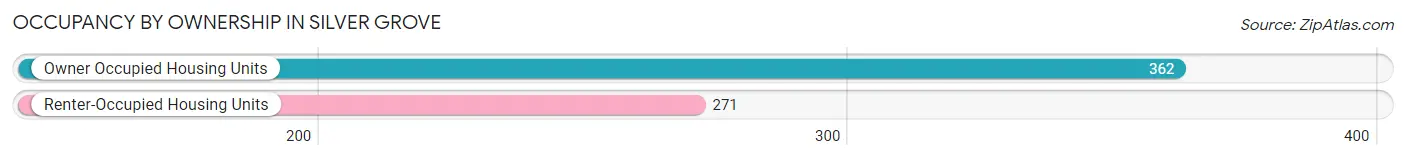
| Occupancy | # Housing Units | % Housing Units |
| Owner Occupied Housing Units | 362 | 57.2% |
| Renter-Occupied Housing Units | 271 | 42.8% |
| Total Occupied Housing Units | 633 | 100.0% |
Occupancy by Household Size in Silver Grove
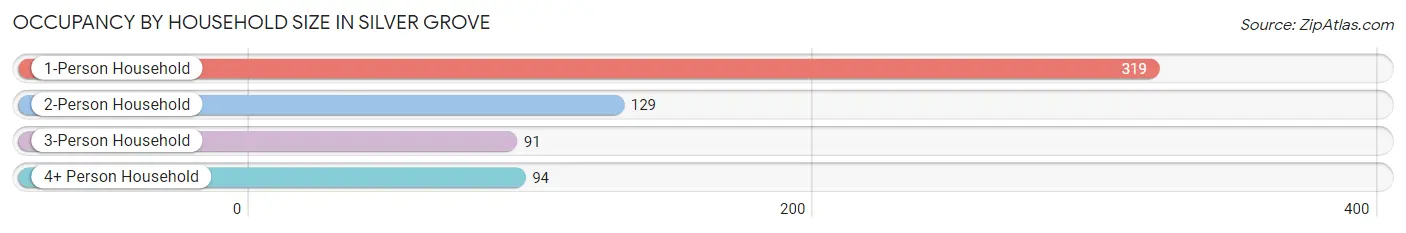
| Household Size | # Housing Units | % Housing Units |
| 1-Person Household | 319 | 50.4% |
| 2-Person Household | 129 | 20.4% |
| 3-Person Household | 91 | 14.4% |
| 4+ Person Household | 94 | 14.8% |
| Total Housing Units | 633 | 100.0% |
Occupancy by Ownership by Household Size in Silver Grove
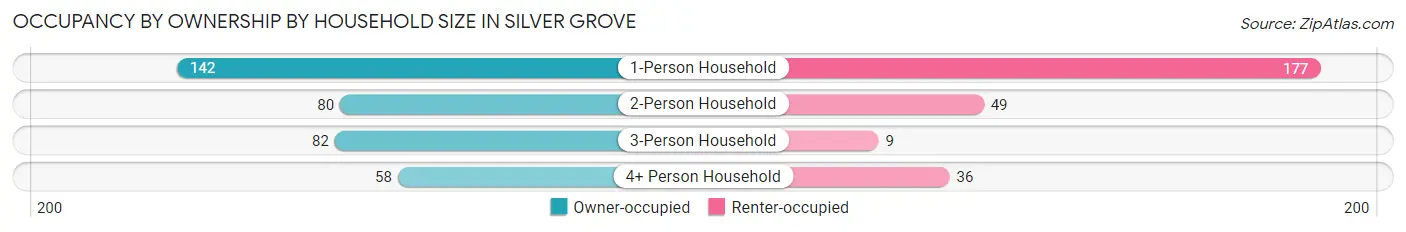
| Household Size | Owner-occupied | Renter-occupied |
| 1-Person Household | 142 (44.5%) | 177 (55.5%) |
| 2-Person Household | 80 (62.0%) | 49 (38.0%) |
| 3-Person Household | 82 (90.1%) | 9 (9.9%) |
| 4+ Person Household | 58 (61.7%) | 36 (38.3%) |
| Total Housing Units | 362 (57.2%) | 271 (42.8%) |
Occupancy by Educational Attainment in Silver Grove
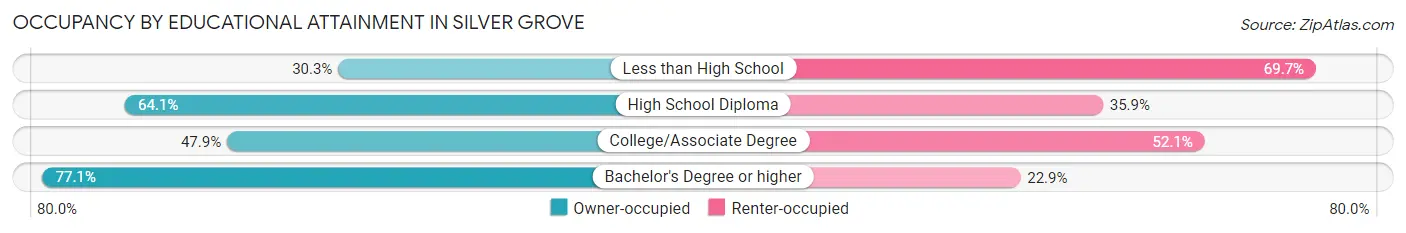
| Household Size | Owner-occupied | Renter-occupied |
| Less than High School | 23 (30.3%) | 53 (69.7%) |
| High School Diploma | 205 (64.1%) | 115 (35.9%) |
| College/Associate Degree | 80 (47.9%) | 87 (52.1%) |
| Bachelor's Degree or higher | 54 (77.1%) | 16 (22.9%) |
Occupancy by Age of Householder in Silver Grove
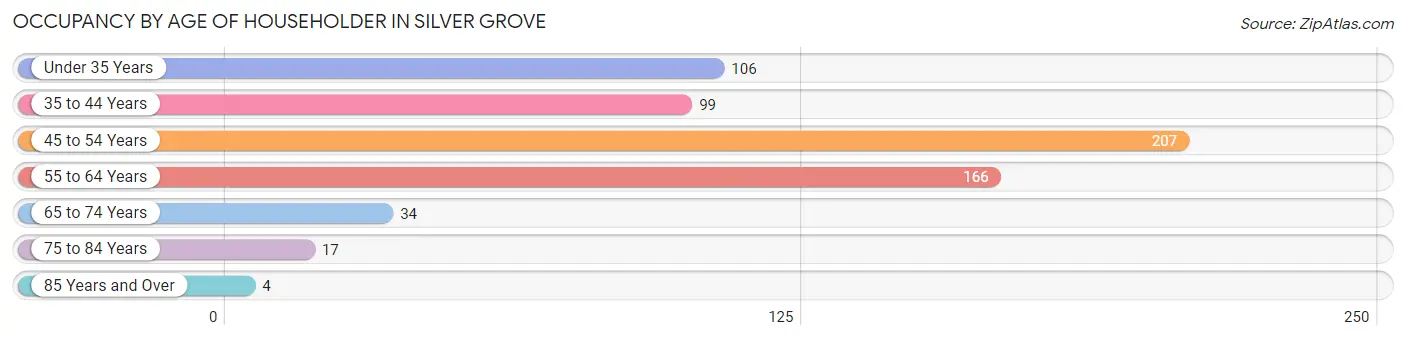
| Age Bracket | # Households | % Households |
| Under 35 Years | 106 | 16.8% |
| 35 to 44 Years | 99 | 15.6% |
| 45 to 54 Years | 207 | 32.7% |
| 55 to 64 Years | 166 | 26.2% |
| 65 to 74 Years | 34 | 5.4% |
| 75 to 84 Years | 17 | 2.7% |
| 85 Years and Over | 4 | 0.6% |
| Total | 633 | 100.0% |
Housing Finances in Silver Grove
Median Income by Occupancy in Silver Grove
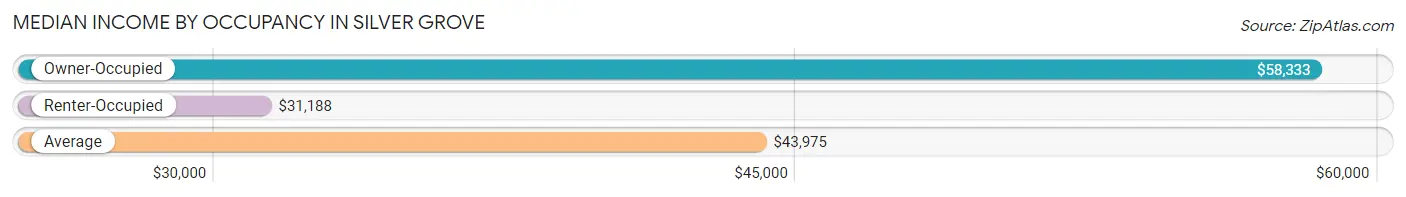
| Occupancy Type | # Households | Median Income |
| Owner-Occupied | 362 (57.2%) | $58,333 |
| Renter-Occupied | 271 (42.8%) | $31,188 |
| Average | 633 (100.0%) | $43,975 |
Occupancy by Householder Income Bracket in Silver Grove
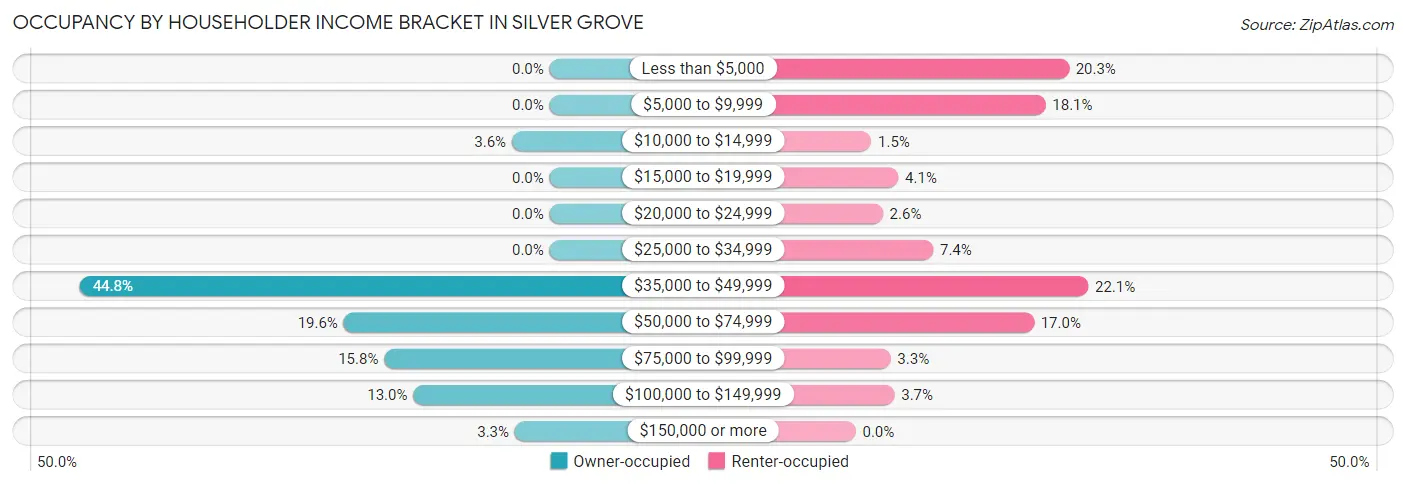
| Income Bracket | Owner-occupied | Renter-occupied |
| Less than $5,000 | 0 (0.0%) | 55 (20.3%) |
| $5,000 to $9,999 | 0 (0.0%) | 49 (18.1%) |
| $10,000 to $14,999 | 13 (3.6%) | 4 (1.5%) |
| $15,000 to $19,999 | 0 (0.0%) | 11 (4.1%) |
| $20,000 to $24,999 | 0 (0.0%) | 7 (2.6%) |
| $25,000 to $34,999 | 0 (0.0%) | 20 (7.4%) |
| $35,000 to $49,999 | 162 (44.8%) | 60 (22.1%) |
| $50,000 to $74,999 | 71 (19.6%) | 46 (17.0%) |
| $75,000 to $99,999 | 57 (15.8%) | 9 (3.3%) |
| $100,000 to $149,999 | 47 (13.0%) | 10 (3.7%) |
| $150,000 or more | 12 (3.3%) | 0 (0.0%) |
| Total | 362 (100.0%) | 271 (100.0%) |
Monthly Housing Cost Tiers in Silver Grove
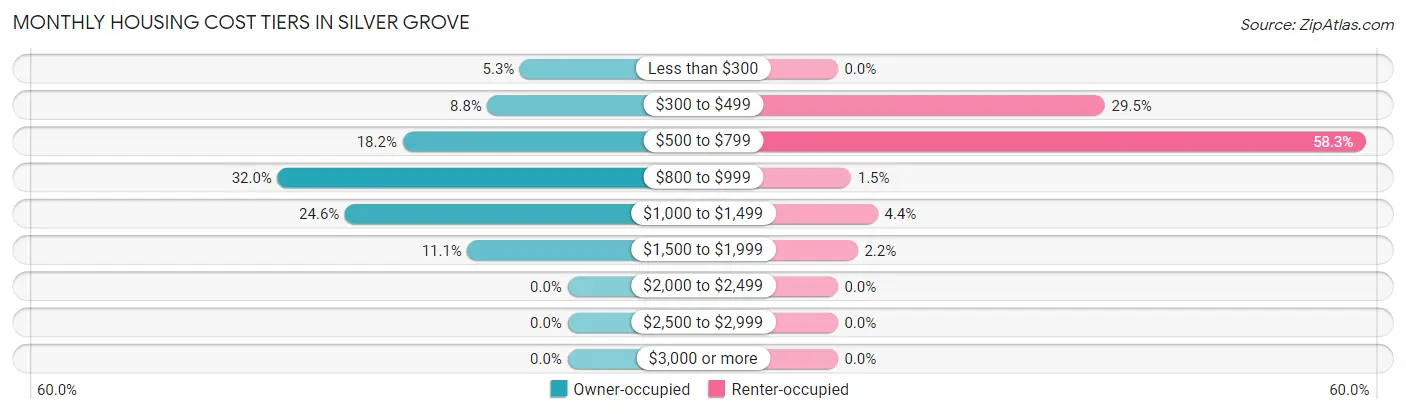
| Monthly Cost | Owner-occupied | Renter-occupied |
| Less than $300 | 19 (5.2%) | 0 (0.0%) |
| $300 to $499 | 32 (8.8%) | 80 (29.5%) |
| $500 to $799 | 66 (18.2%) | 158 (58.3%) |
| $800 to $999 | 116 (32.0%) | 4 (1.5%) |
| $1,000 to $1,499 | 89 (24.6%) | 12 (4.4%) |
| $1,500 to $1,999 | 40 (11.1%) | 6 (2.2%) |
| $2,000 to $2,499 | 0 (0.0%) | 0 (0.0%) |
| $2,500 to $2,999 | 0 (0.0%) | 0 (0.0%) |
| $3,000 or more | 0 (0.0%) | 0 (0.0%) |
| Total | 362 (100.0%) | 271 (100.0%) |
Physical Housing Characteristics in Silver Grove
Housing Structures in Silver Grove
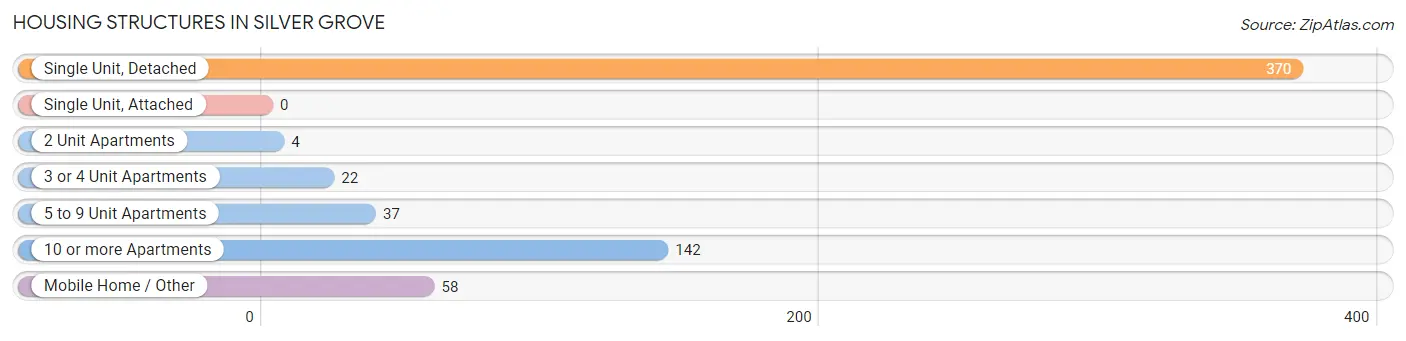
| Structure Type | # Housing Units | % Housing Units |
| Single Unit, Detached | 370 | 58.5% |
| Single Unit, Attached | 0 | 0.0% |
| 2 Unit Apartments | 4 | 0.6% |
| 3 or 4 Unit Apartments | 22 | 3.5% |
| 5 to 9 Unit Apartments | 37 | 5.9% |
| 10 or more Apartments | 142 | 22.4% |
| Mobile Home / Other | 58 | 9.2% |
| Total | 633 | 100.0% |
Housing Structures by Occupancy in Silver Grove
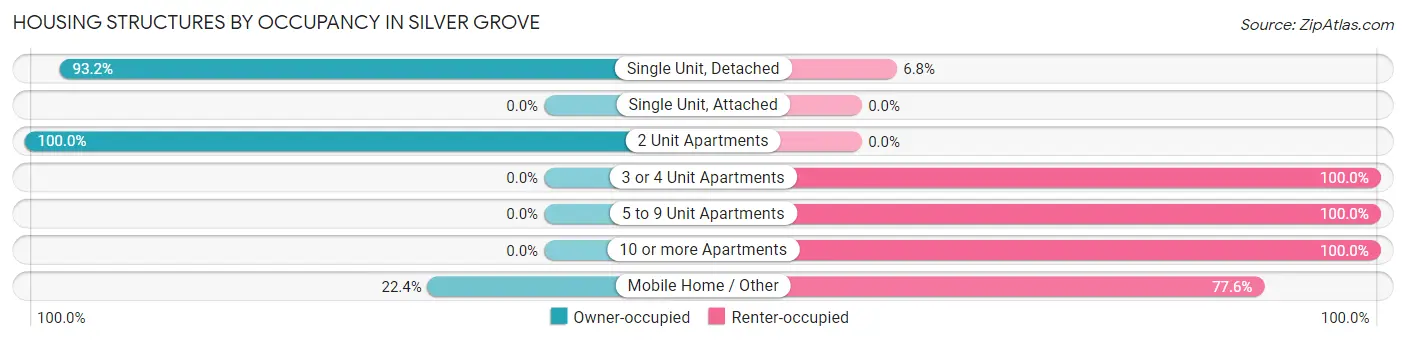
| Structure Type | Owner-occupied | Renter-occupied |
| Single Unit, Detached | 345 (93.2%) | 25 (6.8%) |
| Single Unit, Attached | 0 (0.0%) | 0 (0.0%) |
| 2 Unit Apartments | 4 (100.0%) | 0 (0.0%) |
| 3 or 4 Unit Apartments | 0 (0.0%) | 22 (100.0%) |
| 5 to 9 Unit Apartments | 0 (0.0%) | 37 (100.0%) |
| 10 or more Apartments | 0 (0.0%) | 142 (100.0%) |
| Mobile Home / Other | 13 (22.4%) | 45 (77.6%) |
| Total | 362 (57.2%) | 271 (42.8%) |
Housing Structures by Number of Rooms in Silver Grove
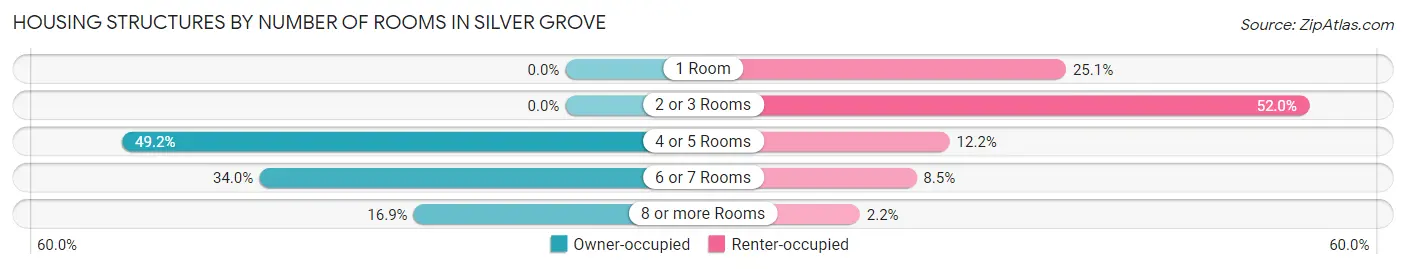
| Number of Rooms | Owner-occupied | Renter-occupied |
| 1 Room | 0 (0.0%) | 68 (25.1%) |
| 2 or 3 Rooms | 0 (0.0%) | 141 (52.0%) |
| 4 or 5 Rooms | 178 (49.2%) | 33 (12.2%) |
| 6 or 7 Rooms | 123 (34.0%) | 23 (8.5%) |
| 8 or more Rooms | 61 (16.9%) | 6 (2.2%) |
| Total | 362 (100.0%) | 271 (100.0%) |
Housing Structure by Heating Type in Silver Grove
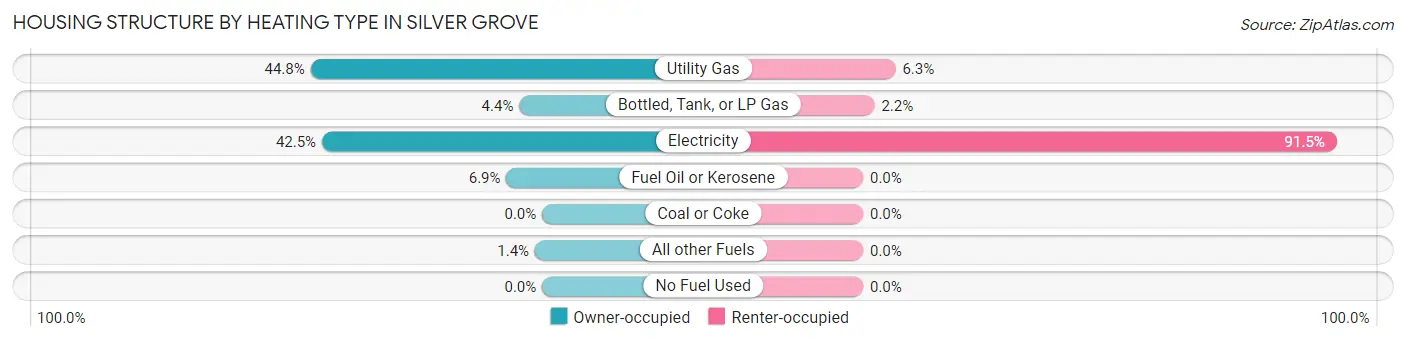
| Heating Type | Owner-occupied | Renter-occupied |
| Utility Gas | 162 (44.8%) | 17 (6.3%) |
| Bottled, Tank, or LP Gas | 16 (4.4%) | 6 (2.2%) |
| Electricity | 154 (42.5%) | 248 (91.5%) |
| Fuel Oil or Kerosene | 25 (6.9%) | 0 (0.0%) |
| Coal or Coke | 0 (0.0%) | 0 (0.0%) |
| All other Fuels | 5 (1.4%) | 0 (0.0%) |
| No Fuel Used | 0 (0.0%) | 0 (0.0%) |
| Total | 362 (100.0%) | 271 (100.0%) |
Household Vehicle Usage in Silver Grove
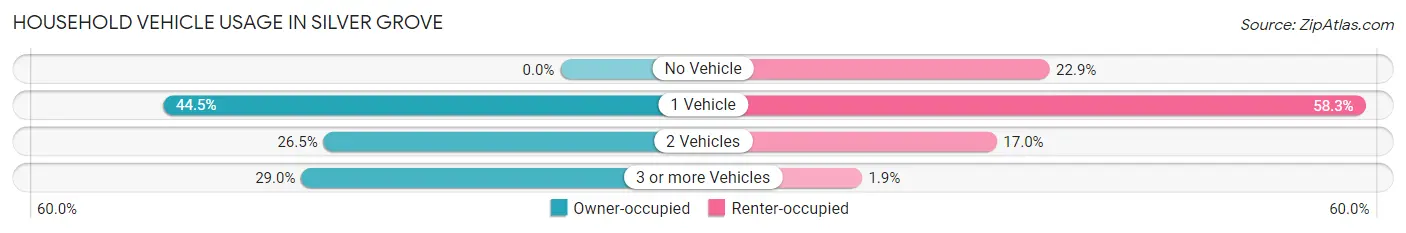
| Vehicles per Household | Owner-occupied | Renter-occupied |
| No Vehicle | 0 (0.0%) | 62 (22.9%) |
| 1 Vehicle | 161 (44.5%) | 158 (58.3%) |
| 2 Vehicles | 96 (26.5%) | 46 (17.0%) |
| 3 or more Vehicles | 105 (29.0%) | 5 (1.8%) |
| Total | 362 (100.0%) | 271 (100.0%) |
Real Estate & Mortgages in Silver Grove
Real Estate and Mortgage Overview in Silver Grove
| Characteristic | Without Mortgage | With Mortgage |
| Housing Units | 117 | 245 |
| Median Property Value | $93,000 | $99,100 |
| Median Household Income | - | - |
| Monthly Housing Costs | $548 | $0 |
| Real Estate Taxes | $1,431 | $0 |
Property Value by Mortgage Status in Silver Grove
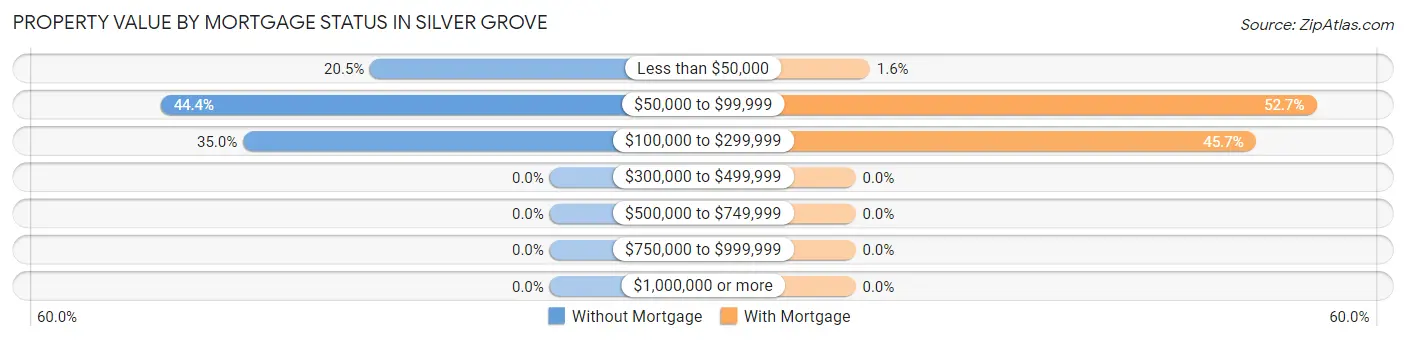
| Property Value | Without Mortgage | With Mortgage |
| Less than $50,000 | 24 (20.5%) | 4 (1.6%) |
| $50,000 to $99,999 | 52 (44.4%) | 129 (52.6%) |
| $100,000 to $299,999 | 41 (35.0%) | 112 (45.7%) |
| $300,000 to $499,999 | 0 (0.0%) | 0 (0.0%) |
| $500,000 to $749,999 | 0 (0.0%) | 0 (0.0%) |
| $750,000 to $999,999 | 0 (0.0%) | 0 (0.0%) |
| $1,000,000 or more | 0 (0.0%) | 0 (0.0%) |
| Total | 117 (100.0%) | 245 (100.0%) |
Household Income by Mortgage Status in Silver Grove
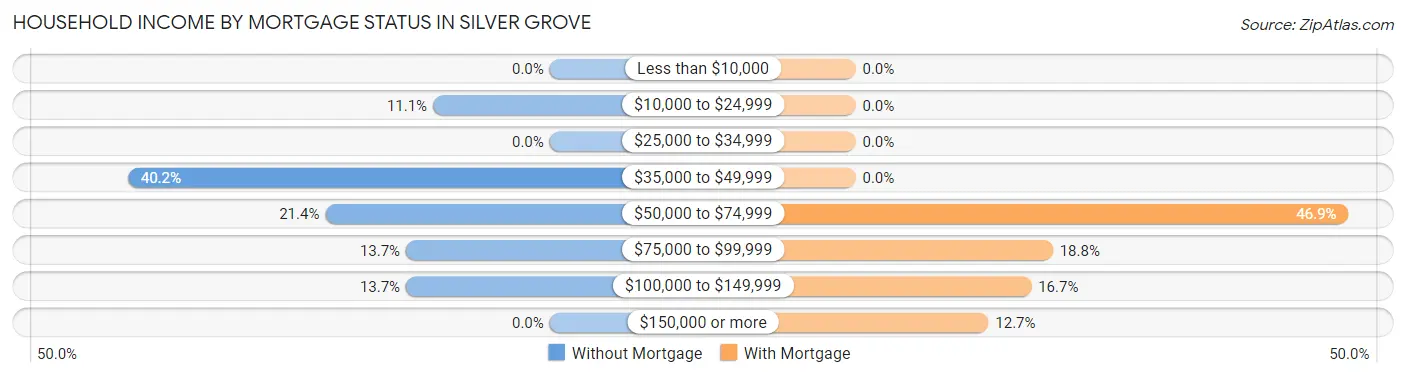
| Household Income | Without Mortgage | With Mortgage |
| Less than $10,000 | 0 (0.0%) | 0 (0.0%) |
| $10,000 to $24,999 | 13 (11.1%) | 0 (0.0%) |
| $25,000 to $34,999 | 0 (0.0%) | 0 (0.0%) |
| $35,000 to $49,999 | 47 (40.2%) | 0 (0.0%) |
| $50,000 to $74,999 | 25 (21.4%) | 115 (46.9%) |
| $75,000 to $99,999 | 16 (13.7%) | 46 (18.8%) |
| $100,000 to $149,999 | 16 (13.7%) | 41 (16.7%) |
| $150,000 or more | 0 (0.0%) | 31 (12.7%) |
| Total | 117 (100.0%) | 245 (100.0%) |
Property Value to Household Income Ratio in Silver Grove
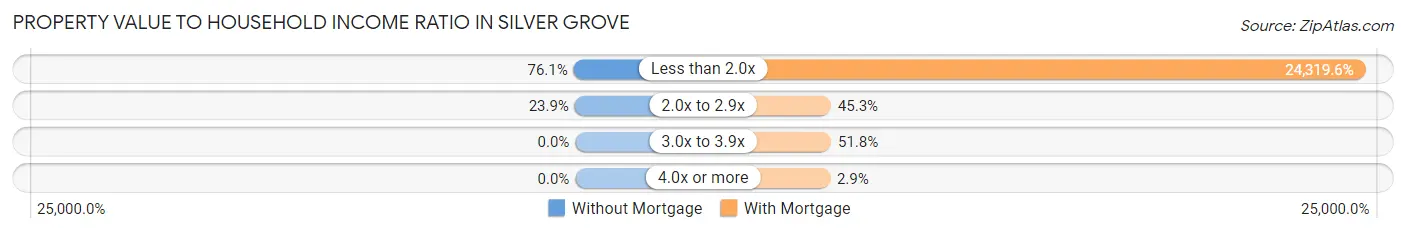
| Value-to-Income Ratio | Without Mortgage | With Mortgage |
| Less than 2.0x | 89 (76.1%) | 59,583 (24,319.6%) |
| 2.0x to 2.9x | 28 (23.9%) | 111 (45.3%) |
| 3.0x to 3.9x | 0 (0.0%) | 127 (51.8%) |
| 4.0x or more | 0 (0.0%) | 7 (2.9%) |
| Total | 117 (100.0%) | 245 (100.0%) |
Real Estate Taxes by Mortgage Status in Silver Grove
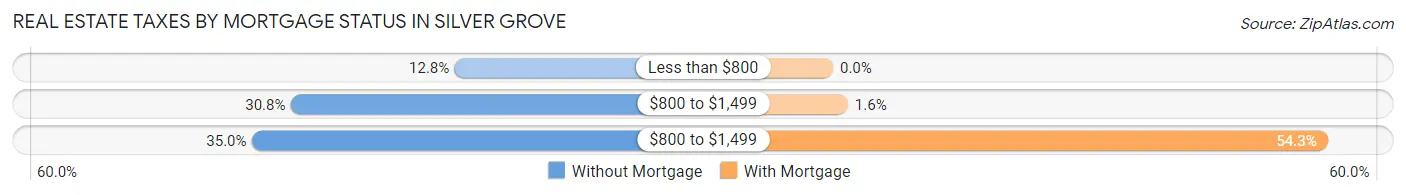
| Property Taxes | Without Mortgage | With Mortgage |
| Less than $800 | 15 (12.8%) | 0 (0.0%) |
| $800 to $1,499 | 36 (30.8%) | 4 (1.6%) |
| $800 to $1,499 | 41 (35.0%) | 133 (54.3%) |
| Total | 117 (100.0%) | 245 (100.0%) |
Health & Disability in Silver Grove
Health Insurance Coverage by Age in Silver Grove
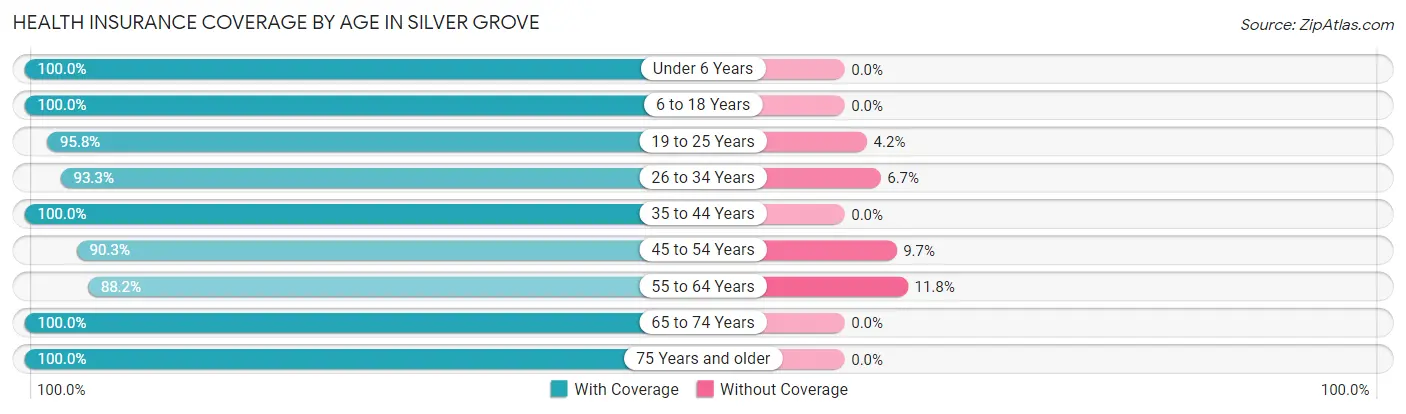
| Age Bracket | With Coverage | Without Coverage |
| Under 6 Years | 78 (100.0%) | 0 (0.0%) |
| 6 to 18 Years | 186 (100.0%) | 0 (0.0%) |
| 19 to 25 Years | 69 (95.8%) | 3 (4.2%) |
| 26 to 34 Years | 139 (93.3%) | 10 (6.7%) |
| 35 to 44 Years | 180 (100.0%) | 0 (0.0%) |
| 45 to 54 Years | 252 (90.3%) | 27 (9.7%) |
| 55 to 64 Years | 232 (88.2%) | 31 (11.8%) |
| 65 to 74 Years | 58 (100.0%) | 0 (0.0%) |
| 75 Years and older | 70 (100.0%) | 0 (0.0%) |
| Total | 1,264 (94.7%) | 71 (5.3%) |
Health Insurance Coverage by Citizenship Status in Silver Grove
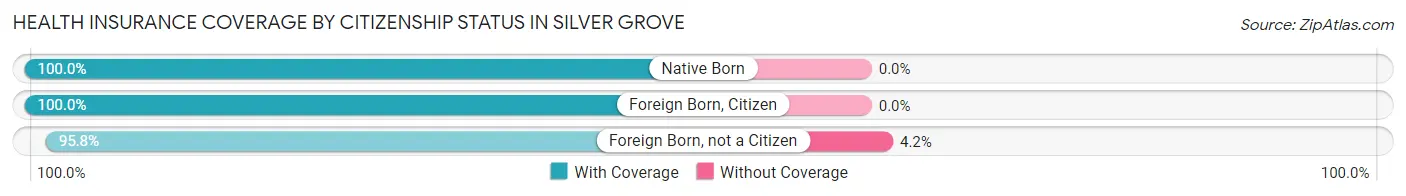
| Citizenship Status | With Coverage | Without Coverage |
| Native Born | 78 (100.0%) | 0 (0.0%) |
| Foreign Born, Citizen | 186 (100.0%) | 0 (0.0%) |
| Foreign Born, not a Citizen | 69 (95.8%) | 3 (4.2%) |
Health Insurance Coverage by Household Income in Silver Grove
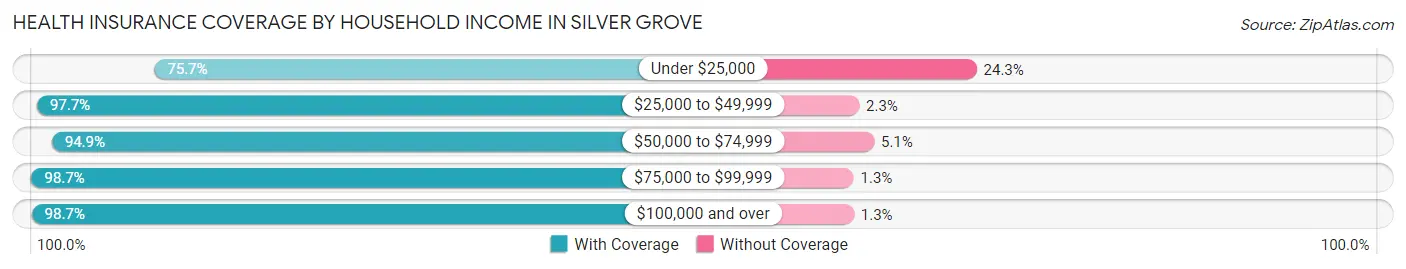
| Household Income | With Coverage | Without Coverage |
| Under $25,000 | 140 (75.7%) | 45 (24.3%) |
| $25,000 to $49,999 | 423 (97.7%) | 10 (2.3%) |
| $50,000 to $74,999 | 186 (94.9%) | 10 (5.1%) |
| $75,000 to $99,999 | 231 (98.7%) | 3 (1.3%) |
| $100,000 and over | 225 (98.7%) | 3 (1.3%) |
Public vs Private Health Insurance Coverage by Age in Silver Grove
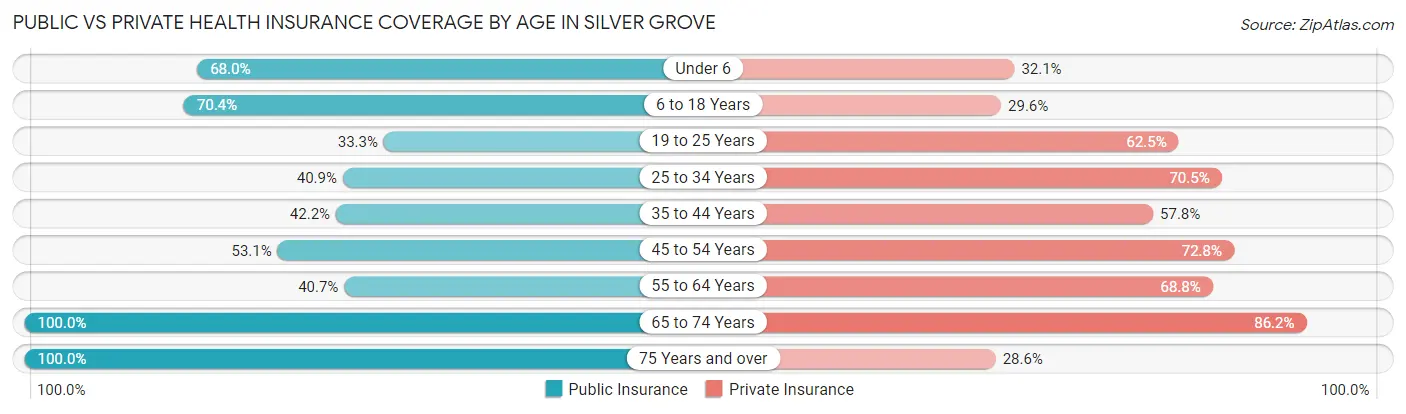
| Age Bracket | Public Insurance | Private Insurance |
| Under 6 | 53 (67.9%) | 25 (32.1%) |
| 6 to 18 Years | 131 (70.4%) | 55 (29.6%) |
| 19 to 25 Years | 24 (33.3%) | 45 (62.5%) |
| 25 to 34 Years | 61 (40.9%) | 105 (70.5%) |
| 35 to 44 Years | 76 (42.2%) | 104 (57.8%) |
| 45 to 54 Years | 148 (53.0%) | 203 (72.8%) |
| 55 to 64 Years | 107 (40.7%) | 181 (68.8%) |
| 65 to 74 Years | 58 (100.0%) | 50 (86.2%) |
| 75 Years and over | 70 (100.0%) | 20 (28.6%) |
| Total | 728 (54.5%) | 788 (59.0%) |
Disability Status by Sex by Age in Silver Grove
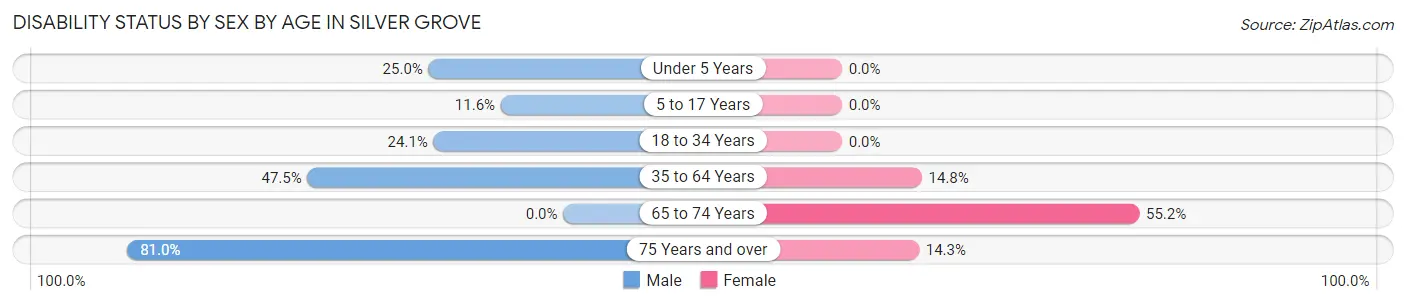
| Age Bracket | Male | Female |
| Under 5 Years | 1 (25.0%) | 0 (0.0%) |
| 5 to 17 Years | 16 (11.6%) | 0 (0.0%) |
| 18 to 34 Years | 39 (24.1%) | 0 (0.0%) |
| 35 to 64 Years | 160 (47.5%) | 57 (14.8%) |
| 65 to 74 Years | 0 (0.0%) | 32 (55.2%) |
| 75 Years and over | 17 (80.9%) | 7 (14.3%) |
Disability Class by Sex by Age in Silver Grove
Disability Class: Hearing Difficulty
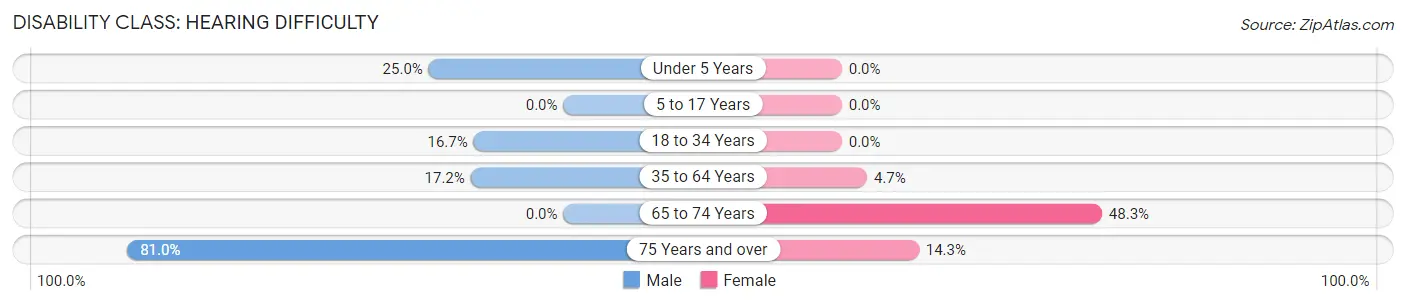
| Age Bracket | Male | Female |
| Under 5 Years | 1 (25.0%) | 0 (0.0%) |
| 5 to 17 Years | 0 (0.0%) | 0 (0.0%) |
| 18 to 34 Years | 27 (16.7%) | 0 (0.0%) |
| 35 to 64 Years | 58 (17.2%) | 18 (4.7%) |
| 65 to 74 Years | 0 (0.0%) | 28 (48.3%) |
| 75 Years and over | 17 (80.9%) | 7 (14.3%) |
Disability Class: Vision Difficulty
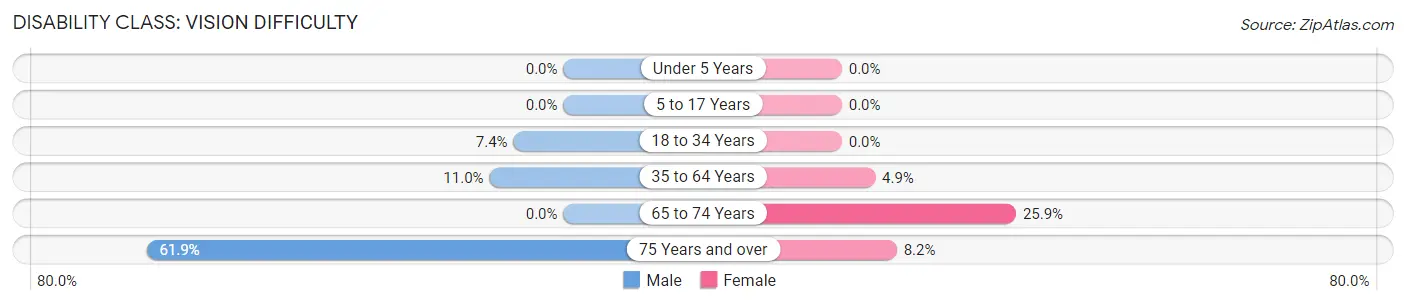
| Age Bracket | Male | Female |
| Under 5 Years | 0 (0.0%) | 0 (0.0%) |
| 5 to 17 Years | 0 (0.0%) | 0 (0.0%) |
| 18 to 34 Years | 12 (7.4%) | 0 (0.0%) |
| 35 to 64 Years | 37 (11.0%) | 19 (4.9%) |
| 65 to 74 Years | 0 (0.0%) | 15 (25.9%) |
| 75 Years and over | 13 (61.9%) | 4 (8.2%) |
Disability Class: Cognitive Difficulty
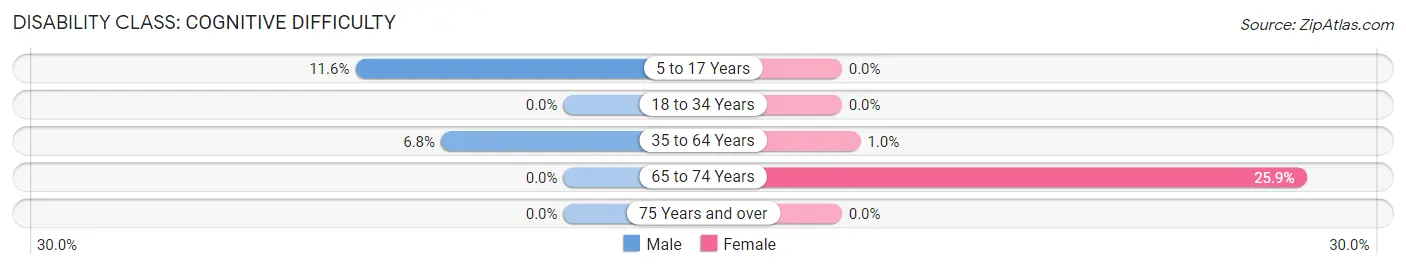
| Age Bracket | Male | Female |
| 5 to 17 Years | 16 (11.6%) | 0 (0.0%) |
| 18 to 34 Years | 0 (0.0%) | 0 (0.0%) |
| 35 to 64 Years | 23 (6.8%) | 4 (1.0%) |
| 65 to 74 Years | 0 (0.0%) | 15 (25.9%) |
| 75 Years and over | 0 (0.0%) | 0 (0.0%) |
Disability Class: Ambulatory Difficulty
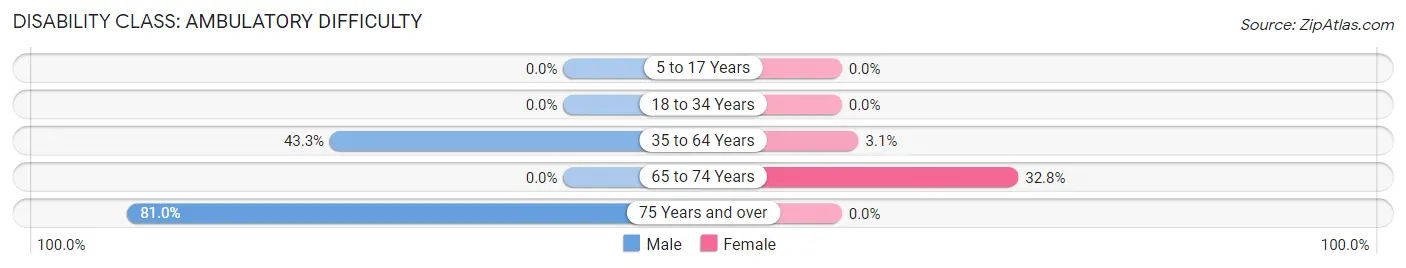
| Age Bracket | Male | Female |
| 5 to 17 Years | 0 (0.0%) | 0 (0.0%) |
| 18 to 34 Years | 0 (0.0%) | 0 (0.0%) |
| 35 to 64 Years | 146 (43.3%) | 12 (3.1%) |
| 65 to 74 Years | 0 (0.0%) | 19 (32.8%) |
| 75 Years and over | 17 (80.9%) | 0 (0.0%) |
Disability Class: Self-Care Difficulty
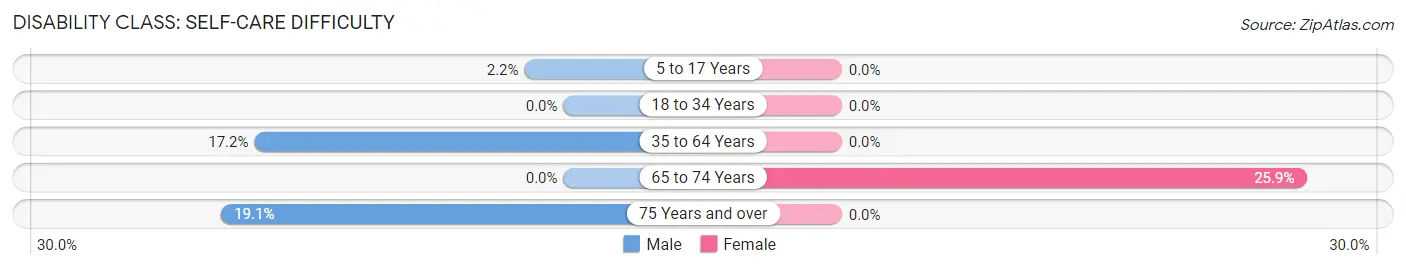
| Age Bracket | Male | Female |
| 5 to 17 Years | 3 (2.2%) | 0 (0.0%) |
| 18 to 34 Years | 0 (0.0%) | 0 (0.0%) |
| 35 to 64 Years | 58 (17.2%) | 0 (0.0%) |
| 65 to 74 Years | 0 (0.0%) | 15 (25.9%) |
| 75 Years and over | 4 (19.1%) | 0 (0.0%) |
Technology Access in Silver Grove
Computing Device Access in Silver Grove
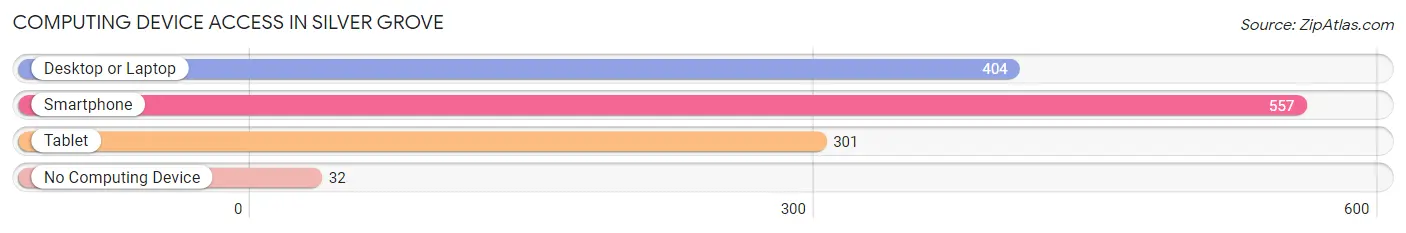
| Device Type | # Households | % Households |
| Desktop or Laptop | 404 | 63.8% |
| Smartphone | 557 | 88.0% |
| Tablet | 301 | 47.5% |
| No Computing Device | 32 | 5.1% |
| Total | 633 | 100.0% |
Internet Access in Silver Grove
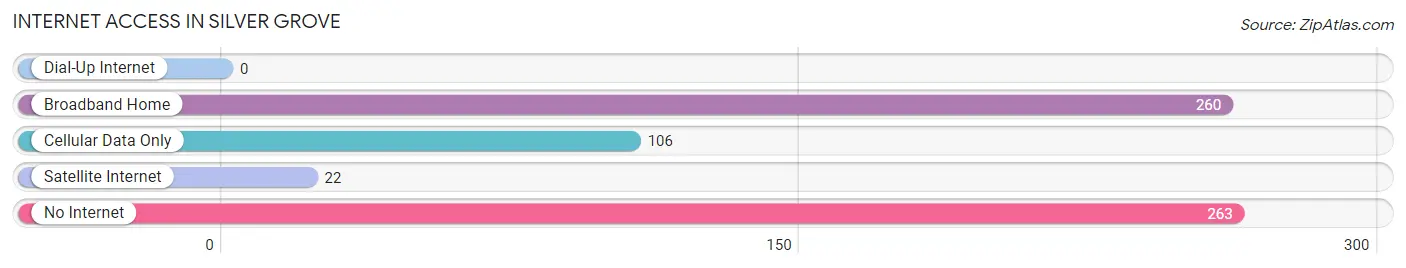
| Internet Type | # Households | % Households |
| Dial-Up Internet | 0 | 0.0% |
| Broadband Home | 260 | 41.1% |
| Cellular Data Only | 106 | 16.8% |
| Satellite Internet | 22 | 3.5% |
| No Internet | 263 | 41.5% |
| Total | 633 | 100.0% |
Silver Grove Summary
History
Silver Grove, Kentucky is a small city located in Campbell County, Kentucky. It is situated on the banks of the Ohio River, just north of Cincinnati, Ohio. The city was founded in 1817 by a group of settlers from Pennsylvania, who named it after the silver groves that grew along the banks of the river.
The city was originally a small farming community, but it soon grew into a bustling industrial center. The city was home to several factories, including a paper mill, a flour mill, and a sawmill. The city also had a large number of coal mines, which provided employment for many of the city’s residents.
In the late 19th century, Silver Grove became a popular tourist destination. The city was home to several resorts, including the Silver Grove Hotel, which was built in 1891. The hotel was a popular destination for wealthy visitors from Cincinnati and other nearby cities.
In the early 20th century, Silver Grove experienced a period of decline. The city’s factories and coal mines closed, and the city’s population began to decline. In the 1950s, the city was annexed by the city of Newport, Kentucky.
Today, Silver Grove is a small city with a population of just over 2,000 people. The city is home to several small businesses, including a few restaurants and shops. The city is also home to a small museum, which showcases the city’s history and culture.
Geography
Silver Grove is located in Campbell County, Kentucky, on the banks of the Ohio River. The city is situated just north of Cincinnati, Ohio, and is bordered by the cities of Newport and Bellevue. The city covers an area of 1.3 square miles, and has a population of just over 2,000 people.
The city is located in a hilly region, with the Ohio River forming the western border. The city is home to several parks, including Silver Grove Park, which is located on the banks of the river. The city is also home to several small lakes, including Silver Grove Lake.
Economy
Silver Grove’s economy is largely based on tourism and small businesses. The city is home to several small restaurants and shops, as well as a few larger businesses. The city is also home to a small museum, which showcases the city’s history and culture.
The city is also home to several manufacturing companies, including a paper mill and a flour mill. The city is also home to several coal mines, which provide employment for many of the city’s residents.
Demographics
As of the 2010 census, Silver Grove had a population of 2,072 people. The city has a median household income of $37,941, and a median family income of $45,941. The city’s population is largely white, with a small percentage of African Americans and Hispanics. The city also has a small percentage of Native Americans and Asians.
The city’s population is largely Christian, with a small percentage of other religions. The city is home to several churches, including the Silver Grove United Methodist Church and the Silver Grove Baptist Church.
Conclusion
Silver Grove, Kentucky is a small city located in Campbell County, Kentucky. It is situated on the banks of the Ohio River, just north of Cincinnati, Ohio. The city was founded in 1817 by a group of settlers from Pennsylvania, and has since grown into a bustling industrial center. Today, Silver Grove is a small city with a population of just over 2,000 people. The city is home to several small businesses, including a few restaurants and shops. The city is also home to a small museum, which showcases the city’s history and culture. The city’s economy is largely based on tourism and small businesses, and the city’s population is largely white, with a small percentage of African Americans and Hispanics.
Common Questions
What is Per Capita Income in Silver Grove?
Per Capita income in Silver Grove is $25,753.
What is the Median Family Income in Silver Grove?
Median Family Income in Silver Grove is $62,813.
What is the Median Household income in Silver Grove?
Median Household Income in Silver Grove is $43,975.
What is Income or Wage Gap in Silver Grove?
Income or Wage Gap in Silver Grove is 2.2%.
Women in Silver Grove earn 97.8 cents for every dollar earned by a man.
What is Inequality or Gini Index in Silver Grove?
Inequality or Gini Index in Silver Grove is 0.38.
What is the Total Population of Silver Grove?
Total Population of Silver Grove is 1,335.
What is the Total Male Population of Silver Grove?
Total Male Population of Silver Grove is 662.
What is the Total Female Population of Silver Grove?
Total Female Population of Silver Grove is 673.
What is the Ratio of Males per 100 Females in Silver Grove?
There are 98.37 Males per 100 Females in Silver Grove.
What is the Ratio of Females per 100 Males in Silver Grove?
There are 101.66 Females per 100 Males in Silver Grove.
What is the Median Population Age in Silver Grove?
Median Population Age in Silver Grove is 45.3 Years.
What is the Average Family Size in Silver Grove
Average Family Size in Silver Grove is 3.0 People.
What is the Average Household Size in Silver Grove
Average Household Size in Silver Grove is 2.0 People.
How Large is the Labor Force in Silver Grove?
There are 666 People in the Labor Forcein in Silver Grove.
What is the Percentage of People in the Labor Force in Silver Grove?
61.0% of People are in the Labor Force in Silver Grove.
What is the Unemployment Rate in Silver Grove?
Unemployment Rate in Silver Grove is 5.4%.