Beattyville, KY Map & Demographics
Beattyville Map
Beattyville Overview
$11,251
PER CAPITA INCOME
$38,750
AVG FAMILY INCOME
$23,423
AVG HOUSEHOLD INCOME
38.2%
WAGE / INCOME GAP [ % ]
61.8¢/ $1
WAGE / INCOME GAP [ $ ]
$8,720
FAMILY INCOME DEFICIT
0.50
INEQUALITY / GINI INDEX
1,956
TOTAL POPULATION
1,326
MALE POPULATION
630
FEMALE POPULATION
210.48
MALES / 100 FEMALES
47.51
FEMALES / 100 MALES
35.5
MEDIAN AGE
4.0
AVG FAMILY SIZE
2.6
AVG HOUSEHOLD SIZE
448
LABOR FORCE [ PEOPLE ]
28.3%
PERCENT IN LABOR FORCE
11.4%
UNEMPLOYMENT RATE
Beattyville Zip Codes
Beattyville Area Codes
Income in Beattyville
Income Overview in Beattyville
Per Capita Income in Beattyville is $11,251, while median incomes of families and households are $38,750 and $23,423 respectively.
| Characteristic | Number | Measure |
| Per Capita Income | 1,956 | $11,251 |
| Median Family Income | 250 | $38,750 |
| Mean Family Income | 250 | $51,236 |
| Median Household Income | 497 | $23,423 |
| Mean Household Income | 497 | $37,191 |
| Income Deficit | 250 | $8,720 |
| Wage / Income Gap (%) | 1,956 | 38.22% |
| Wage / Income Gap ($) | 1,956 | 61.78¢ per $1 |
| Gini / Inequality Index | 1,956 | 0.50 |
Earnings by Sex in Beattyville
Average Earnings in Beattyville are $22,799, $16,042 for men and $25,968 for women, a difference of 38.2%.

| Sex | Number | Average Earnings |
| Male | 401 (64.0%) | $16,042 |
| Female | 226 (36.0%) | $25,968 |
| Total | 627 (100.0%) | $22,799 |
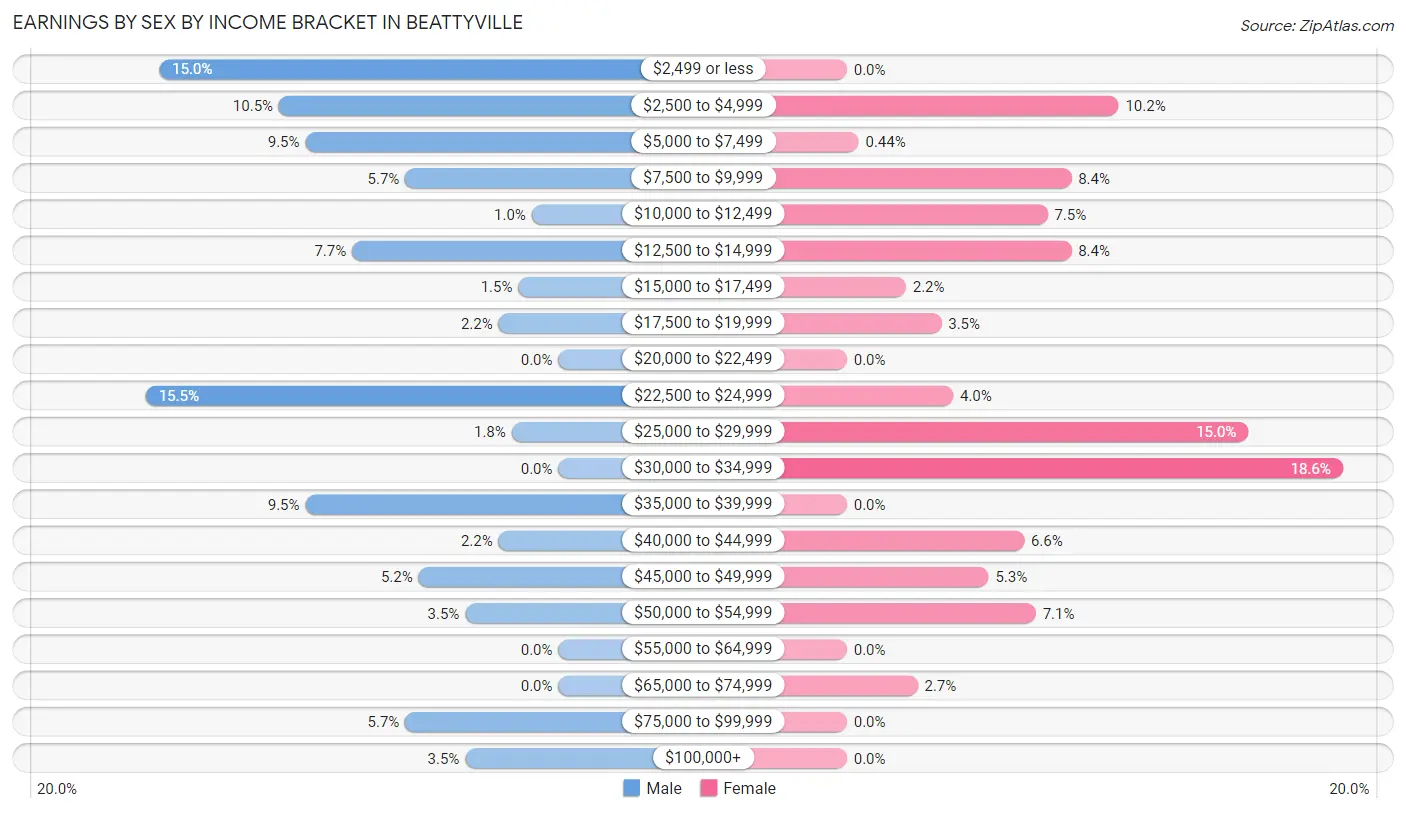
Earnings by Sex by Income Bracket in Beattyville
The most common earnings brackets in Beattyville are $22,500 to $24,999 for men (62 | 15.5%) and $30,000 to $34,999 for women (42 | 18.6%).
| Income | Male | Female |
| $2,499 or less | 60 (15.0%) | 0 (0.0%) |
| $2,500 to $4,999 | 42 (10.5%) | 23 (10.2%) |
| $5,000 to $7,499 | 38 (9.5%) | 1 (0.4%) |
| $7,500 to $9,999 | 23 (5.7%) | 19 (8.4%) |
| $10,000 to $12,499 | 4 (1.0%) | 17 (7.5%) |
| $12,500 to $14,999 | 31 (7.7%) | 19 (8.4%) |
| $15,000 to $17,499 | 6 (1.5%) | 5 (2.2%) |
| $17,500 to $19,999 | 9 (2.2%) | 8 (3.5%) |
| $20,000 to $22,499 | 0 (0.0%) | 0 (0.0%) |
| $22,500 to $24,999 | 62 (15.5%) | 9 (4.0%) |
| $25,000 to $29,999 | 7 (1.8%) | 34 (15.0%) |
| $30,000 to $34,999 | 0 (0.0%) | 42 (18.6%) |
| $35,000 to $39,999 | 38 (9.5%) | 0 (0.0%) |
| $40,000 to $44,999 | 9 (2.2%) | 15 (6.6%) |
| $45,000 to $49,999 | 21 (5.2%) | 12 (5.3%) |
| $50,000 to $54,999 | 14 (3.5%) | 16 (7.1%) |
| $55,000 to $64,999 | 0 (0.0%) | 0 (0.0%) |
| $65,000 to $74,999 | 0 (0.0%) | 6 (2.6%) |
| $75,000 to $99,999 | 23 (5.7%) | 0 (0.0%) |
| $100,000+ | 14 (3.5%) | 0 (0.0%) |
| Total | 401 (100.0%) | 226 (100.0%) |
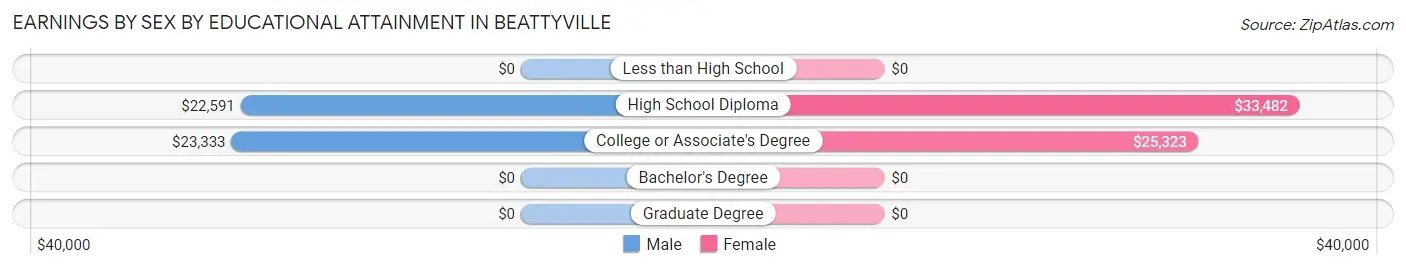
Earnings by Sex by Educational Attainment in Beattyville
Average earnings in Beattyville are $22,612 for men and $26,895 for women, a difference of 15.9%. Men with an educational attainment of college or associate's degree enjoy the highest average annual earnings of $23,333, while those with high school diploma education earn the least with $22,591. Women with an educational attainment of high school diploma earn the most with the average annual earnings of $33,482, while those with college or associate's degree education have the smallest earnings of $25,323.
| Educational Attainment | Male Income | Female Income |
| Less than High School | - | - |
| High School Diploma | $22,591 | $33,482 |
| College or Associate's Degree | $23,333 | $25,323 |
| Bachelor's Degree | - | - |
| Graduate Degree | - | - |
| Total | $22,612 | $26,895 |
Family Income in Beattyville
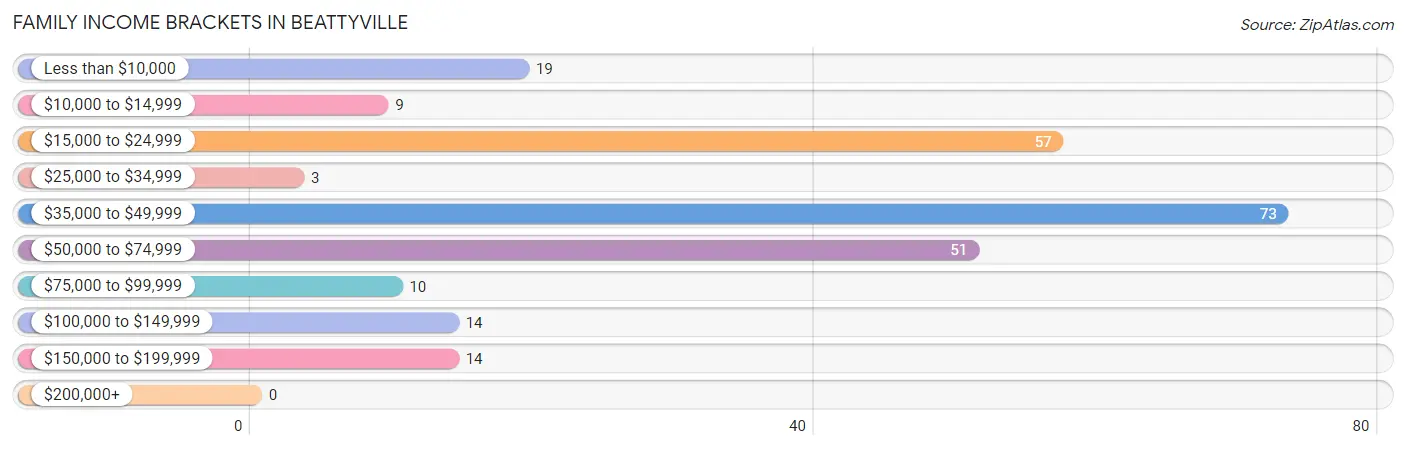
Family Income Brackets in Beattyville
According to the Beattyville family income data, there are 73 families falling into the $35,000 to $49,999 income range, which is the most common income bracket and makes up 29.2% of all families.
| Income Bracket | # Families | % Families |
| Less than $10,000 | 19 | 7.6% |
| $10,000 to $14,999 | 9 | 3.6% |
| $15,000 to $24,999 | 57 | 22.8% |
| $25,000 to $34,999 | 3 | 1.2% |
| $35,000 to $49,999 | 73 | 29.2% |
| $50,000 to $74,999 | 51 | 20.4% |
| $75,000 to $99,999 | 10 | 4.0% |
| $100,000 to $149,999 | 14 | 5.6% |
| $150,000 to $199,999 | 14 | 5.6% |
| $200,000+ | 0 | 0.0% |
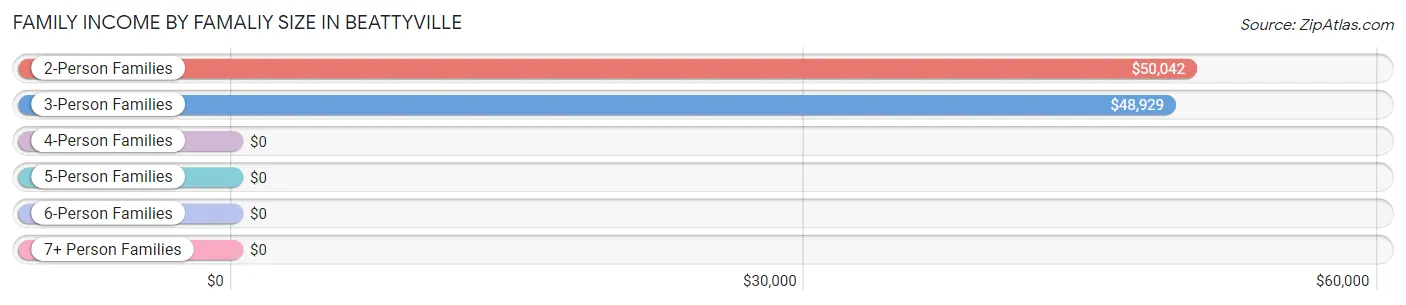
Family Income by Famaliy Size in Beattyville
2-person families (107 | 42.8%) account for the highest median family income in Beattyville with $50,042 per family, while 2-person families (107 | 42.8%) have the highest median income of $25,021 per family member.
| Income Bracket | # Families | Median Income |
| 2-Person Families | 107 (42.8%) | $50,042 |
| 3-Person Families | 36 (14.4%) | $48,929 |
| 4-Person Families | 57 (22.8%) | $0 |
| 5-Person Families | 7 (2.8%) | $0 |
| 6-Person Families | 14 (5.6%) | $0 |
| 7+ Person Families | 29 (11.6%) | $0 |
| Total | 250 (100.0%) | $38,750 |
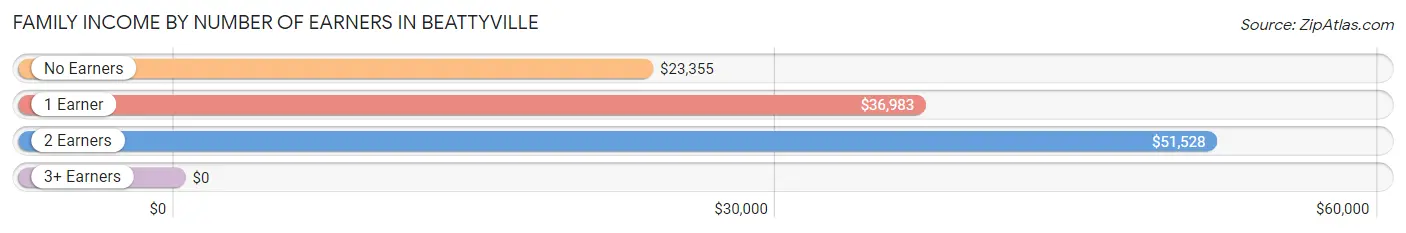
Family Income by Number of Earners in Beattyville
| Number of Earners | # Families | Median Income |
| No Earners | 37 (14.8%) | $23,355 |
| 1 Earner | 140 (56.0%) | $36,983 |
| 2 Earners | 58 (23.2%) | $51,528 |
| 3+ Earners | 15 (6.0%) | $0 |
| Total | 250 (100.0%) | $38,750 |
Household Income in Beattyville
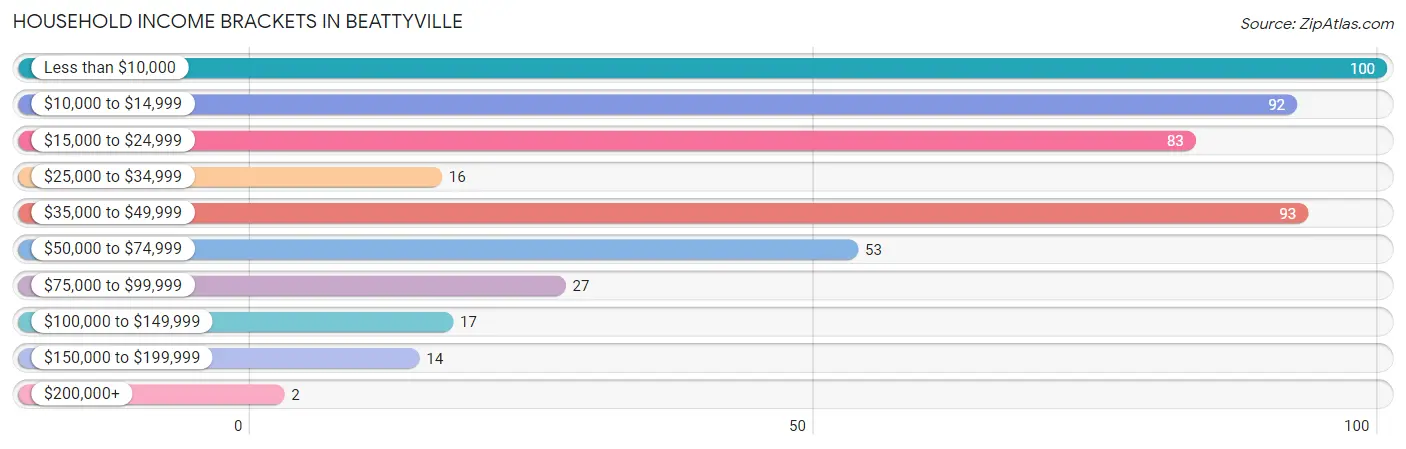
Household Income Brackets in Beattyville
With 100 households falling in the category, the less than $10,000 income range is the most frequent in Beattyville, accounting for 20.1% of all households. In contrast, only 2 households (0.4%) fall into the $200,000+ income bracket, making it the least populous group.
| Income Bracket | # Households | % Households |
| Less than $10,000 | 100 | 20.1% |
| $10,000 to $14,999 | 92 | 18.5% |
| $15,000 to $24,999 | 83 | 16.7% |
| $25,000 to $34,999 | 16 | 3.2% |
| $35,000 to $49,999 | 93 | 18.7% |
| $50,000 to $74,999 | 53 | 10.7% |
| $75,000 to $99,999 | 27 | 5.4% |
| $100,000 to $149,999 | 17 | 3.4% |
| $150,000 to $199,999 | 14 | 2.8% |
| $200,000+ | 2 | 0.4% |
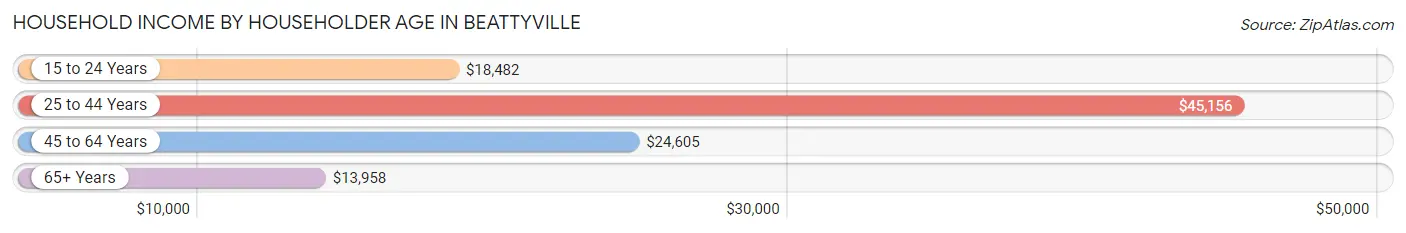
Household Income by Householder Age in Beattyville
The median household income in Beattyville is $23,423, with the highest median household income of $45,156 found in the 25 to 44 years age bracket for the primary householder. A total of 155 households (31.2%) fall into this category. Meanwhile, the 65+ years age bracket for the primary householder has the lowest median household income of $13,958, with 125 households (25.2%) in this group.
| Income Bracket | # Households | Median Income |
| 15 to 24 Years | 17 (3.4%) | $18,482 |
| 25 to 44 Years | 155 (31.2%) | $45,156 |
| 45 to 64 Years | 200 (40.2%) | $24,605 |
| 65+ Years | 125 (25.2%) | $13,958 |
| Total | 497 (100.0%) | $23,423 |
Poverty in Beattyville
Income Below Poverty by Sex and Age in Beattyville
With 49.4% poverty level for males and 48.9% for females among the residents of Beattyville, 5 year old males and under 5 year old females are the most vulnerable to poverty, with 15 males (100.0%) and 52 females (100.0%) in their respective age groups living below the poverty level.
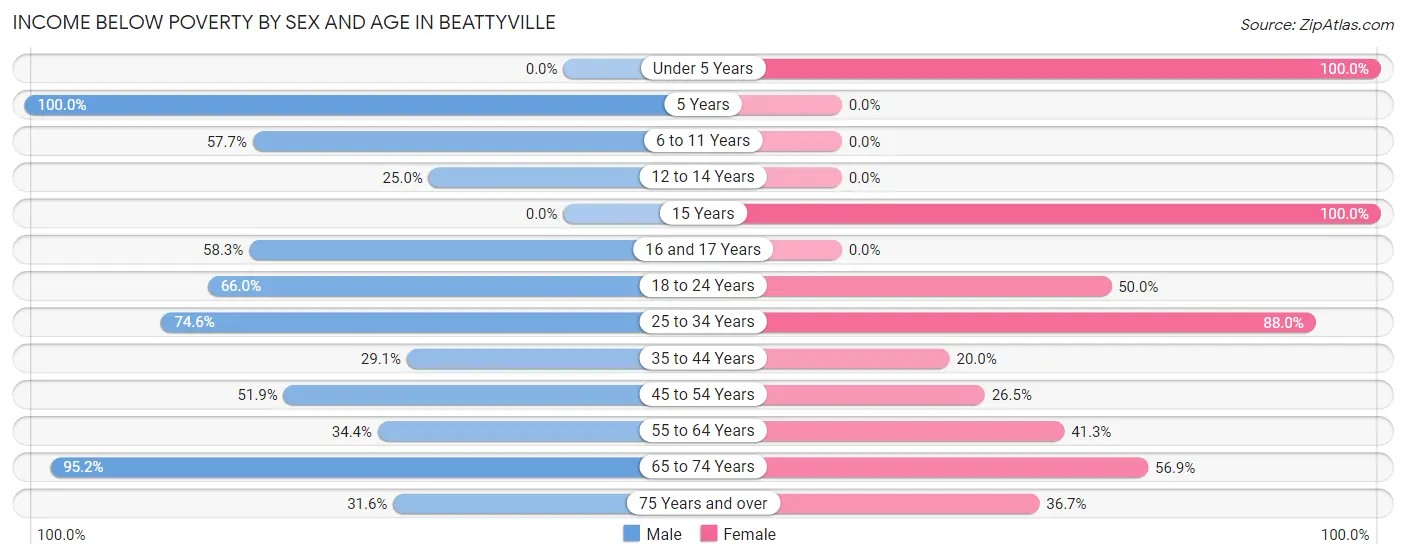
| Age Bracket | Male | Female |
| Under 5 Years | 0 (0.0%) | 52 (100.0%) |
| 5 Years | 15 (100.0%) | 0 (0.0%) |
| 6 to 11 Years | 128 (57.7%) | 0 (0.0%) |
| 12 to 14 Years | 8 (25.0%) | 0 (0.0%) |
| 15 Years | 0 (0.0%) | 8 (100.0%) |
| 16 and 17 Years | 14 (58.3%) | 0 (0.0%) |
| 18 to 24 Years | 33 (66.0%) | 17 (50.0%) |
| 25 to 34 Years | 47 (74.6%) | 73 (87.9%) |
| 35 to 44 Years | 43 (29.0%) | 20 (20.0%) |
| 45 to 54 Years | 27 (51.9%) | 13 (26.5%) |
| 55 to 64 Years | 21 (34.4%) | 45 (41.3%) |
| 65 to 74 Years | 20 (95.2%) | 29 (56.9%) |
| 75 Years and over | 6 (31.6%) | 22 (36.7%) |
| Total | 362 (49.4%) | 279 (48.9%) |
Income Above Poverty by Sex and Age in Beattyville
According to the poverty statistics in Beattyville, males aged under 5 years and females aged 6 to 11 years are the age groups that are most secure financially, with 100.0% of males and 100.0% of females in these age groups living above the poverty line.
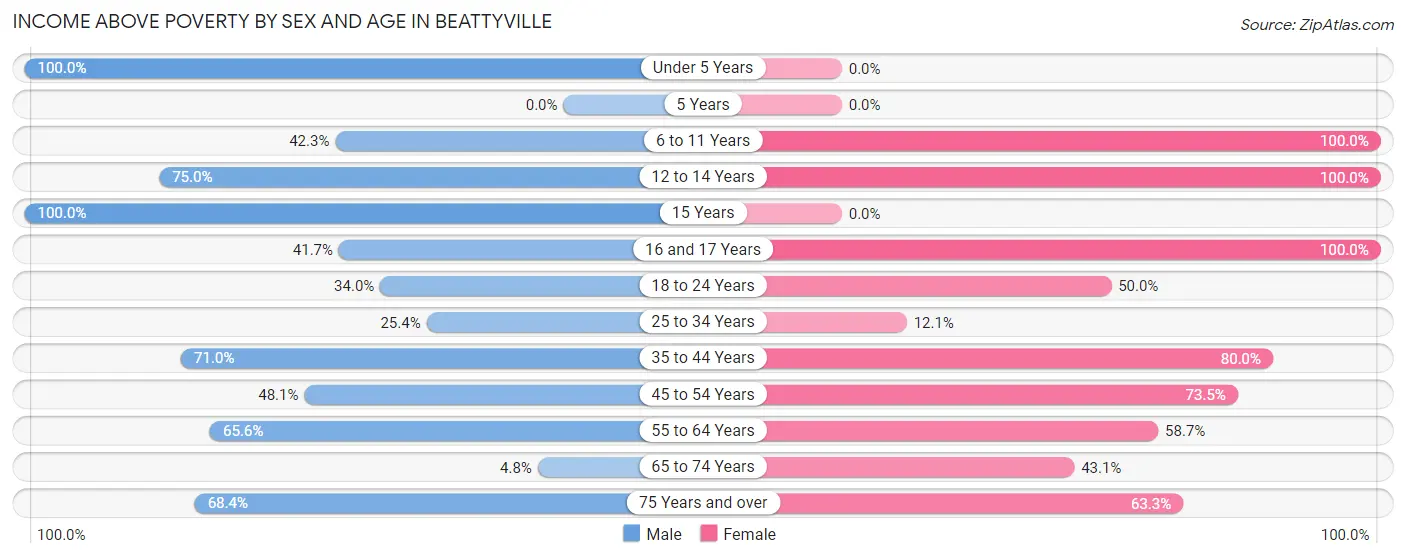
| Age Bracket | Male | Female |
| Under 5 Years | 24 (100.0%) | 0 (0.0%) |
| 5 Years | 0 (0.0%) | 0 (0.0%) |
| 6 to 11 Years | 94 (42.3%) | 7 (100.0%) |
| 12 to 14 Years | 24 (75.0%) | 11 (100.0%) |
| 15 Years | 2 (100.0%) | 0 (0.0%) |
| 16 and 17 Years | 10 (41.7%) | 6 (100.0%) |
| 18 to 24 Years | 17 (34.0%) | 17 (50.0%) |
| 25 to 34 Years | 16 (25.4%) | 10 (12.0%) |
| 35 to 44 Years | 105 (71.0%) | 80 (80.0%) |
| 45 to 54 Years | 25 (48.1%) | 36 (73.5%) |
| 55 to 64 Years | 40 (65.6%) | 64 (58.7%) |
| 65 to 74 Years | 1 (4.8%) | 22 (43.1%) |
| 75 Years and over | 13 (68.4%) | 38 (63.3%) |
| Total | 371 (50.6%) | 291 (51.0%) |
Income Below Poverty Among Married-Couple Families in Beattyville
The poverty statistics for married-couple families in Beattyville show that 39.4% or 61 of the total 155 families live below the poverty line. Families with 5 or more children have the highest poverty rate of 100.0%, comprising of 29 families. On the other hand, families with 3 or 4 children have the lowest poverty rate of 0.0%, which includes 0 families.
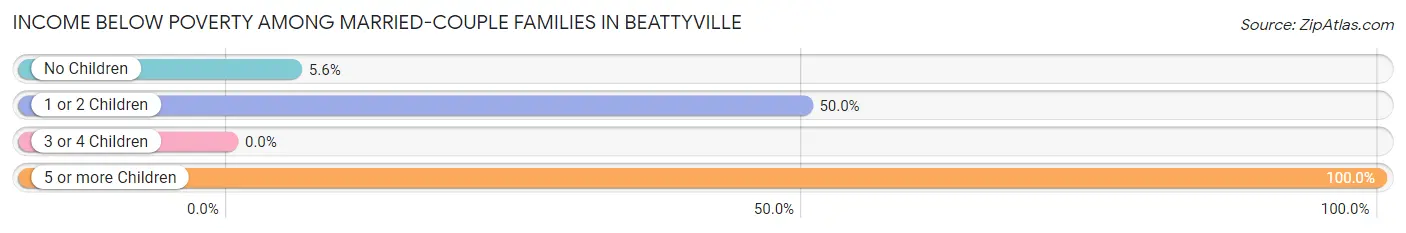
| Children | Above Poverty | Below Poverty |
| No Children | 51 (94.4%) | 3 (5.6%) |
| 1 or 2 Children | 29 (50.0%) | 29 (50.0%) |
| 3 or 4 Children | 14 (100.0%) | 0 (0.0%) |
| 5 or more Children | 0 (0.0%) | 29 (100.0%) |
| Total | 94 (60.7%) | 61 (39.4%) |
Income Below Poverty Among Single-Parent Households in Beattyville
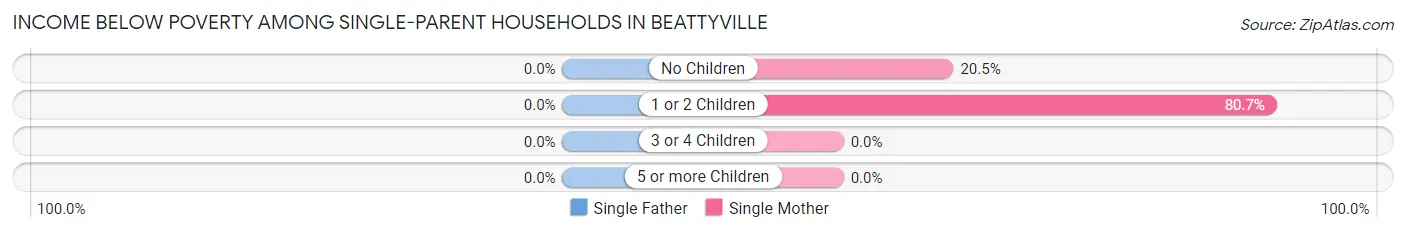
| Children | Single Father | Single Mother |
| No Children | 0 (0.0%) | 9 (20.4%) |
| 1 or 2 Children | 0 (0.0%) | 25 (80.6%) |
| 3 or 4 Children | 0 (0.0%) | 0 (0.0%) |
| 5 or more Children | 0 (0.0%) | 0 (0.0%) |
| Total | 0 (0.0%) | 34 (41.0%) |
Income Below Poverty Among Married-Couple vs Single-Parent Households in Beattyville
The poverty data for Beattyville shows that 61 of the married-couple family households (39.4%) and 34 of the single-parent households (35.8%) are living below the poverty level. Within the married-couple family households, those with 5 or more children have the highest poverty rate, with 29 households (100.0%) falling below the poverty line. Among the single-parent households, those with 1 or 2 children have the highest poverty rate, with 25 household (58.1%) living below poverty.
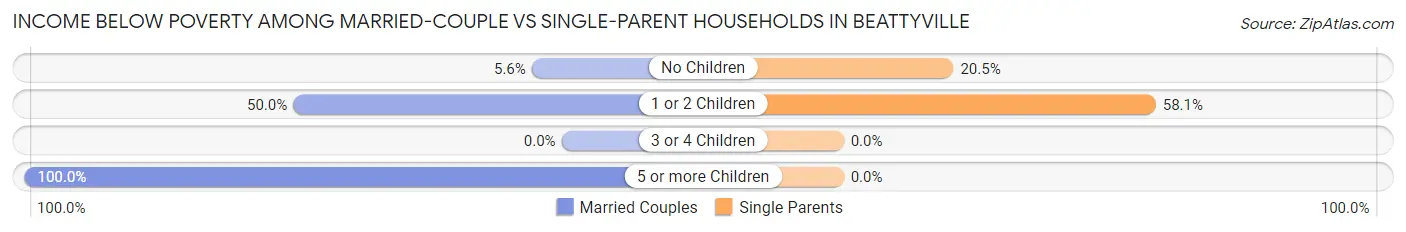
| Children | Married-Couple Families | Single-Parent Households |
| No Children | 3 (5.6%) | 9 (20.4%) |
| 1 or 2 Children | 29 (50.0%) | 25 (58.1%) |
| 3 or 4 Children | 0 (0.0%) | 0 (0.0%) |
| 5 or more Children | 29 (100.0%) | 0 (0.0%) |
| Total | 61 (39.4%) | 34 (35.8%) |
Race in Beattyville
The most populous races in Beattyville are White / Caucasian (1,717 | 87.8%), Two or more Races (149 | 7.6%), and Hispanic or Latino (109 | 5.6%).
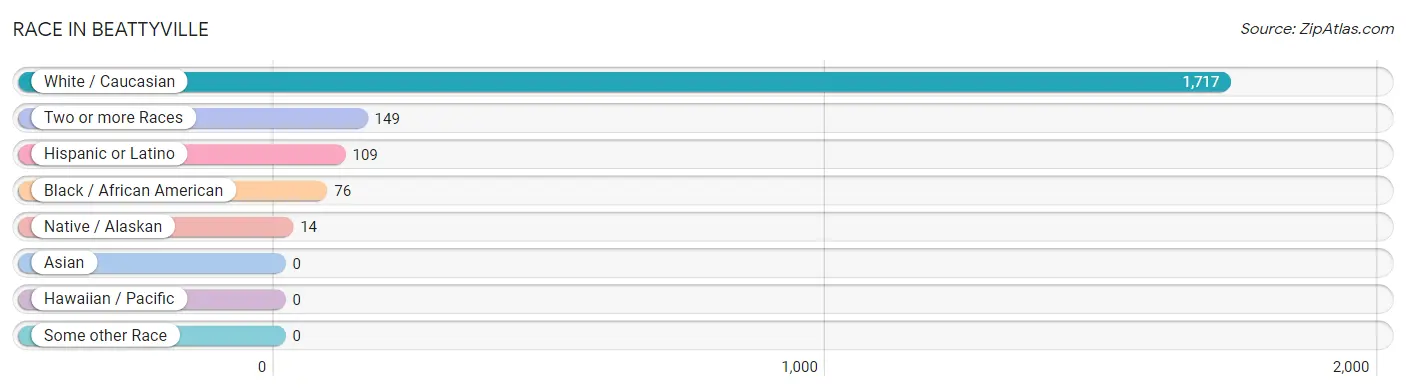
| Race | # Population | % Population |
| Asian | 0 | 0.0% |
| Black / African American | 76 | 3.9% |
| Hawaiian / Pacific | 0 | 0.0% |
| Hispanic or Latino | 109 | 5.6% |
| Native / Alaskan | 14 | 0.7% |
| White / Caucasian | 1,717 | 87.8% |
| Two or more Races | 149 | 7.6% |
| Some other Race | 0 | 0.0% |
| Total | 1,956 | 100.0% |
Ancestry in Beattyville
The most populous ancestries reported in Beattyville are American (397 | 20.3%), English (247 | 12.6%), German (211 | 10.8%), Mexican (109 | 5.6%), and Irish (91 | 4.6%), together accounting for 53.9% of all Beattyville residents.
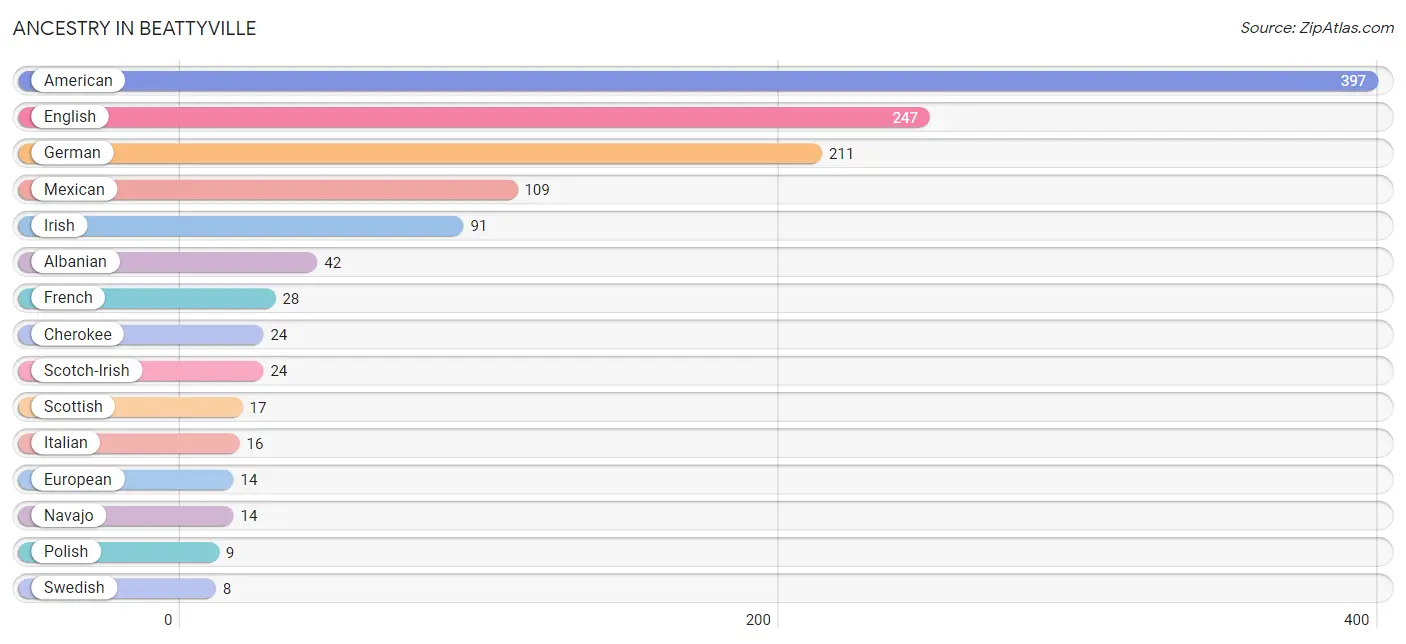
| Ancestry | # Population | % Population |
| African | 7 | 0.4% |
| Albanian | 42 | 2.1% |
| American | 397 | 20.3% |
| Cherokee | 24 | 1.2% |
| English | 247 | 12.6% |
| European | 14 | 0.7% |
| French | 28 | 1.4% |
| German | 211 | 10.8% |
| Irish | 91 | 4.6% |
| Italian | 16 | 0.8% |
| Mexican | 109 | 5.6% |
| Navajo | 14 | 0.7% |
| Polish | 9 | 0.5% |
| Russian | 2 | 0.1% |
| Scotch-Irish | 24 | 1.2% |
| Scottish | 17 | 0.9% |
| Subsaharan African | 7 | 0.4% |
| Swedish | 8 | 0.4% |
| Welsh | 3 | 0.2% | View All 19 Rows |
Immigrants in Beattyville
The most numerous immigrant groups reported in Beattyville came from Europe (18 | 0.9%), and Northern Europe (18 | 0.9%), together accounting for 1.8% of all Beattyville residents.
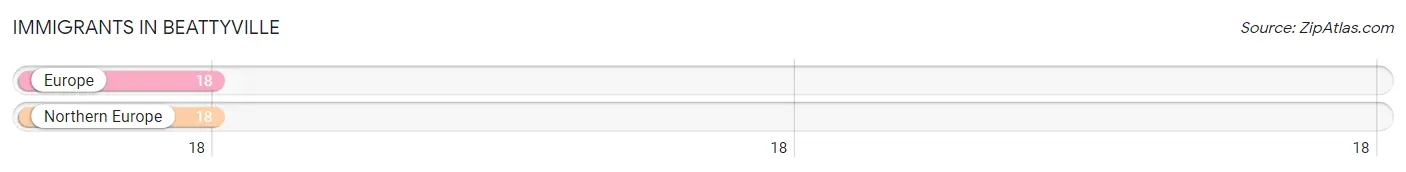
| Immigration Origin | # Population | % Population |
| Europe | 18 | 0.9% |
| Northern Europe | 18 | 0.9% | View All 2 Rows |
Sex and Age in Beattyville
Sex and Age in Beattyville
The most populous age groups in Beattyville are 35 to 39 Years (188 | 14.2%) for men and 55 to 59 Years (79 | 12.5%) for women.
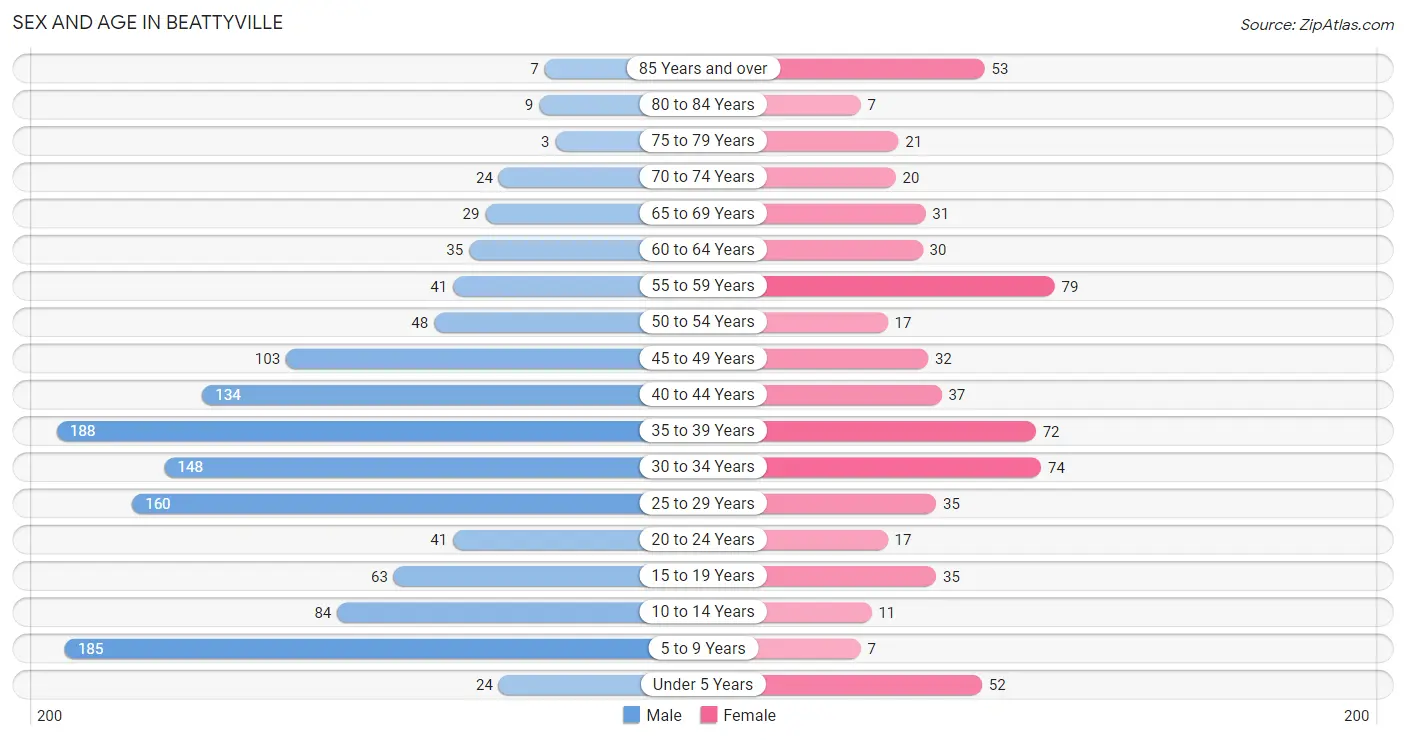
| Age Bracket | Male | Female |
| Under 5 Years | 24 (1.8%) | 52 (8.3%) |
| 5 to 9 Years | 185 (14.0%) | 7 (1.1%) |
| 10 to 14 Years | 84 (6.3%) | 11 (1.8%) |
| 15 to 19 Years | 63 (4.8%) | 35 (5.6%) |
| 20 to 24 Years | 41 (3.1%) | 17 (2.7%) |
| 25 to 29 Years | 160 (12.1%) | 35 (5.6%) |
| 30 to 34 Years | 148 (11.2%) | 74 (11.7%) |
| 35 to 39 Years | 188 (14.2%) | 72 (11.4%) |
| 40 to 44 Years | 134 (10.1%) | 37 (5.9%) |
| 45 to 49 Years | 103 (7.8%) | 32 (5.1%) |
| 50 to 54 Years | 48 (3.6%) | 17 (2.7%) |
| 55 to 59 Years | 41 (3.1%) | 79 (12.5%) |
| 60 to 64 Years | 35 (2.6%) | 30 (4.8%) |
| 65 to 69 Years | 29 (2.2%) | 31 (4.9%) |
| 70 to 74 Years | 24 (1.8%) | 20 (3.2%) |
| 75 to 79 Years | 3 (0.2%) | 21 (3.3%) |
| 80 to 84 Years | 9 (0.7%) | 7 (1.1%) |
| 85 Years and over | 7 (0.5%) | 53 (8.4%) |
| Total | 1,326 (100.0%) | 630 (100.0%) |
Families and Households in Beattyville
Median Family Size in Beattyville
The median family size in Beattyville is 4.04 persons per family, with married-couple families (155 | 62.0%) accounting for the largest median family size of 4.7 persons per family. On the other hand, single male/father families (12 | 4.8%) represent the smallest median family size with 1.42 persons per family.
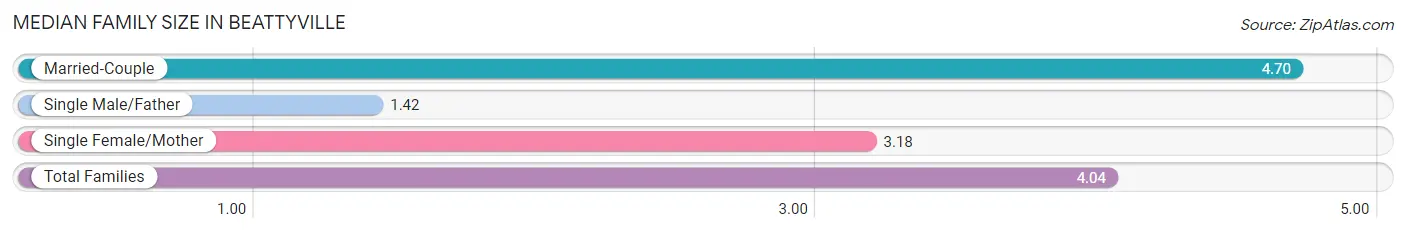
| Family Type | # Families | Family Size |
| Married-Couple | 155 (62.0%) | 4.70 |
| Single Male/Father | 12 (4.8%) | 1.42 |
| Single Female/Mother | 83 (33.2%) | 3.18 |
| Total Families | 250 (100.0%) | 4.04 |
Median Household Size in Beattyville
The median household size in Beattyville is 2.62 persons per household, with married-couple households (155 | 31.2%) accounting for the largest median household size of 4.7 persons per household. non-family households (247 | 49.7%) represent the smallest median household size with 1.17 persons per household.
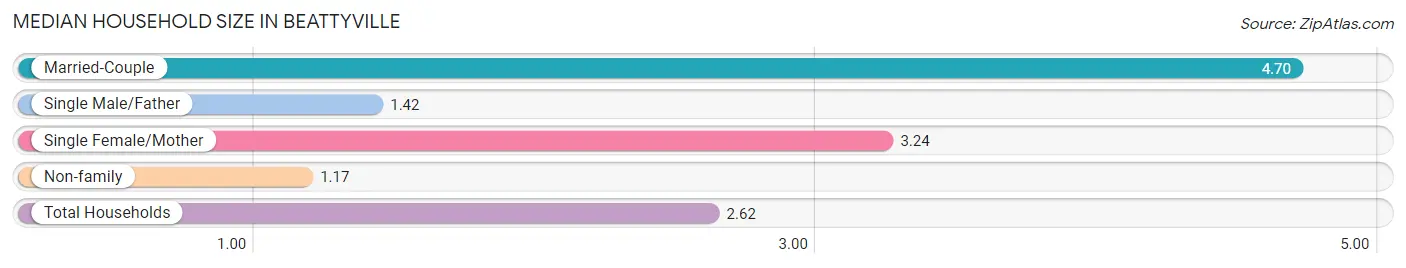
| Household Type | # Households | Household Size |
| Married-Couple | 155 (31.2%) | 4.70 |
| Single Male/Father | 12 (2.4%) | 1.42 |
| Single Female/Mother | 83 (16.7%) | 3.24 |
| Non-family | 247 (49.7%) | 1.17 |
| Total Households | 497 (100.0%) | 2.62 |
Household Size by Marriage Status in Beattyville
Out of a total of 497 households in Beattyville, 250 (50.3%) are family households, while 247 (49.7%) are nonfamily households. The most numerous type of family households are 2-person households, comprising 102, and the most common type of nonfamily households are 1-person households, comprising 208.
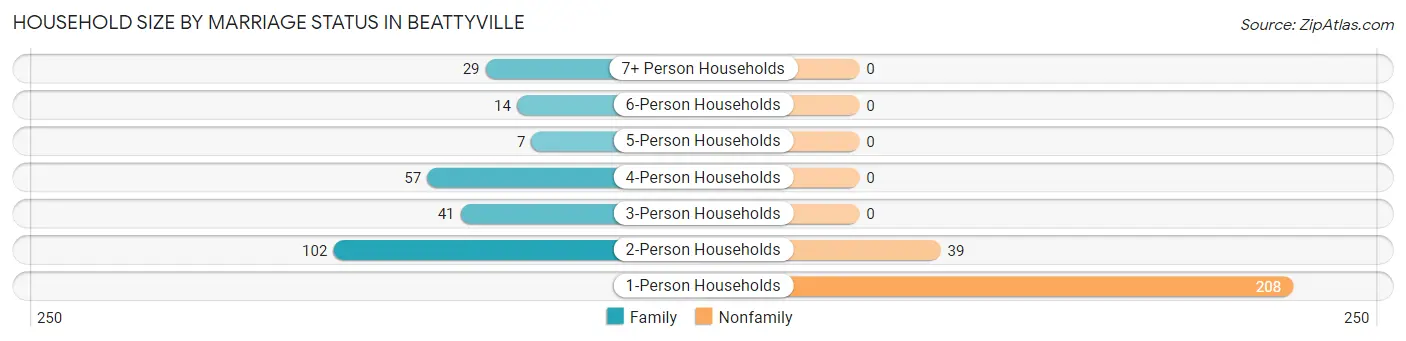
| Household Size | Family Households | Nonfamily Households |
| 1-Person Households | - | 208 (41.8%) |
| 2-Person Households | 102 (20.5%) | 39 (7.9%) |
| 3-Person Households | 41 (8.3%) | 0 (0.0%) |
| 4-Person Households | 57 (11.5%) | 0 (0.0%) |
| 5-Person Households | 7 (1.4%) | 0 (0.0%) |
| 6-Person Households | 14 (2.8%) | 0 (0.0%) |
| 7+ Person Households | 29 (5.8%) | 0 (0.0%) |
| Total | 250 (50.3%) | 247 (49.7%) |
Female Fertility in Beattyville
Fertility by Age in Beattyville
| Age Bracket | Women with Births | Births / 1,000 Women |
| 15 to 19 years | 0 (0.0%) | 0.0 |
| 20 to 34 years | 0 (0.0%) | 0.0 |
| 35 to 50 years | 0 (0.0%) | 0.0 |
| Total | 0 (0.0%) | 0.0 |
Fertility by Age by Marriage Status in Beattyville
| Age Bracket | Married | Unmarried |
| 15 to 19 years | 0 (0.0%) | 0 (0.0%) |
| 20 to 34 years | 0 (0.0%) | 0 (0.0%) |
| 35 to 50 years | 0 (0.0%) | 0 (0.0%) |
| Total | 0 (0.0%) | 0 (0.0%) |
Fertility by Education in Beattyville
| Educational Attainment | Women with Births | Births / 1,000 Women |
| Less than High School | 0 (0.0%) | 0.0 |
| High School Diploma | 0 (0.0%) | 0.0 |
| College or Associate's Degree | 0 (0.0%) | 0.0 |
| Bachelor's Degree | 0 (0.0%) | 0.0 |
| Graduate Degree | 0 (0.0%) | 0.0 |
| Total | 0 (0.0%) | 0.0 |
Fertility by Education by Marriage Status in Beattyville
| Educational Attainment | Married | Unmarried |
| Less than High School | 0 (0.0%) | 0 (0.0%) |
| High School Diploma | 0 (0.0%) | 0 (0.0%) |
| College or Associate's Degree | 0 (0.0%) | 0 (0.0%) |
| Bachelor's Degree | 0 (0.0%) | 0 (0.0%) |
| Graduate Degree | 0 (0.0%) | 0 (0.0%) |
| Total | 0 (0.0%) | 0 (0.0%) |
Employment Characteristics in Beattyville
Employment by Class of Employer in Beattyville
Among the 398 employed individuals in Beattyville, private company employees (292 | 73.4%), local government employees (73 | 18.3%), and state government employees (17 | 4.3%) make up the most common classes of employment.
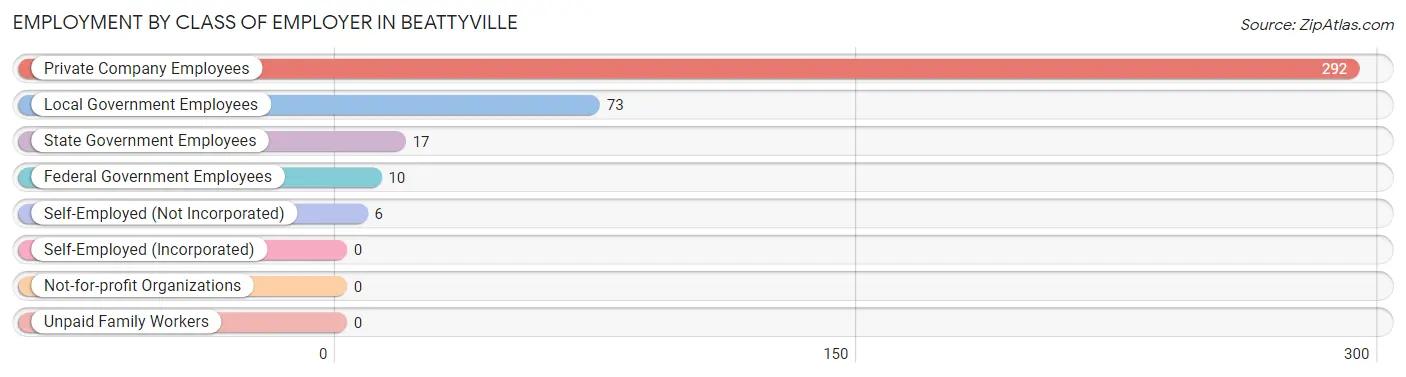
| Employer Class | # Employees | % Employees |
| Private Company Employees | 292 | 73.4% |
| Self-Employed (Incorporated) | 0 | 0.0% |
| Self-Employed (Not Incorporated) | 6 | 1.5% |
| Not-for-profit Organizations | 0 | 0.0% |
| Local Government Employees | 73 | 18.3% |
| State Government Employees | 17 | 4.3% |
| Federal Government Employees | 10 | 2.5% |
| Unpaid Family Workers | 0 | 0.0% |
| Total | 398 | 100.0% |
Employment Status by Age in Beattyville
According to the labor force statistics for Beattyville, out of the total population over 16 years of age (1,582), 28.3% or 448 individuals are in the labor force, with 11.4% or 51 of them unemployed. The age group with the highest labor force participation rate is 55 to 59 years, with 55.8% or 67 individuals in the labor force. Within the labor force, the 25 to 29 years age range has the highest percentage of unemployed individuals, with 29.6% or 8 of them being unemployed.
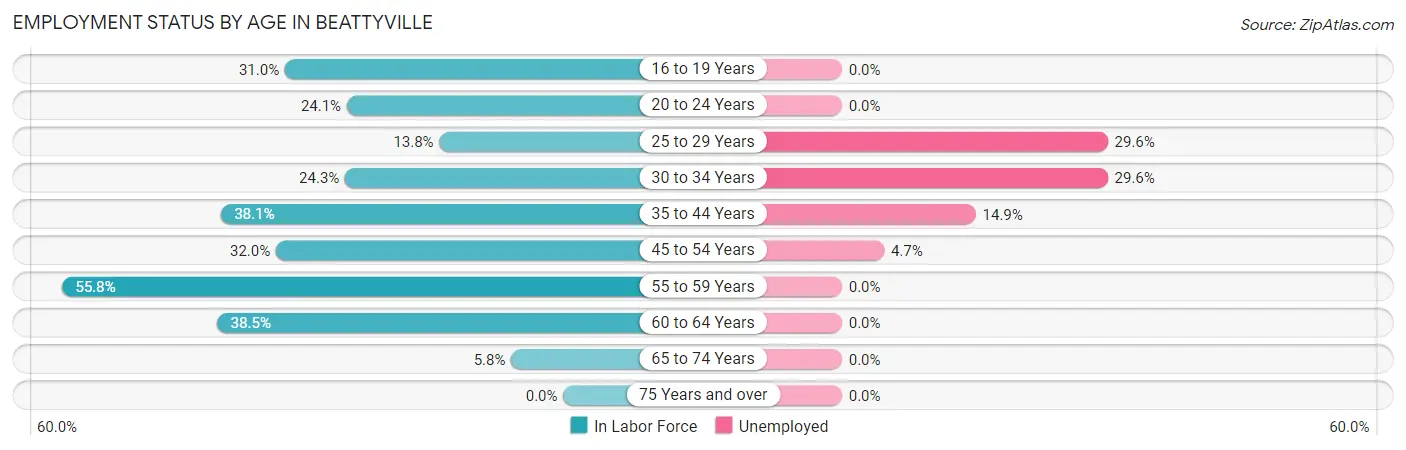
| Age Bracket | In Labor Force | Unemployed |
| 16 to 19 Years | 27 (31.0%) | 0 (0.0%) |
| 20 to 24 Years | 14 (24.1%) | 0 (0.0%) |
| 25 to 29 Years | 27 (13.8%) | 8 (29.6%) |
| 30 to 34 Years | 54 (24.3%) | 16 (29.6%) |
| 35 to 44 Years | 164 (38.1%) | 24 (14.9%) |
| 45 to 54 Years | 64 (32.0%) | 3 (4.7%) |
| 55 to 59 Years | 67 (55.8%) | 0 (0.0%) |
| 60 to 64 Years | 25 (38.5%) | 0 (0.0%) |
| 65 to 74 Years | 6 (5.8%) | 0 (0.0%) |
| 75 Years and over | 0 (0.0%) | 0 (0.0%) |
| Total | 448 (28.3%) | 51 (11.4%) |
Employment Status by Educational Attainment in Beattyville
According to labor force statistics for Beattyville, 32.5% of individuals (401) out of the total population between 25 and 64 years of age (1,233) are in the labor force, with 12.8% or 51 of them being unemployed. The group with the highest labor force participation rate are those with the educational attainment of bachelor's degree or higher, with 100.0% or 58 individuals in the labor force. Within the labor force, individuals with college / associate degree education have the highest percentage of unemployment, with 32.2% or 50 of them being unemployed.
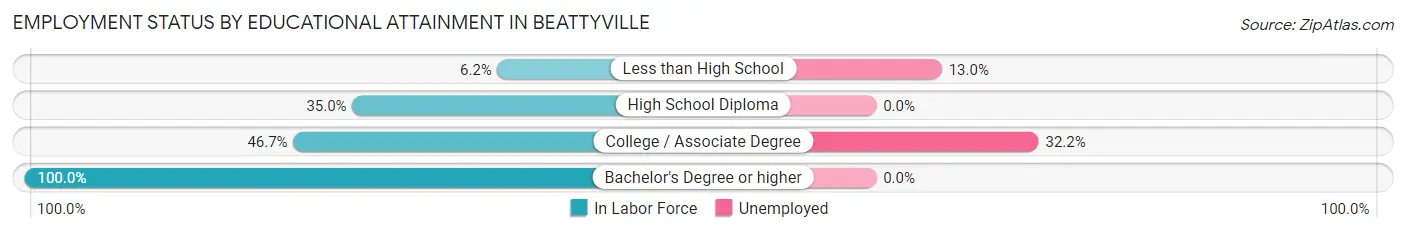
| Educational Attainment | In Labor Force | Unemployed |
| Less than High School | 23 (6.2%) | 48 (13.0%) |
| High School Diploma | 164 (35.0%) | 0 (0.0%) |
| College / Associate Degree | 156 (46.7%) | 108 (32.2%) |
| Bachelor's Degree or higher | 58 (100.0%) | 0 (0.0%) |
| Total | 401 (32.5%) | 158 (12.8%) |
Employment Occupations by Sex in Beattyville
Management, Business, Science and Arts Occupations
The most common Management, Business, Science and Arts occupations in Beattyville are Health Diagnosing & Treating (21 | 5.4%), Computers, Engineering & Science (14 | 3.6%), Architecture & Engineering (14 | 3.6%), Management (12 | 3.1%), and Business & Financial (12 | 3.1%).
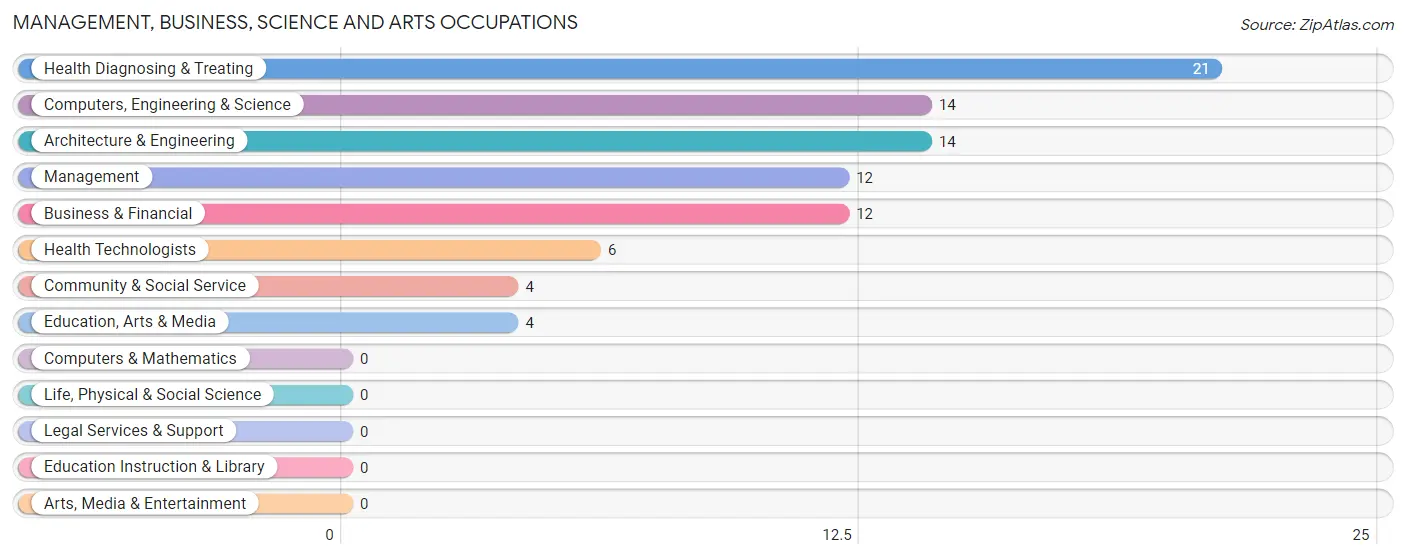
Management, Business, Science and Arts Occupations by Sex
Within the Management, Business, Science and Arts occupations in Beattyville, the most male-oriented occupations are Business & Financial (100.0%), Computers, Engineering & Science (100.0%), and Architecture & Engineering (100.0%), while the most female-oriented occupations are Management (100.0%), Community & Social Service (100.0%), and Education, Arts & Media (100.0%).
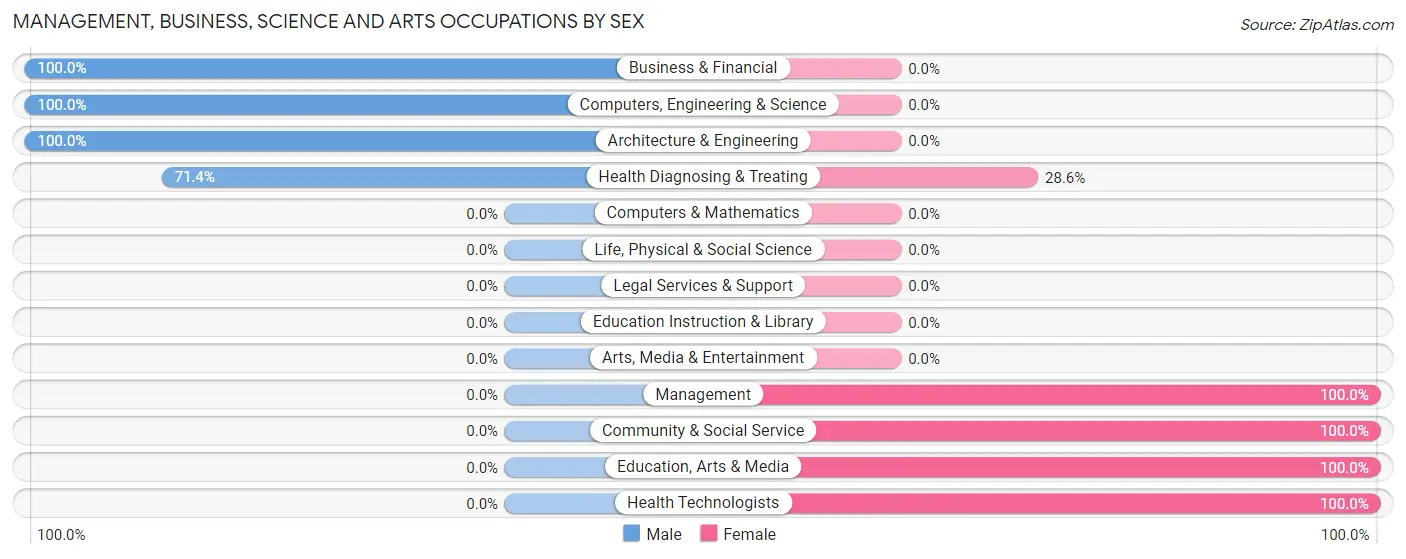
| Occupation | Male | Female |
| Management | 0 (0.0%) | 12 (100.0%) |
| Business & Financial | 12 (100.0%) | 0 (0.0%) |
| Computers, Engineering & Science | 14 (100.0%) | 0 (0.0%) |
| Computers & Mathematics | 0 (0.0%) | 0 (0.0%) |
| Architecture & Engineering | 14 (100.0%) | 0 (0.0%) |
| Life, Physical & Social Science | 0 (0.0%) | 0 (0.0%) |
| Community & Social Service | 0 (0.0%) | 4 (100.0%) |
| Education, Arts & Media | 0 (0.0%) | 4 (100.0%) |
| Legal Services & Support | 0 (0.0%) | 0 (0.0%) |
| Education Instruction & Library | 0 (0.0%) | 0 (0.0%) |
| Arts, Media & Entertainment | 0 (0.0%) | 0 (0.0%) |
| Health Diagnosing & Treating | 15 (71.4%) | 6 (28.6%) |
| Health Technologists | 0 (0.0%) | 6 (100.0%) |
| Total (Category) | 41 (65.1%) | 22 (34.9%) |
| Total (Overall) | 201 (51.8%) | 187 (48.2%) |
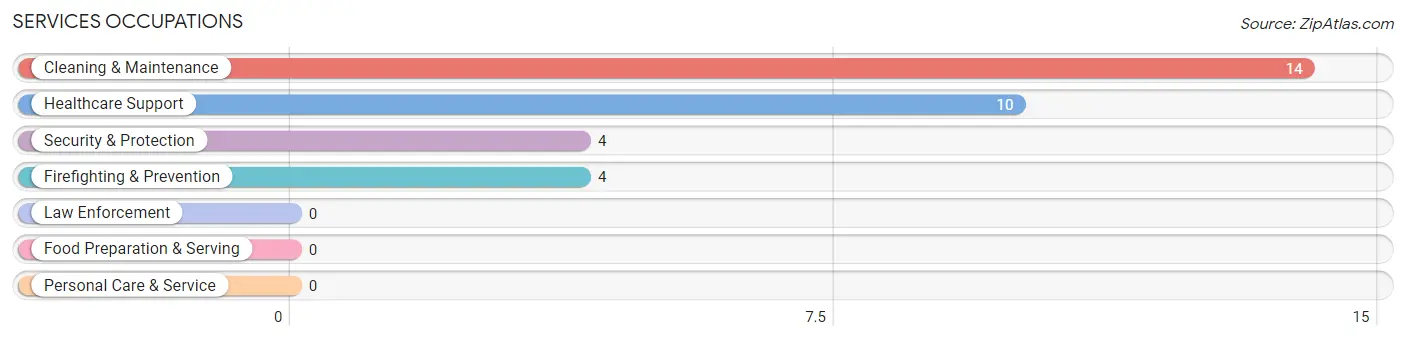
Services Occupations
The most common Services occupations in Beattyville are Cleaning & Maintenance (14 | 3.6%), Healthcare Support (10 | 2.6%), Security & Protection (4 | 1.0%), and Firefighting & Prevention (4 | 1.0%).
Services Occupations by Sex
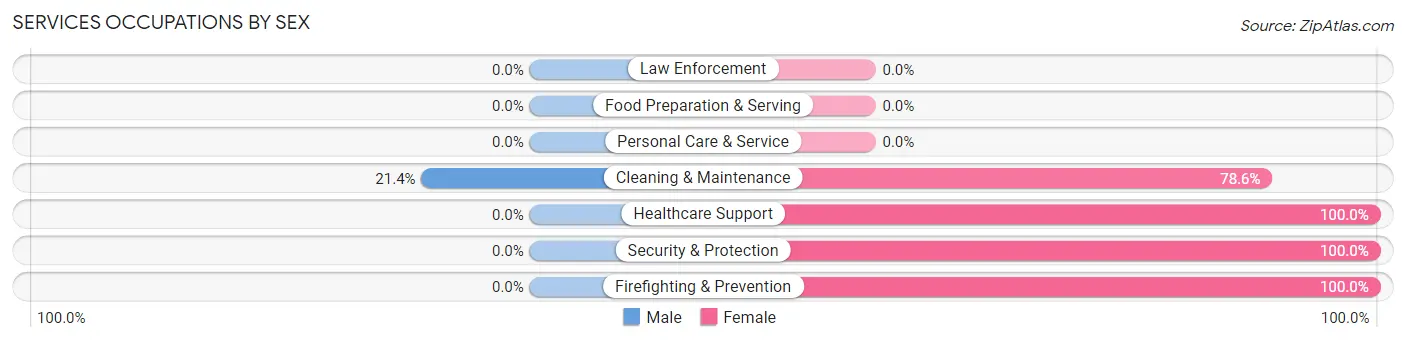
| Occupation | Male | Female |
| Healthcare Support | 0 (0.0%) | 10 (100.0%) |
| Security & Protection | 0 (0.0%) | 4 (100.0%) |
| Firefighting & Prevention | 0 (0.0%) | 4 (100.0%) |
| Law Enforcement | 0 (0.0%) | 0 (0.0%) |
| Food Preparation & Serving | 0 (0.0%) | 0 (0.0%) |
| Cleaning & Maintenance | 3 (21.4%) | 11 (78.6%) |
| Personal Care & Service | 0 (0.0%) | 0 (0.0%) |
| Total (Category) | 3 (10.7%) | 25 (89.3%) |
| Total (Overall) | 201 (51.8%) | 187 (48.2%) |
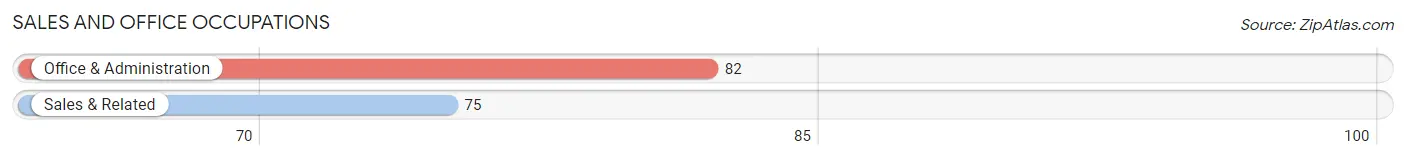
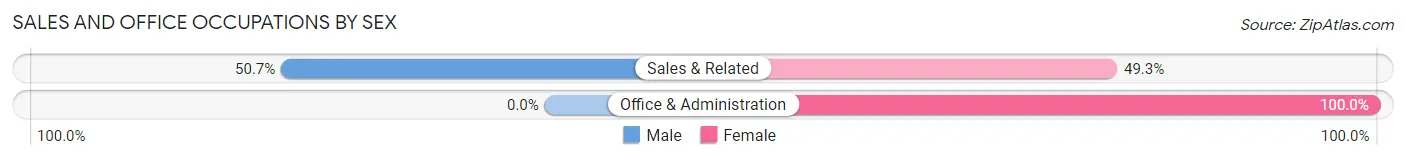
Sales and Office Occupations
The most common Sales and Office occupations in Beattyville are Office & Administration (82 | 21.1%), and Sales & Related (75 | 19.3%).
Sales and Office Occupations by Sex
| Occupation | Male | Female |
| Sales & Related | 38 (50.7%) | 37 (49.3%) |
| Office & Administration | 0 (0.0%) | 82 (100.0%) |
| Total (Category) | 38 (24.2%) | 119 (75.8%) |
| Total (Overall) | 201 (51.8%) | 187 (48.2%) |
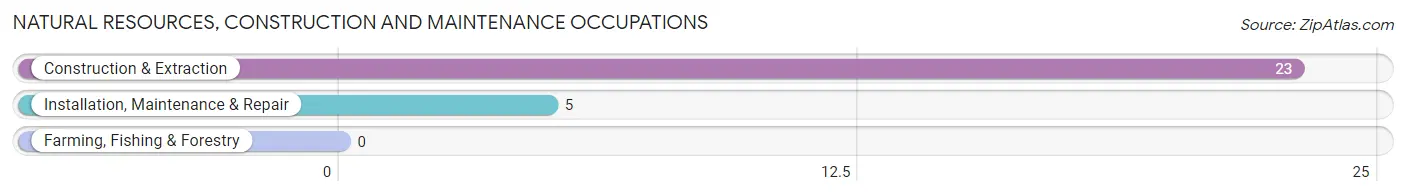
Natural Resources, Construction and Maintenance Occupations
The most common Natural Resources, Construction and Maintenance occupations in Beattyville are Construction & Extraction (23 | 5.9%), and Installation, Maintenance & Repair (5 | 1.3%).
Natural Resources, Construction and Maintenance Occupations by Sex
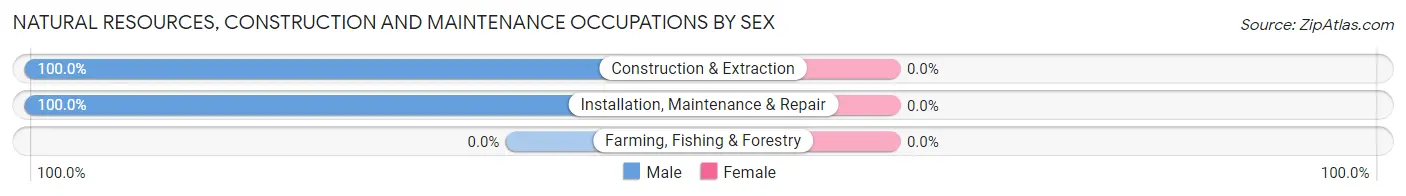
| Occupation | Male | Female |
| Farming, Fishing & Forestry | 0 (0.0%) | 0 (0.0%) |
| Construction & Extraction | 23 (100.0%) | 0 (0.0%) |
| Installation, Maintenance & Repair | 5 (100.0%) | 0 (0.0%) |
| Total (Category) | 28 (100.0%) | 0 (0.0%) |
| Total (Overall) | 201 (51.8%) | 187 (48.2%) |
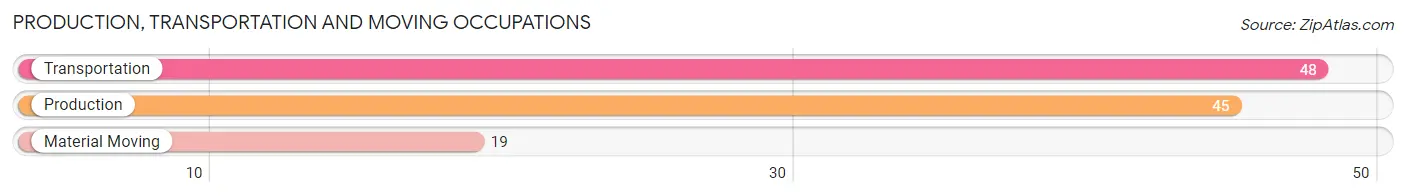
Production, Transportation and Moving Occupations
The most common Production, Transportation and Moving occupations in Beattyville are Transportation (48 | 12.4%), Production (45 | 11.6%), and Material Moving (19 | 4.9%).
Production, Transportation and Moving Occupations by Sex
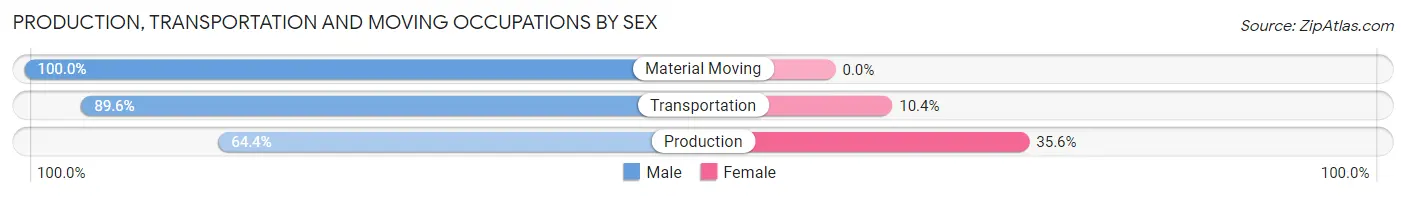
| Occupation | Male | Female |
| Production | 29 (64.4%) | 16 (35.6%) |
| Transportation | 43 (89.6%) | 5 (10.4%) |
| Material Moving | 19 (100.0%) | 0 (0.0%) |
| Total (Category) | 91 (81.2%) | 21 (18.8%) |
| Total (Overall) | 201 (51.8%) | 187 (48.2%) |
Employment Industries by Sex in Beattyville
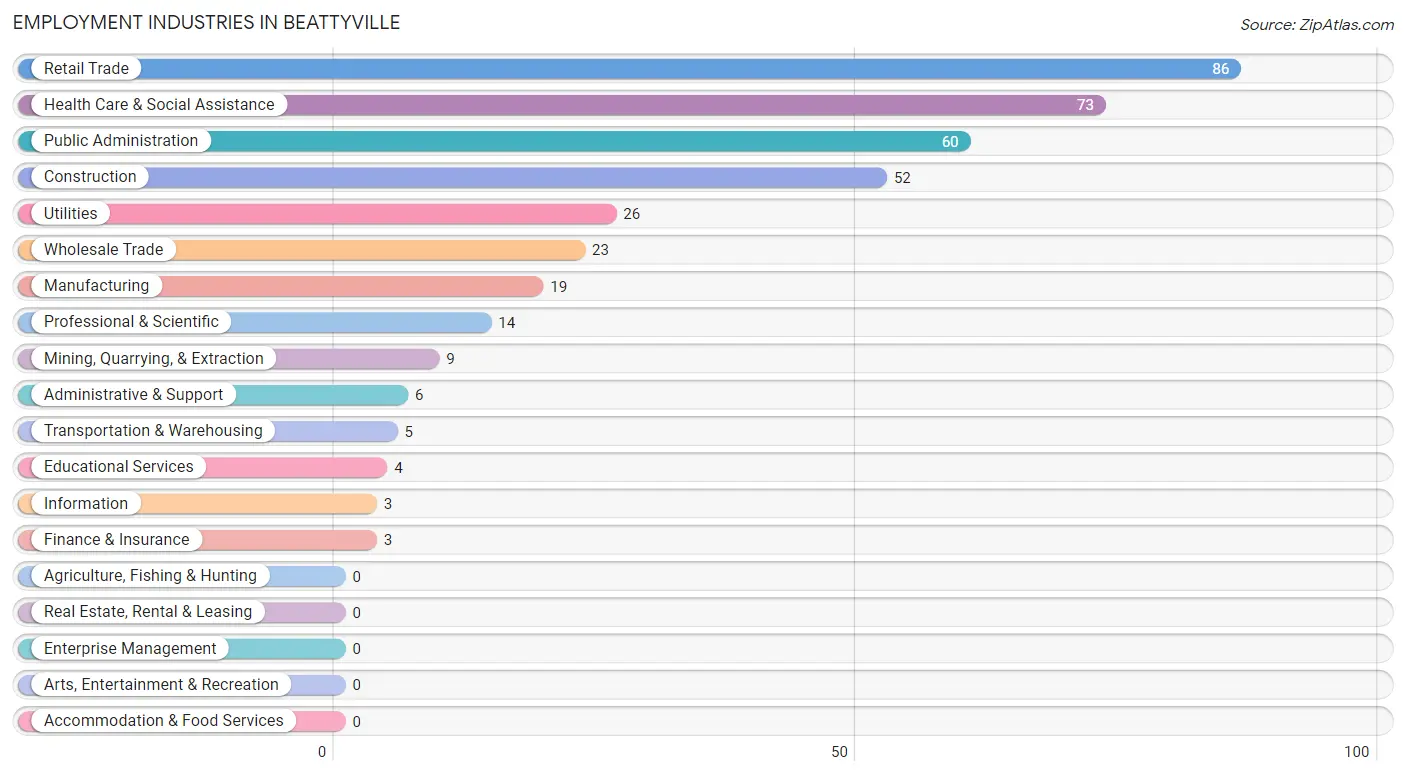
Employment Industries in Beattyville
The major employment industries in Beattyville include Retail Trade (86 | 22.2%), Health Care & Social Assistance (73 | 18.8%), Public Administration (60 | 15.5%), Construction (52 | 13.4%), and Utilities (26 | 6.7%).
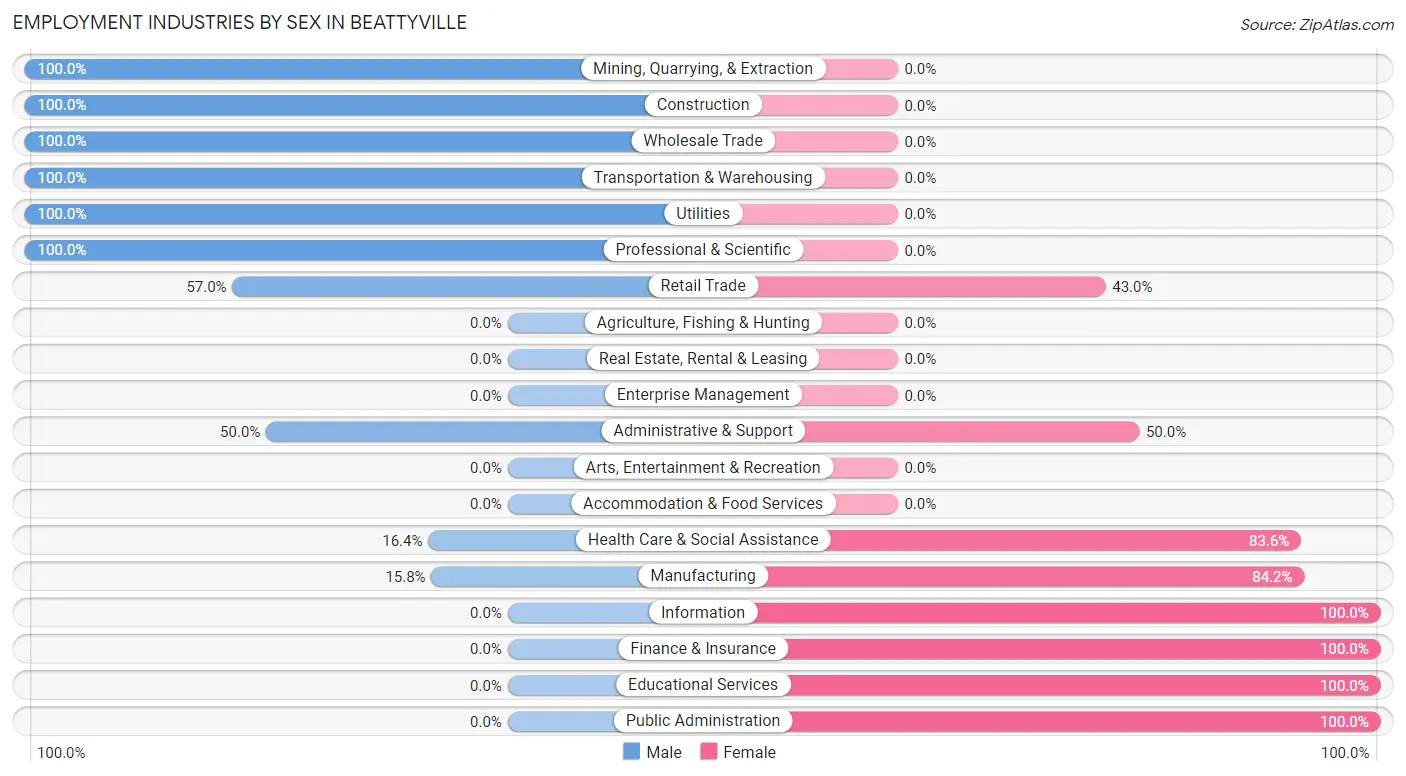
Employment Industries by Sex in Beattyville
The Beattyville industries that see more men than women are Mining, Quarrying, & Extraction (100.0%), Construction (100.0%), and Wholesale Trade (100.0%), whereas the industries that tend to have a higher number of women are Information (100.0%), Finance & Insurance (100.0%), and Educational Services (100.0%).
| Industry | Male | Female |
| Agriculture, Fishing & Hunting | 0 (0.0%) | 0 (0.0%) |
| Mining, Quarrying, & Extraction | 9 (100.0%) | 0 (0.0%) |
| Construction | 52 (100.0%) | 0 (0.0%) |
| Manufacturing | 3 (15.8%) | 16 (84.2%) |
| Wholesale Trade | 23 (100.0%) | 0 (0.0%) |
| Retail Trade | 49 (57.0%) | 37 (43.0%) |
| Transportation & Warehousing | 5 (100.0%) | 0 (0.0%) |
| Utilities | 26 (100.0%) | 0 (0.0%) |
| Information | 0 (0.0%) | 3 (100.0%) |
| Finance & Insurance | 0 (0.0%) | 3 (100.0%) |
| Real Estate, Rental & Leasing | 0 (0.0%) | 0 (0.0%) |
| Professional & Scientific | 14 (100.0%) | 0 (0.0%) |
| Enterprise Management | 0 (0.0%) | 0 (0.0%) |
| Administrative & Support | 3 (50.0%) | 3 (50.0%) |
| Educational Services | 0 (0.0%) | 4 (100.0%) |
| Health Care & Social Assistance | 12 (16.4%) | 61 (83.6%) |
| Arts, Entertainment & Recreation | 0 (0.0%) | 0 (0.0%) |
| Accommodation & Food Services | 0 (0.0%) | 0 (0.0%) |
| Public Administration | 0 (0.0%) | 60 (100.0%) |
| Total | 201 (51.8%) | 187 (48.2%) |
Education in Beattyville
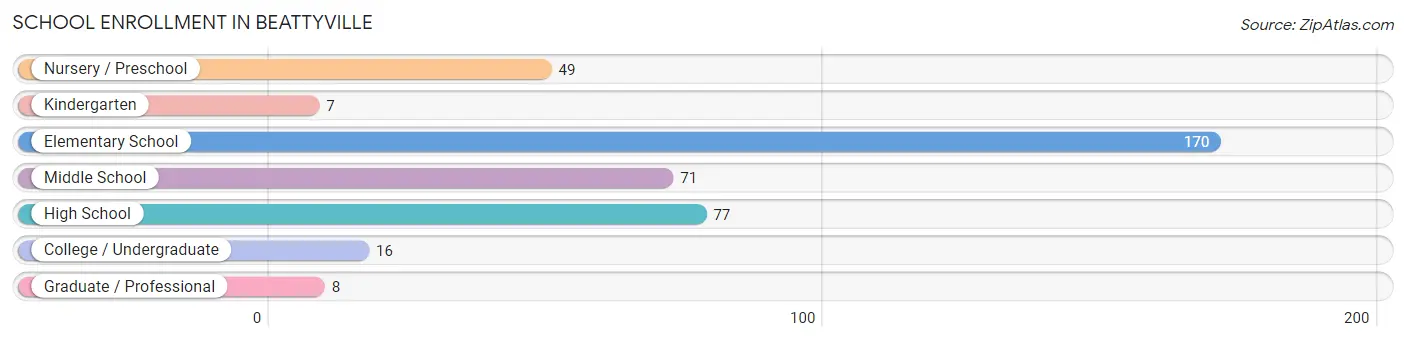
School Enrollment in Beattyville
The most common levels of schooling among the 398 students in Beattyville are elementary school (170 | 42.7%), high school (77 | 19.4%), and middle school (71 | 17.8%).
| School Level | # Students | % Students |
| Nursery / Preschool | 49 | 12.3% |
| Kindergarten | 7 | 1.8% |
| Elementary School | 170 | 42.7% |
| Middle School | 71 | 17.8% |
| High School | 77 | 19.4% |
| College / Undergraduate | 16 | 4.0% |
| Graduate / Professional | 8 | 2.0% |
| Total | 398 | 100.0% |
School Enrollment by Age by Funding Source in Beattyville
Out of a total of 398 students who are enrolled in schools in Beattyville, 111 (27.9%) attend a private institution, while the remaining 287 (72.1%) are enrolled in public schools. The age group of 35 years and over has the highest likelihood of being enrolled in private schools, with 16 (100.0% in the age bracket) enrolled. Conversely, the age group of 3 to 4 year olds has the lowest likelihood of being enrolled in a private school, with 34 (100.0% in the age bracket) attending a public institution.
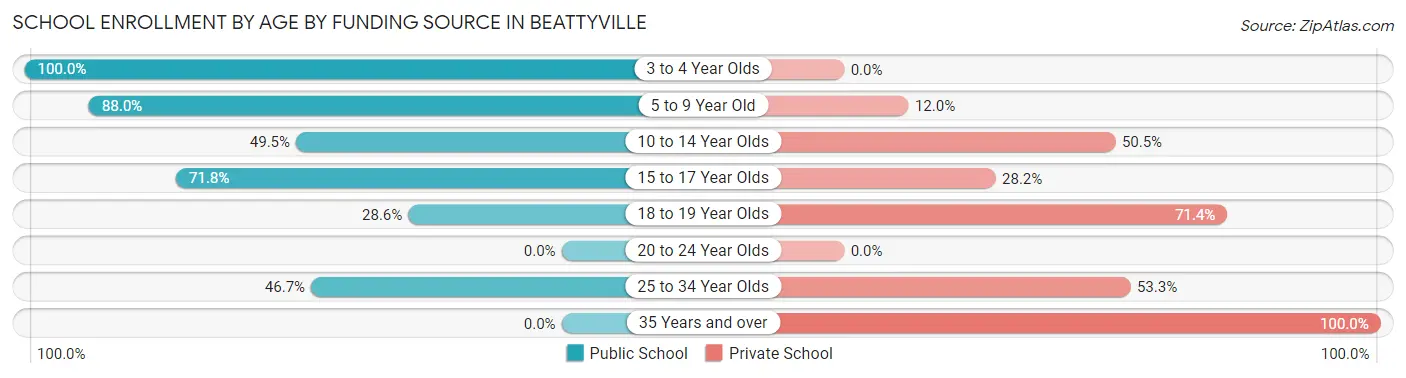
| Age Bracket | Public School | Private School |
| 3 to 4 Year Olds | 34 (100.0%) | 0 (0.0%) |
| 5 to 9 Year Old | 169 (88.0%) | 23 (12.0%) |
| 10 to 14 Year Olds | 47 (49.5%) | 48 (50.5%) |
| 15 to 17 Year Olds | 28 (71.8%) | 11 (28.2%) |
| 18 to 19 Year Olds | 2 (28.6%) | 5 (71.4%) |
| 20 to 24 Year Olds | 0 (0.0%) | 0 (0.0%) |
| 25 to 34 Year Olds | 7 (46.7%) | 8 (53.3%) |
| 35 Years and over | 0 (0.0%) | 16 (100.0%) |
| Total | 287 (72.1%) | 111 (27.9%) |
Educational Attainment by Field of Study in Beattyville
Arts & humanities (38 | 62.3%), computers & mathematics (14 | 23.0%), science & technology (6 | 9.8%), liberal arts & history (2 | 3.3%), and education (1 | 1.6%) are the most common fields of study among 61 individuals in Beattyville who have obtained a bachelor's degree or higher.
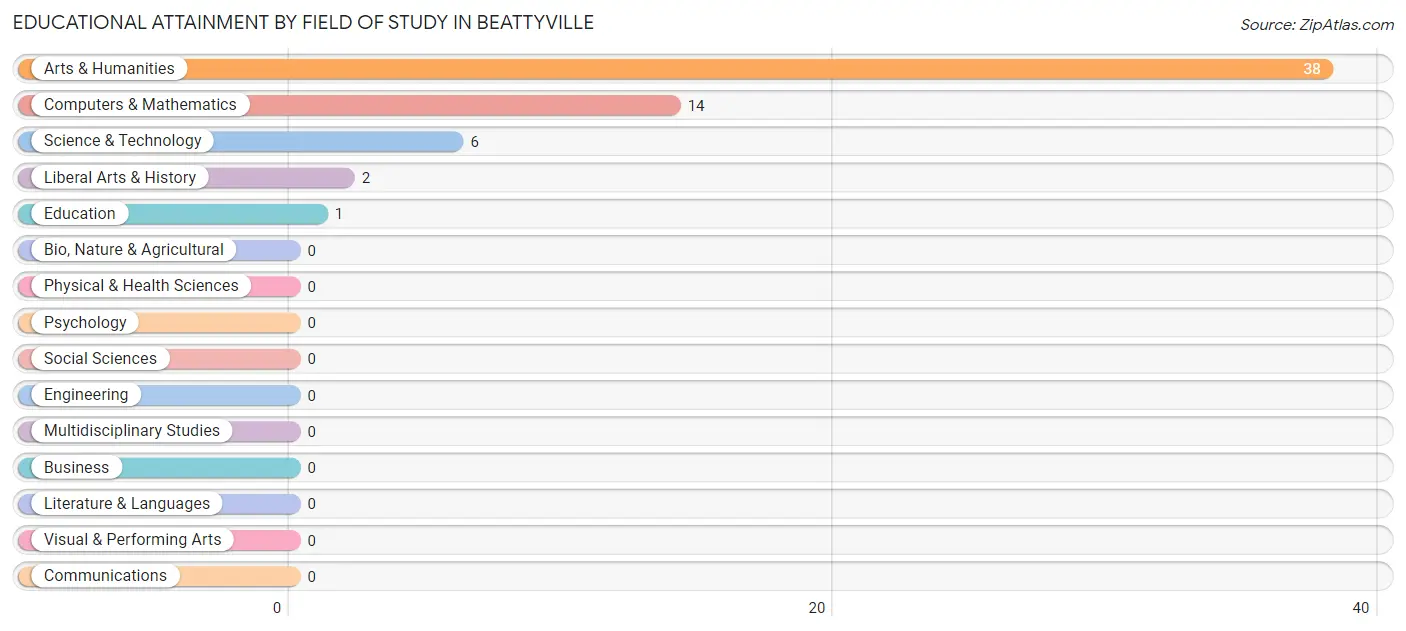
| Field of Study | # Graduates | % Graduates |
| Computers & Mathematics | 14 | 23.0% |
| Bio, Nature & Agricultural | 0 | 0.0% |
| Physical & Health Sciences | 0 | 0.0% |
| Psychology | 0 | 0.0% |
| Social Sciences | 0 | 0.0% |
| Engineering | 0 | 0.0% |
| Multidisciplinary Studies | 0 | 0.0% |
| Science & Technology | 6 | 9.8% |
| Business | 0 | 0.0% |
| Education | 1 | 1.6% |
| Literature & Languages | 0 | 0.0% |
| Liberal Arts & History | 2 | 3.3% |
| Visual & Performing Arts | 0 | 0.0% |
| Communications | 0 | 0.0% |
| Arts & Humanities | 38 | 62.3% |
| Total | 61 | 100.0% |
Transportation & Commute in Beattyville
Vehicle Availability by Sex in Beattyville
The most prevalent vehicle ownership categories in Beattyville are males with 2 vehicles (131, accounting for 62.1%) and females with 2 vehicles (72, making up 70.1%).
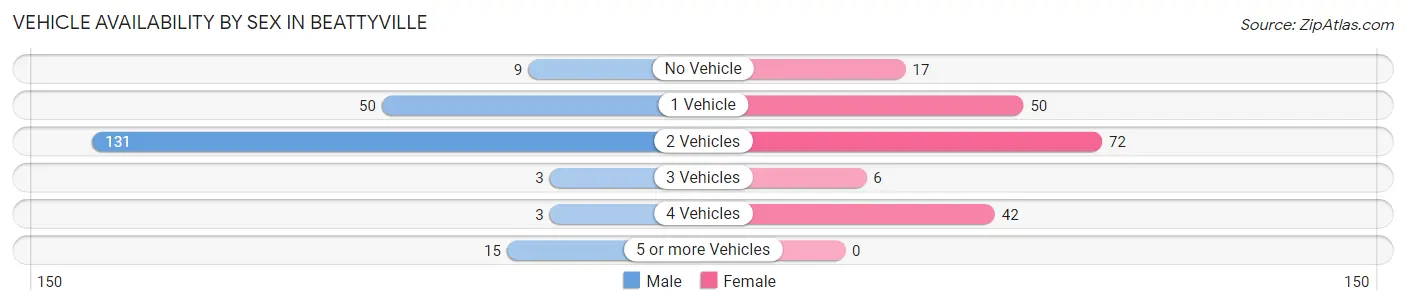
| Vehicles Available | Male | Female |
| No Vehicle | 9 (4.3%) | 17 (9.1%) |
| 1 Vehicle | 50 (23.7%) | 50 (26.7%) |
| 2 Vehicles | 131 (62.1%) | 72 (38.5%) |
| 3 Vehicles | 3 (1.4%) | 6 (3.2%) |
| 4 Vehicles | 3 (1.4%) | 42 (22.5%) |
| 5 or more Vehicles | 15 (7.1%) | 0 (0.0%) |
| Total | 211 (100.0%) | 187 (100.0%) |
Commute Time in Beattyville
The most frequently occuring commute durations in Beattyville are 5 to 9 minutes (115 commuters, 30.2%), 10 to 14 minutes (73 commuters, 19.2%), and 20 to 24 minutes (56 commuters, 14.7%).
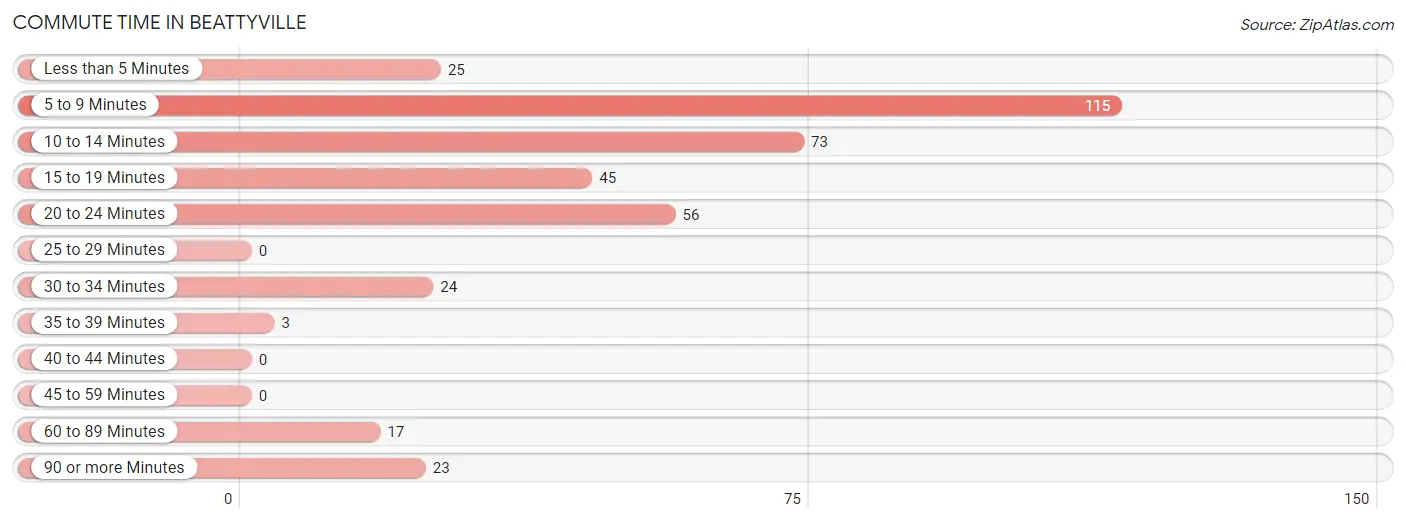
| Commute Time | # Commuters | % Commuters |
| Less than 5 Minutes | 25 | 6.6% |
| 5 to 9 Minutes | 115 | 30.2% |
| 10 to 14 Minutes | 73 | 19.2% |
| 15 to 19 Minutes | 45 | 11.8% |
| 20 to 24 Minutes | 56 | 14.7% |
| 25 to 29 Minutes | 0 | 0.0% |
| 30 to 34 Minutes | 24 | 6.3% |
| 35 to 39 Minutes | 3 | 0.8% |
| 40 to 44 Minutes | 0 | 0.0% |
| 45 to 59 Minutes | 0 | 0.0% |
| 60 to 89 Minutes | 17 | 4.5% |
| 90 or more Minutes | 23 | 6.0% |
Commute Time by Sex in Beattyville
The most common commute times in Beattyville are 10 to 14 minutes (63 commuters, 29.9%) for males and 5 to 9 minutes (54 commuters, 31.8%) for females.
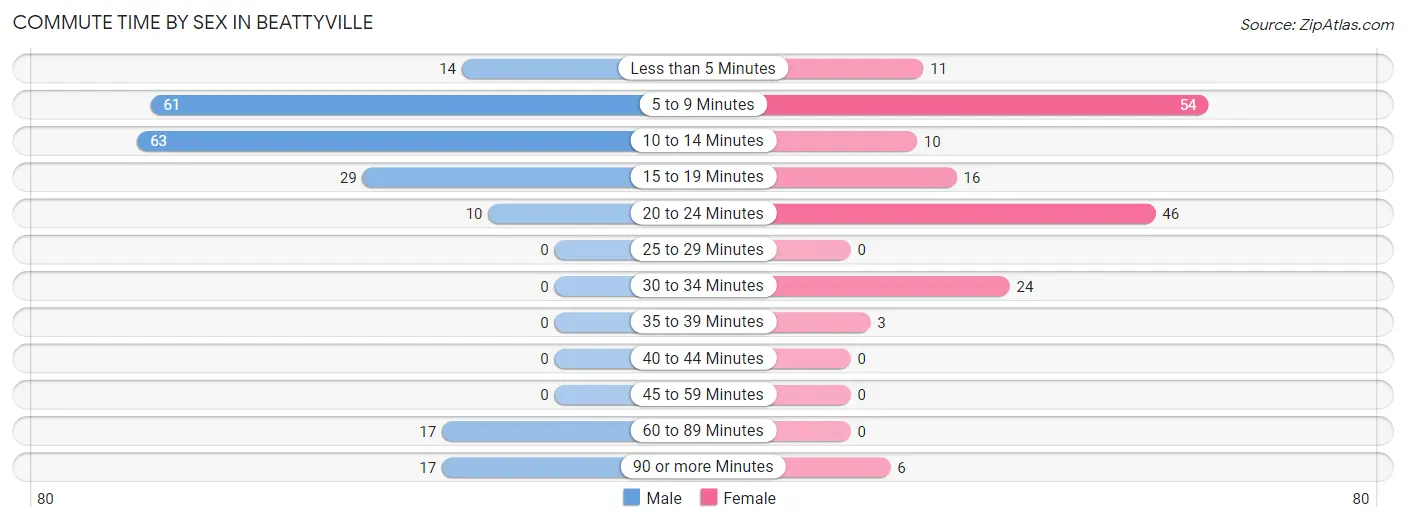
| Commute Time | Male | Female |
| Less than 5 Minutes | 14 (6.6%) | 11 (6.5%) |
| 5 to 9 Minutes | 61 (28.9%) | 54 (31.8%) |
| 10 to 14 Minutes | 63 (29.9%) | 10 (5.9%) |
| 15 to 19 Minutes | 29 (13.7%) | 16 (9.4%) |
| 20 to 24 Minutes | 10 (4.7%) | 46 (27.1%) |
| 25 to 29 Minutes | 0 (0.0%) | 0 (0.0%) |
| 30 to 34 Minutes | 0 (0.0%) | 24 (14.1%) |
| 35 to 39 Minutes | 0 (0.0%) | 3 (1.8%) |
| 40 to 44 Minutes | 0 (0.0%) | 0 (0.0%) |
| 45 to 59 Minutes | 0 (0.0%) | 0 (0.0%) |
| 60 to 89 Minutes | 17 (8.1%) | 0 (0.0%) |
| 90 or more Minutes | 17 (8.1%) | 6 (3.5%) |
Time of Departure to Work by Sex in Beattyville
The most frequent times of departure to work in Beattyville are 6:00 AM to 6:29 AM (46, 21.8%) for males and 7:30 AM to 7:59 AM (67, 39.4%) for females.
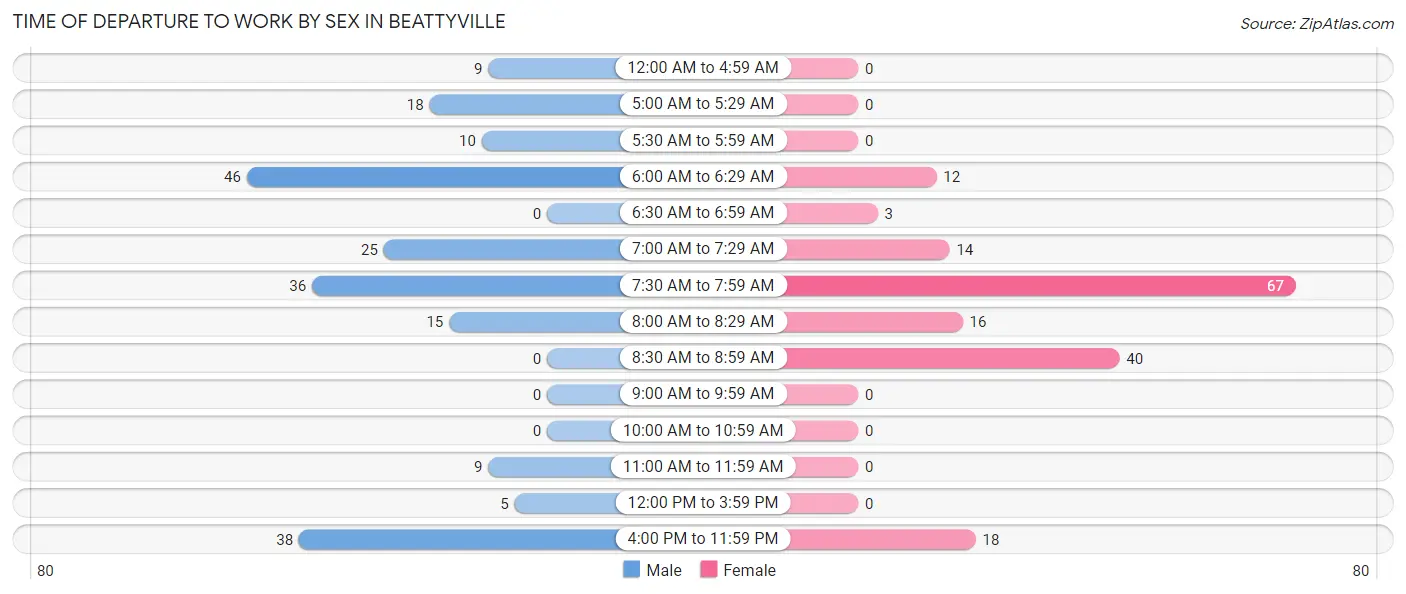
| Time of Departure | Male | Female |
| 12:00 AM to 4:59 AM | 9 (4.3%) | 0 (0.0%) |
| 5:00 AM to 5:29 AM | 18 (8.5%) | 0 (0.0%) |
| 5:30 AM to 5:59 AM | 10 (4.7%) | 0 (0.0%) |
| 6:00 AM to 6:29 AM | 46 (21.8%) | 12 (7.1%) |
| 6:30 AM to 6:59 AM | 0 (0.0%) | 3 (1.8%) |
| 7:00 AM to 7:29 AM | 25 (11.8%) | 14 (8.2%) |
| 7:30 AM to 7:59 AM | 36 (17.1%) | 67 (39.4%) |
| 8:00 AM to 8:29 AM | 15 (7.1%) | 16 (9.4%) |
| 8:30 AM to 8:59 AM | 0 (0.0%) | 40 (23.5%) |
| 9:00 AM to 9:59 AM | 0 (0.0%) | 0 (0.0%) |
| 10:00 AM to 10:59 AM | 0 (0.0%) | 0 (0.0%) |
| 11:00 AM to 11:59 AM | 9 (4.3%) | 0 (0.0%) |
| 12:00 PM to 3:59 PM | 5 (2.4%) | 0 (0.0%) |
| 4:00 PM to 11:59 PM | 38 (18.0%) | 18 (10.6%) |
| Total | 211 (100.0%) | 170 (100.0%) |
Housing Occupancy in Beattyville
Occupancy by Ownership in Beattyville
Of the total 497 dwellings in Beattyville, owner-occupied units account for 209 (42.0%), while renter-occupied units make up 288 (58.0%).
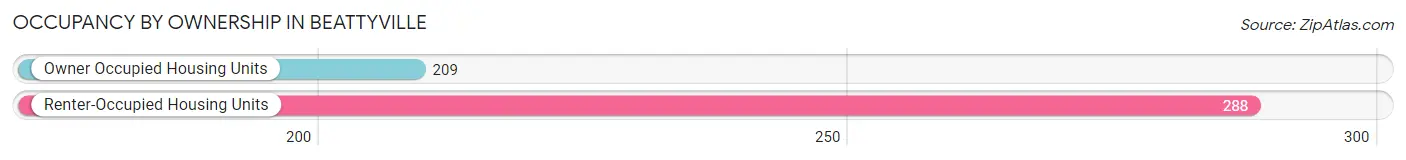
| Occupancy | # Housing Units | % Housing Units |
| Owner Occupied Housing Units | 209 | 42.0% |
| Renter-Occupied Housing Units | 288 | 58.0% |
| Total Occupied Housing Units | 497 | 100.0% |
Occupancy by Household Size in Beattyville
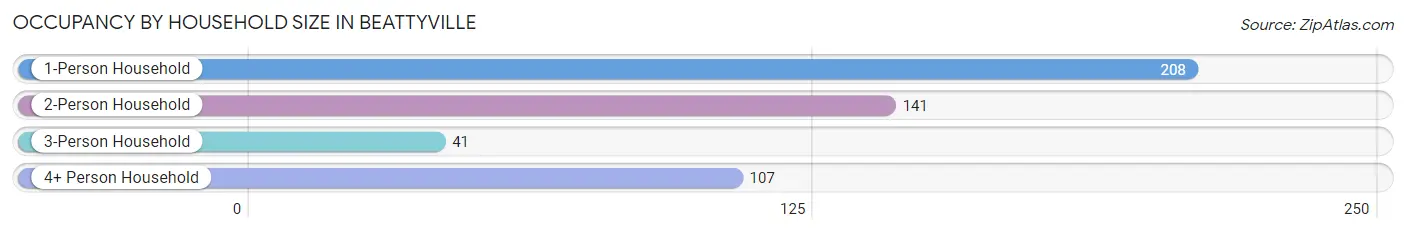
| Household Size | # Housing Units | % Housing Units |
| 1-Person Household | 208 | 41.8% |
| 2-Person Household | 141 | 28.4% |
| 3-Person Household | 41 | 8.3% |
| 4+ Person Household | 107 | 21.5% |
| Total Housing Units | 497 | 100.0% |
Occupancy by Ownership by Household Size in Beattyville
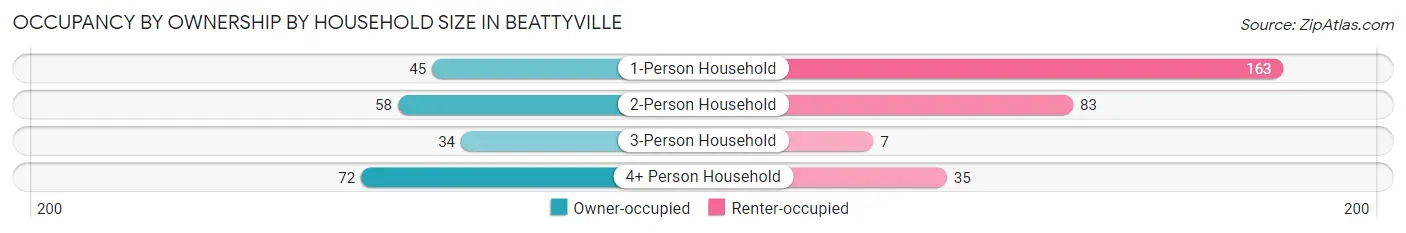
| Household Size | Owner-occupied | Renter-occupied |
| 1-Person Household | 45 (21.6%) | 163 (78.4%) |
| 2-Person Household | 58 (41.1%) | 83 (58.9%) |
| 3-Person Household | 34 (82.9%) | 7 (17.1%) |
| 4+ Person Household | 72 (67.3%) | 35 (32.7%) |
| Total Housing Units | 209 (42.0%) | 288 (58.0%) |
Occupancy by Educational Attainment in Beattyville
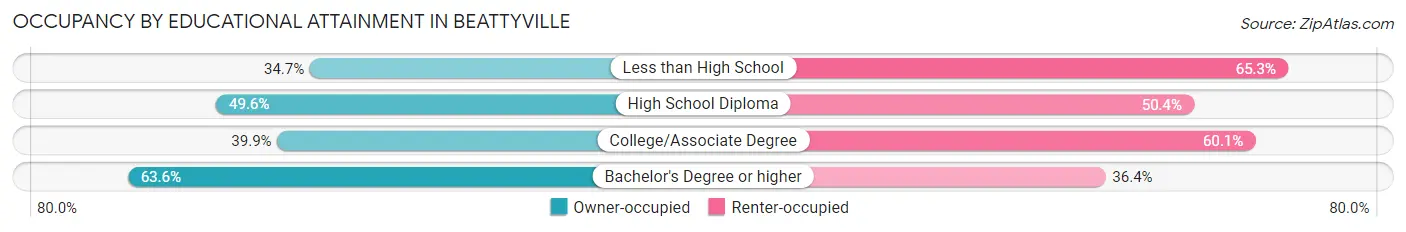
| Household Size | Owner-occupied | Renter-occupied |
| Less than High School | 50 (34.7%) | 94 (65.3%) |
| High School Diploma | 66 (49.6%) | 67 (50.4%) |
| College/Associate Degree | 79 (39.9%) | 119 (60.1%) |
| Bachelor's Degree or higher | 14 (63.6%) | 8 (36.4%) |
Occupancy by Age of Householder in Beattyville
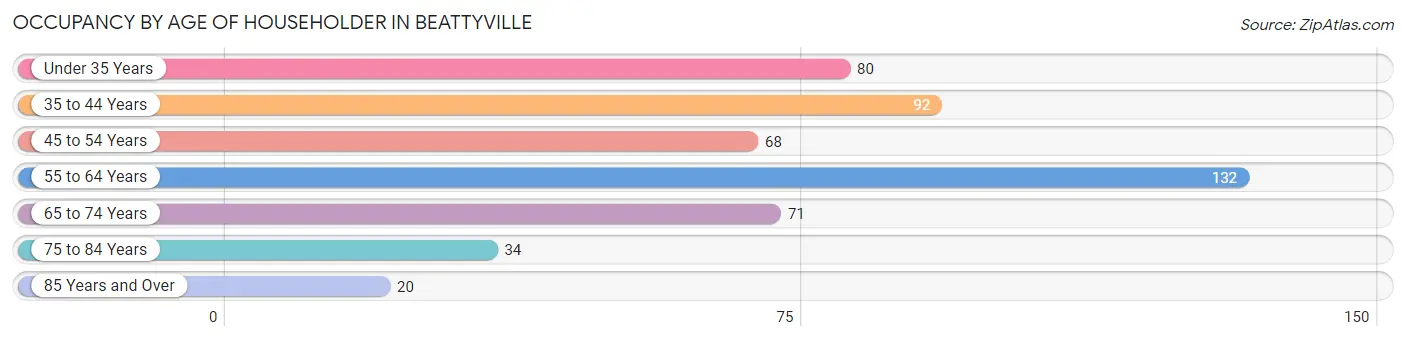
| Age Bracket | # Households | % Households |
| Under 35 Years | 80 | 16.1% |
| 35 to 44 Years | 92 | 18.5% |
| 45 to 54 Years | 68 | 13.7% |
| 55 to 64 Years | 132 | 26.6% |
| 65 to 74 Years | 71 | 14.3% |
| 75 to 84 Years | 34 | 6.8% |
| 85 Years and Over | 20 | 4.0% |
| Total | 497 | 100.0% |
Housing Finances in Beattyville
Median Income by Occupancy in Beattyville
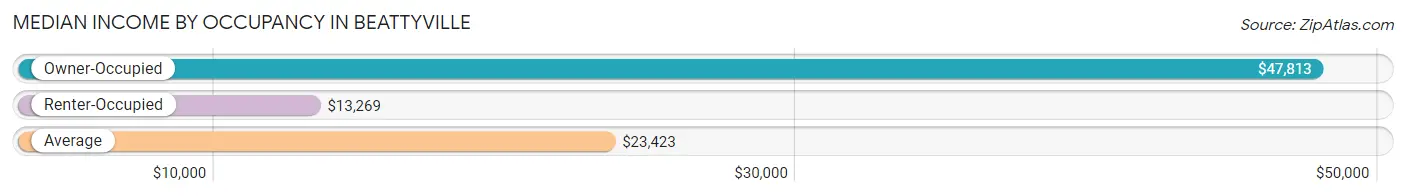
| Occupancy Type | # Households | Median Income |
| Owner-Occupied | 209 (42.0%) | $47,813 |
| Renter-Occupied | 288 (58.0%) | $13,269 |
| Average | 497 (100.0%) | $23,423 |
Occupancy by Householder Income Bracket in Beattyville
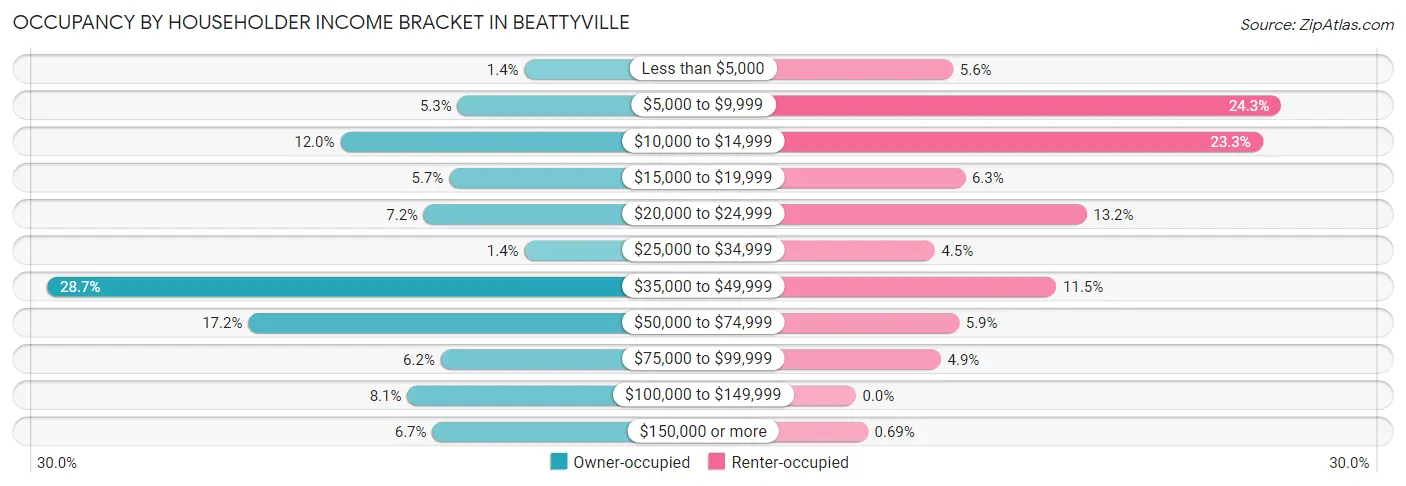
| Income Bracket | Owner-occupied | Renter-occupied |
| Less than $5,000 | 3 (1.4%) | 16 (5.6%) |
| $5,000 to $9,999 | 11 (5.3%) | 70 (24.3%) |
| $10,000 to $14,999 | 25 (12.0%) | 67 (23.3%) |
| $15,000 to $19,999 | 12 (5.7%) | 18 (6.2%) |
| $20,000 to $24,999 | 15 (7.2%) | 38 (13.2%) |
| $25,000 to $34,999 | 3 (1.4%) | 13 (4.5%) |
| $35,000 to $49,999 | 60 (28.7%) | 33 (11.5%) |
| $50,000 to $74,999 | 36 (17.2%) | 17 (5.9%) |
| $75,000 to $99,999 | 13 (6.2%) | 14 (4.9%) |
| $100,000 to $149,999 | 17 (8.1%) | 0 (0.0%) |
| $150,000 or more | 14 (6.7%) | 2 (0.7%) |
| Total | 209 (100.0%) | 288 (100.0%) |
Monthly Housing Cost Tiers in Beattyville
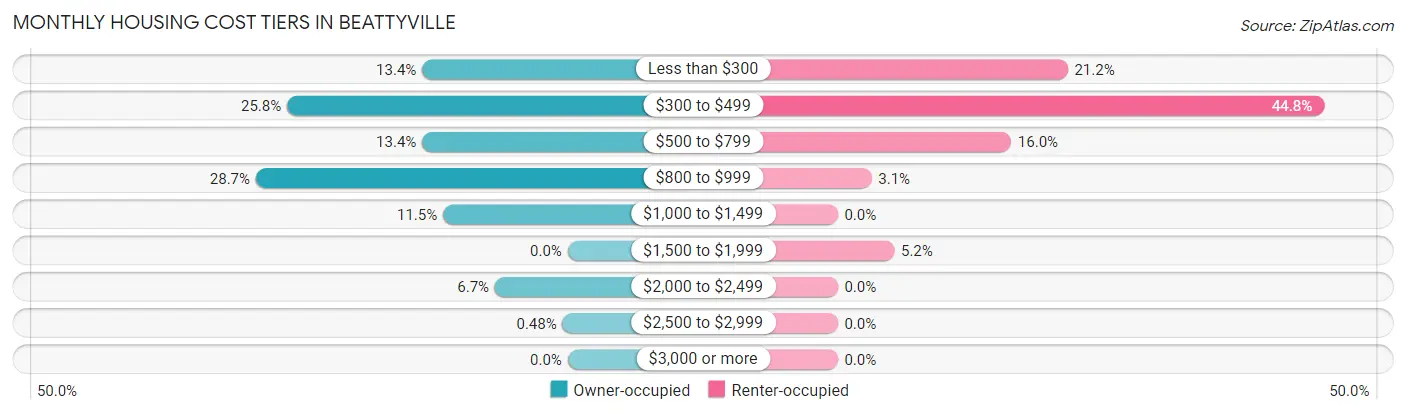
| Monthly Cost | Owner-occupied | Renter-occupied |
| Less than $300 | 28 (13.4%) | 61 (21.2%) |
| $300 to $499 | 54 (25.8%) | 129 (44.8%) |
| $500 to $799 | 28 (13.4%) | 46 (16.0%) |
| $800 to $999 | 60 (28.7%) | 9 (3.1%) |
| $1,000 to $1,499 | 24 (11.5%) | 0 (0.0%) |
| $1,500 to $1,999 | 0 (0.0%) | 15 (5.2%) |
| $2,000 to $2,499 | 14 (6.7%) | 0 (0.0%) |
| $2,500 to $2,999 | 1 (0.5%) | 0 (0.0%) |
| $3,000 or more | 0 (0.0%) | 0 (0.0%) |
| Total | 209 (100.0%) | 288 (100.0%) |
Physical Housing Characteristics in Beattyville
Housing Structures in Beattyville
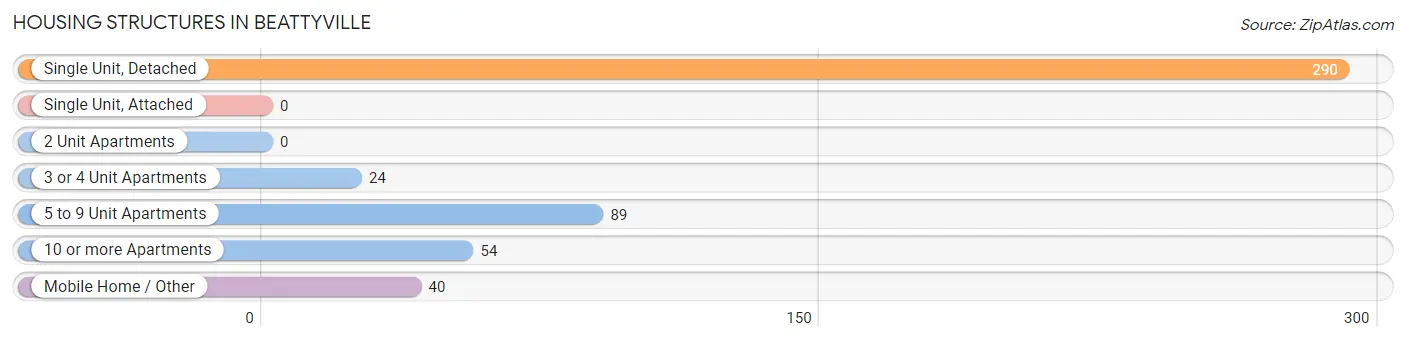
| Structure Type | # Housing Units | % Housing Units |
| Single Unit, Detached | 290 | 58.4% |
| Single Unit, Attached | 0 | 0.0% |
| 2 Unit Apartments | 0 | 0.0% |
| 3 or 4 Unit Apartments | 24 | 4.8% |
| 5 to 9 Unit Apartments | 89 | 17.9% |
| 10 or more Apartments | 54 | 10.9% |
| Mobile Home / Other | 40 | 8.1% |
| Total | 497 | 100.0% |
Housing Structures by Occupancy in Beattyville
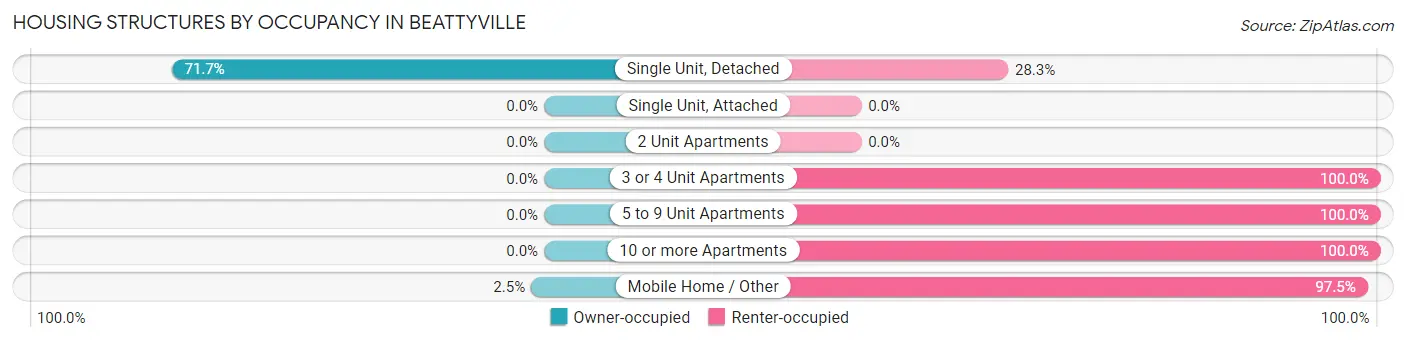
| Structure Type | Owner-occupied | Renter-occupied |
| Single Unit, Detached | 208 (71.7%) | 82 (28.3%) |
| Single Unit, Attached | 0 (0.0%) | 0 (0.0%) |
| 2 Unit Apartments | 0 (0.0%) | 0 (0.0%) |
| 3 or 4 Unit Apartments | 0 (0.0%) | 24 (100.0%) |
| 5 to 9 Unit Apartments | 0 (0.0%) | 89 (100.0%) |
| 10 or more Apartments | 0 (0.0%) | 54 (100.0%) |
| Mobile Home / Other | 1 (2.5%) | 39 (97.5%) |
| Total | 209 (42.0%) | 288 (58.0%) |
Housing Structures by Number of Rooms in Beattyville
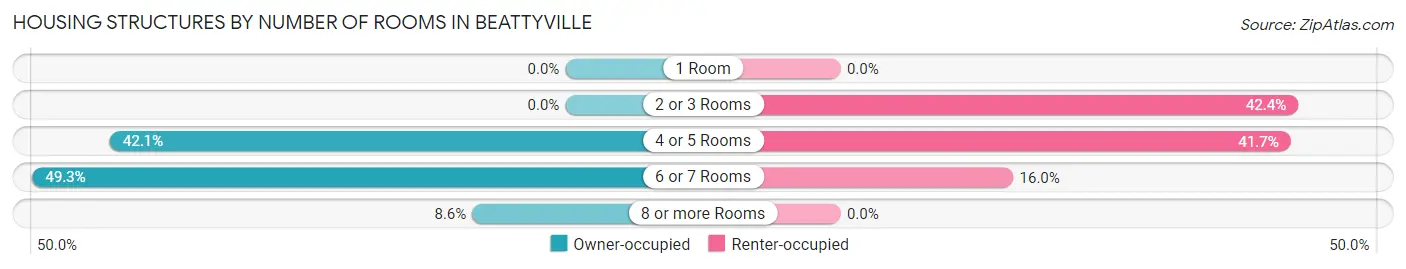
| Number of Rooms | Owner-occupied | Renter-occupied |
| 1 Room | 0 (0.0%) | 0 (0.0%) |
| 2 or 3 Rooms | 0 (0.0%) | 122 (42.4%) |
| 4 or 5 Rooms | 88 (42.1%) | 120 (41.7%) |
| 6 or 7 Rooms | 103 (49.3%) | 46 (16.0%) |
| 8 or more Rooms | 18 (8.6%) | 0 (0.0%) |
| Total | 209 (100.0%) | 288 (100.0%) |
Housing Structure by Heating Type in Beattyville
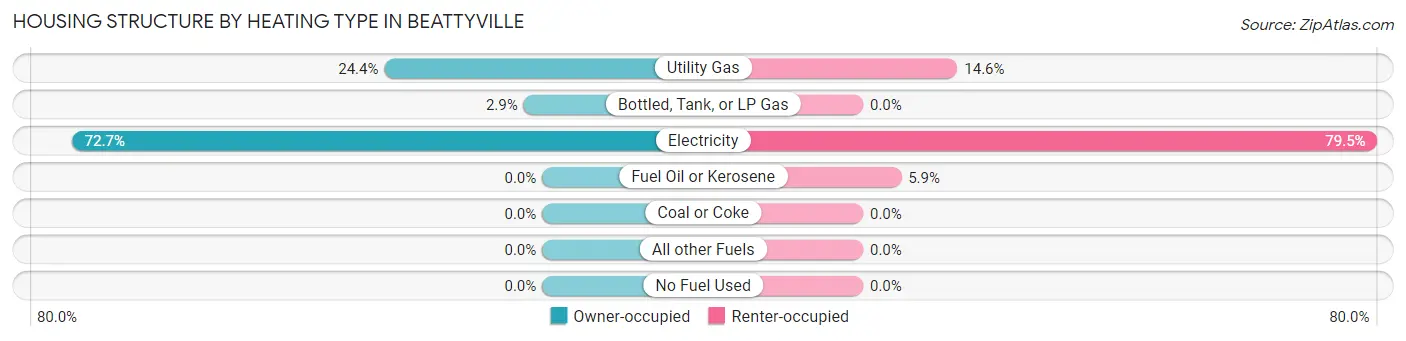
| Heating Type | Owner-occupied | Renter-occupied |
| Utility Gas | 51 (24.4%) | 42 (14.6%) |
| Bottled, Tank, or LP Gas | 6 (2.9%) | 0 (0.0%) |
| Electricity | 152 (72.7%) | 229 (79.5%) |
| Fuel Oil or Kerosene | 0 (0.0%) | 17 (5.9%) |
| Coal or Coke | 0 (0.0%) | 0 (0.0%) |
| All other Fuels | 0 (0.0%) | 0 (0.0%) |
| No Fuel Used | 0 (0.0%) | 0 (0.0%) |
| Total | 209 (100.0%) | 288 (100.0%) |
Household Vehicle Usage in Beattyville
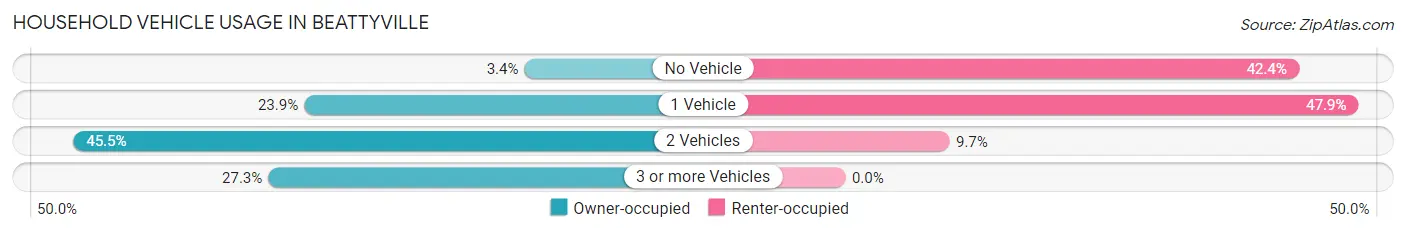
| Vehicles per Household | Owner-occupied | Renter-occupied |
| No Vehicle | 7 (3.4%) | 122 (42.4%) |
| 1 Vehicle | 50 (23.9%) | 138 (47.9%) |
| 2 Vehicles | 95 (45.5%) | 28 (9.7%) |
| 3 or more Vehicles | 57 (27.3%) | 0 (0.0%) |
| Total | 209 (100.0%) | 288 (100.0%) |
Real Estate & Mortgages in Beattyville
Real Estate and Mortgage Overview in Beattyville
| Characteristic | Without Mortgage | With Mortgage |
| Housing Units | 85 | 124 |
| Median Property Value | $87,300 | $97,900 |
| Median Household Income | $48,080 | $0 |
| Monthly Housing Costs | $381 | $0 |
| Real Estate Taxes | $918 | $12 |
Property Value by Mortgage Status in Beattyville
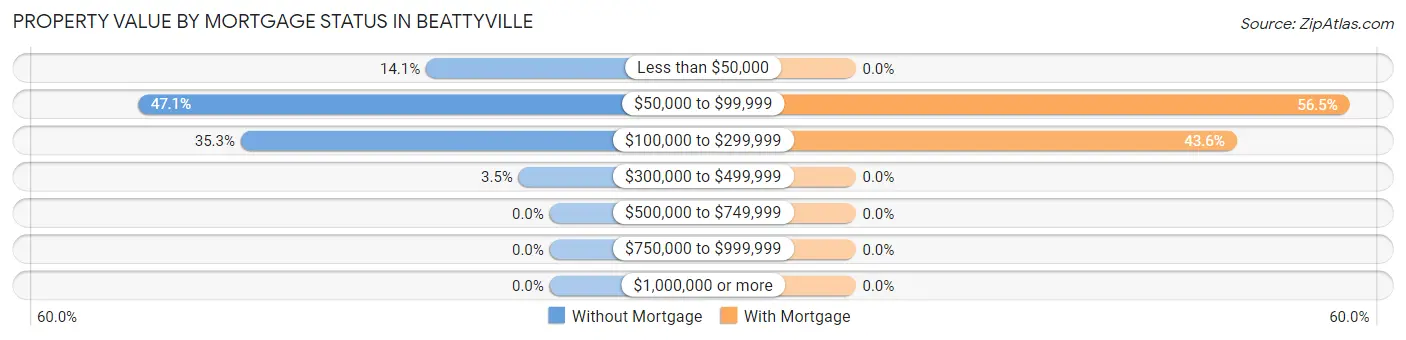
| Property Value | Without Mortgage | With Mortgage |
| Less than $50,000 | 12 (14.1%) | 0 (0.0%) |
| $50,000 to $99,999 | 40 (47.1%) | 70 (56.5%) |
| $100,000 to $299,999 | 30 (35.3%) | 54 (43.5%) |
| $300,000 to $499,999 | 3 (3.5%) | 0 (0.0%) |
| $500,000 to $749,999 | 0 (0.0%) | 0 (0.0%) |
| $750,000 to $999,999 | 0 (0.0%) | 0 (0.0%) |
| $1,000,000 or more | 0 (0.0%) | 0 (0.0%) |
| Total | 85 (100.0%) | 124 (100.0%) |
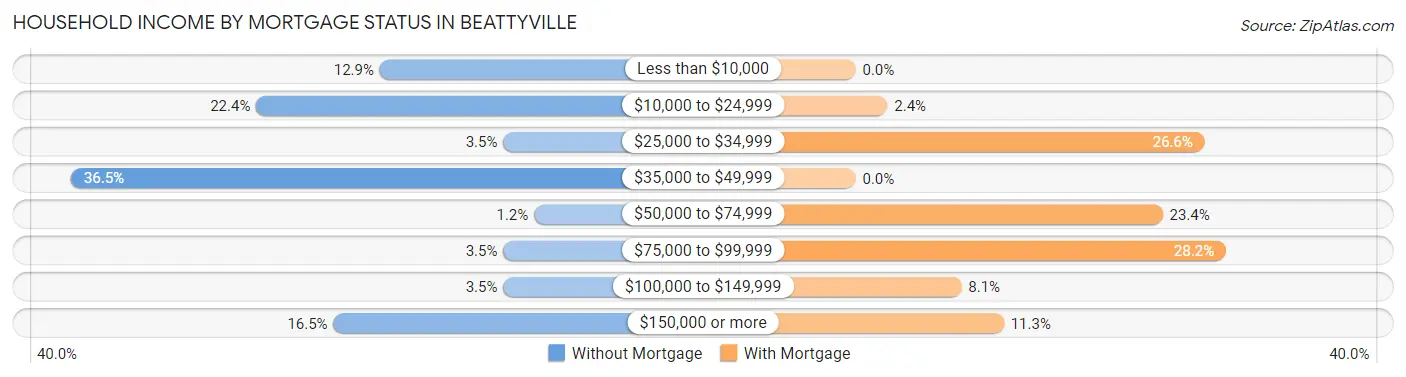
Household Income by Mortgage Status in Beattyville
| Household Income | Without Mortgage | With Mortgage |
| Less than $10,000 | 11 (12.9%) | 0 (0.0%) |
| $10,000 to $24,999 | 19 (22.4%) | 3 (2.4%) |
| $25,000 to $34,999 | 3 (3.5%) | 33 (26.6%) |
| $35,000 to $49,999 | 31 (36.5%) | 0 (0.0%) |
| $50,000 to $74,999 | 1 (1.2%) | 29 (23.4%) |
| $75,000 to $99,999 | 3 (3.5%) | 35 (28.2%) |
| $100,000 to $149,999 | 3 (3.5%) | 10 (8.1%) |
| $150,000 or more | 14 (16.5%) | 14 (11.3%) |
| Total | 85 (100.0%) | 124 (100.0%) |
Property Value to Household Income Ratio in Beattyville
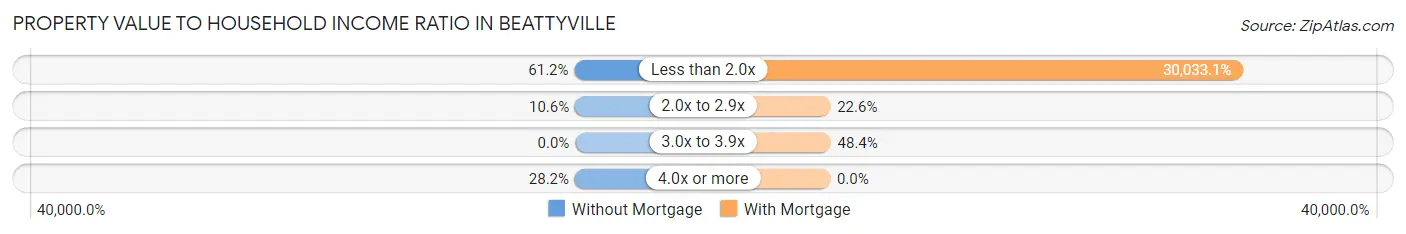
| Value-to-Income Ratio | Without Mortgage | With Mortgage |
| Less than 2.0x | 52 (61.2%) | 37,241 (30,033.1%) |
| 2.0x to 2.9x | 9 (10.6%) | 28 (22.6%) |
| 3.0x to 3.9x | 0 (0.0%) | 60 (48.4%) |
| 4.0x or more | 24 (28.2%) | 0 (0.0%) |
| Total | 85 (100.0%) | 124 (100.0%) |
Real Estate Taxes by Mortgage Status in Beattyville
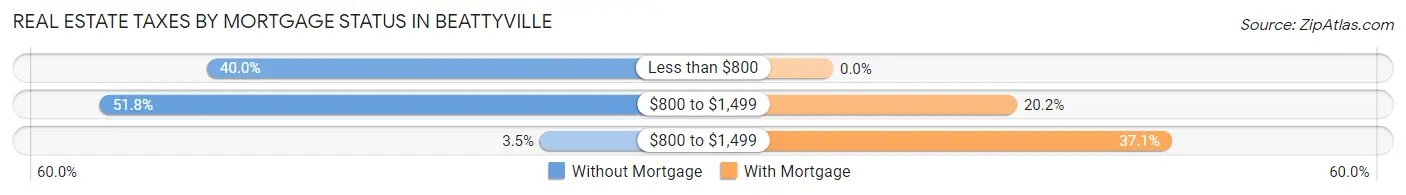
| Property Taxes | Without Mortgage | With Mortgage |
| Less than $800 | 34 (40.0%) | 0 (0.0%) |
| $800 to $1,499 | 44 (51.8%) | 25 (20.2%) |
| $800 to $1,499 | 3 (3.5%) | 46 (37.1%) |
| Total | 85 (100.0%) | 124 (100.0%) |
Health & Disability in Beattyville
Health Insurance Coverage by Age in Beattyville
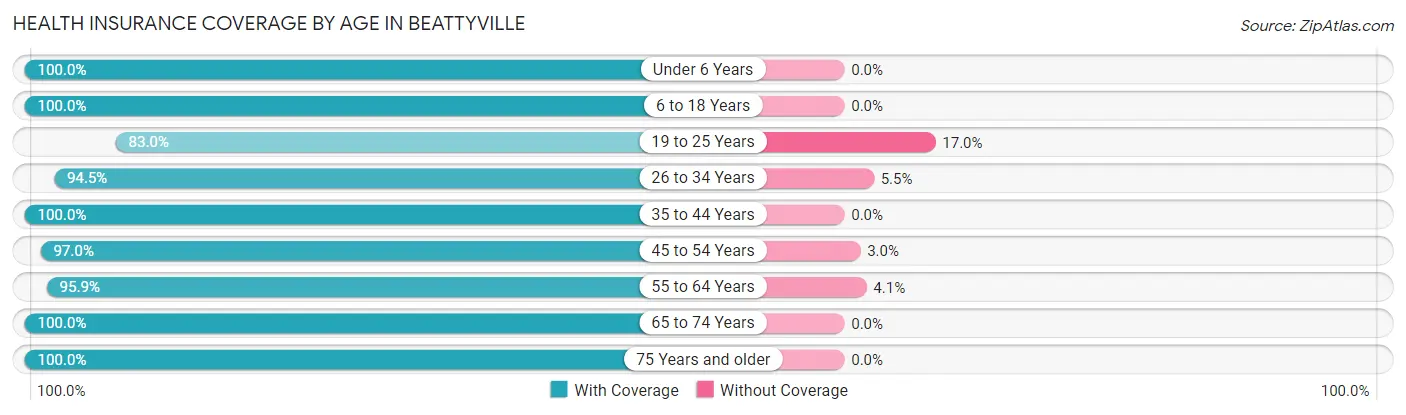
| Age Bracket | With Coverage | Without Coverage |
| Under 6 Years | 91 (100.0%) | 0 (0.0%) |
| 6 to 18 Years | 343 (100.0%) | 0 (0.0%) |
| 19 to 25 Years | 44 (83.0%) | 9 (17.0%) |
| 26 to 34 Years | 138 (94.5%) | 8 (5.5%) |
| 35 to 44 Years | 238 (100.0%) | 0 (0.0%) |
| 45 to 54 Years | 98 (97.0%) | 3 (3.0%) |
| 55 to 64 Years | 163 (95.9%) | 7 (4.1%) |
| 65 to 74 Years | 72 (100.0%) | 0 (0.0%) |
| 75 Years and older | 79 (100.0%) | 0 (0.0%) |
| Total | 1,266 (97.9%) | 27 (2.1%) |
Health Insurance Coverage by Citizenship Status in Beattyville
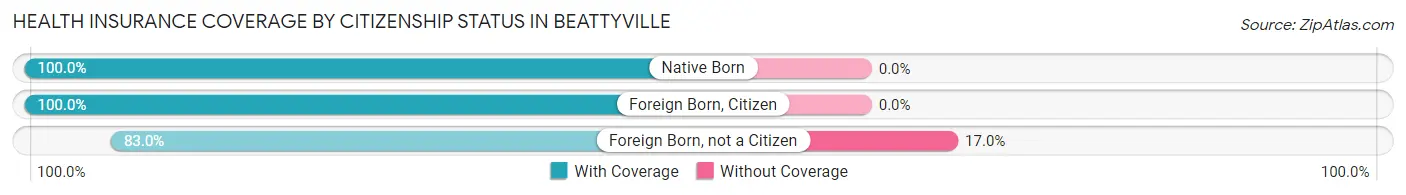
| Citizenship Status | With Coverage | Without Coverage |
| Native Born | 91 (100.0%) | 0 (0.0%) |
| Foreign Born, Citizen | 343 (100.0%) | 0 (0.0%) |
| Foreign Born, not a Citizen | 44 (83.0%) | 9 (17.0%) |
Health Insurance Coverage by Household Income in Beattyville
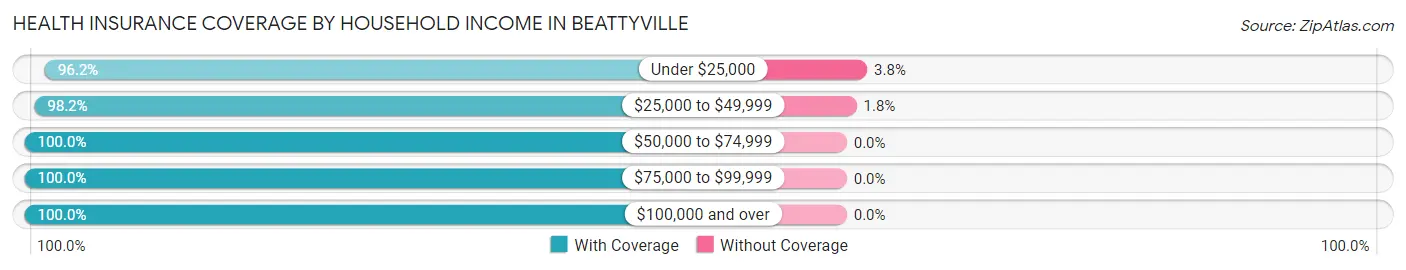
| Household Income | With Coverage | Without Coverage |
| Under $25,000 | 480 (96.2%) | 19 (3.8%) |
| $25,000 to $49,999 | 430 (98.2%) | 8 (1.8%) |
| $50,000 to $74,999 | 147 (100.0%) | 0 (0.0%) |
| $75,000 to $99,999 | 53 (100.0%) | 0 (0.0%) |
| $100,000 and over | 156 (100.0%) | 0 (0.0%) |
Public vs Private Health Insurance Coverage by Age in Beattyville
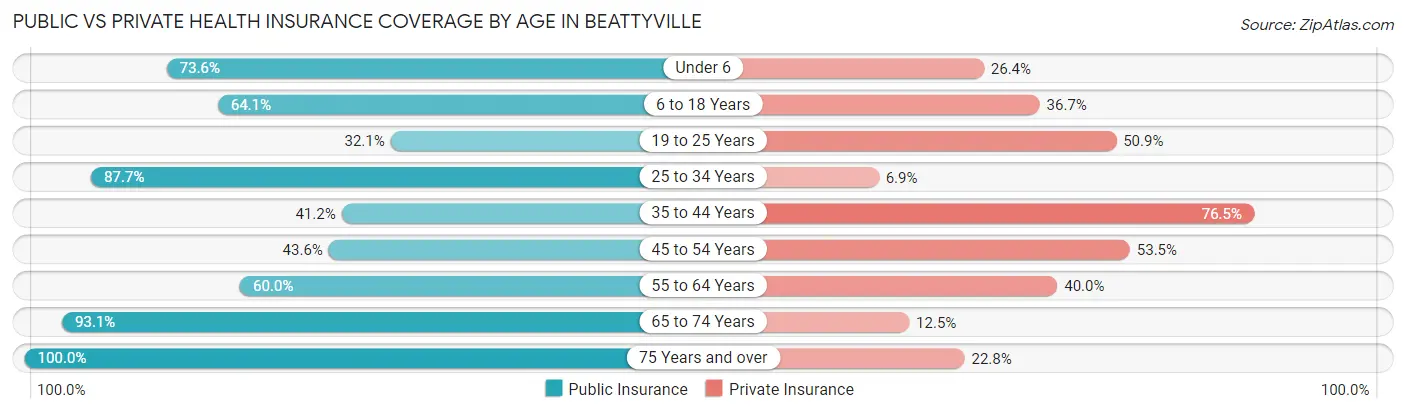
| Age Bracket | Public Insurance | Private Insurance |
| Under 6 | 67 (73.6%) | 24 (26.4%) |
| 6 to 18 Years | 220 (64.1%) | 126 (36.7%) |
| 19 to 25 Years | 17 (32.1%) | 27 (50.9%) |
| 25 to 34 Years | 128 (87.7%) | 10 (6.9%) |
| 35 to 44 Years | 98 (41.2%) | 182 (76.5%) |
| 45 to 54 Years | 44 (43.6%) | 54 (53.5%) |
| 55 to 64 Years | 102 (60.0%) | 68 (40.0%) |
| 65 to 74 Years | 67 (93.1%) | 9 (12.5%) |
| 75 Years and over | 79 (100.0%) | 18 (22.8%) |
| Total | 822 (63.6%) | 518 (40.1%) |
Disability Status by Sex by Age in Beattyville
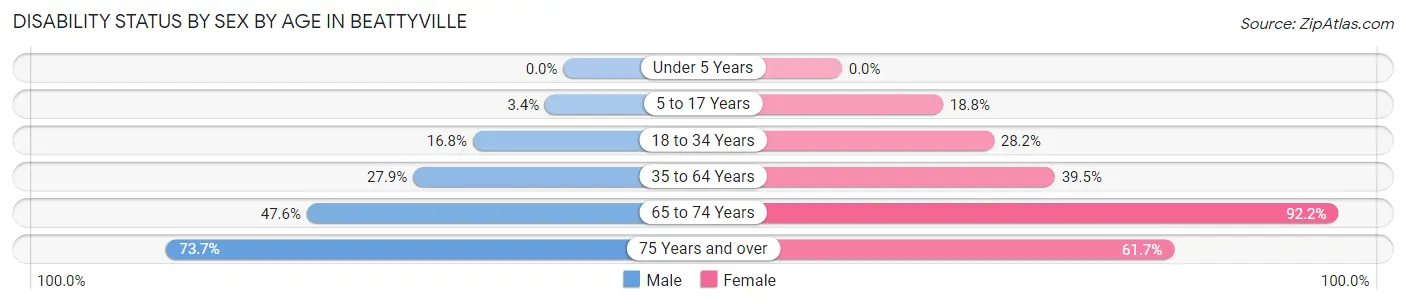
| Age Bracket | Male | Female |
| Under 5 Years | 0 (0.0%) | 0 (0.0%) |
| 5 to 17 Years | 10 (3.4%) | 6 (18.8%) |
| 18 to 34 Years | 19 (16.8%) | 33 (28.2%) |
| 35 to 64 Years | 70 (27.9%) | 102 (39.5%) |
| 65 to 74 Years | 10 (47.6%) | 47 (92.2%) |
| 75 Years and over | 14 (73.7%) | 37 (61.7%) |
Disability Class by Sex by Age in Beattyville
Disability Class: Hearing Difficulty
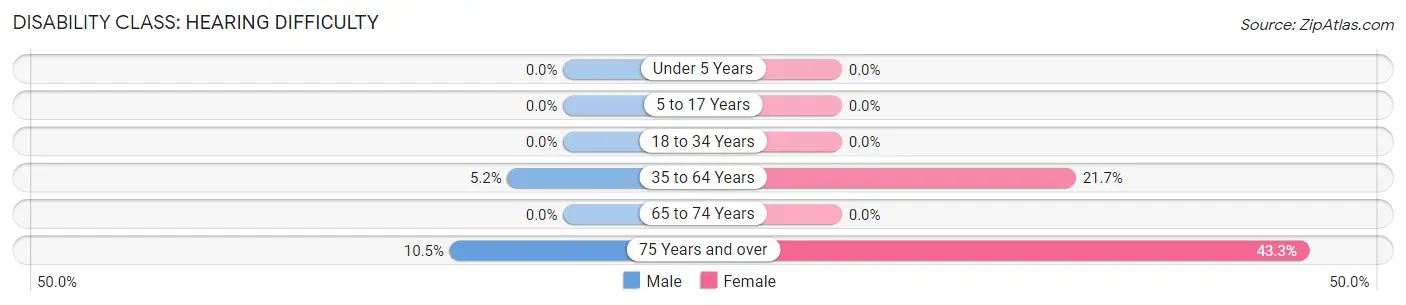
| Age Bracket | Male | Female |
| Under 5 Years | 0 (0.0%) | 0 (0.0%) |
| 5 to 17 Years | 0 (0.0%) | 0 (0.0%) |
| 18 to 34 Years | 0 (0.0%) | 0 (0.0%) |
| 35 to 64 Years | 13 (5.2%) | 56 (21.7%) |
| 65 to 74 Years | 0 (0.0%) | 0 (0.0%) |
| 75 Years and over | 2 (10.5%) | 26 (43.3%) |
Disability Class: Vision Difficulty
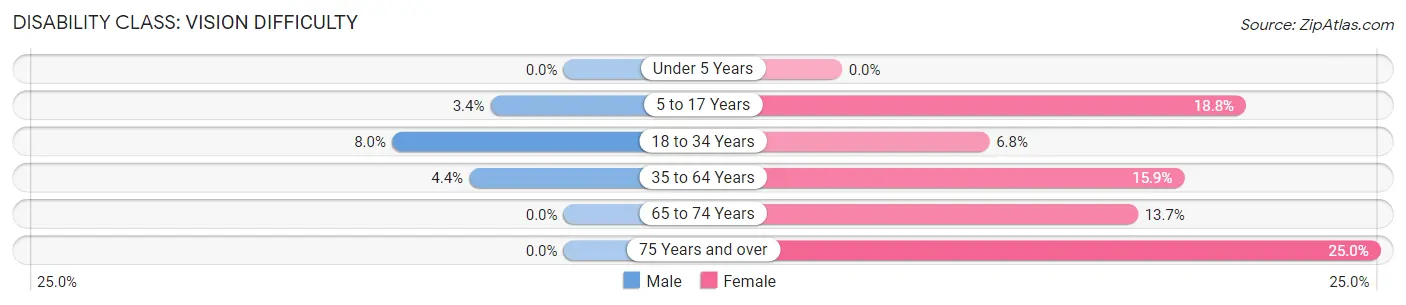
| Age Bracket | Male | Female |
| Under 5 Years | 0 (0.0%) | 0 (0.0%) |
| 5 to 17 Years | 10 (3.4%) | 6 (18.8%) |
| 18 to 34 Years | 9 (8.0%) | 8 (6.8%) |
| 35 to 64 Years | 11 (4.4%) | 41 (15.9%) |
| 65 to 74 Years | 0 (0.0%) | 7 (13.7%) |
| 75 Years and over | 0 (0.0%) | 15 (25.0%) |
Disability Class: Cognitive Difficulty
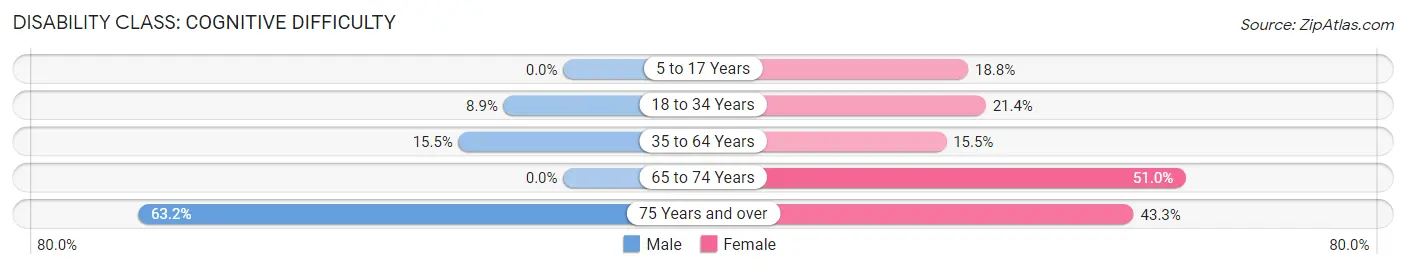
| Age Bracket | Male | Female |
| 5 to 17 Years | 0 (0.0%) | 6 (18.8%) |
| 18 to 34 Years | 10 (8.8%) | 25 (21.4%) |
| 35 to 64 Years | 39 (15.5%) | 40 (15.5%) |
| 65 to 74 Years | 0 (0.0%) | 26 (51.0%) |
| 75 Years and over | 12 (63.2%) | 26 (43.3%) |
Disability Class: Ambulatory Difficulty
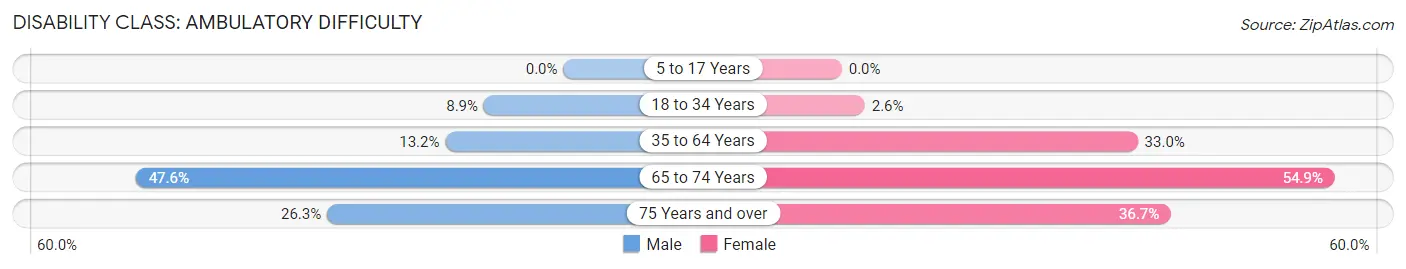
| Age Bracket | Male | Female |
| 5 to 17 Years | 0 (0.0%) | 0 (0.0%) |
| 18 to 34 Years | 10 (8.8%) | 3 (2.6%) |
| 35 to 64 Years | 33 (13.2%) | 85 (33.0%) |
| 65 to 74 Years | 10 (47.6%) | 28 (54.9%) |
| 75 Years and over | 5 (26.3%) | 22 (36.7%) |
Disability Class: Self-Care Difficulty
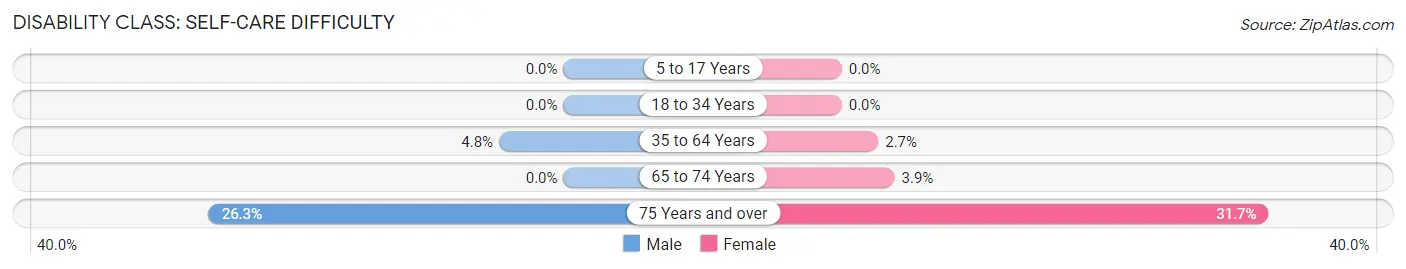
| Age Bracket | Male | Female |
| 5 to 17 Years | 0 (0.0%) | 0 (0.0%) |
| 18 to 34 Years | 0 (0.0%) | 0 (0.0%) |
| 35 to 64 Years | 12 (4.8%) | 7 (2.7%) |
| 65 to 74 Years | 0 (0.0%) | 2 (3.9%) |
| 75 Years and over | 5 (26.3%) | 19 (31.7%) |
Technology Access in Beattyville
Computing Device Access in Beattyville
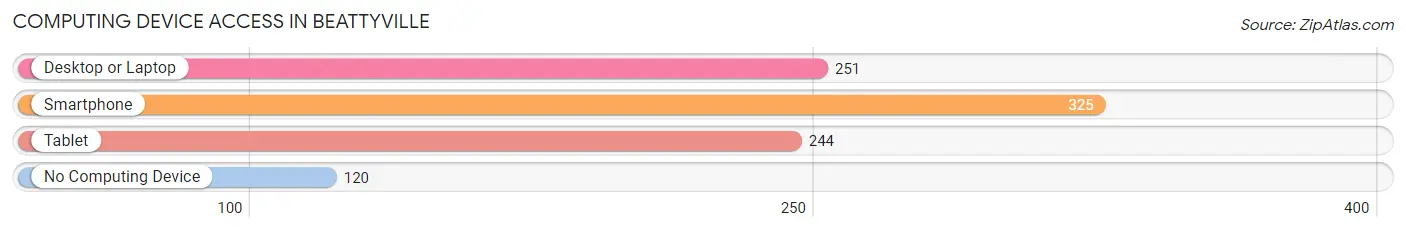
| Device Type | # Households | % Households |
| Desktop or Laptop | 251 | 50.5% |
| Smartphone | 325 | 65.4% |
| Tablet | 244 | 49.1% |
| No Computing Device | 120 | 24.1% |
| Total | 497 | 100.0% |
Internet Access in Beattyville
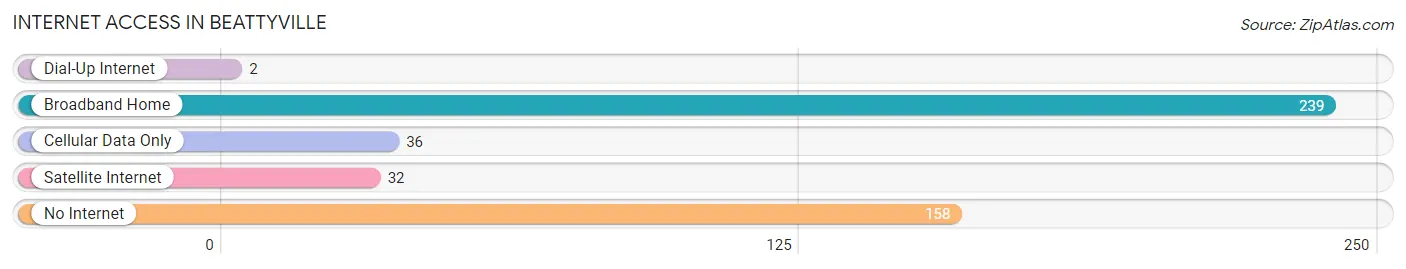
| Internet Type | # Households | % Households |
| Dial-Up Internet | 2 | 0.4% |
| Broadband Home | 239 | 48.1% |
| Cellular Data Only | 36 | 7.2% |
| Satellite Internet | 32 | 6.4% |
| No Internet | 158 | 31.8% |
| Total | 497 | 100.0% |
Beattyville Summary
Beattyville is a small city located in Lee County, Kentucky, United States. It is the county seat of Lee County and is situated along the Kentucky River. The population of Beattyville was 1,307 at the 2010 census.
History
The area that is now Beattyville was first settled in the late 1700s by a group of settlers from Virginia. The town was originally known as "Beattie's Station" after the first settler, William Beattie. The town was later renamed Beattyville in 1818 in honor of Beattie's son, John Beatty.
In 1820, Beattyville was officially incorporated as a town. The town was a major stop on the Kentucky River Navigation System, which was used to transport goods and people up and down the river. The town was also a major stop on the Underground Railroad, which was used to help slaves escape to freedom.
In the late 1800s, Beattyville was a major center for timber production. The town was also home to several coal mines, which provided jobs for many of the town's residents.
Geography
Beattyville is located in the foothills of the Appalachian Mountains in eastern Kentucky. The town is situated along the Kentucky River, which flows through the center of town. The town is surrounded by rolling hills and forests.
The climate in Beattyville is humid subtropical, with hot summers and mild winters. The average annual temperature is around 60°F (15°C). The average annual precipitation is around 45 inches (114 cm).
Economy
The economy of Beattyville is largely based on agriculture and tourism. The town is home to several farms, which produce a variety of crops, including corn, soybeans, and tobacco. The town is also home to several tourist attractions, including the Kentucky River Museum and the Beattyville Historic District.
The town is also home to several small businesses, including restaurants, shops, and services. The town is also home to several manufacturing companies, which produce a variety of products, including furniture, clothing, and automotive parts.
Demographics
As of the 2010 census, the population of Beattyville was 1,307. The racial makeup of the town was 95.3% White, 2.2% African American, 0.2% Native American, 0.2% Asian, 0.1% Pacific Islander, 0.7% from other races, and 1.3% from two or more races. Hispanic or Latino of any race were 1.7% of the population.
The median household income in Beattyville was $25,938, and the median family income was $31,250. The per capita income for the town was $14,845. About 20.3% of the population was below the poverty line.
Common Questions
What is Per Capita Income in Beattyville?
Per Capita income in Beattyville is $11,251.
What is the Median Family Income in Beattyville?
Median Family Income in Beattyville is $38,750.
What is the Median Household income in Beattyville?
Median Household Income in Beattyville is $23,423.
What is Income or Wage Gap in Beattyville?
Income or Wage Gap in Beattyville is 38.2%.
Women in Beattyville earn 61.8 cents for every dollar earned by a man.
What is Family Income Deficit in Beattyville?
Family Income Deficit in Beattyville is $8,720.
Families that are below poverty line in Beattyville earn $8,720 less on average than the poverty threshold level.
What is Inequality or Gini Index in Beattyville?
Inequality or Gini Index in Beattyville is 0.50.
What is the Total Population of Beattyville?
Total Population of Beattyville is 1,956.
What is the Total Male Population of Beattyville?
Total Male Population of Beattyville is 1,326.
What is the Total Female Population of Beattyville?
Total Female Population of Beattyville is 630.
What is the Ratio of Males per 100 Females in Beattyville?
There are 210.48 Males per 100 Females in Beattyville.
What is the Ratio of Females per 100 Males in Beattyville?
There are 47.51 Females per 100 Males in Beattyville.
What is the Median Population Age in Beattyville?
Median Population Age in Beattyville is 35.5 Years.
What is the Average Family Size in Beattyville
Average Family Size in Beattyville is 4.0 People.
What is the Average Household Size in Beattyville
Average Household Size in Beattyville is 2.6 People.
How Large is the Labor Force in Beattyville?
There are 448 People in the Labor Forcein in Beattyville.
What is the Percentage of People in the Labor Force in Beattyville?
28.3% of People are in the Labor Force in Beattyville.
What is the Unemployment Rate in Beattyville?
Unemployment Rate in Beattyville is 11.4%.