Mayfield, KY Map & Demographics
Mayfield Map
Mayfield Overview
$26,291
PER CAPITA INCOME
$57,260
AVG FAMILY INCOME
$42,589
AVG HOUSEHOLD INCOME
26.2%
WAGE / INCOME GAP [ % ]
73.8¢/ $1
WAGE / INCOME GAP [ $ ]
$13,931
FAMILY INCOME DEFICIT
0.54
INEQUALITY / GINI INDEX
10,011
TOTAL POPULATION
4,890
MALE POPULATION
5,121
FEMALE POPULATION
95.49
MALES / 100 FEMALES
104.72
FEMALES / 100 MALES
36.6
MEDIAN AGE
3.2
AVG FAMILY SIZE
2.3
AVG HOUSEHOLD SIZE
4,143
LABOR FORCE [ PEOPLE ]
55.1%
PERCENT IN LABOR FORCE
5.3%
UNEMPLOYMENT RATE
Mayfield Zip Codes
Mayfield Area Codes
Income in Mayfield
Income Overview in Mayfield
Per Capita Income in Mayfield is $26,291, while median incomes of families and households are $57,260 and $42,589 respectively.
| Characteristic | Number | Measure |
| Per Capita Income | 10,011 | $26,291 |
| Median Family Income | 2,340 | $57,260 |
| Mean Family Income | 2,340 | $74,926 |
| Median Household Income | 4,175 | $42,589 |
| Mean Household Income | 4,175 | $60,826 |
| Income Deficit | 2,340 | $13,931 |
| Wage / Income Gap (%) | 10,011 | 26.18% |
| Wage / Income Gap ($) | 10,011 | 73.82¢ per $1 |
| Gini / Inequality Index | 10,011 | 0.54 |
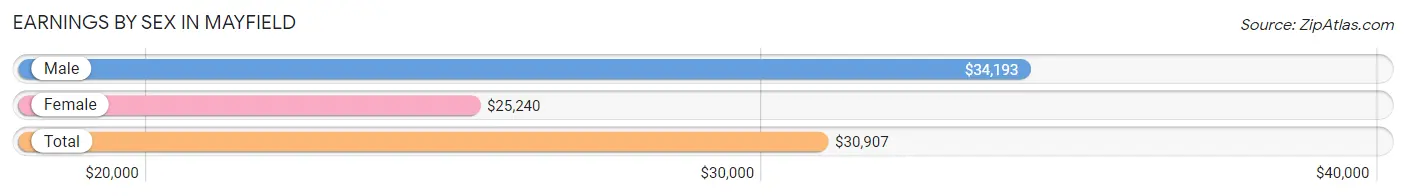
Earnings by Sex in Mayfield
Average Earnings in Mayfield are $30,907, $34,193 for men and $25,240 for women, a difference of 26.2%.
| Sex | Number | Average Earnings |
| Male | 2,471 (56.8%) | $34,193 |
| Female | 1,881 (43.2%) | $25,240 |
| Total | 4,352 (100.0%) | $30,907 |
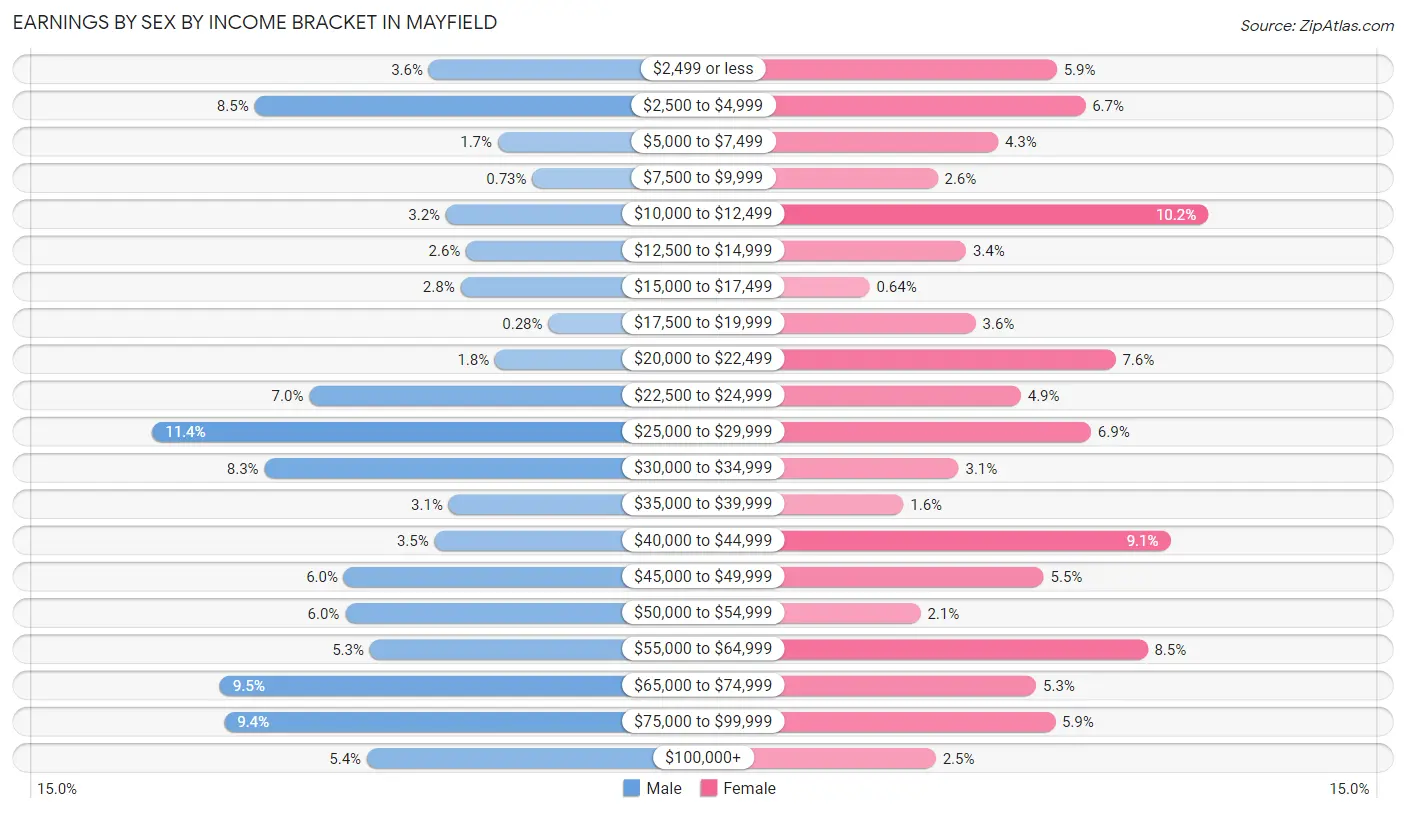
Earnings by Sex by Income Bracket in Mayfield
The most common earnings brackets in Mayfield are $25,000 to $29,999 for men (282 | 11.4%) and $10,000 to $12,499 for women (191 | 10.2%).
| Income | Male | Female |
| $2,499 or less | 90 (3.6%) | 111 (5.9%) |
| $2,500 to $4,999 | 211 (8.5%) | 126 (6.7%) |
| $5,000 to $7,499 | 42 (1.7%) | 80 (4.3%) |
| $7,500 to $9,999 | 18 (0.7%) | 48 (2.5%) |
| $10,000 to $12,499 | 78 (3.2%) | 191 (10.2%) |
| $12,500 to $14,999 | 64 (2.6%) | 63 (3.4%) |
| $15,000 to $17,499 | 68 (2.8%) | 12 (0.6%) |
| $17,500 to $19,999 | 7 (0.3%) | 68 (3.6%) |
| $20,000 to $22,499 | 44 (1.8%) | 142 (7.5%) |
| $22,500 to $24,999 | 173 (7.0%) | 92 (4.9%) |
| $25,000 to $29,999 | 282 (11.4%) | 129 (6.9%) |
| $30,000 to $34,999 | 204 (8.3%) | 59 (3.1%) |
| $35,000 to $39,999 | 76 (3.1%) | 30 (1.6%) |
| $40,000 to $44,999 | 86 (3.5%) | 171 (9.1%) |
| $45,000 to $49,999 | 149 (6.0%) | 104 (5.5%) |
| $50,000 to $54,999 | 148 (6.0%) | 39 (2.1%) |
| $55,000 to $64,999 | 131 (5.3%) | 159 (8.5%) |
| $65,000 to $74,999 | 235 (9.5%) | 100 (5.3%) |
| $75,000 to $99,999 | 232 (9.4%) | 110 (5.9%) |
| $100,000+ | 133 (5.4%) | 47 (2.5%) |
| Total | 2,471 (100.0%) | 1,881 (100.0%) |
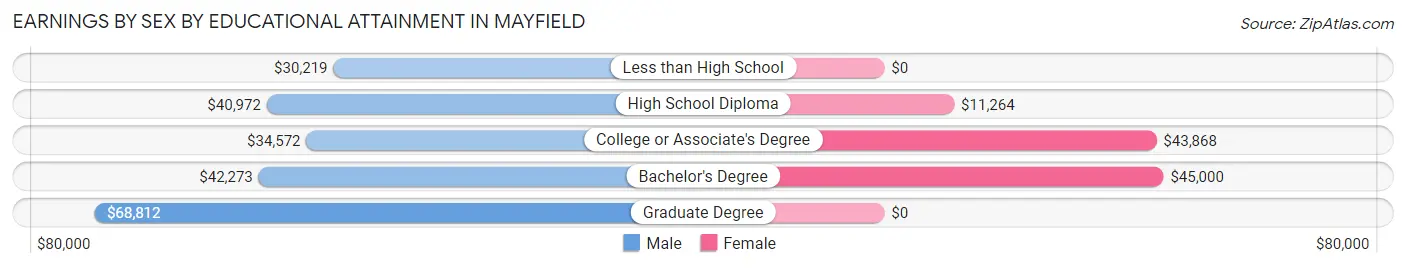
Earnings by Sex by Educational Attainment in Mayfield
Average earnings in Mayfield are $44,338 for men and $29,559 for women, a difference of 33.3%. Men with an educational attainment of graduate degree enjoy the highest average annual earnings of $68,812, while those with less than high school education earn the least with $30,219. Women with an educational attainment of bachelor's degree earn the most with the average annual earnings of $45,000, while those with high school diploma education have the smallest earnings of $11,264.
| Educational Attainment | Male Income | Female Income |
| Less than High School | $30,219 | $0 |
| High School Diploma | $40,972 | $11,264 |
| College or Associate's Degree | $34,572 | $43,868 |
| Bachelor's Degree | $42,273 | $45,000 |
| Graduate Degree | $68,812 | $0 |
| Total | $44,338 | $29,559 |
Family Income in Mayfield
Family Income Brackets in Mayfield
According to the Mayfield family income data, there are 424 families falling into the $75,000 to $99,999 income range, which is the most common income bracket and makes up 18.1% of all families. Conversely, the $10,000 to $14,999 income bracket is the least frequent group with only 56 families (2.4%) belonging to this category.
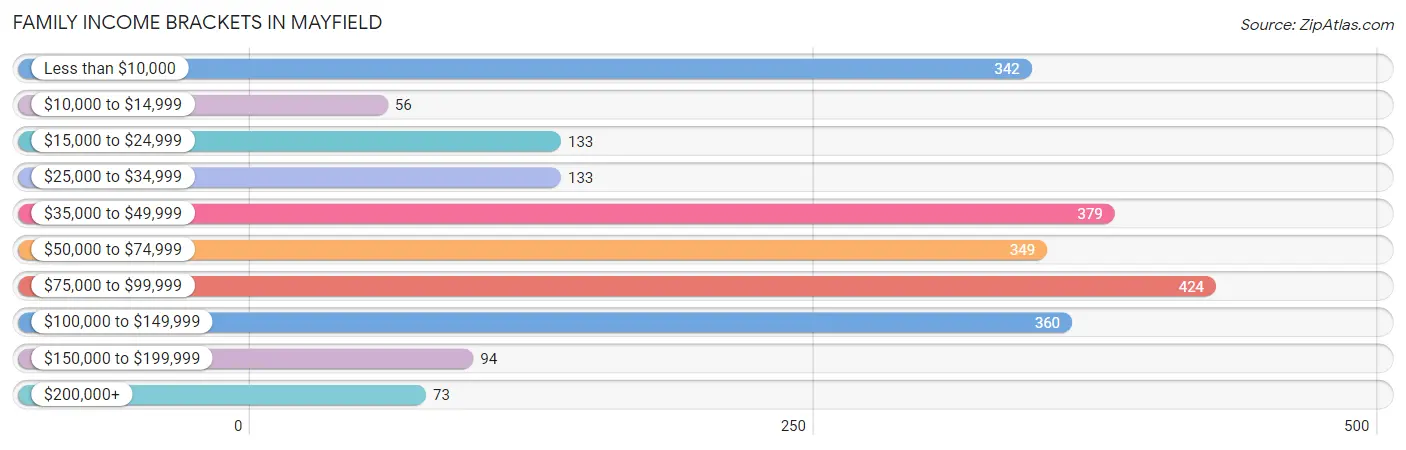
| Income Bracket | # Families | % Families |
| Less than $10,000 | 342 | 14.6% |
| $10,000 to $14,999 | 56 | 2.4% |
| $15,000 to $24,999 | 133 | 5.7% |
| $25,000 to $34,999 | 133 | 5.7% |
| $35,000 to $49,999 | 379 | 16.2% |
| $50,000 to $74,999 | 349 | 14.9% |
| $75,000 to $99,999 | 424 | 18.1% |
| $100,000 to $149,999 | 360 | 15.4% |
| $150,000 to $199,999 | 94 | 4.0% |
| $200,000+ | 73 | 3.1% |
Family Income by Famaliy Size in Mayfield
4-person families (395 | 16.9%) account for the highest median family income in Mayfield with $90,766 per family, while 2-person families (1,153 | 49.3%) have the highest median income of $24,850 per family member.
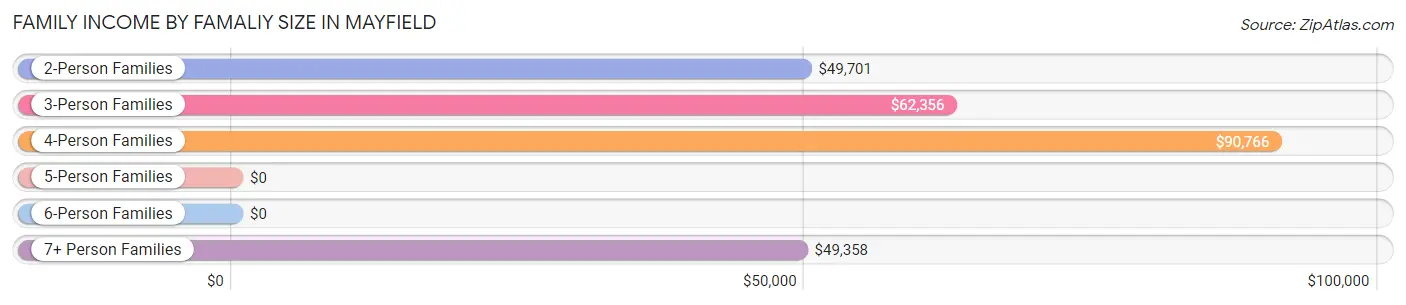
| Income Bracket | # Families | Median Income |
| 2-Person Families | 1,153 (49.3%) | $49,701 |
| 3-Person Families | 556 (23.8%) | $62,356 |
| 4-Person Families | 395 (16.9%) | $90,766 |
| 5-Person Families | 169 (7.2%) | $0 |
| 6-Person Families | 12 (0.5%) | $0 |
| 7+ Person Families | 55 (2.4%) | $49,358 |
| Total | 2,340 (100.0%) | $57,260 |
Family Income by Number of Earners in Mayfield
The median family income in Mayfield is $57,260, with families comprising 3+ earners (73) having the highest median family income of $143,555, while families with no earners (429) have the lowest median family income of $23,299, accounting for 3.1% and 18.3% of families, respectively.
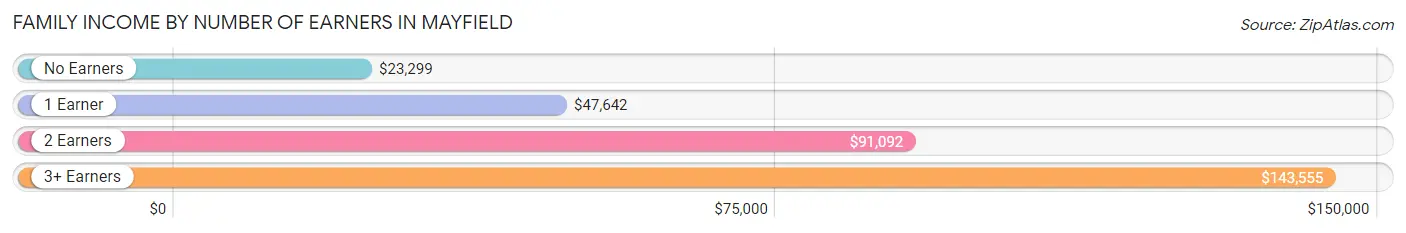
| Number of Earners | # Families | Median Income |
| No Earners | 429 (18.3%) | $23,299 |
| 1 Earner | 832 (35.6%) | $47,642 |
| 2 Earners | 1,006 (43.0%) | $91,092 |
| 3+ Earners | 73 (3.1%) | $143,555 |
| Total | 2,340 (100.0%) | $57,260 |
Household Income in Mayfield
Household Income Brackets in Mayfield
With 655 households falling in the category, the less than $10,000 income range is the most frequent in Mayfield, accounting for 15.7% of all households. In contrast, only 96 households (2.3%) fall into the $150,000 to $199,999 income bracket, making it the least populous group.
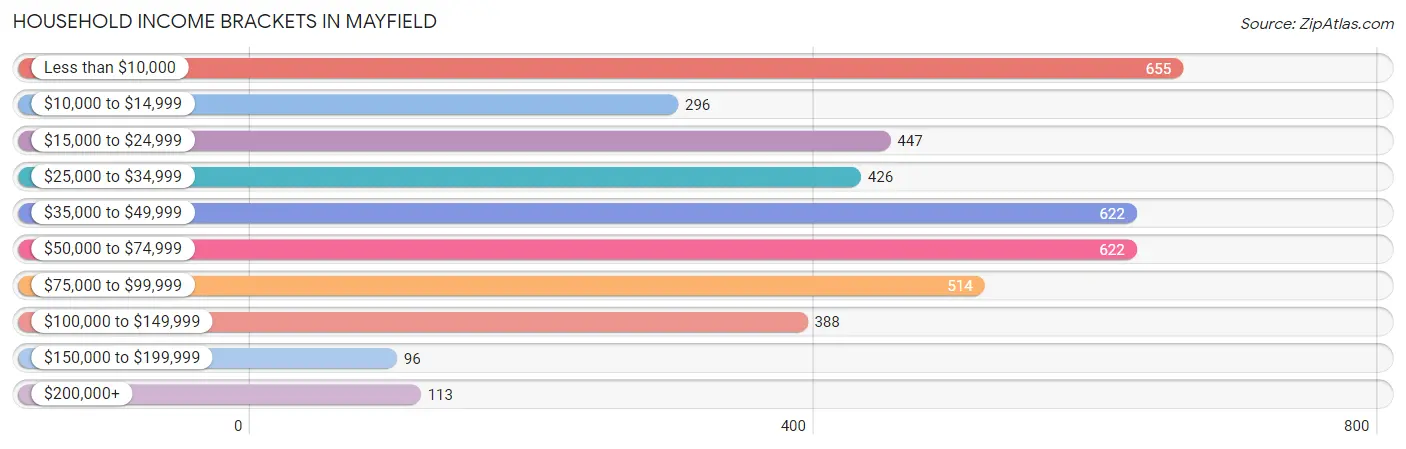
| Income Bracket | # Households | % Households |
| Less than $10,000 | 655 | 15.7% |
| $10,000 to $14,999 | 296 | 7.1% |
| $15,000 to $24,999 | 447 | 10.7% |
| $25,000 to $34,999 | 426 | 10.2% |
| $35,000 to $49,999 | 622 | 14.9% |
| $50,000 to $74,999 | 622 | 14.9% |
| $75,000 to $99,999 | 514 | 12.3% |
| $100,000 to $149,999 | 388 | 9.3% |
| $150,000 to $199,999 | 96 | 2.3% |
| $200,000+ | 113 | 2.7% |
Household Income by Householder Age in Mayfield
The median household income in Mayfield is $42,589, with the highest median household income of $60,813 found in the 25 to 44 years age bracket for the primary householder. A total of 1,237 households (29.6%) fall into this category. Meanwhile, the 45 to 64 years age bracket for the primary householder has the lowest median household income of $27,656, with 1,579 households (37.8%) in this group.
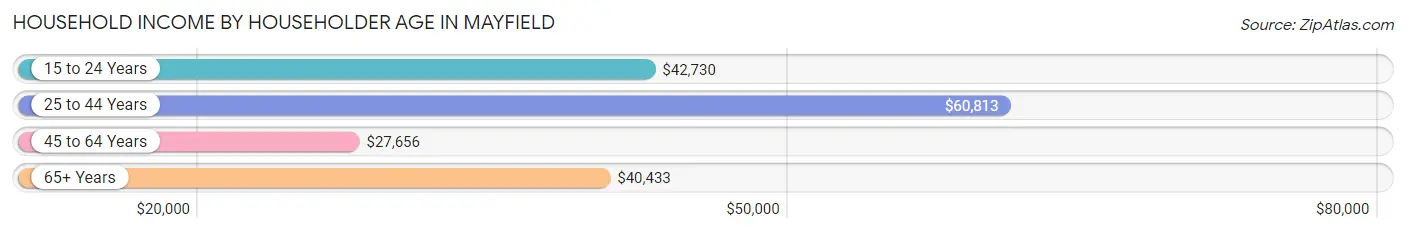
| Income Bracket | # Households | Median Income |
| 15 to 24 Years | 275 (6.6%) | $42,730 |
| 25 to 44 Years | 1,237 (29.6%) | $60,813 |
| 45 to 64 Years | 1,579 (37.8%) | $27,656 |
| 65+ Years | 1,084 (26.0%) | $40,433 |
| Total | 4,175 (100.0%) | $42,589 |
Poverty in Mayfield
Income Below Poverty by Sex and Age in Mayfield
With 26.9% poverty level for males and 38.2% for females among the residents of Mayfield, 15 year old males and 15 year old females are the most vulnerable to poverty, with 21 males (100.0%) and 21 females (100.0%) in their respective age groups living below the poverty level.
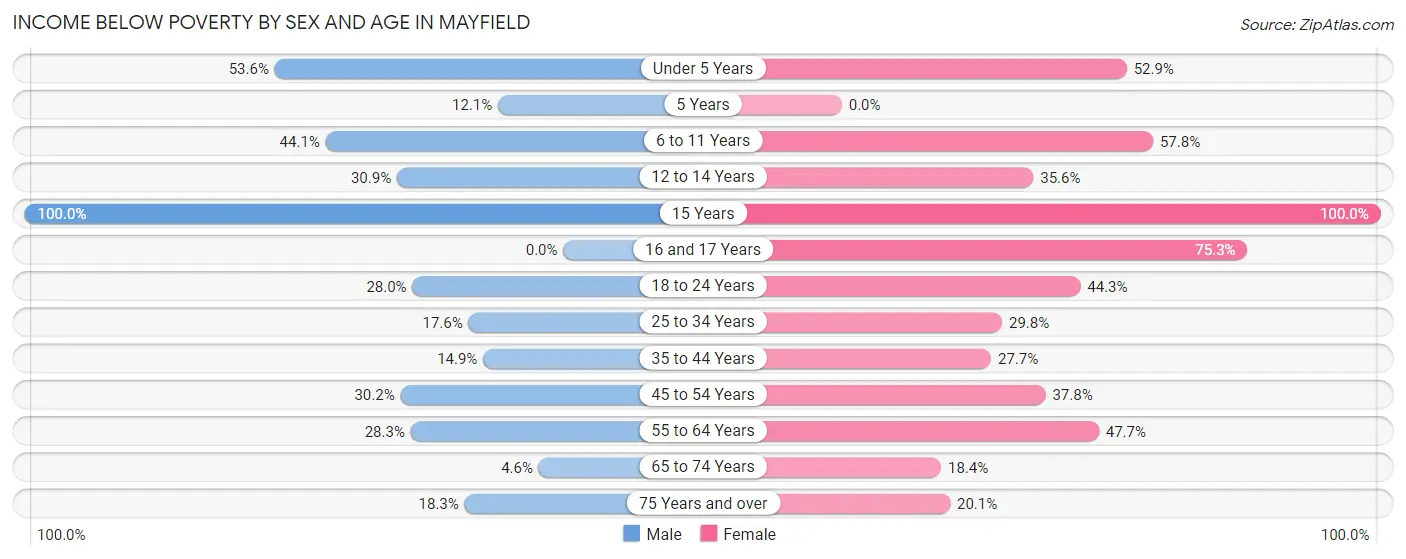
| Age Bracket | Male | Female |
| Under 5 Years | 255 (53.6%) | 193 (52.9%) |
| 5 Years | 4 (12.1%) | 0 (0.0%) |
| 6 to 11 Years | 195 (44.1%) | 294 (57.8%) |
| 12 to 14 Years | 88 (30.9%) | 107 (35.5%) |
| 15 Years | 21 (100.0%) | 21 (100.0%) |
| 16 and 17 Years | 0 (0.0%) | 67 (75.3%) |
| 18 to 24 Years | 121 (28.0%) | 166 (44.3%) |
| 25 to 34 Years | 121 (17.6%) | 188 (29.7%) |
| 35 to 44 Years | 82 (14.9%) | 169 (27.7%) |
| 45 to 54 Years | 107 (30.2%) | 121 (37.8%) |
| 55 to 64 Years | 215 (28.3%) | 415 (47.7%) |
| 65 to 74 Years | 16 (4.5%) | 84 (18.4%) |
| 75 Years and over | 53 (18.3%) | 90 (20.1%) |
| Total | 1,278 (26.9%) | 1,915 (38.2%) |
Income Above Poverty by Sex and Age in Mayfield
According to the poverty statistics in Mayfield, males aged 16 and 17 years and females aged 5 years are the age groups that are most secure financially, with 100.0% of males and 100.0% of females in these age groups living above the poverty line.
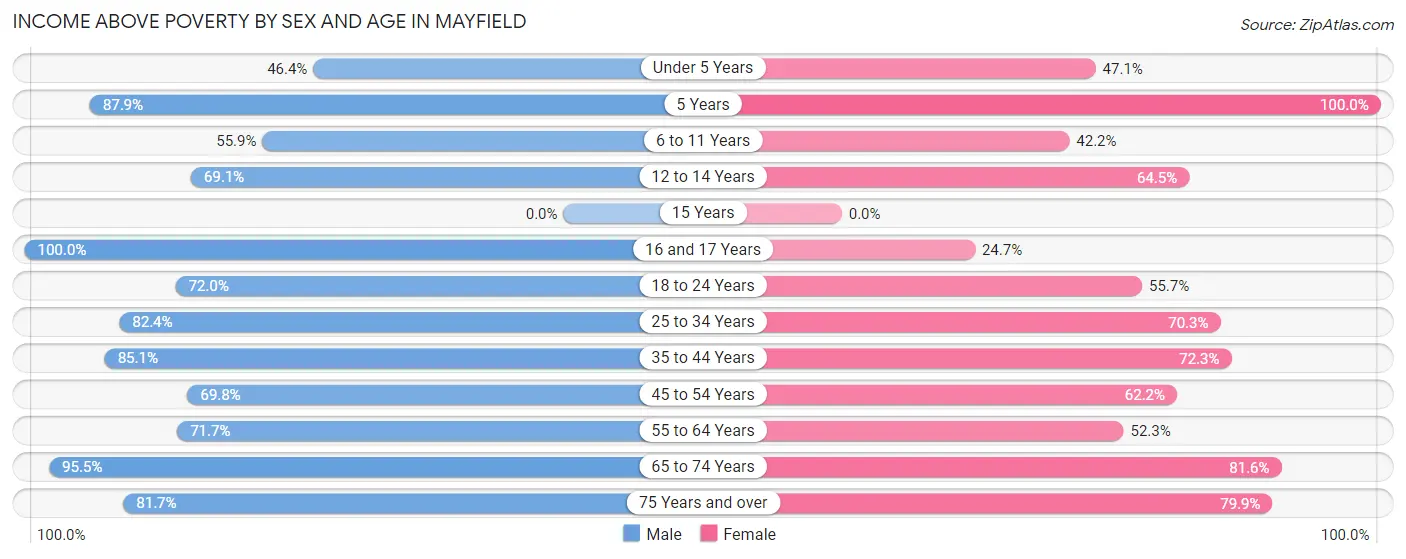
| Age Bracket | Male | Female |
| Under 5 Years | 221 (46.4%) | 172 (47.1%) |
| 5 Years | 29 (87.9%) | 21 (100.0%) |
| 6 to 11 Years | 247 (55.9%) | 215 (42.2%) |
| 12 to 14 Years | 197 (69.1%) | 194 (64.4%) |
| 15 Years | 0 (0.0%) | 0 (0.0%) |
| 16 and 17 Years | 68 (100.0%) | 22 (24.7%) |
| 18 to 24 Years | 311 (72.0%) | 209 (55.7%) |
| 25 to 34 Years | 567 (82.4%) | 444 (70.3%) |
| 35 to 44 Years | 469 (85.1%) | 441 (72.3%) |
| 45 to 54 Years | 247 (69.8%) | 199 (62.2%) |
| 55 to 64 Years | 544 (71.7%) | 455 (52.3%) |
| 65 to 74 Years | 336 (95.5%) | 372 (81.6%) |
| 75 Years and over | 236 (81.7%) | 358 (79.9%) |
| Total | 3,472 (73.1%) | 3,102 (61.8%) |
Income Below Poverty Among Married-Couple Families in Mayfield
The poverty statistics for married-couple families in Mayfield show that 17.0% or 303 of the total 1,780 families live below the poverty line. Families with 5 or more children have the highest poverty rate of 81.8%, comprising of 45 families. On the other hand, families with 1 or 2 children have the lowest poverty rate of 6.8%, which includes 40 families.
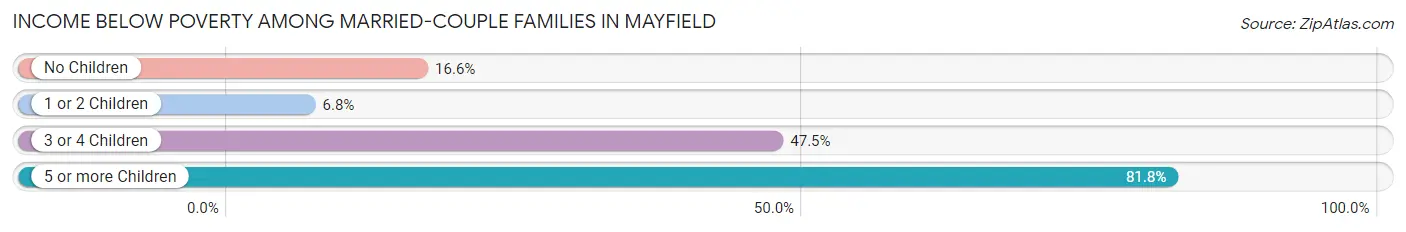
| Children | Above Poverty | Below Poverty |
| No Children | 862 (83.5%) | 171 (16.6%) |
| 1 or 2 Children | 553 (93.2%) | 40 (6.8%) |
| 3 or 4 Children | 52 (52.5%) | 47 (47.5%) |
| 5 or more Children | 10 (18.2%) | 45 (81.8%) |
| Total | 1,477 (83.0%) | 303 (17.0%) |
Income Below Poverty Among Single-Parent Households in Mayfield
According to the poverty data in Mayfield, 20.9% or 24 single-father households and 54.4% or 242 single-mother households are living below the poverty line. Among single-father households, those with 3 or 4 children have the highest poverty rate, with 11 households (100.0%) experiencing poverty. Likewise, among single-mother households, those with 3 or 4 children have the highest poverty rate, with 73 households (92.4%) falling below the poverty line.
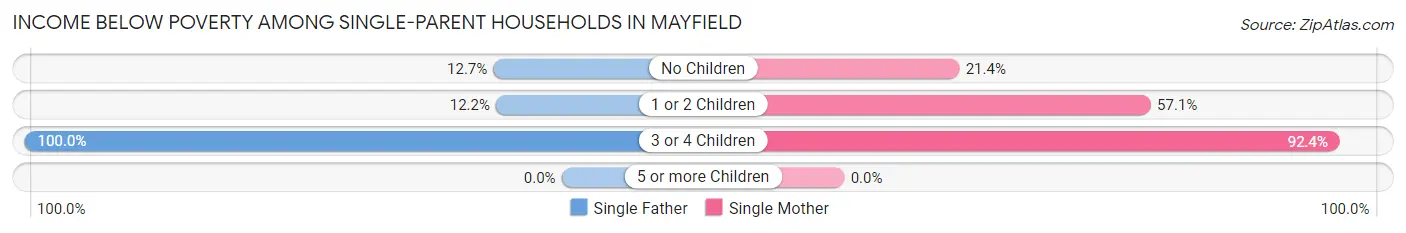
| Children | Single Father | Single Mother |
| No Children | 7 (12.7%) | 24 (21.4%) |
| 1 or 2 Children | 6 (12.2%) | 145 (57.1%) |
| 3 or 4 Children | 11 (100.0%) | 73 (92.4%) |
| 5 or more Children | 0 (0.0%) | 0 (0.0%) |
| Total | 24 (20.9%) | 242 (54.4%) |
Income Below Poverty Among Married-Couple vs Single-Parent Households in Mayfield
The poverty data for Mayfield shows that 303 of the married-couple family households (17.0%) and 266 of the single-parent households (47.5%) are living below the poverty level. Within the married-couple family households, those with 5 or more children have the highest poverty rate, with 45 households (81.8%) falling below the poverty line. Among the single-parent households, those with 3 or 4 children have the highest poverty rate, with 84 household (93.3%) living below poverty.
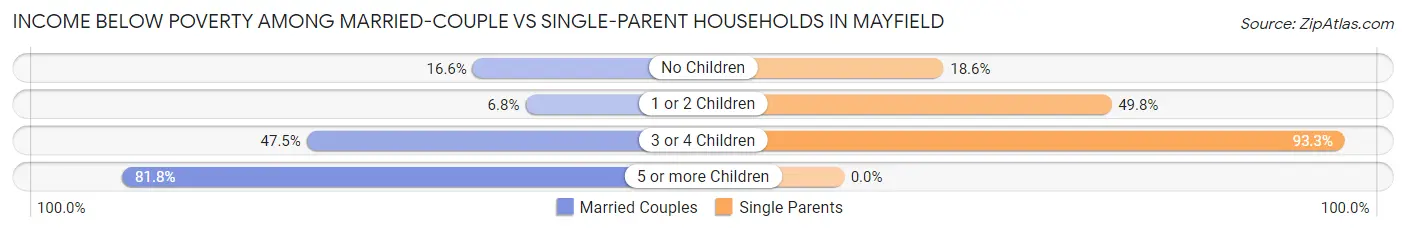
| Children | Married-Couple Families | Single-Parent Households |
| No Children | 171 (16.6%) | 31 (18.6%) |
| 1 or 2 Children | 40 (6.8%) | 151 (49.8%) |
| 3 or 4 Children | 47 (47.5%) | 84 (93.3%) |
| 5 or more Children | 45 (81.8%) | 0 (0.0%) |
| Total | 303 (17.0%) | 266 (47.5%) |
Race in Mayfield
The most populous races in Mayfield are White / Caucasian (6,985 | 69.8%), Hispanic or Latino (1,332 | 13.3%), and Black / African American (1,220 | 12.2%).
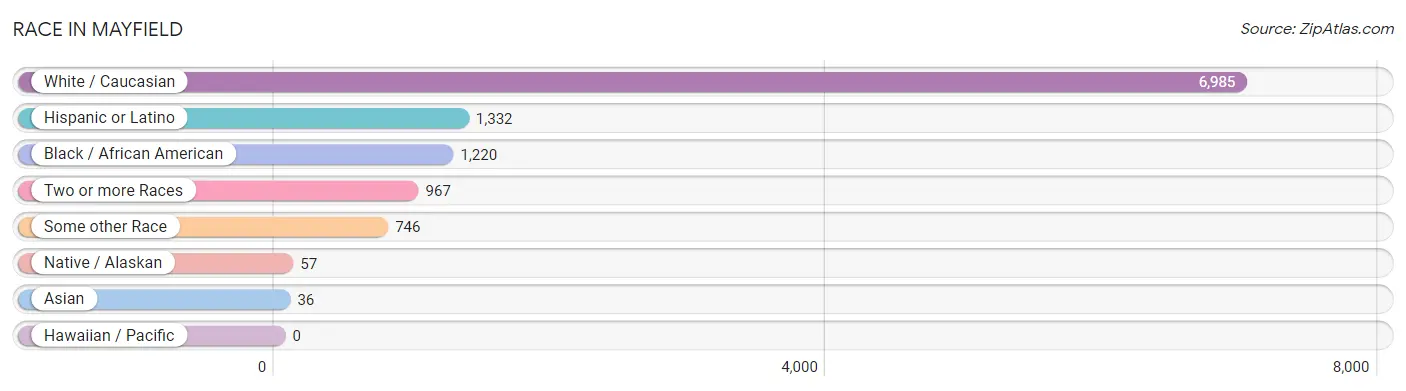
| Race | # Population | % Population |
| Asian | 36 | 0.4% |
| Black / African American | 1,220 | 12.2% |
| Hawaiian / Pacific | 0 | 0.0% |
| Hispanic or Latino | 1,332 | 13.3% |
| Native / Alaskan | 57 | 0.6% |
| White / Caucasian | 6,985 | 69.8% |
| Two or more Races | 967 | 9.7% |
| Some other Race | 746 | 7.4% |
| Total | 10,011 | 100.0% |
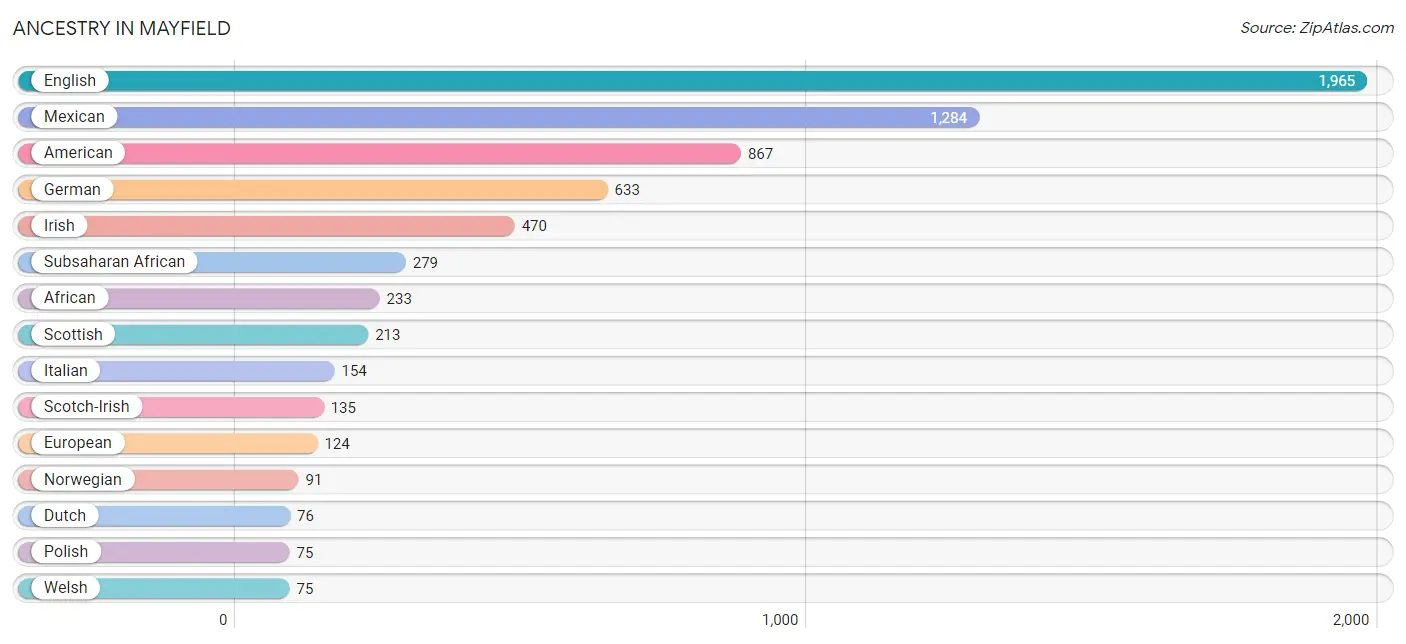
Ancestry in Mayfield
The most populous ancestries reported in Mayfield are English (1,965 | 19.6%), Mexican (1,284 | 12.8%), American (867 | 8.7%), German (633 | 6.3%), and Irish (470 | 4.7%), together accounting for 52.1% of all Mayfield residents.
| Ancestry | # Population | % Population |
| African | 233 | 2.3% |
| American | 867 | 8.7% |
| Apache | 29 | 0.3% |
| Arab | 47 | 0.5% |
| British | 25 | 0.3% |
| British West Indian | 46 | 0.5% |
| Canadian | 8 | 0.1% |
| Central American | 19 | 0.2% |
| Cherokee | 6 | 0.1% |
| Czech | 16 | 0.2% |
| Dutch | 76 | 0.8% |
| English | 1,965 | 19.6% |
| European | 124 | 1.2% |
| Finnish | 29 | 0.3% |
| French | 36 | 0.4% |
| French Canadian | 17 | 0.2% |
| German | 633 | 6.3% |
| Honduran | 19 | 0.2% |
| Irish | 470 | 4.7% |
| Italian | 154 | 1.5% |
| Korean | 67 | 0.7% |
| Lebanese | 47 | 0.5% |
| Mexican | 1,284 | 12.8% |
| Mexican American Indian | 57 | 0.6% |
| Nigerian | 46 | 0.5% |
| Norwegian | 91 | 0.9% |
| Polish | 75 | 0.7% |
| Russian | 8 | 0.1% |
| Scandinavian | 17 | 0.2% |
| Scotch-Irish | 135 | 1.3% |
| Scottish | 213 | 2.1% |
| Subsaharan African | 279 | 2.8% |
| Welsh | 75 | 0.7% | View All 33 Rows |
Immigrants in Mayfield
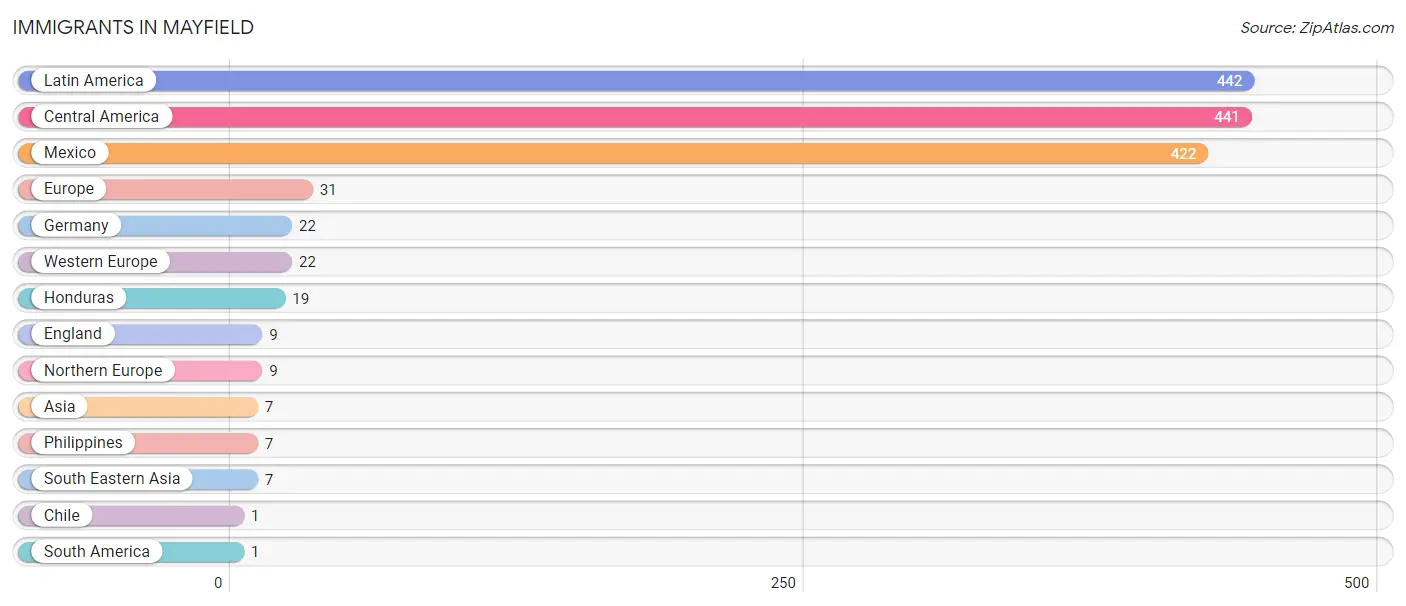
The most numerous immigrant groups reported in Mayfield came from Latin America (442 | 4.4%), Central America (441 | 4.4%), Mexico (422 | 4.2%), Europe (31 | 0.3%), and Germany (22 | 0.2%), together accounting for 13.6% of all Mayfield residents.
| Immigration Origin | # Population | % Population |
| Asia | 7 | 0.1% |
| Central America | 441 | 4.4% |
| Chile | 1 | 0.0% |
| England | 9 | 0.1% |
| Europe | 31 | 0.3% |
| Germany | 22 | 0.2% |
| Honduras | 19 | 0.2% |
| Latin America | 442 | 4.4% |
| Mexico | 422 | 4.2% |
| Northern Europe | 9 | 0.1% |
| Philippines | 7 | 0.1% |
| South America | 1 | 0.0% |
| South Eastern Asia | 7 | 0.1% |
| Western Europe | 22 | 0.2% | View All 14 Rows |
Sex and Age in Mayfield
Sex and Age in Mayfield
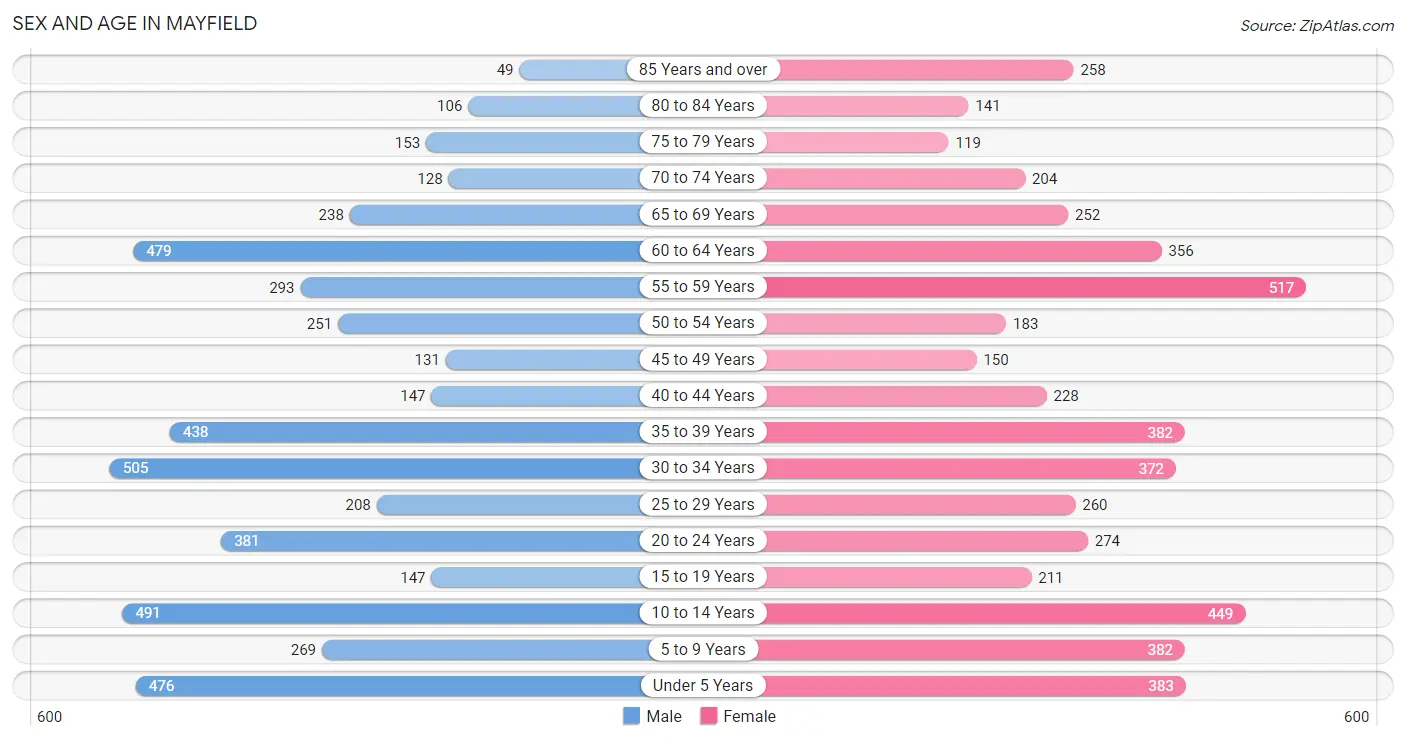
The most populous age groups in Mayfield are 30 to 34 Years (505 | 10.3%) for men and 55 to 59 Years (517 | 10.1%) for women.
| Age Bracket | Male | Female |
| Under 5 Years | 476 (9.7%) | 383 (7.5%) |
| 5 to 9 Years | 269 (5.5%) | 382 (7.5%) |
| 10 to 14 Years | 491 (10.0%) | 449 (8.8%) |
| 15 to 19 Years | 147 (3.0%) | 211 (4.1%) |
| 20 to 24 Years | 381 (7.8%) | 274 (5.3%) |
| 25 to 29 Years | 208 (4.3%) | 260 (5.1%) |
| 30 to 34 Years | 505 (10.3%) | 372 (7.3%) |
| 35 to 39 Years | 438 (9.0%) | 382 (7.5%) |
| 40 to 44 Years | 147 (3.0%) | 228 (4.4%) |
| 45 to 49 Years | 131 (2.7%) | 150 (2.9%) |
| 50 to 54 Years | 251 (5.1%) | 183 (3.6%) |
| 55 to 59 Years | 293 (6.0%) | 517 (10.1%) |
| 60 to 64 Years | 479 (9.8%) | 356 (7.0%) |
| 65 to 69 Years | 238 (4.9%) | 252 (4.9%) |
| 70 to 74 Years | 128 (2.6%) | 204 (4.0%) |
| 75 to 79 Years | 153 (3.1%) | 119 (2.3%) |
| 80 to 84 Years | 106 (2.2%) | 141 (2.8%) |
| 85 Years and over | 49 (1.0%) | 258 (5.0%) |
| Total | 4,890 (100.0%) | 5,121 (100.0%) |
Families and Households in Mayfield
Median Family Size in Mayfield
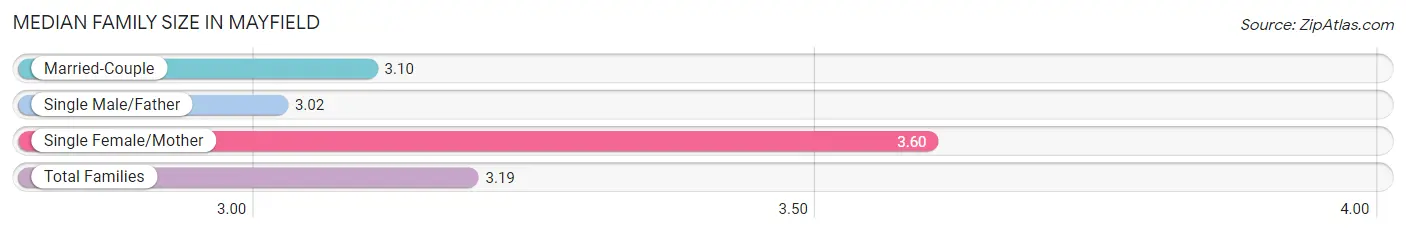
The median family size in Mayfield is 3.19 persons per family, with single female/mother families (445 | 19.0%) accounting for the largest median family size of 3.6 persons per family. On the other hand, single male/father families (115 | 4.9%) represent the smallest median family size with 3.02 persons per family.
| Family Type | # Families | Family Size |
| Married-Couple | 1,780 (76.1%) | 3.10 |
| Single Male/Father | 115 (4.9%) | 3.02 |
| Single Female/Mother | 445 (19.0%) | 3.60 |
| Total Families | 2,340 (100.0%) | 3.19 |
Median Household Size in Mayfield
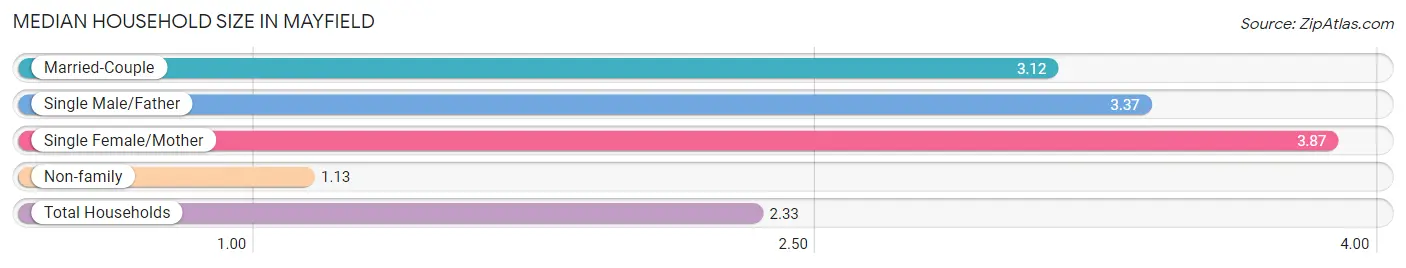
The median household size in Mayfield is 2.33 persons per household, with single female/mother households (445 | 10.7%) accounting for the largest median household size of 3.87 persons per household. non-family households (1,835 | 44.0%) represent the smallest median household size with 1.13 persons per household.
| Household Type | # Households | Household Size |
| Married-Couple | 1,780 (42.6%) | 3.12 |
| Single Male/Father | 115 (2.8%) | 3.37 |
| Single Female/Mother | 445 (10.7%) | 3.87 |
| Non-family | 1,835 (44.0%) | 1.13 |
| Total Households | 4,175 (100.0%) | 2.33 |
Household Size by Marriage Status in Mayfield
Out of a total of 4,175 households in Mayfield, 2,340 (56.0%) are family households, while 1,835 (44.0%) are nonfamily households. The most numerous type of family households are 2-person households, comprising 1,134, and the most common type of nonfamily households are 1-person households, comprising 1,529.
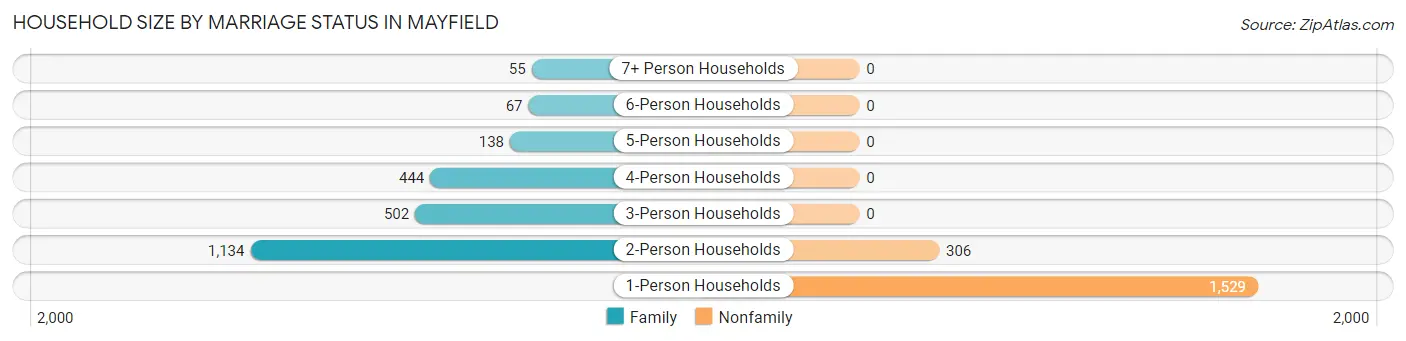
| Household Size | Family Households | Nonfamily Households |
| 1-Person Households | - | 1,529 (36.6%) |
| 2-Person Households | 1,134 (27.2%) | 306 (7.3%) |
| 3-Person Households | 502 (12.0%) | 0 (0.0%) |
| 4-Person Households | 444 (10.6%) | 0 (0.0%) |
| 5-Person Households | 138 (3.3%) | 0 (0.0%) |
| 6-Person Households | 67 (1.6%) | 0 (0.0%) |
| 7+ Person Households | 55 (1.3%) | 0 (0.0%) |
| Total | 2,340 (56.0%) | 1,835 (44.0%) |
Female Fertility in Mayfield
Fertility by Age in Mayfield
Average fertility rate in Mayfield is 125.0 births per 1,000 women. Women in the age bracket of 35 to 50 years have the highest fertility rate with 156.0 births per 1,000 women. Women in the age bracket of 35 to 50 years acount for 51.9% of all women with births.
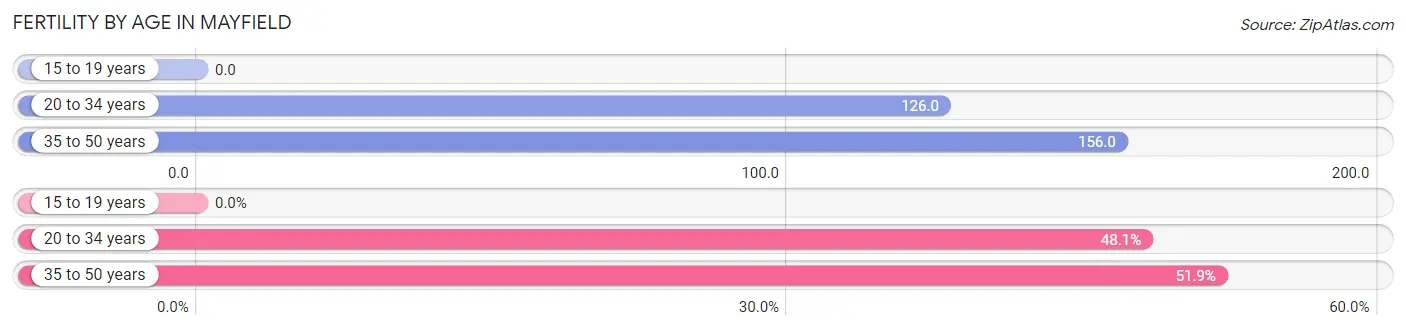
| Age Bracket | Women with Births | Births / 1,000 Women |
| 15 to 19 years | 0 (0.0%) | 0.0 |
| 20 to 34 years | 114 (48.1%) | 126.0 |
| 35 to 50 years | 123 (51.9%) | 156.0 |
| Total | 237 (100.0%) | 125.0 |
Fertility by Age by Marriage Status in Mayfield
45.1% of women with births (237) in Mayfield are married. The highest percentage of unmarried women with births falls into 35 to 50 years age bracket with 61.8% of them unmarried at the time of birth, while the lowest percentage of unmarried women with births belong to 20 to 34 years age bracket with 47.4% of them unmarried.
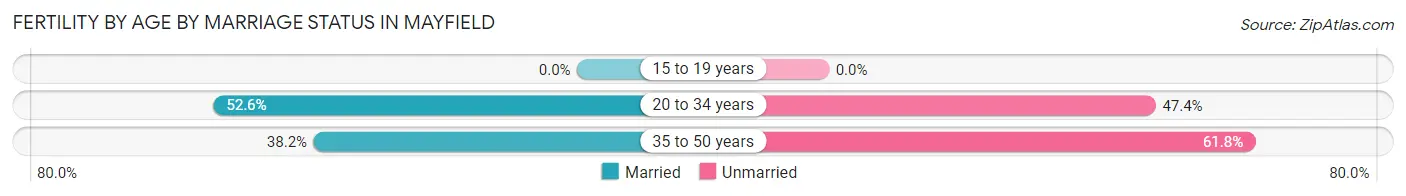
| Age Bracket | Married | Unmarried |
| 15 to 19 years | 0 (0.0%) | 0 (0.0%) |
| 20 to 34 years | 60 (52.6%) | 54 (47.4%) |
| 35 to 50 years | 47 (38.2%) | 76 (61.8%) |
| Total | 107 (45.2%) | 130 (54.8%) |
Fertility by Education in Mayfield
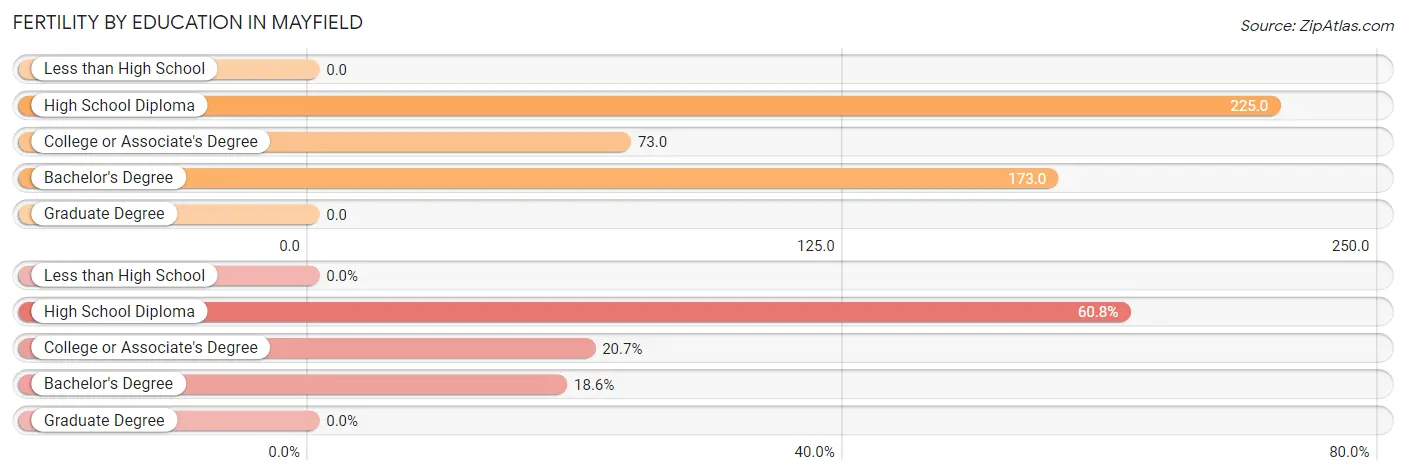
| Educational Attainment | Women with Births | Births / 1,000 Women |
| Less than High School | 0 (0.0%) | 0.0 |
| High School Diploma | 144 (60.8%) | 225.0 |
| College or Associate's Degree | 49 (20.7%) | 73.0 |
| Bachelor's Degree | 44 (18.6%) | 173.0 |
| Graduate Degree | 0 (0.0%) | 0.0 |
| Total | 237 (100.0%) | 125.0 |
Fertility by Education by Marriage Status in Mayfield
54.8% of women with births in Mayfield are unmarried. Women with the educational attainment of high school diploma are most likely to be married with 66.7% of them married at childbirth, while women with the educational attainment of bachelor's degree are least likely to be married with 100.0% of them unmarried at childbirth.
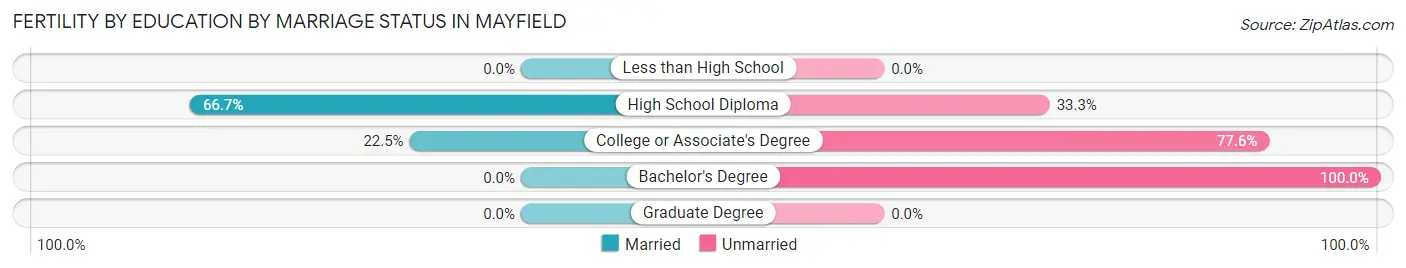
| Educational Attainment | Married | Unmarried |
| Less than High School | 0 (0.0%) | 0 (0.0%) |
| High School Diploma | 96 (66.7%) | 48 (33.3%) |
| College or Associate's Degree | 11 (22.5%) | 38 (77.5%) |
| Bachelor's Degree | 0 (0.0%) | 44 (100.0%) |
| Graduate Degree | 0 (0.0%) | 0 (0.0%) |
| Total | 107 (45.2%) | 130 (54.8%) |
Employment Characteristics in Mayfield
Employment by Class of Employer in Mayfield
Among the 3,748 employed individuals in Mayfield, private company employees (2,502 | 66.8%), not-for-profit organizations (406 | 10.8%), and state government employees (287 | 7.7%) make up the most common classes of employment.
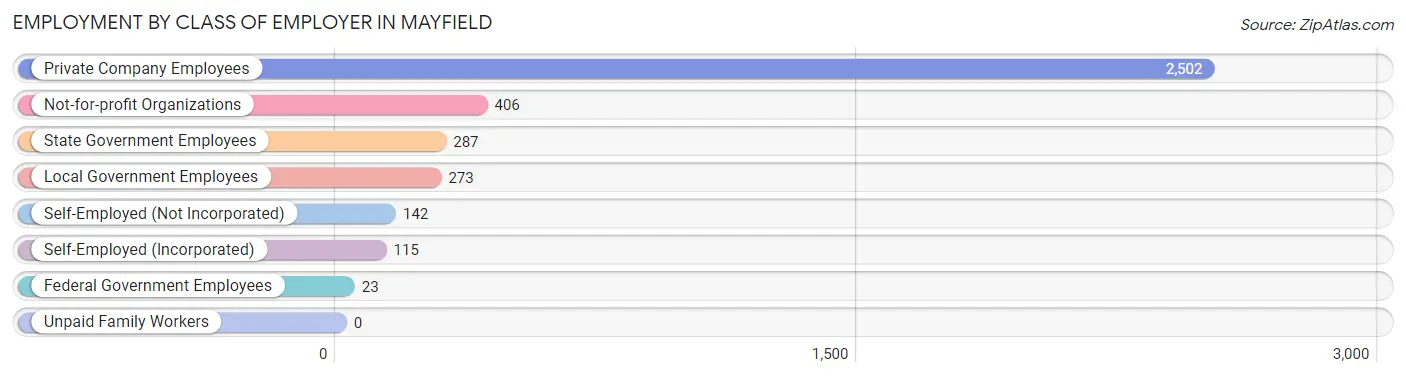
| Employer Class | # Employees | % Employees |
| Private Company Employees | 2,502 | 66.8% |
| Self-Employed (Incorporated) | 115 | 3.1% |
| Self-Employed (Not Incorporated) | 142 | 3.8% |
| Not-for-profit Organizations | 406 | 10.8% |
| Local Government Employees | 273 | 7.3% |
| State Government Employees | 287 | 7.7% |
| Federal Government Employees | 23 | 0.6% |
| Unpaid Family Workers | 0 | 0.0% |
| Total | 3,748 | 100.0% |
Employment Status by Age in Mayfield
According to the labor force statistics for Mayfield, out of the total population over 16 years of age (7,519), 55.1% or 4,143 individuals are in the labor force, with 5.3% or 220 of them unemployed. The age group with the highest labor force participation rate is 30 to 34 years, with 84.8% or 744 individuals in the labor force. Within the labor force, the 16 to 19 years age range has the highest percentage of unemployed individuals, with 14.0% or 24 of them being unemployed.
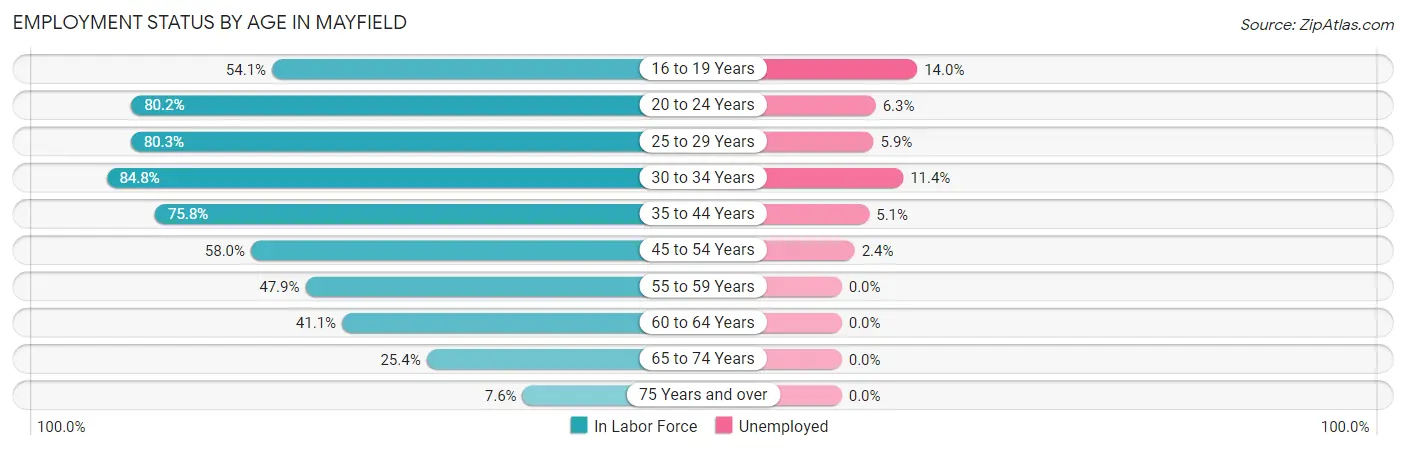
| Age Bracket | In Labor Force | Unemployed |
| 16 to 19 Years | 171 (54.1%) | 24 (14.0%) |
| 20 to 24 Years | 525 (80.2%) | 33 (6.3%) |
| 25 to 29 Years | 376 (80.3%) | 22 (5.9%) |
| 30 to 34 Years | 744 (84.8%) | 85 (11.4%) |
| 35 to 44 Years | 906 (75.8%) | 46 (5.1%) |
| 45 to 54 Years | 415 (58.0%) | 10 (2.4%) |
| 55 to 59 Years | 388 (47.9%) | 0 (0.0%) |
| 60 to 64 Years | 343 (41.1%) | 0 (0.0%) |
| 65 to 74 Years | 209 (25.4%) | 0 (0.0%) |
| 75 Years and over | 63 (7.6%) | 0 (0.0%) |
| Total | 4,143 (55.1%) | 220 (5.3%) |
Employment Status by Educational Attainment in Mayfield
According to labor force statistics for Mayfield, 64.7% of individuals (3,170) out of the total population between 25 and 64 years of age (4,900) are in the labor force, with 5.1% or 162 of them being unemployed. The group with the highest labor force participation rate are those with the educational attainment of bachelor's degree or higher, with 89.1% or 909 individuals in the labor force. Within the labor force, individuals with less than high school education have the highest percentage of unemployment, with 15.2% or 39 of them being unemployed.
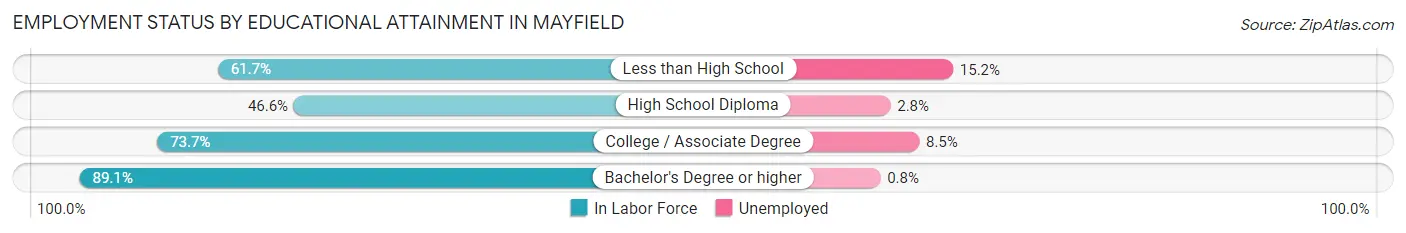
| Educational Attainment | In Labor Force | Unemployed |
| Less than High School | 256 (61.7%) | 63 (15.2%) |
| High School Diploma | 939 (46.6%) | 56 (2.8%) |
| College / Associate Degree | 1,069 (73.7%) | 123 (8.5%) |
| Bachelor's Degree or higher | 909 (89.1%) | 8 (0.8%) |
| Total | 3,170 (64.7%) | 250 (5.1%) |
Employment Occupations by Sex in Mayfield
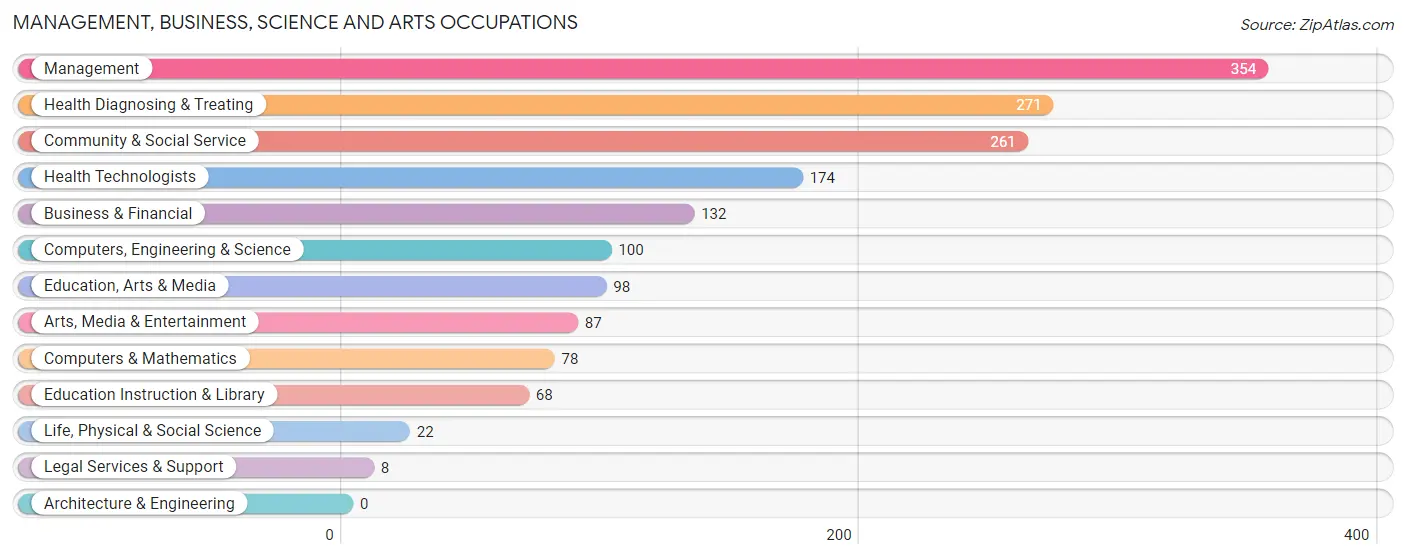
Management, Business, Science and Arts Occupations
The most common Management, Business, Science and Arts occupations in Mayfield are Management (354 | 9.0%), Health Diagnosing & Treating (271 | 6.9%), Community & Social Service (261 | 6.7%), Health Technologists (174 | 4.4%), and Business & Financial (132 | 3.4%).
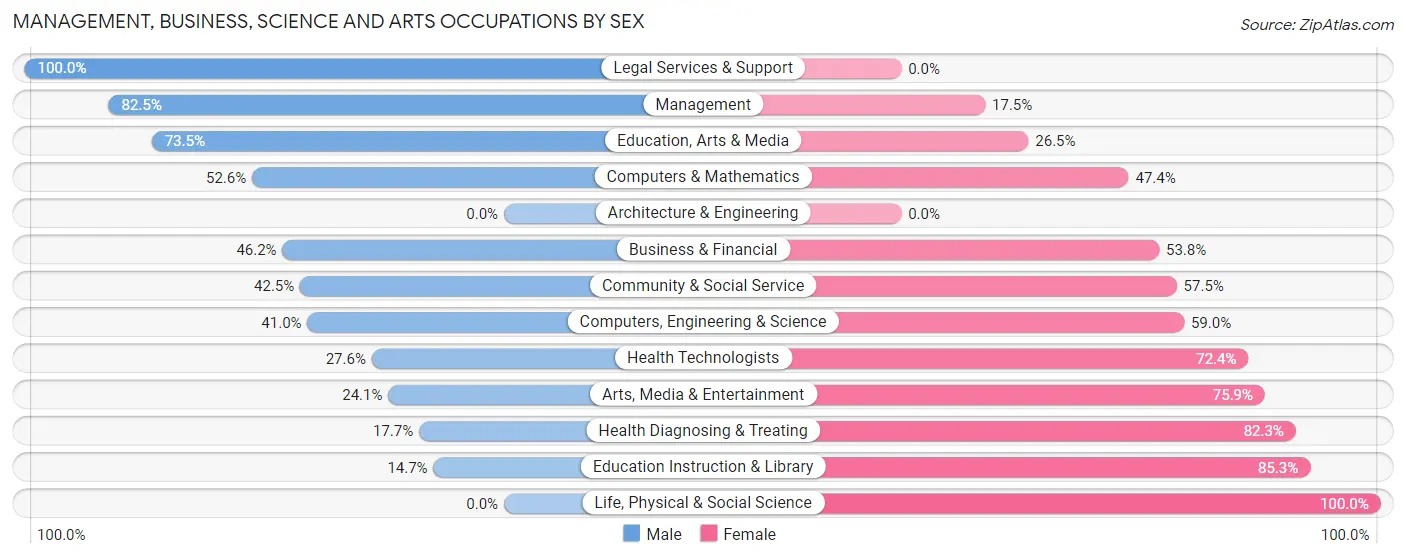
Management, Business, Science and Arts Occupations by Sex
Within the Management, Business, Science and Arts occupations in Mayfield, the most male-oriented occupations are Legal Services & Support (100.0%), Management (82.5%), and Education, Arts & Media (73.5%), while the most female-oriented occupations are Life, Physical & Social Science (100.0%), Education Instruction & Library (85.3%), and Health Diagnosing & Treating (82.3%).
| Occupation | Male | Female |
| Management | 292 (82.5%) | 62 (17.5%) |
| Business & Financial | 61 (46.2%) | 71 (53.8%) |
| Computers, Engineering & Science | 41 (41.0%) | 59 (59.0%) |
| Computers & Mathematics | 41 (52.6%) | 37 (47.4%) |
| Architecture & Engineering | 0 (0.0%) | 0 (0.0%) |
| Life, Physical & Social Science | 0 (0.0%) | 22 (100.0%) |
| Community & Social Service | 111 (42.5%) | 150 (57.5%) |
| Education, Arts & Media | 72 (73.5%) | 26 (26.5%) |
| Legal Services & Support | 8 (100.0%) | 0 (0.0%) |
| Education Instruction & Library | 10 (14.7%) | 58 (85.3%) |
| Arts, Media & Entertainment | 21 (24.1%) | 66 (75.9%) |
| Health Diagnosing & Treating | 48 (17.7%) | 223 (82.3%) |
| Health Technologists | 48 (27.6%) | 126 (72.4%) |
| Total (Category) | 553 (49.5%) | 565 (50.5%) |
| Total (Overall) | 2,165 (55.2%) | 1,755 (44.8%) |
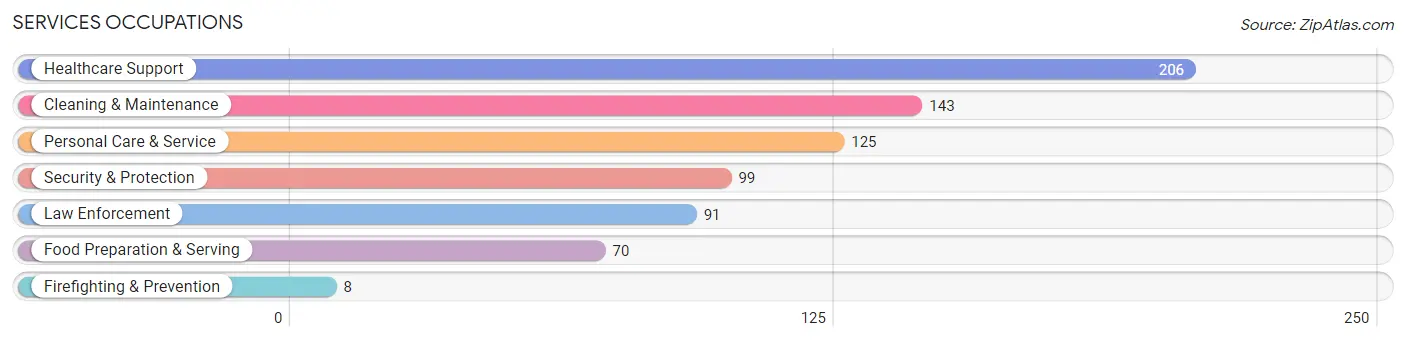
Services Occupations
The most common Services occupations in Mayfield are Healthcare Support (206 | 5.3%), Cleaning & Maintenance (143 | 3.6%), Personal Care & Service (125 | 3.2%), Security & Protection (99 | 2.5%), and Law Enforcement (91 | 2.3%).
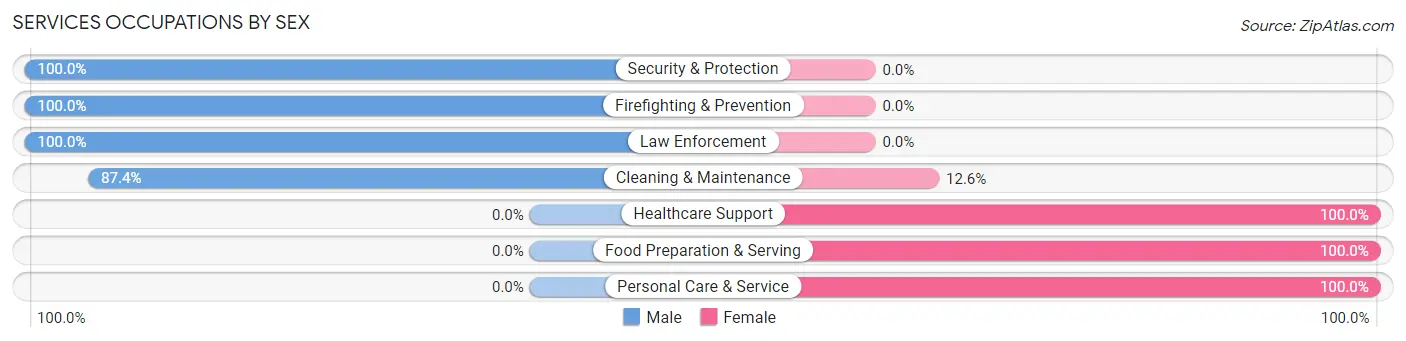
Services Occupations by Sex
Within the Services occupations in Mayfield, the most male-oriented occupations are Security & Protection (100.0%), Firefighting & Prevention (100.0%), and Law Enforcement (100.0%), while the most female-oriented occupations are Healthcare Support (100.0%), Food Preparation & Serving (100.0%), and Personal Care & Service (100.0%).
| Occupation | Male | Female |
| Healthcare Support | 0 (0.0%) | 206 (100.0%) |
| Security & Protection | 99 (100.0%) | 0 (0.0%) |
| Firefighting & Prevention | 8 (100.0%) | 0 (0.0%) |
| Law Enforcement | 91 (100.0%) | 0 (0.0%) |
| Food Preparation & Serving | 0 (0.0%) | 70 (100.0%) |
| Cleaning & Maintenance | 125 (87.4%) | 18 (12.6%) |
| Personal Care & Service | 0 (0.0%) | 125 (100.0%) |
| Total (Category) | 224 (34.8%) | 419 (65.2%) |
| Total (Overall) | 2,165 (55.2%) | 1,755 (44.8%) |
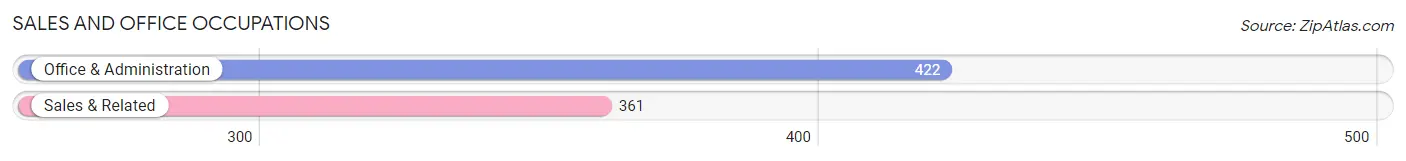
Sales and Office Occupations
The most common Sales and Office occupations in Mayfield are Office & Administration (422 | 10.8%), and Sales & Related (361 | 9.2%).
Sales and Office Occupations by Sex
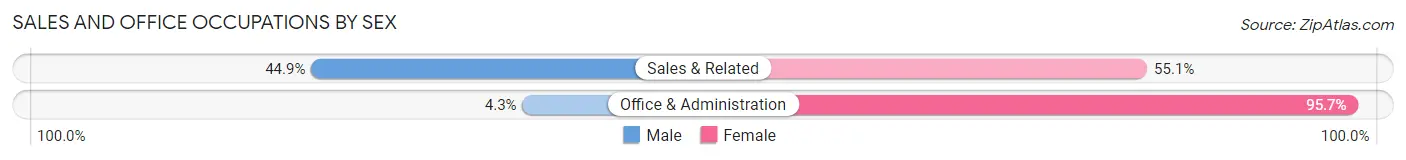
| Occupation | Male | Female |
| Sales & Related | 162 (44.9%) | 199 (55.1%) |
| Office & Administration | 18 (4.3%) | 404 (95.7%) |
| Total (Category) | 180 (23.0%) | 603 (77.0%) |
| Total (Overall) | 2,165 (55.2%) | 1,755 (44.8%) |
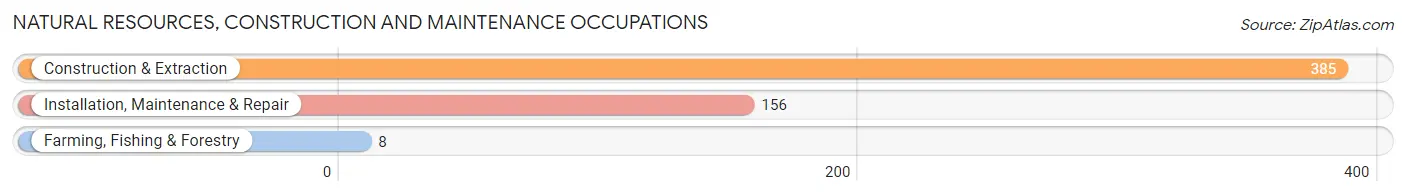
Natural Resources, Construction and Maintenance Occupations
The most common Natural Resources, Construction and Maintenance occupations in Mayfield are Construction & Extraction (385 | 9.8%), Installation, Maintenance & Repair (156 | 4.0%), and Farming, Fishing & Forestry (8 | 0.2%).
Natural Resources, Construction and Maintenance Occupations by Sex
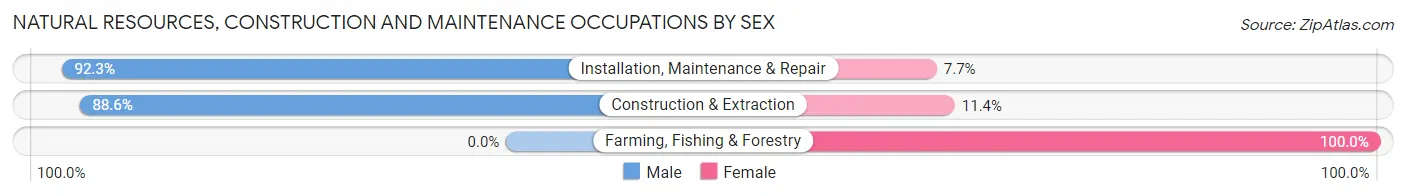
| Occupation | Male | Female |
| Farming, Fishing & Forestry | 0 (0.0%) | 8 (100.0%) |
| Construction & Extraction | 341 (88.6%) | 44 (11.4%) |
| Installation, Maintenance & Repair | 144 (92.3%) | 12 (7.7%) |
| Total (Category) | 485 (88.3%) | 64 (11.7%) |
| Total (Overall) | 2,165 (55.2%) | 1,755 (44.8%) |
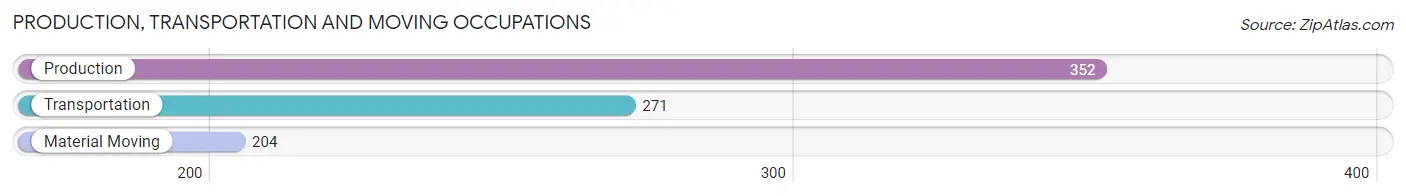
Production, Transportation and Moving Occupations
The most common Production, Transportation and Moving occupations in Mayfield are Production (352 | 9.0%), Transportation (271 | 6.9%), and Material Moving (204 | 5.2%).
Production, Transportation and Moving Occupations by Sex
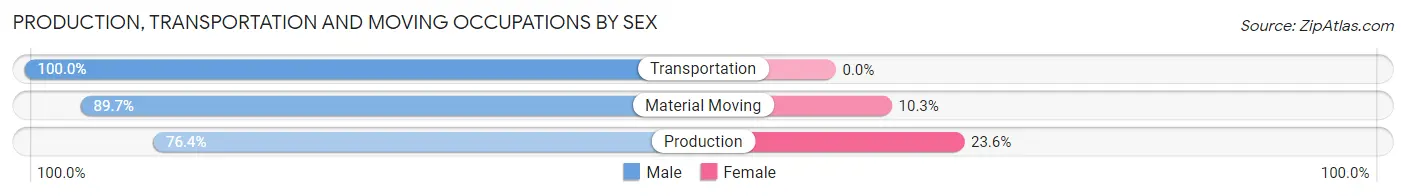
| Occupation | Male | Female |
| Production | 269 (76.4%) | 83 (23.6%) |
| Transportation | 271 (100.0%) | 0 (0.0%) |
| Material Moving | 183 (89.7%) | 21 (10.3%) |
| Total (Category) | 723 (87.4%) | 104 (12.6%) |
| Total (Overall) | 2,165 (55.2%) | 1,755 (44.8%) |
Employment Industries by Sex in Mayfield
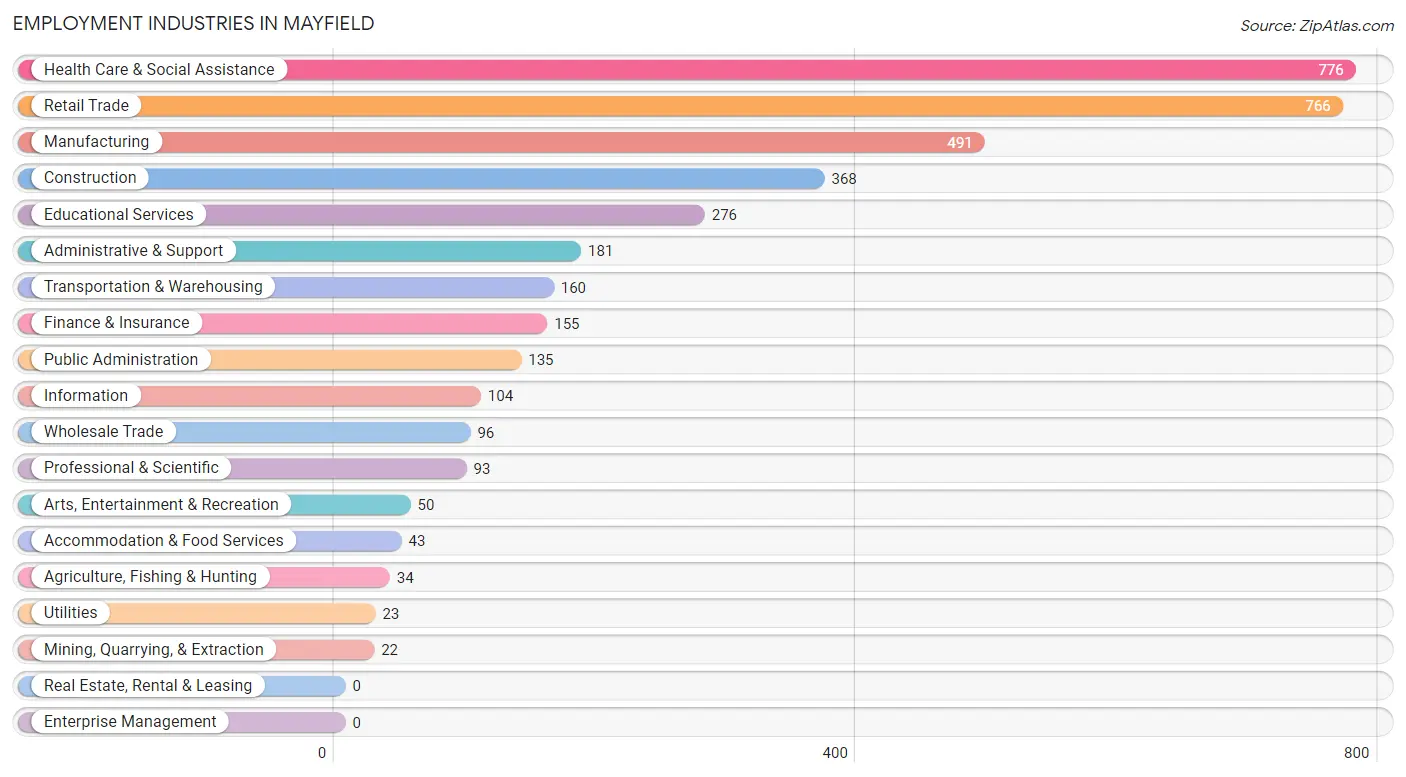
Employment Industries in Mayfield
The major employment industries in Mayfield include Health Care & Social Assistance (776 | 19.8%), Retail Trade (766 | 19.5%), Manufacturing (491 | 12.5%), Construction (368 | 9.4%), and Educational Services (276 | 7.0%).
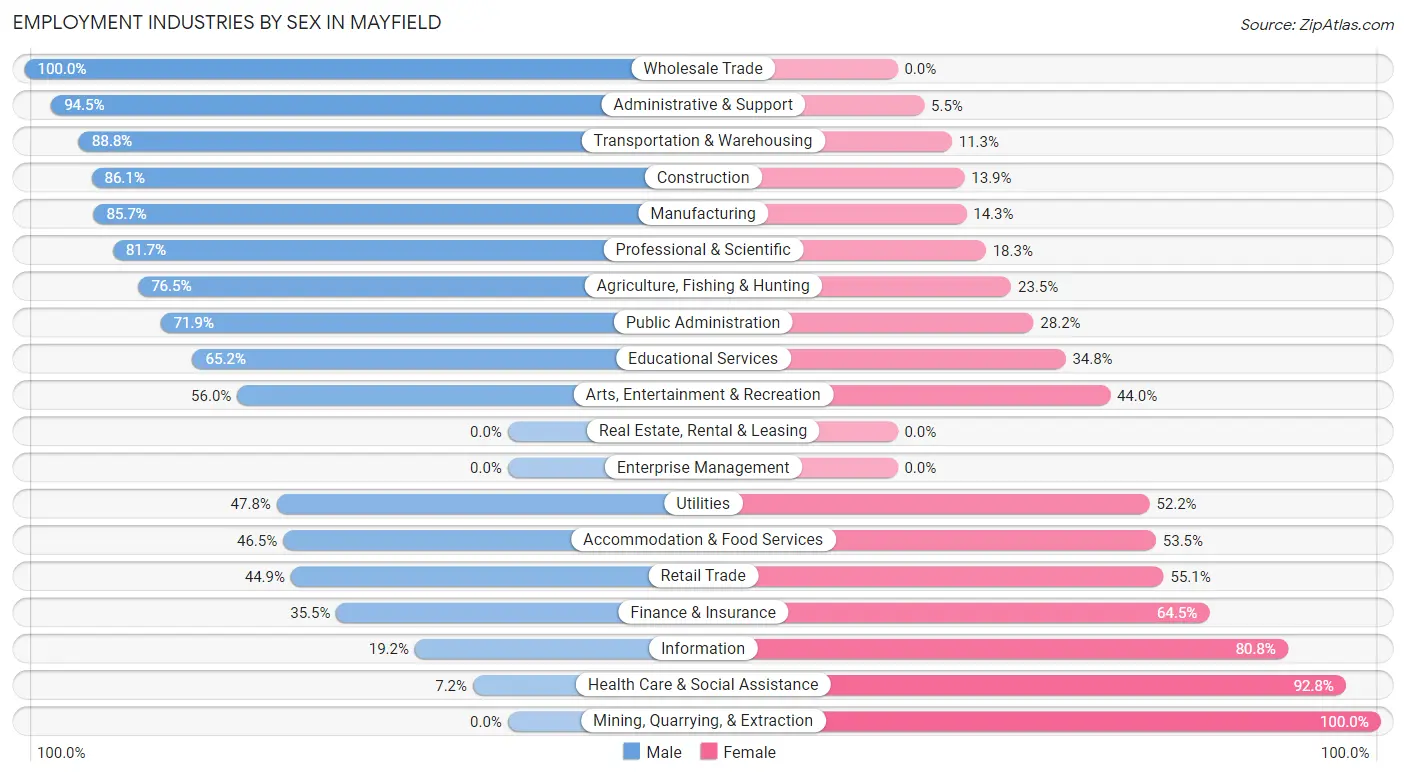
Employment Industries by Sex in Mayfield
The Mayfield industries that see more men than women are Wholesale Trade (100.0%), Administrative & Support (94.5%), and Transportation & Warehousing (88.7%), whereas the industries that tend to have a higher number of women are Mining, Quarrying, & Extraction (100.0%), Health Care & Social Assistance (92.8%), and Information (80.8%).
| Industry | Male | Female |
| Agriculture, Fishing & Hunting | 26 (76.5%) | 8 (23.5%) |
| Mining, Quarrying, & Extraction | 0 (0.0%) | 22 (100.0%) |
| Construction | 317 (86.1%) | 51 (13.9%) |
| Manufacturing | 421 (85.7%) | 70 (14.3%) |
| Wholesale Trade | 96 (100.0%) | 0 (0.0%) |
| Retail Trade | 344 (44.9%) | 422 (55.1%) |
| Transportation & Warehousing | 142 (88.7%) | 18 (11.3%) |
| Utilities | 11 (47.8%) | 12 (52.2%) |
| Information | 20 (19.2%) | 84 (80.8%) |
| Finance & Insurance | 55 (35.5%) | 100 (64.5%) |
| Real Estate, Rental & Leasing | 0 (0.0%) | 0 (0.0%) |
| Professional & Scientific | 76 (81.7%) | 17 (18.3%) |
| Enterprise Management | 0 (0.0%) | 0 (0.0%) |
| Administrative & Support | 171 (94.5%) | 10 (5.5%) |
| Educational Services | 180 (65.2%) | 96 (34.8%) |
| Health Care & Social Assistance | 56 (7.2%) | 720 (92.8%) |
| Arts, Entertainment & Recreation | 28 (56.0%) | 22 (44.0%) |
| Accommodation & Food Services | 20 (46.5%) | 23 (53.5%) |
| Public Administration | 97 (71.9%) | 38 (28.1%) |
| Total | 2,165 (55.2%) | 1,755 (44.8%) |
Education in Mayfield
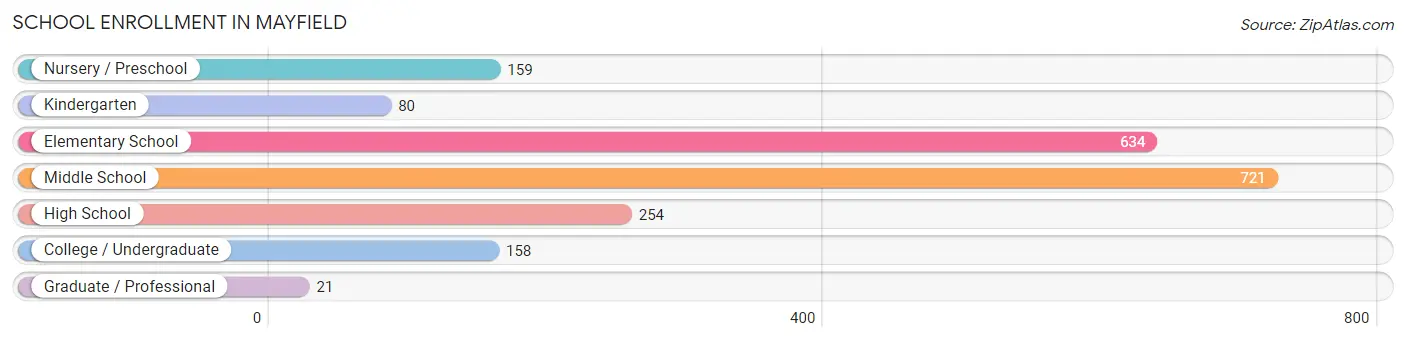
School Enrollment in Mayfield
The most common levels of schooling among the 2,027 students in Mayfield are middle school (721 | 35.6%), elementary school (634 | 31.3%), and high school (254 | 12.5%).
| School Level | # Students | % Students |
| Nursery / Preschool | 159 | 7.8% |
| Kindergarten | 80 | 4.0% |
| Elementary School | 634 | 31.3% |
| Middle School | 721 | 35.6% |
| High School | 254 | 12.5% |
| College / Undergraduate | 158 | 7.8% |
| Graduate / Professional | 21 | 1.0% |
| Total | 2,027 | 100.0% |
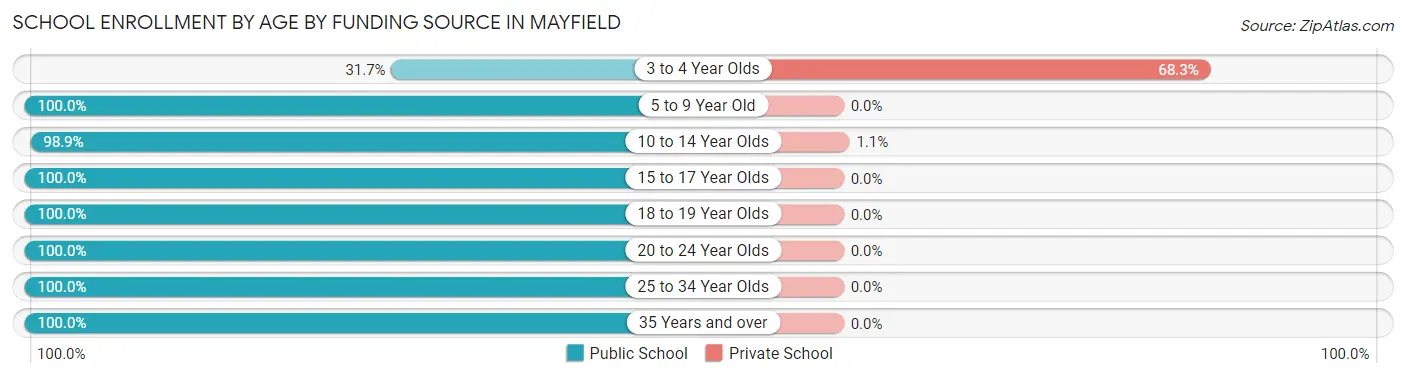
School Enrollment by Age by Funding Source in Mayfield
Out of a total of 2,027 students who are enrolled in schools in Mayfield, 91 (4.5%) attend a private institution, while the remaining 1,936 (95.5%) are enrolled in public schools. The age group of 3 to 4 year olds has the highest likelihood of being enrolled in private schools, with 82 (68.3% in the age bracket) enrolled. Conversely, the age group of 5 to 9 year old has the lowest likelihood of being enrolled in a private school, with 640 (100.0% in the age bracket) attending a public institution.
| Age Bracket | Public School | Private School |
| 3 to 4 Year Olds | 38 (31.7%) | 82 (68.3%) |
| 5 to 9 Year Old | 640 (100.0%) | 0 (0.0%) |
| 10 to 14 Year Olds | 825 (98.9%) | 9 (1.1%) |
| 15 to 17 Year Olds | 199 (100.0%) | 0 (0.0%) |
| 18 to 19 Year Olds | 65 (100.0%) | 0 (0.0%) |
| 20 to 24 Year Olds | 73 (100.0%) | 0 (0.0%) |
| 25 to 34 Year Olds | 39 (100.0%) | 0 (0.0%) |
| 35 Years and over | 57 (100.0%) | 0 (0.0%) |
| Total | 1,936 (95.5%) | 91 (4.5%) |
Educational Attainment by Field of Study in Mayfield
Liberal arts & history (209 | 13.9%), visual & performing arts (208 | 13.8%), education (204 | 13.5%), science & technology (193 | 12.8%), and business (186 | 12.3%) are the most common fields of study among 1,508 individuals in Mayfield who have obtained a bachelor's degree or higher.
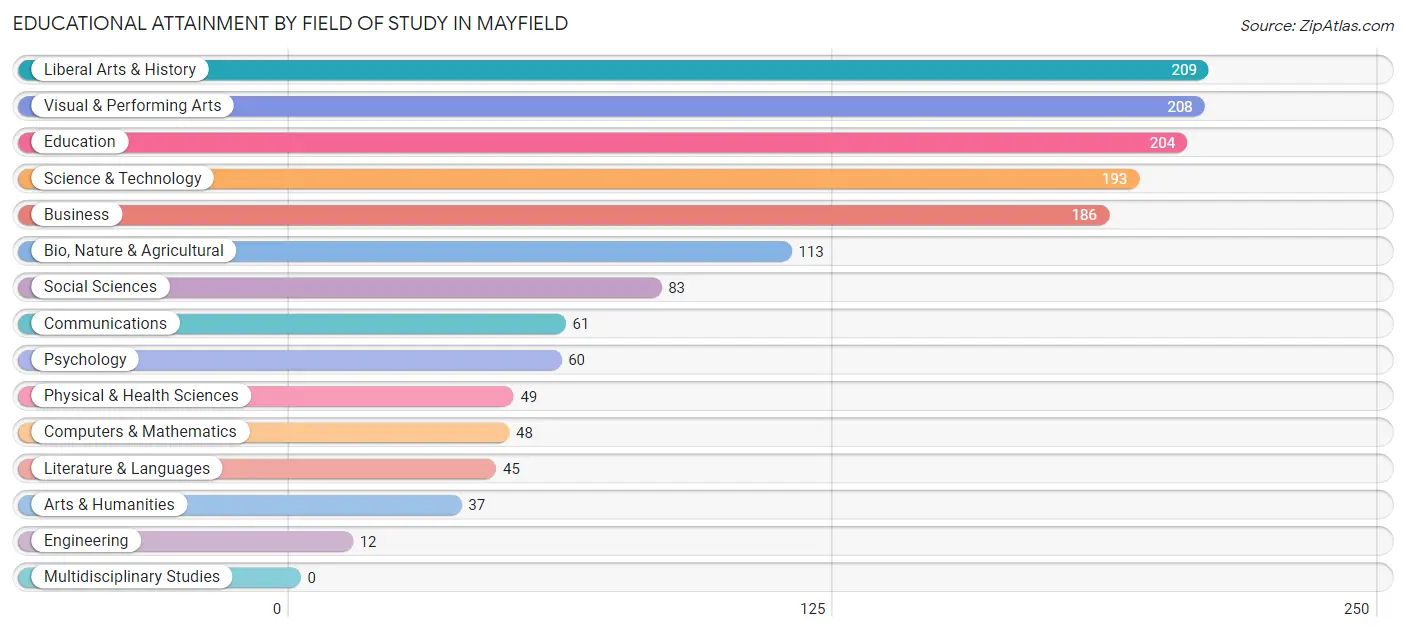
| Field of Study | # Graduates | % Graduates |
| Computers & Mathematics | 48 | 3.2% |
| Bio, Nature & Agricultural | 113 | 7.5% |
| Physical & Health Sciences | 49 | 3.3% |
| Psychology | 60 | 4.0% |
| Social Sciences | 83 | 5.5% |
| Engineering | 12 | 0.8% |
| Multidisciplinary Studies | 0 | 0.0% |
| Science & Technology | 193 | 12.8% |
| Business | 186 | 12.3% |
| Education | 204 | 13.5% |
| Literature & Languages | 45 | 3.0% |
| Liberal Arts & History | 209 | 13.9% |
| Visual & Performing Arts | 208 | 13.8% |
| Communications | 61 | 4.1% |
| Arts & Humanities | 37 | 2.5% |
| Total | 1,508 | 100.0% |
Transportation & Commute in Mayfield
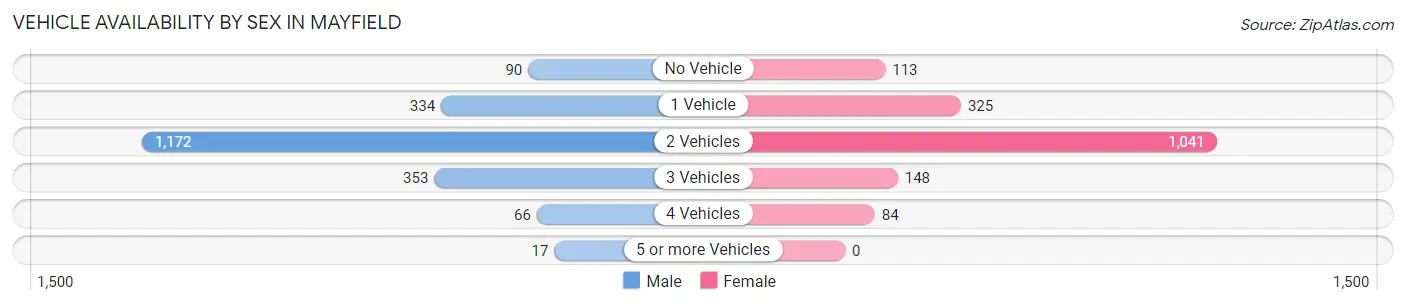
Vehicle Availability by Sex in Mayfield
The most prevalent vehicle ownership categories in Mayfield are males with 2 vehicles (1,172, accounting for 57.7%) and females with 2 vehicles (1,041, making up 68.5%).
| Vehicles Available | Male | Female |
| No Vehicle | 90 (4.4%) | 113 (6.6%) |
| 1 Vehicle | 334 (16.4%) | 325 (19.0%) |
| 2 Vehicles | 1,172 (57.7%) | 1,041 (60.8%) |
| 3 Vehicles | 353 (17.4%) | 148 (8.6%) |
| 4 Vehicles | 66 (3.3%) | 84 (4.9%) |
| 5 or more Vehicles | 17 (0.8%) | 0 (0.0%) |
| Total | 2,032 (100.0%) | 1,711 (100.0%) |
Commute Time in Mayfield
The most frequently occuring commute durations in Mayfield are 10 to 14 minutes (988 commuters, 29.4%), 5 to 9 minutes (741 commuters, 22.1%), and 20 to 24 minutes (486 commuters, 14.5%).
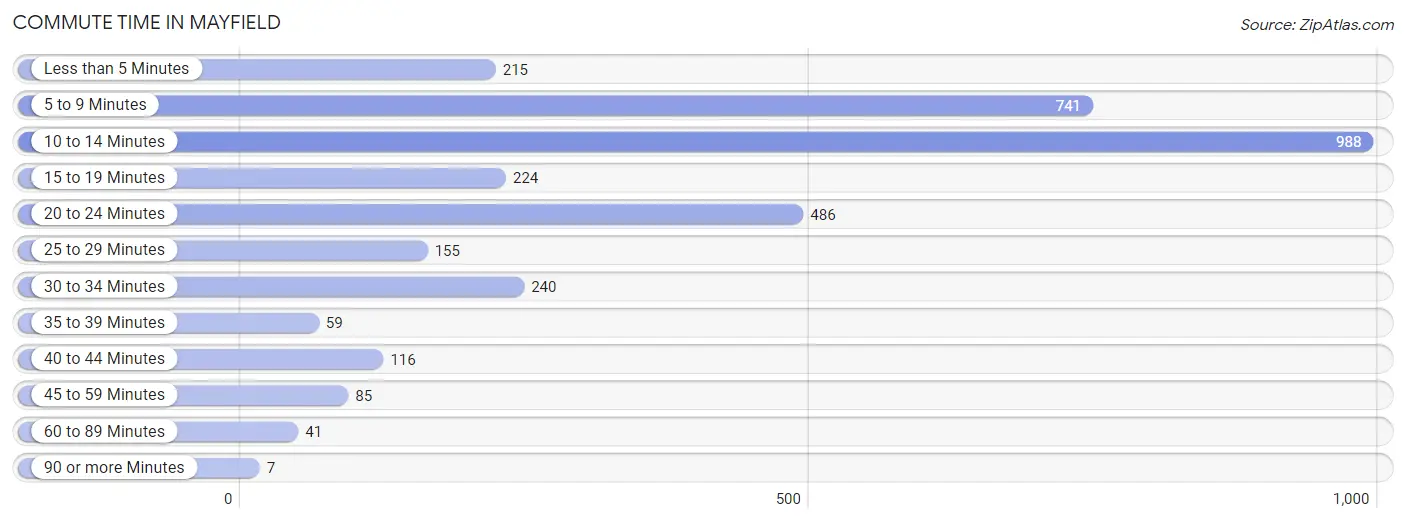
| Commute Time | # Commuters | % Commuters |
| Less than 5 Minutes | 215 | 6.4% |
| 5 to 9 Minutes | 741 | 22.1% |
| 10 to 14 Minutes | 988 | 29.4% |
| 15 to 19 Minutes | 224 | 6.7% |
| 20 to 24 Minutes | 486 | 14.5% |
| 25 to 29 Minutes | 155 | 4.6% |
| 30 to 34 Minutes | 240 | 7.1% |
| 35 to 39 Minutes | 59 | 1.8% |
| 40 to 44 Minutes | 116 | 3.5% |
| 45 to 59 Minutes | 85 | 2.5% |
| 60 to 89 Minutes | 41 | 1.2% |
| 90 or more Minutes | 7 | 0.2% |
Commute Time by Sex in Mayfield
The most common commute times in Mayfield are 10 to 14 minutes (467 commuters, 24.7%) for males and 10 to 14 minutes (521 commuters, 35.5%) for females.
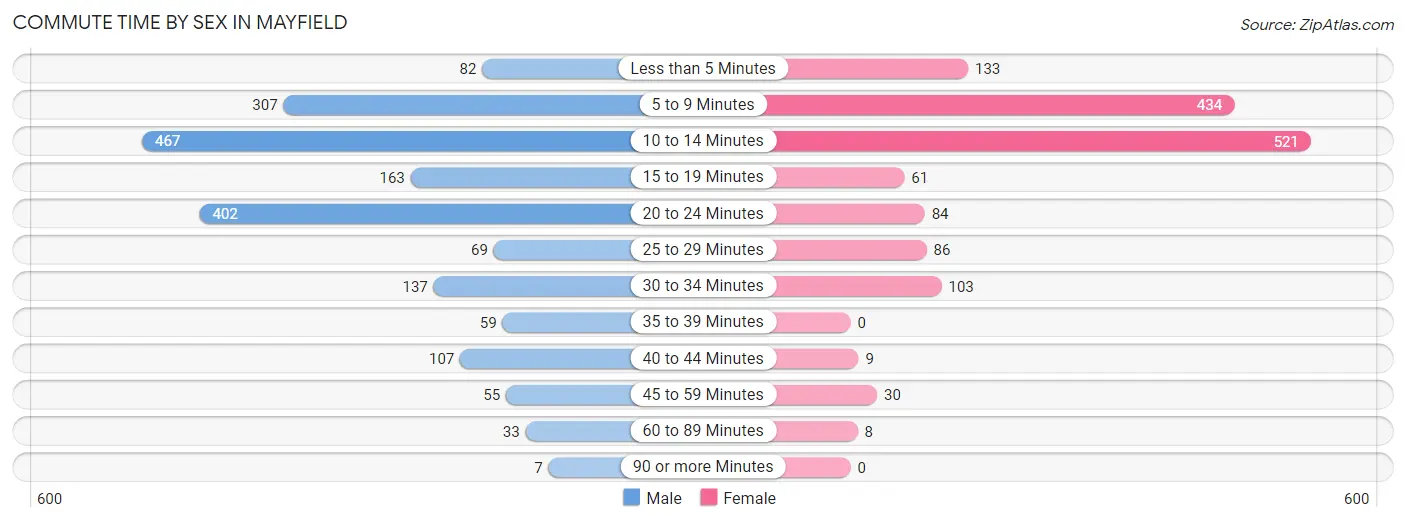
| Commute Time | Male | Female |
| Less than 5 Minutes | 82 (4.3%) | 133 (9.0%) |
| 5 to 9 Minutes | 307 (16.3%) | 434 (29.5%) |
| 10 to 14 Minutes | 467 (24.7%) | 521 (35.5%) |
| 15 to 19 Minutes | 163 (8.6%) | 61 (4.2%) |
| 20 to 24 Minutes | 402 (21.3%) | 84 (5.7%) |
| 25 to 29 Minutes | 69 (3.6%) | 86 (5.9%) |
| 30 to 34 Minutes | 137 (7.3%) | 103 (7.0%) |
| 35 to 39 Minutes | 59 (3.1%) | 0 (0.0%) |
| 40 to 44 Minutes | 107 (5.7%) | 9 (0.6%) |
| 45 to 59 Minutes | 55 (2.9%) | 30 (2.0%) |
| 60 to 89 Minutes | 33 (1.8%) | 8 (0.5%) |
| 90 or more Minutes | 7 (0.4%) | 0 (0.0%) |
Time of Departure to Work by Sex in Mayfield
The most frequent times of departure to work in Mayfield are 7:00 AM to 7:29 AM (768, 40.7%) for males and 7:30 AM to 7:59 AM (320, 21.8%) for females.
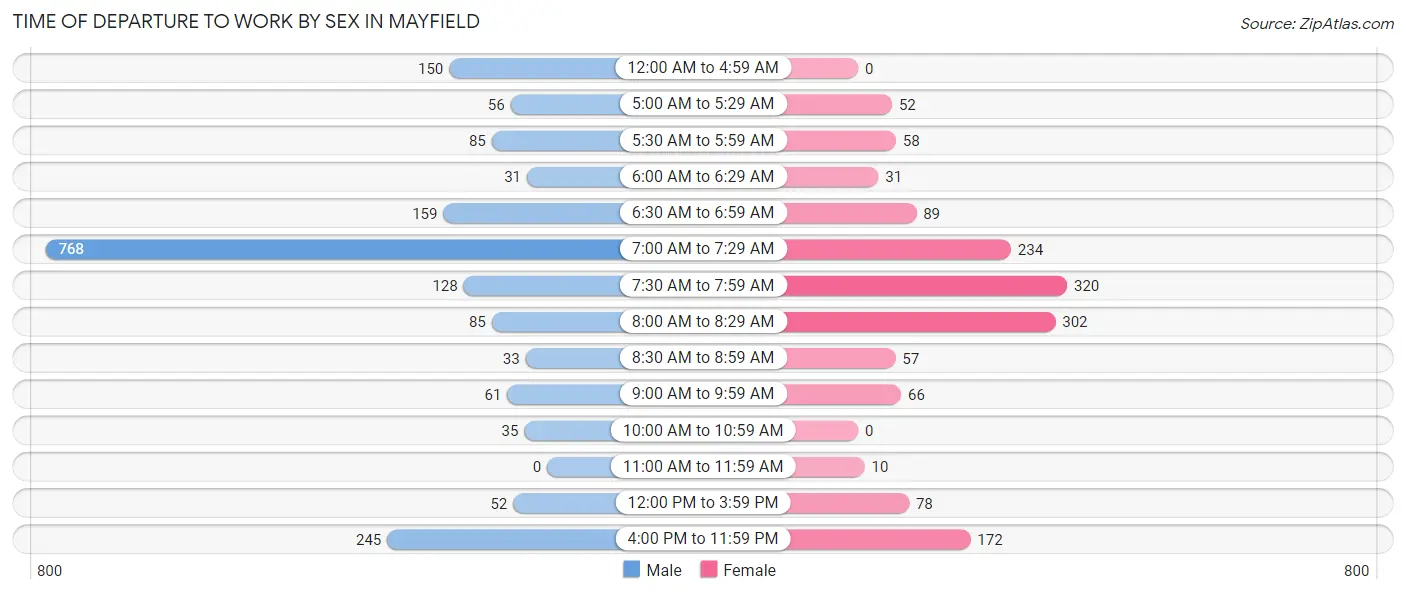
| Time of Departure | Male | Female |
| 12:00 AM to 4:59 AM | 150 (7.9%) | 0 (0.0%) |
| 5:00 AM to 5:29 AM | 56 (3.0%) | 52 (3.5%) |
| 5:30 AM to 5:59 AM | 85 (4.5%) | 58 (4.0%) |
| 6:00 AM to 6:29 AM | 31 (1.6%) | 31 (2.1%) |
| 6:30 AM to 6:59 AM | 159 (8.4%) | 89 (6.1%) |
| 7:00 AM to 7:29 AM | 768 (40.7%) | 234 (15.9%) |
| 7:30 AM to 7:59 AM | 128 (6.8%) | 320 (21.8%) |
| 8:00 AM to 8:29 AM | 85 (4.5%) | 302 (20.6%) |
| 8:30 AM to 8:59 AM | 33 (1.8%) | 57 (3.9%) |
| 9:00 AM to 9:59 AM | 61 (3.2%) | 66 (4.5%) |
| 10:00 AM to 10:59 AM | 35 (1.8%) | 0 (0.0%) |
| 11:00 AM to 11:59 AM | 0 (0.0%) | 10 (0.7%) |
| 12:00 PM to 3:59 PM | 52 (2.8%) | 78 (5.3%) |
| 4:00 PM to 11:59 PM | 245 (13.0%) | 172 (11.7%) |
| Total | 1,888 (100.0%) | 1,469 (100.0%) |
Housing Occupancy in Mayfield
Occupancy by Ownership in Mayfield
Of the total 4,175 dwellings in Mayfield, owner-occupied units account for 2,428 (58.2%), while renter-occupied units make up 1,747 (41.8%).
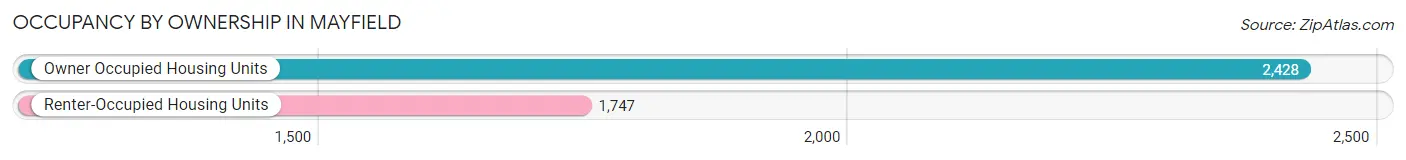
| Occupancy | # Housing Units | % Housing Units |
| Owner Occupied Housing Units | 2,428 | 58.2% |
| Renter-Occupied Housing Units | 1,747 | 41.8% |
| Total Occupied Housing Units | 4,175 | 100.0% |
Occupancy by Household Size in Mayfield
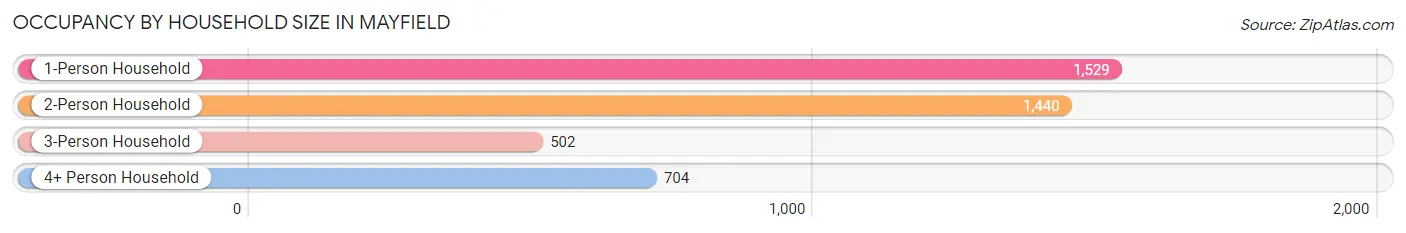
| Household Size | # Housing Units | % Housing Units |
| 1-Person Household | 1,529 | 36.6% |
| 2-Person Household | 1,440 | 34.5% |
| 3-Person Household | 502 | 12.0% |
| 4+ Person Household | 704 | 16.9% |
| Total Housing Units | 4,175 | 100.0% |
Occupancy by Ownership by Household Size in Mayfield
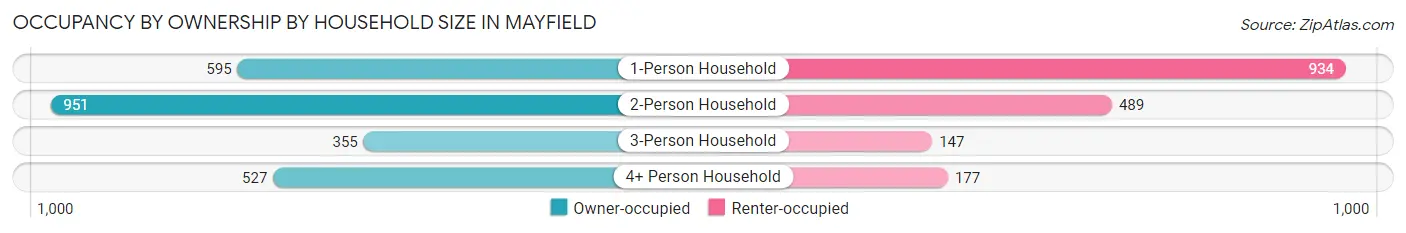
| Household Size | Owner-occupied | Renter-occupied |
| 1-Person Household | 595 (38.9%) | 934 (61.1%) |
| 2-Person Household | 951 (66.0%) | 489 (34.0%) |
| 3-Person Household | 355 (70.7%) | 147 (29.3%) |
| 4+ Person Household | 527 (74.9%) | 177 (25.1%) |
| Total Housing Units | 2,428 (58.2%) | 1,747 (41.8%) |
Occupancy by Educational Attainment in Mayfield
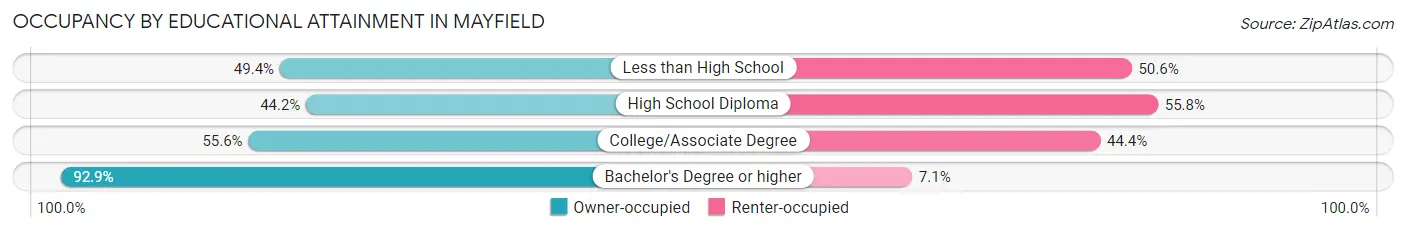
| Household Size | Owner-occupied | Renter-occupied |
| Less than High School | 198 (49.4%) | 203 (50.6%) |
| High School Diploma | 754 (44.2%) | 953 (55.8%) |
| College/Associate Degree | 663 (55.6%) | 529 (44.4%) |
| Bachelor's Degree or higher | 813 (92.9%) | 62 (7.1%) |
Occupancy by Age of Householder in Mayfield
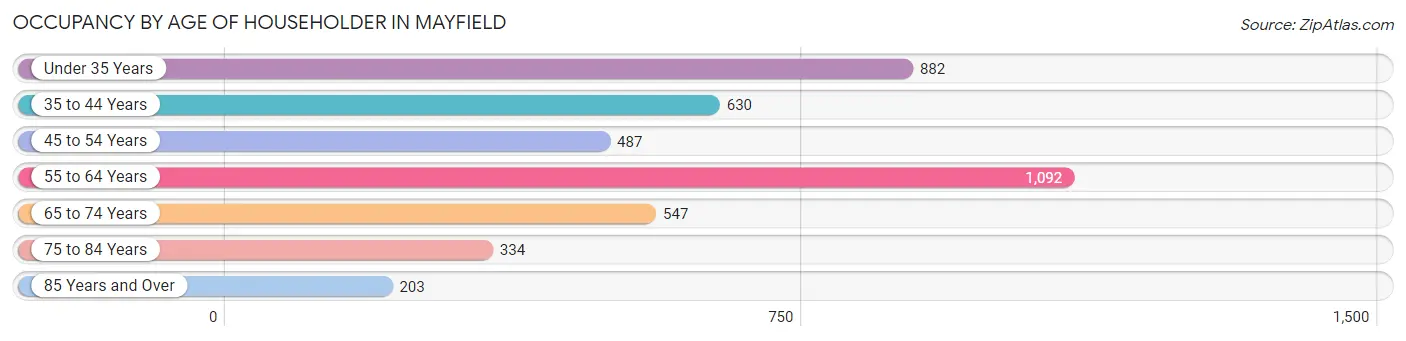
| Age Bracket | # Households | % Households |
| Under 35 Years | 882 | 21.1% |
| 35 to 44 Years | 630 | 15.1% |
| 45 to 54 Years | 487 | 11.7% |
| 55 to 64 Years | 1,092 | 26.2% |
| 65 to 74 Years | 547 | 13.1% |
| 75 to 84 Years | 334 | 8.0% |
| 85 Years and Over | 203 | 4.9% |
| Total | 4,175 | 100.0% |
Housing Finances in Mayfield
Median Income by Occupancy in Mayfield
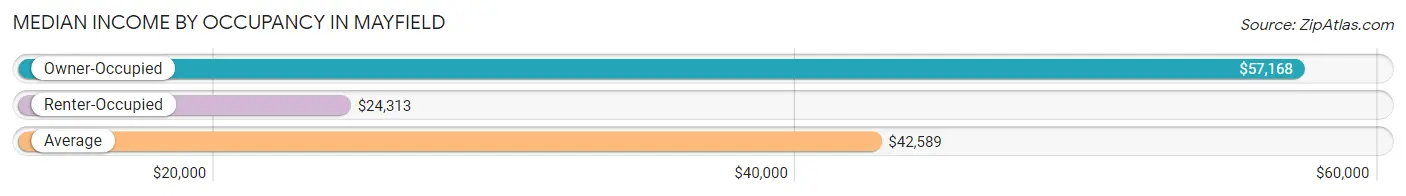
| Occupancy Type | # Households | Median Income |
| Owner-Occupied | 2,428 (58.2%) | $57,168 |
| Renter-Occupied | 1,747 (41.8%) | $24,313 |
| Average | 4,175 (100.0%) | $42,589 |
Occupancy by Householder Income Bracket in Mayfield
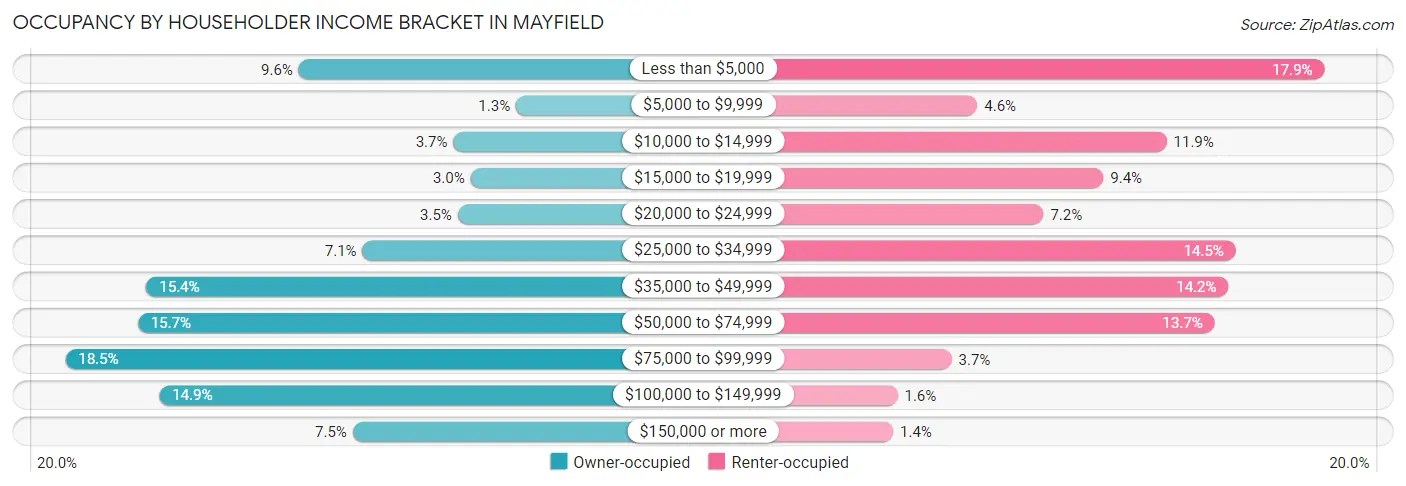
| Income Bracket | Owner-occupied | Renter-occupied |
| Less than $5,000 | 232 (9.6%) | 312 (17.9%) |
| $5,000 to $9,999 | 31 (1.3%) | 81 (4.6%) |
| $10,000 to $14,999 | 89 (3.7%) | 207 (11.8%) |
| $15,000 to $19,999 | 73 (3.0%) | 165 (9.4%) |
| $20,000 to $24,999 | 85 (3.5%) | 125 (7.2%) |
| $25,000 to $34,999 | 173 (7.1%) | 253 (14.5%) |
| $35,000 to $49,999 | 373 (15.4%) | 248 (14.2%) |
| $50,000 to $74,999 | 381 (15.7%) | 239 (13.7%) |
| $75,000 to $99,999 | 448 (18.4%) | 64 (3.7%) |
| $100,000 to $149,999 | 361 (14.9%) | 28 (1.6%) |
| $150,000 or more | 182 (7.5%) | 25 (1.4%) |
| Total | 2,428 (100.0%) | 1,747 (100.0%) |
Monthly Housing Cost Tiers in Mayfield
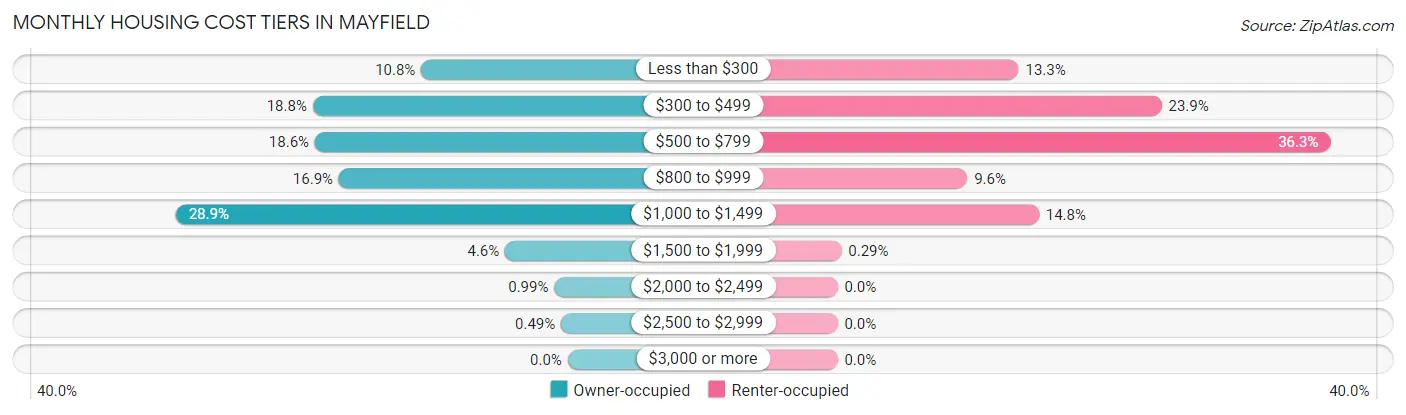
| Monthly Cost | Owner-occupied | Renter-occupied |
| Less than $300 | 262 (10.8%) | 233 (13.3%) |
| $300 to $499 | 456 (18.8%) | 417 (23.9%) |
| $500 to $799 | 452 (18.6%) | 634 (36.3%) |
| $800 to $999 | 409 (16.9%) | 167 (9.6%) |
| $1,000 to $1,499 | 701 (28.9%) | 259 (14.8%) |
| $1,500 to $1,999 | 112 (4.6%) | 5 (0.3%) |
| $2,000 to $2,499 | 24 (1.0%) | 0 (0.0%) |
| $2,500 to $2,999 | 12 (0.5%) | 0 (0.0%) |
| $3,000 or more | 0 (0.0%) | 0 (0.0%) |
| Total | 2,428 (100.0%) | 1,747 (100.0%) |
Physical Housing Characteristics in Mayfield
Housing Structures in Mayfield
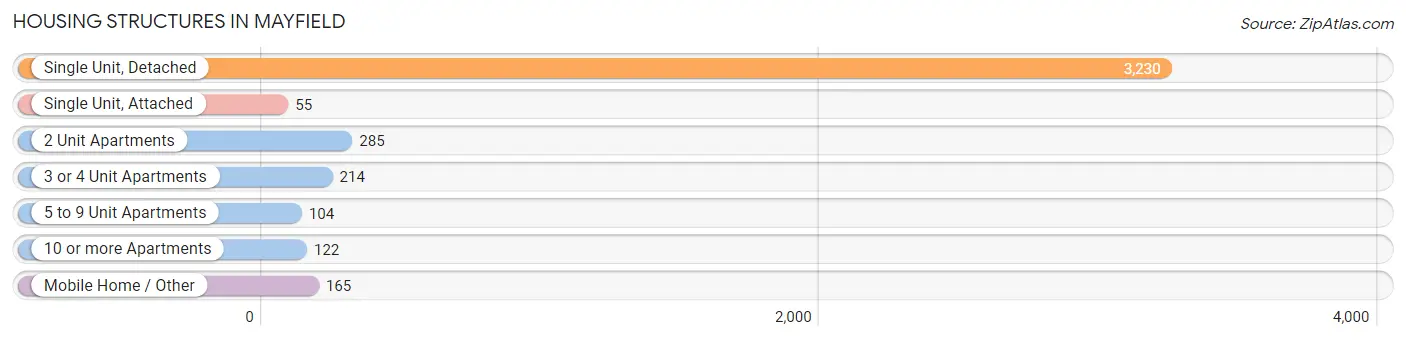
| Structure Type | # Housing Units | % Housing Units |
| Single Unit, Detached | 3,230 | 77.4% |
| Single Unit, Attached | 55 | 1.3% |
| 2 Unit Apartments | 285 | 6.8% |
| 3 or 4 Unit Apartments | 214 | 5.1% |
| 5 to 9 Unit Apartments | 104 | 2.5% |
| 10 or more Apartments | 122 | 2.9% |
| Mobile Home / Other | 165 | 4.0% |
| Total | 4,175 | 100.0% |
Housing Structures by Occupancy in Mayfield
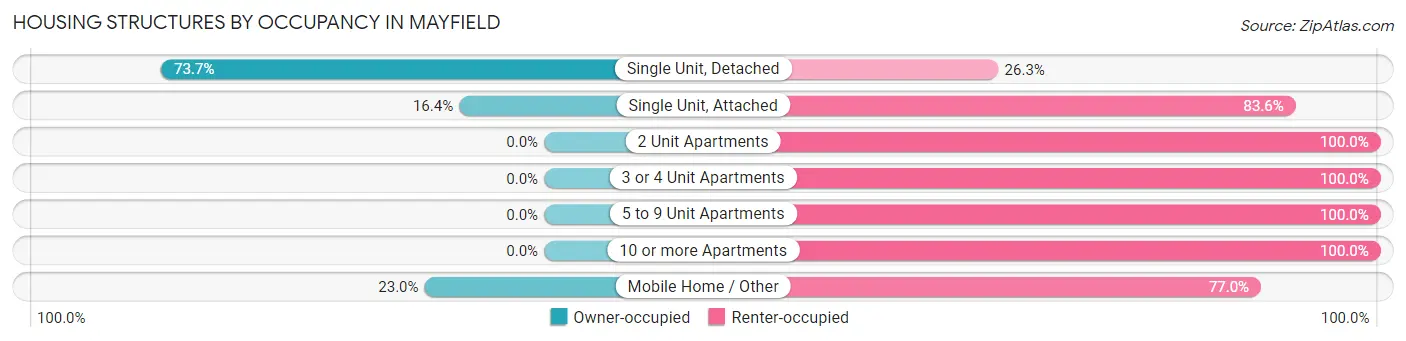
| Structure Type | Owner-occupied | Renter-occupied |
| Single Unit, Detached | 2,381 (73.7%) | 849 (26.3%) |
| Single Unit, Attached | 9 (16.4%) | 46 (83.6%) |
| 2 Unit Apartments | 0 (0.0%) | 285 (100.0%) |
| 3 or 4 Unit Apartments | 0 (0.0%) | 214 (100.0%) |
| 5 to 9 Unit Apartments | 0 (0.0%) | 104 (100.0%) |
| 10 or more Apartments | 0 (0.0%) | 122 (100.0%) |
| Mobile Home / Other | 38 (23.0%) | 127 (77.0%) |
| Total | 2,428 (58.2%) | 1,747 (41.8%) |
Housing Structures by Number of Rooms in Mayfield
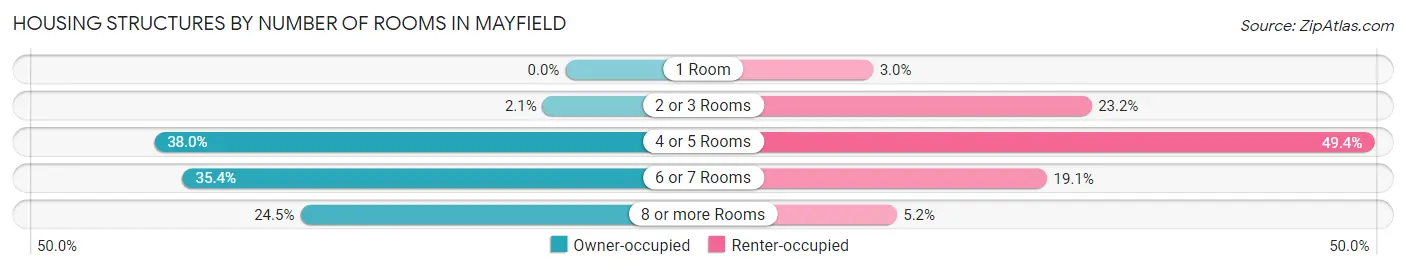
| Number of Rooms | Owner-occupied | Renter-occupied |
| 1 Room | 0 (0.0%) | 53 (3.0%) |
| 2 or 3 Rooms | 51 (2.1%) | 406 (23.2%) |
| 4 or 5 Rooms | 923 (38.0%) | 863 (49.4%) |
| 6 or 7 Rooms | 859 (35.4%) | 334 (19.1%) |
| 8 or more Rooms | 595 (24.5%) | 91 (5.2%) |
| Total | 2,428 (100.0%) | 1,747 (100.0%) |
Housing Structure by Heating Type in Mayfield
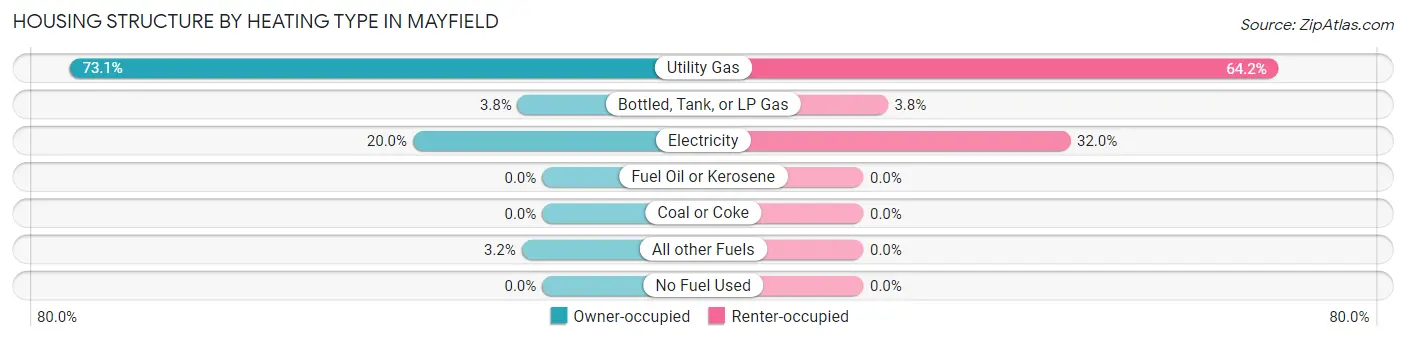
| Heating Type | Owner-occupied | Renter-occupied |
| Utility Gas | 1,774 (73.1%) | 1,122 (64.2%) |
| Bottled, Tank, or LP Gas | 92 (3.8%) | 66 (3.8%) |
| Electricity | 485 (20.0%) | 559 (32.0%) |
| Fuel Oil or Kerosene | 0 (0.0%) | 0 (0.0%) |
| Coal or Coke | 0 (0.0%) | 0 (0.0%) |
| All other Fuels | 77 (3.2%) | 0 (0.0%) |
| No Fuel Used | 0 (0.0%) | 0 (0.0%) |
| Total | 2,428 (100.0%) | 1,747 (100.0%) |
Household Vehicle Usage in Mayfield
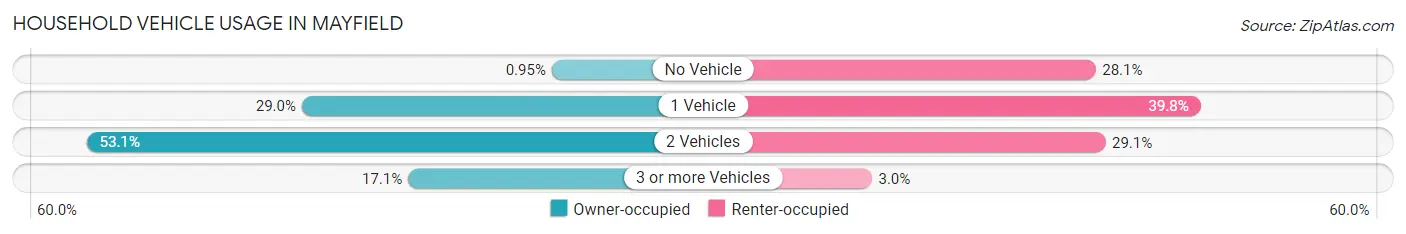
| Vehicles per Household | Owner-occupied | Renter-occupied |
| No Vehicle | 23 (0.9%) | 490 (28.1%) |
| 1 Vehicle | 703 (28.9%) | 696 (39.8%) |
| 2 Vehicles | 1,288 (53.0%) | 509 (29.1%) |
| 3 or more Vehicles | 414 (17.1%) | 52 (3.0%) |
| Total | 2,428 (100.0%) | 1,747 (100.0%) |
Real Estate & Mortgages in Mayfield
Real Estate and Mortgage Overview in Mayfield
| Characteristic | Without Mortgage | With Mortgage |
| Housing Units | 965 | 1,463 |
| Median Property Value | $100,300 | $120,000 |
| Median Household Income | $44,570 | $140 |
| Monthly Housing Costs | $393 | $0 |
| Real Estate Taxes | $587 | $17 |
Property Value by Mortgage Status in Mayfield
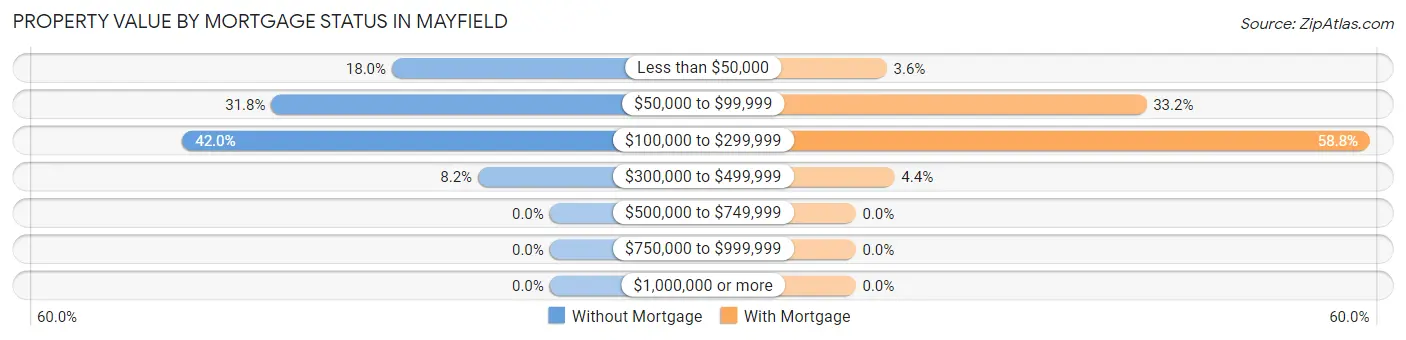
| Property Value | Without Mortgage | With Mortgage |
| Less than $50,000 | 174 (18.0%) | 52 (3.5%) |
| $50,000 to $99,999 | 307 (31.8%) | 486 (33.2%) |
| $100,000 to $299,999 | 405 (42.0%) | 860 (58.8%) |
| $300,000 to $499,999 | 79 (8.2%) | 65 (4.4%) |
| $500,000 to $749,999 | 0 (0.0%) | 0 (0.0%) |
| $750,000 to $999,999 | 0 (0.0%) | 0 (0.0%) |
| $1,000,000 or more | 0 (0.0%) | 0 (0.0%) |
| Total | 965 (100.0%) | 1,463 (100.0%) |
Household Income by Mortgage Status in Mayfield
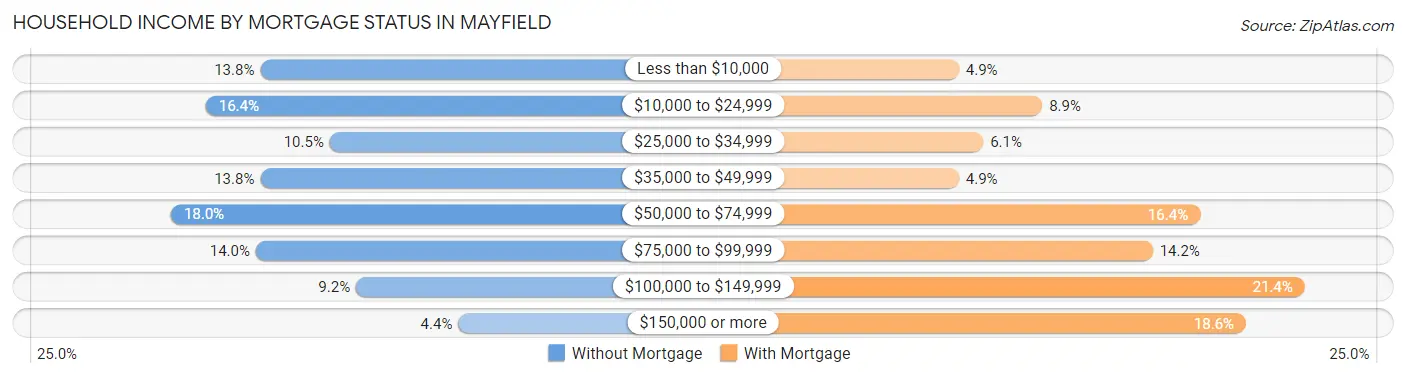
| Household Income | Without Mortgage | With Mortgage |
| Less than $10,000 | 133 (13.8%) | 72 (4.9%) |
| $10,000 to $24,999 | 158 (16.4%) | 130 (8.9%) |
| $25,000 to $34,999 | 101 (10.5%) | 89 (6.1%) |
| $35,000 to $49,999 | 133 (13.8%) | 72 (4.9%) |
| $50,000 to $74,999 | 174 (18.0%) | 240 (16.4%) |
| $75,000 to $99,999 | 135 (14.0%) | 207 (14.1%) |
| $100,000 to $149,999 | 89 (9.2%) | 313 (21.4%) |
| $150,000 or more | 42 (4.3%) | 272 (18.6%) |
| Total | 965 (100.0%) | 1,463 (100.0%) |
Property Value to Household Income Ratio in Mayfield
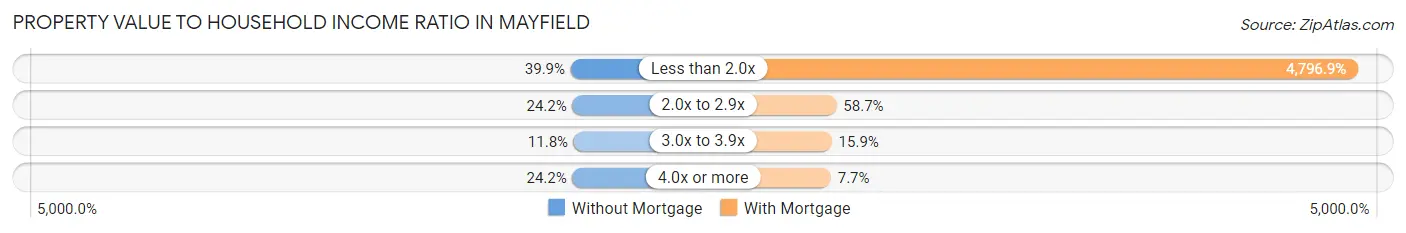
| Value-to-Income Ratio | Without Mortgage | With Mortgage |
| Less than 2.0x | 385 (39.9%) | 70,179 (4,796.9%) |
| 2.0x to 2.9x | 233 (24.1%) | 859 (58.7%) |
| 3.0x to 3.9x | 114 (11.8%) | 232 (15.9%) |
| 4.0x or more | 233 (24.1%) | 112 (7.7%) |
| Total | 965 (100.0%) | 1,463 (100.0%) |
Real Estate Taxes by Mortgage Status in Mayfield
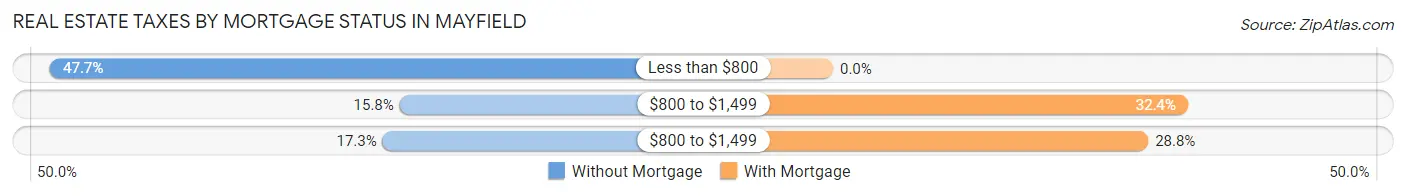
| Property Taxes | Without Mortgage | With Mortgage |
| Less than $800 | 460 (47.7%) | 0 (0.0%) |
| $800 to $1,499 | 152 (15.8%) | 474 (32.4%) |
| $800 to $1,499 | 167 (17.3%) | 421 (28.8%) |
| Total | 965 (100.0%) | 1,463 (100.0%) |
Health & Disability in Mayfield
Health Insurance Coverage by Age in Mayfield
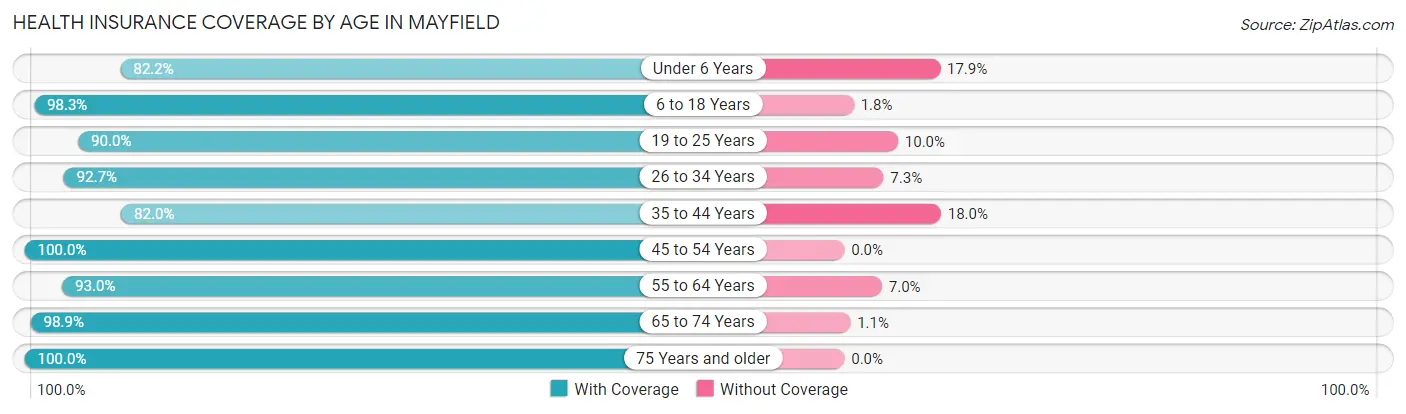
| Age Bracket | With Coverage | Without Coverage |
| Under 6 Years | 750 (82.2%) | 163 (17.8%) |
| 6 to 18 Years | 1,799 (98.3%) | 32 (1.8%) |
| 19 to 25 Years | 730 (90.0%) | 81 (10.0%) |
| 26 to 34 Years | 1,132 (92.7%) | 89 (7.3%) |
| 35 to 44 Years | 952 (82.0%) | 209 (18.0%) |
| 45 to 54 Years | 674 (100.0%) | 0 (0.0%) |
| 55 to 64 Years | 1,515 (93.0%) | 114 (7.0%) |
| 65 to 74 Years | 799 (98.9%) | 9 (1.1%) |
| 75 Years and older | 737 (100.0%) | 0 (0.0%) |
| Total | 9,088 (92.9%) | 697 (7.1%) |
Health Insurance Coverage by Citizenship Status in Mayfield
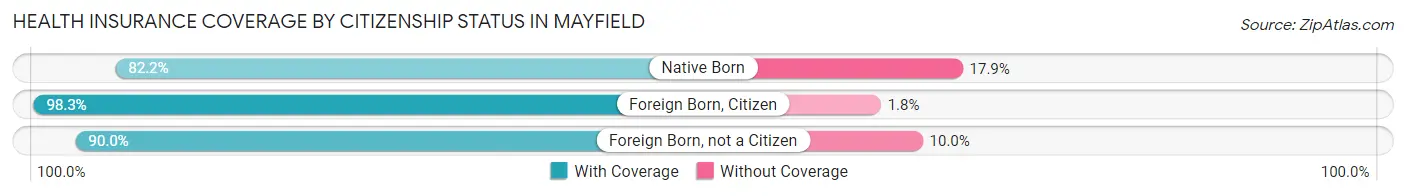
| Citizenship Status | With Coverage | Without Coverage |
| Native Born | 750 (82.2%) | 163 (17.8%) |
| Foreign Born, Citizen | 1,799 (98.3%) | 32 (1.8%) |
| Foreign Born, not a Citizen | 730 (90.0%) | 81 (10.0%) |
Health Insurance Coverage by Household Income in Mayfield
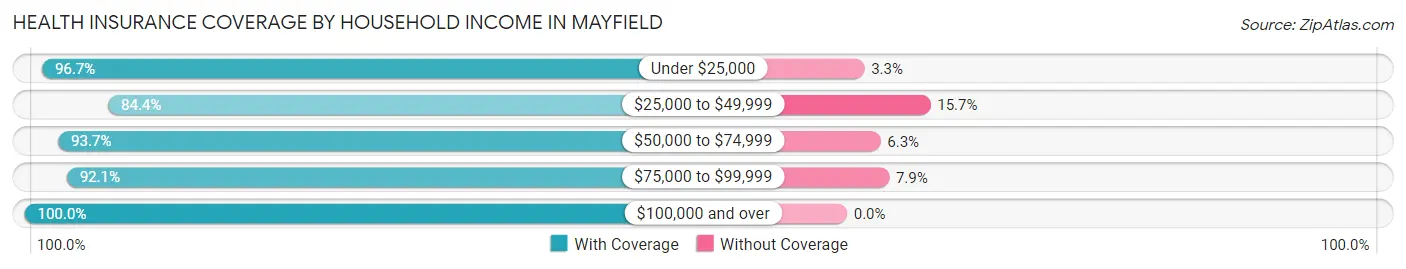
| Household Income | With Coverage | Without Coverage |
| Under $25,000 | 1,902 (96.7%) | 64 (3.3%) |
| $25,000 to $49,999 | 2,236 (84.4%) | 415 (15.7%) |
| $50,000 to $74,999 | 1,655 (93.7%) | 111 (6.3%) |
| $75,000 to $99,999 | 1,189 (92.1%) | 102 (7.9%) |
| $100,000 and over | 2,052 (100.0%) | 0 (0.0%) |
Public vs Private Health Insurance Coverage by Age in Mayfield
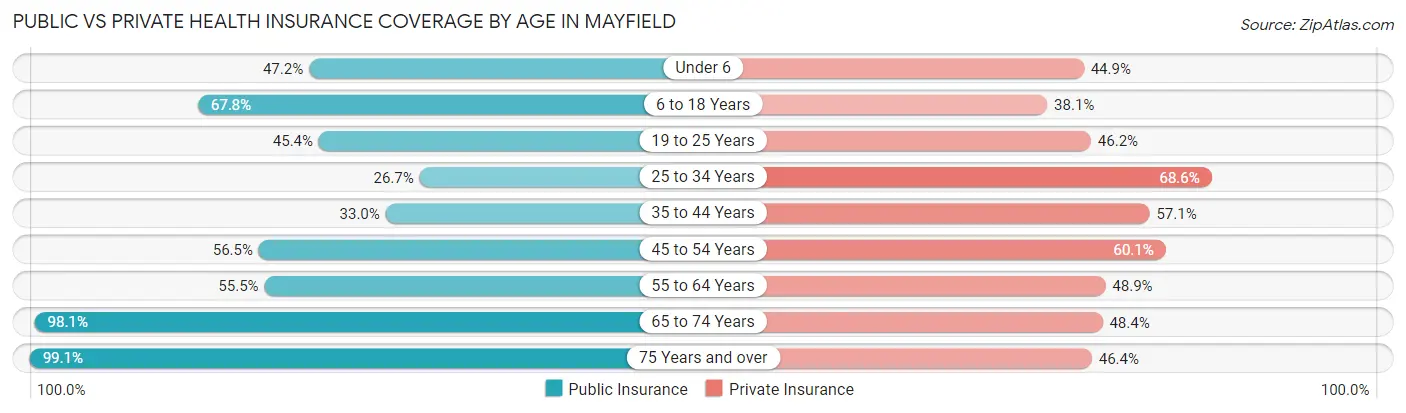
| Age Bracket | Public Insurance | Private Insurance |
| Under 6 | 431 (47.2%) | 410 (44.9%) |
| 6 to 18 Years | 1,242 (67.8%) | 698 (38.1%) |
| 19 to 25 Years | 368 (45.4%) | 375 (46.2%) |
| 25 to 34 Years | 326 (26.7%) | 838 (68.6%) |
| 35 to 44 Years | 383 (33.0%) | 663 (57.1%) |
| 45 to 54 Years | 381 (56.5%) | 405 (60.1%) |
| 55 to 64 Years | 904 (55.5%) | 797 (48.9%) |
| 65 to 74 Years | 793 (98.1%) | 391 (48.4%) |
| 75 Years and over | 730 (99.1%) | 342 (46.4%) |
| Total | 5,558 (56.8%) | 4,919 (50.3%) |
Disability Status by Sex by Age in Mayfield
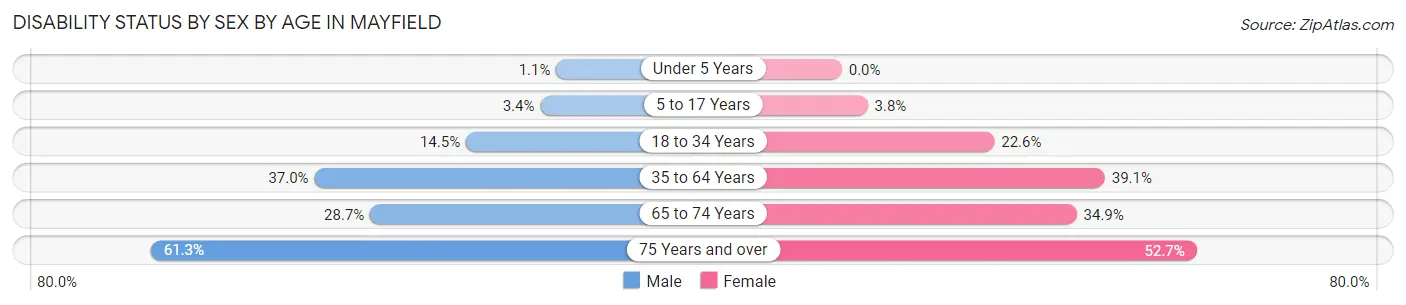
| Age Bracket | Male | Female |
| Under 5 Years | 5 (1.1%) | 0 (0.0%) |
| 5 to 17 Years | 29 (3.4%) | 36 (3.8%) |
| 18 to 34 Years | 162 (14.5%) | 228 (22.6%) |
| 35 to 64 Years | 615 (37.0%) | 703 (39.1%) |
| 65 to 74 Years | 101 (28.7%) | 159 (34.9%) |
| 75 Years and over | 177 (61.3%) | 236 (52.7%) |
Disability Class by Sex by Age in Mayfield
Disability Class: Hearing Difficulty
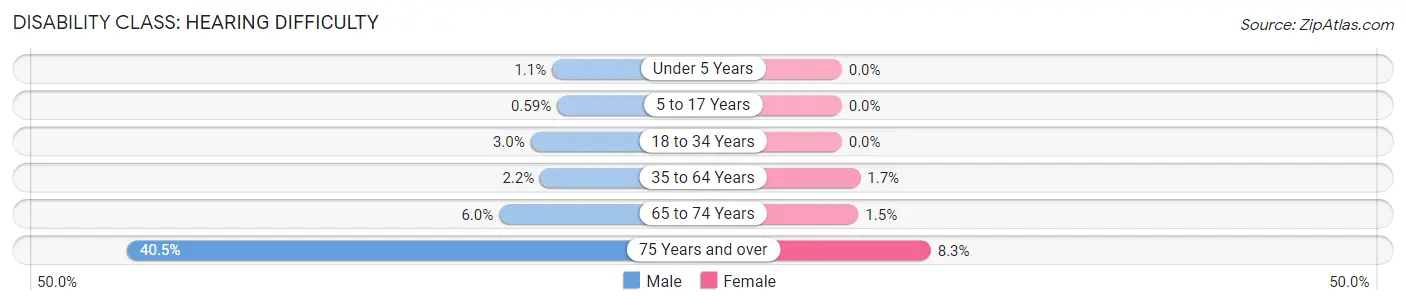
| Age Bracket | Male | Female |
| Under 5 Years | 5 (1.1%) | 0 (0.0%) |
| 5 to 17 Years | 5 (0.6%) | 0 (0.0%) |
| 18 to 34 Years | 34 (3.0%) | 0 (0.0%) |
| 35 to 64 Years | 36 (2.2%) | 31 (1.7%) |
| 65 to 74 Years | 21 (6.0%) | 7 (1.5%) |
| 75 Years and over | 117 (40.5%) | 37 (8.3%) |
Disability Class: Vision Difficulty
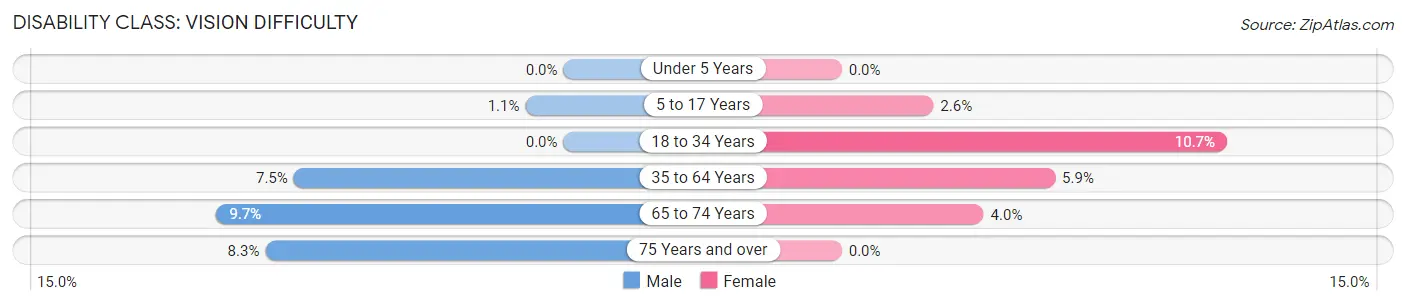
| Age Bracket | Male | Female |
| Under 5 Years | 0 (0.0%) | 0 (0.0%) |
| 5 to 17 Years | 9 (1.1%) | 24 (2.5%) |
| 18 to 34 Years | 0 (0.0%) | 108 (10.7%) |
| 35 to 64 Years | 125 (7.5%) | 107 (5.9%) |
| 65 to 74 Years | 34 (9.7%) | 18 (4.0%) |
| 75 Years and over | 24 (8.3%) | 0 (0.0%) |
Disability Class: Cognitive Difficulty
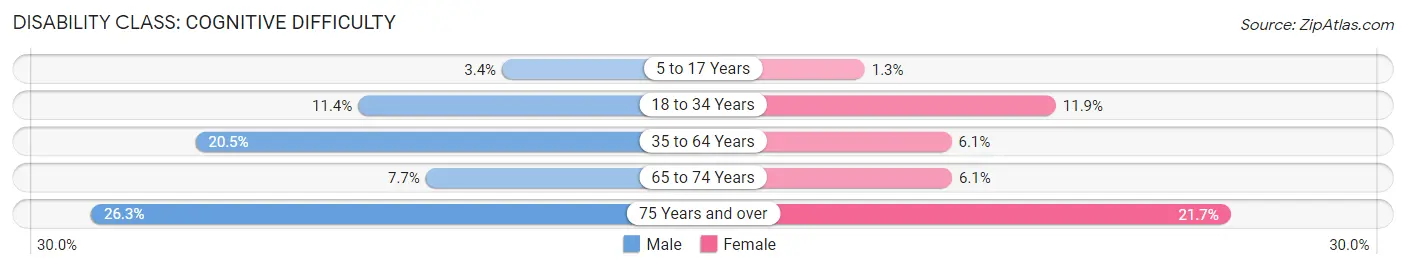
| Age Bracket | Male | Female |
| 5 to 17 Years | 29 (3.4%) | 12 (1.3%) |
| 18 to 34 Years | 128 (11.4%) | 120 (11.9%) |
| 35 to 64 Years | 341 (20.5%) | 110 (6.1%) |
| 65 to 74 Years | 27 (7.7%) | 28 (6.1%) |
| 75 Years and over | 76 (26.3%) | 97 (21.6%) |
Disability Class: Ambulatory Difficulty
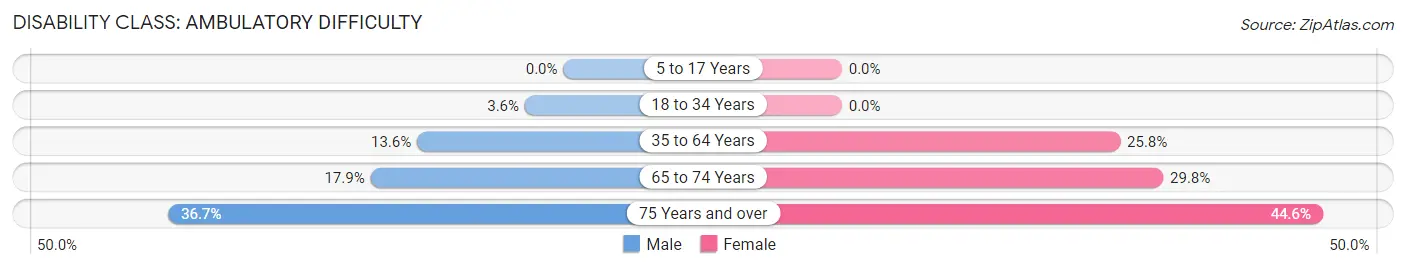
| Age Bracket | Male | Female |
| 5 to 17 Years | 0 (0.0%) | 0 (0.0%) |
| 18 to 34 Years | 40 (3.6%) | 0 (0.0%) |
| 35 to 64 Years | 226 (13.6%) | 465 (25.8%) |
| 65 to 74 Years | 63 (17.9%) | 136 (29.8%) |
| 75 Years and over | 106 (36.7%) | 200 (44.6%) |
Disability Class: Self-Care Difficulty
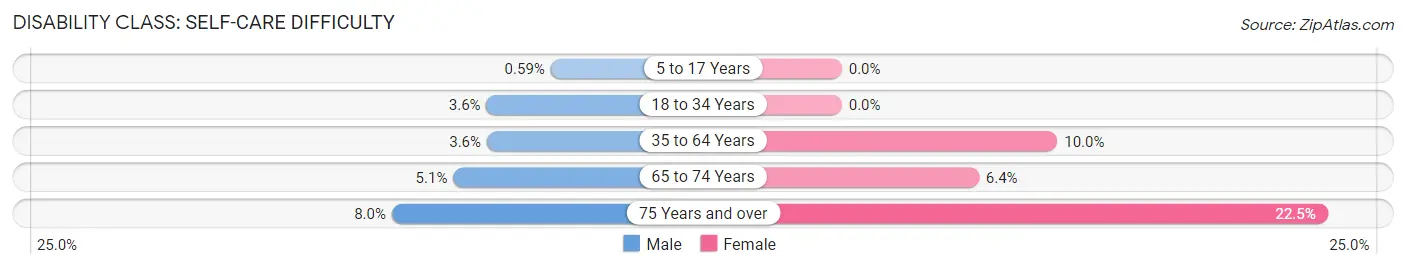
| Age Bracket | Male | Female |
| 5 to 17 Years | 5 (0.6%) | 0 (0.0%) |
| 18 to 34 Years | 40 (3.6%) | 0 (0.0%) |
| 35 to 64 Years | 59 (3.5%) | 180 (10.0%) |
| 65 to 74 Years | 18 (5.1%) | 29 (6.4%) |
| 75 Years and over | 23 (8.0%) | 101 (22.5%) |
Technology Access in Mayfield
Computing Device Access in Mayfield
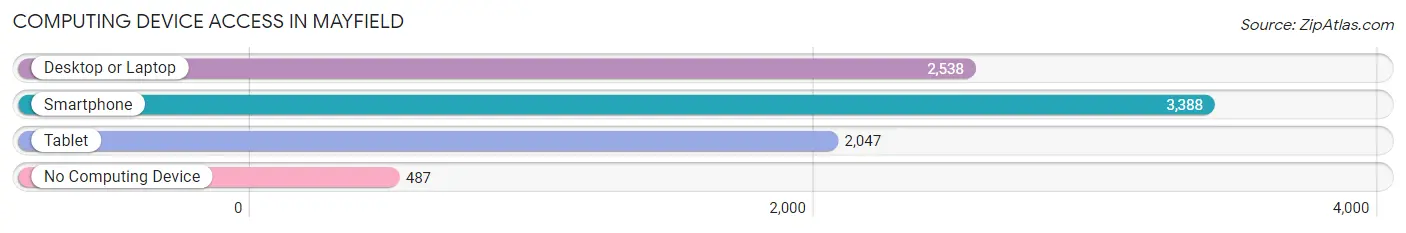
| Device Type | # Households | % Households |
| Desktop or Laptop | 2,538 | 60.8% |
| Smartphone | 3,388 | 81.1% |
| Tablet | 2,047 | 49.0% |
| No Computing Device | 487 | 11.7% |
| Total | 4,175 | 100.0% |
Internet Access in Mayfield
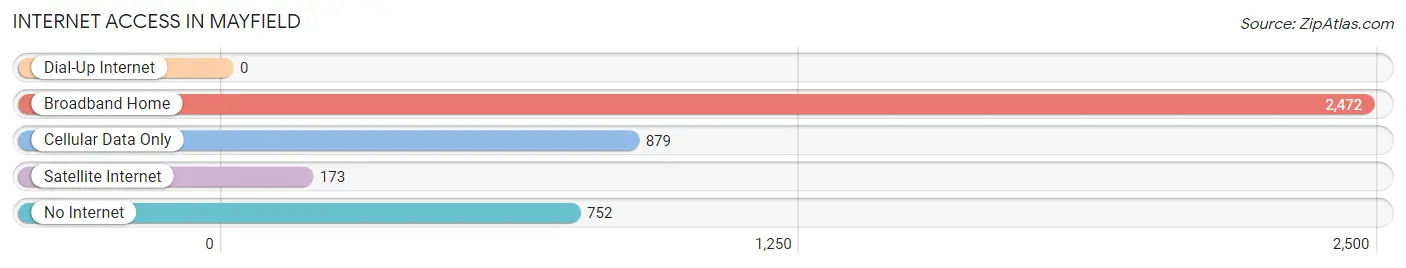
| Internet Type | # Households | % Households |
| Dial-Up Internet | 0 | 0.0% |
| Broadband Home | 2,472 | 59.2% |
| Cellular Data Only | 879 | 21.0% |
| Satellite Internet | 173 | 4.1% |
| No Internet | 752 | 18.0% |
| Total | 4,175 | 100.0% |
Mayfield Summary
Mayfield, Kentucky is a small city located in the western part of the state, in Graves County. It is situated on the banks of the Tennessee River, and is the county seat of Graves County. The city has a population of 10,024, according to the 2010 census.
History
Mayfield was founded in 1821 by William Mayfield, a Revolutionary War veteran. He named the town after himself, and it was incorporated in 1825. The city was an important stop on the stagecoach route between Nashville and New Orleans. During the Civil War, Mayfield was a major supply center for the Confederate Army. After the war, the city experienced a period of growth and prosperity, and by the late 19th century, it was a major center for the tobacco industry.
Geography
Mayfield is located in western Kentucky, in the heart of the Jackson Purchase region. It is situated on the banks of the Tennessee River, and is surrounded by rolling hills and farmland. The city has a total area of 8.3 square miles, of which 8.2 square miles is land and 0.1 square miles is water.
Economy
Mayfield’s economy is largely based on agriculture and manufacturing. The city is home to several large manufacturing plants, including a General Motors plant and a Tyson Foods plant. The city is also home to several large agricultural operations, including a large poultry farm and a large dairy farm. The city is also home to several small businesses, including restaurants, retail stores, and service providers.
Demographics
According to the 2010 census, Mayfield has a population of 10,024. The racial makeup of the city is 79.2% White, 17.7% African American, 0.4% Native American, 0.5% Asian, 0.1% Pacific Islander, 0.7% from other races, and 1.5% from two or more races. The median household income is $30,945, and the median family income is $37,917. The per capita income is $17,845.
Mayfield is a small city with a rich history and a diverse economy. It is home to a variety of businesses and industries, and is a great place to live and work. The city is also home to a variety of cultural and recreational activities, making it a great place to visit and explore.
Common Questions
What is Per Capita Income in Mayfield?
Per Capita income in Mayfield is $26,291.
What is the Median Family Income in Mayfield?
Median Family Income in Mayfield is $57,260.
What is the Median Household income in Mayfield?
Median Household Income in Mayfield is $42,589.
What is Income or Wage Gap in Mayfield?
Income or Wage Gap in Mayfield is 26.2%.
Women in Mayfield earn 73.8 cents for every dollar earned by a man.
What is Family Income Deficit in Mayfield?
Family Income Deficit in Mayfield is $13,931.
Families that are below poverty line in Mayfield earn $13,931 less on average than the poverty threshold level.
What is Inequality or Gini Index in Mayfield?
Inequality or Gini Index in Mayfield is 0.54.
What is the Total Population of Mayfield?
Total Population of Mayfield is 10,011.
What is the Total Male Population of Mayfield?
Total Male Population of Mayfield is 4,890.
What is the Total Female Population of Mayfield?
Total Female Population of Mayfield is 5,121.
What is the Ratio of Males per 100 Females in Mayfield?
There are 95.49 Males per 100 Females in Mayfield.
What is the Ratio of Females per 100 Males in Mayfield?
There are 104.72 Females per 100 Males in Mayfield.
What is the Median Population Age in Mayfield?
Median Population Age in Mayfield is 36.6 Years.
What is the Average Family Size in Mayfield
Average Family Size in Mayfield is 3.2 People.
What is the Average Household Size in Mayfield
Average Household Size in Mayfield is 2.3 People.
How Large is the Labor Force in Mayfield?
There are 4,143 People in the Labor Forcein in Mayfield.
What is the Percentage of People in the Labor Force in Mayfield?
55.1% of People are in the Labor Force in Mayfield.
What is the Unemployment Rate in Mayfield?
Unemployment Rate in Mayfield is 5.3%.