Zip Codes with the Highest Percentage of Population Employed in Accommodation & Food Services in Kentucky
RELATED REPORTS & OPTIONS
Accommodation & Food Services
Kentucky
Compare Zip Codes
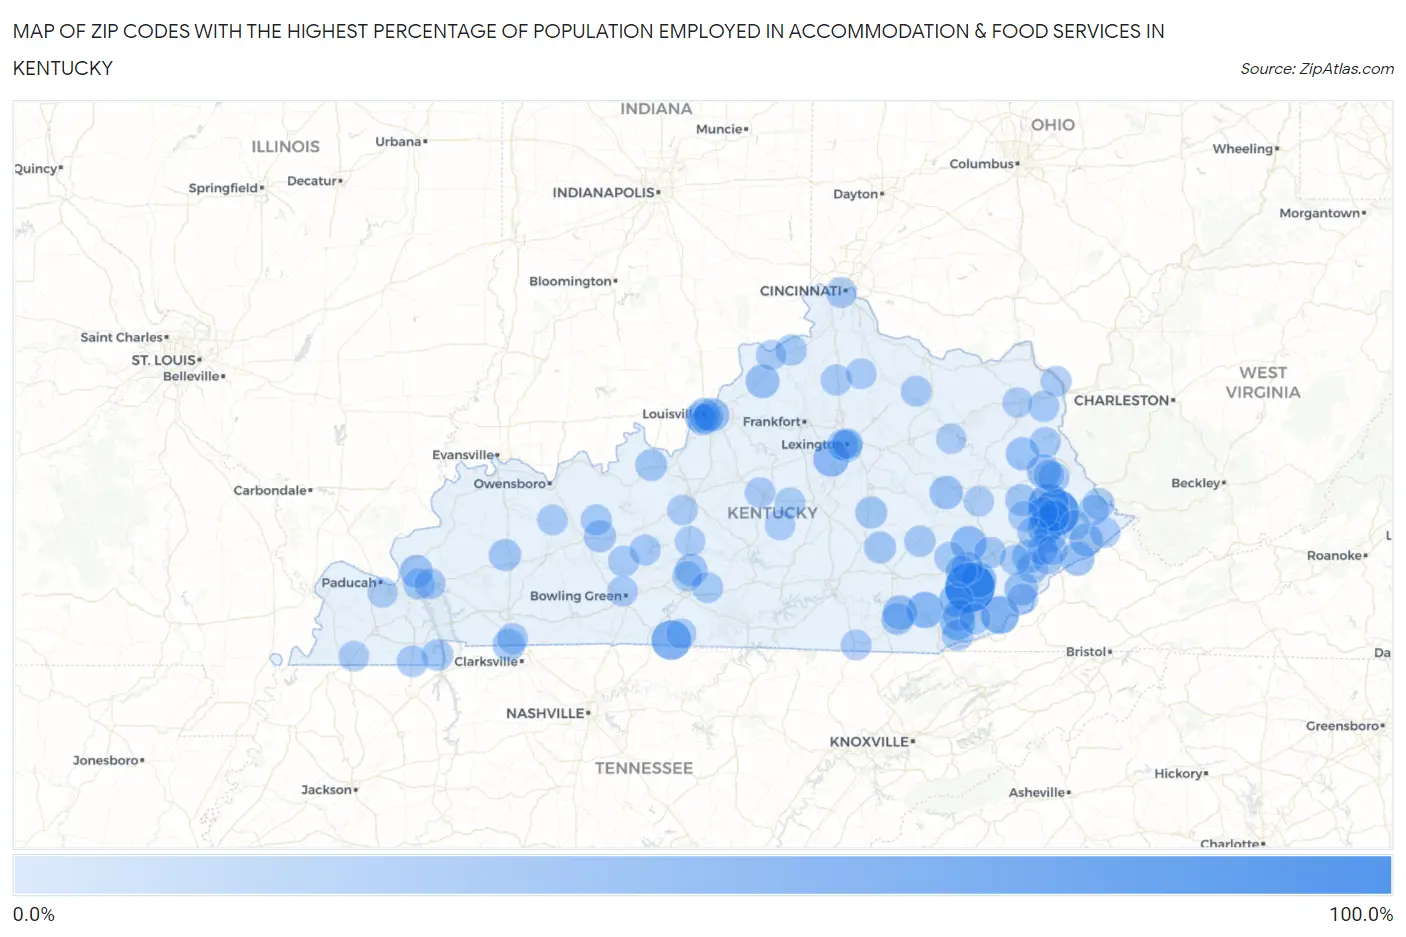
Map of Zip Codes with the Highest Percentage of Population Employed in Accommodation & Food Services in Kentucky
0.0%
100.0%
Zip Codes with the Highest Percentage of Population Employed in Accommodation & Food Services in Kentucky
| Zip Code | % Employed | vs State | vs National | |
| 1. | 40803 | 100.0% | 6.7%(+93.3)#1 | 6.9%(+93.1)#12 |
| 2. | 41663 | 82.9% | 6.7%(+76.3)#2 | 6.9%(+76.0)#26 |
| 3. | 41621 | 57.1% | 6.7%(+50.5)#3 | 6.9%(+50.3)#63 |
| 4. | 42153 | 53.5% | 6.7%(+46.8)#4 | 6.9%(+46.6)#76 |
| 5. | 40847 | 45.2% | 6.7%(+38.5)#5 | 6.9%(+38.3)#126 |
| 6. | 40915 | 38.5% | 6.7%(+31.8)#6 | 6.9%(+31.6)#177 |
| 7. | 40339 | 35.9% | 6.7%(+29.2)#7 | 6.9%(+29.0)#213 |
| 8. | 41655 | 35.0% | 6.7%(+28.3)#8 | 6.9%(+28.1)#222 |
| 9. | 41745 | 34.8% | 6.7%(+28.2)#9 | 6.9%(+27.9)#225 |
| 10. | 41775 | 32.9% | 6.7%(+26.2)#10 | 6.9%(+26.0)#265 |
| 11. | 41651 | 32.4% | 6.7%(+25.7)#11 | 6.9%(+25.5)#275 |
| 12. | 40845 | 32.0% | 6.7%(+25.4)#12 | 6.9%(+25.2)#279 |
| 13. | 40771 | 29.2% | 6.7%(+22.5)#13 | 6.9%(+22.3)#351 |
| 14. | 40913 | 28.3% | 6.7%(+21.6)#14 | 6.9%(+21.4)#378 |
| 15. | 41512 | 26.8% | 6.7%(+20.2)#15 | 6.9%(+19.9)#426 |
| 16. | 41833 | 26.7% | 6.7%(+20.0)#16 | 6.9%(+19.8)#431 |
| 17. | 40070 | 26.3% | 6.7%(+19.6)#17 | 6.9%(+19.4)#447 |
| 18. | 40280 | 25.9% | 6.7%(+19.3)#18 | 6.9%(+19.1)#465 |
| 19. | 41263 | 25.9% | 6.7%(+19.3)#19 | 6.9%(+19.0)#466 |
| 20. | 41365 | 25.2% | 6.7%(+18.5)#20 | 6.9%(+18.3)#494 |
| 21. | 41559 | 25.0% | 6.7%(+18.3)#21 | 6.9%(+18.1)#504 |
| 22. | 41603 | 24.3% | 6.7%(+17.6)#22 | 6.9%(+17.4)#543 |
| 23. | 41226 | 23.7% | 6.7%(+17.0)#23 | 6.9%(+16.8)#576 |
| 24. | 41836 | 23.3% | 6.7%(+16.6)#24 | 6.9%(+16.4)#597 |
| 25. | 42083 | 21.8% | 6.7%(+15.1)#25 | 6.9%(+14.9)#688 |
| 26. | 42749 | 20.7% | 6.7%(+14.0)#26 | 6.9%(+13.8)#767 |
| 27. | 42223 | 19.9% | 6.7%(+13.3)#27 | 6.9%(+13.0)#839 |
| 28. | 40988 | 19.5% | 6.7%(+12.8)#28 | 6.9%(+12.6)#883 |
| 29. | 42349 | 19.3% | 6.7%(+12.6)#29 | 6.9%(+12.4)#913 |
| 30. | 40759 | 19.2% | 6.7%(+12.6)#30 | 6.9%(+12.4)#915 |
| 31. | 42410 | 19.0% | 6.7%(+12.3)#31 | 6.9%(+12.1)#948 |
| 32. | 40445 | 18.7% | 6.7%(+12.0)#32 | 6.9%(+11.8)#988 |
| 33. | 40404 | 18.4% | 6.7%(+11.8)#33 | 6.9%(+11.6)#1,023 |
| 34. | 41464 | 18.3% | 6.7%(+11.6)#34 | 6.9%(+11.4)#1,052 |
| 35. | 41636 | 18.1% | 6.7%(+11.5)#35 | 6.9%(+11.3)#1,071 |
| 36. | 40142 | 18.1% | 6.7%(+11.4)#36 | 6.9%(+11.2)#1,080 |
| 37. | 40526 | 17.9% | 6.7%(+11.2)#37 | 6.9%(+11.0)#1,115 |
| 38. | 41719 | 17.0% | 6.7%(+10.3)#38 | 6.9%(+10.1)#1,266 |
| 39. | 42076 | 16.9% | 6.7%(+10.2)#39 | 6.9%(+10.0)#1,285 |
| 40. | 41766 | 16.9% | 6.7%(+10.2)#40 | 6.9%(+9.99)#1,288 |
| 41. | 40972 | 16.6% | 6.7%(+9.88)#41 | 6.9%(+9.67)#1,341 |
| 42. | 41615 | 16.4% | 6.7%(+9.73)#42 | 6.9%(+9.52)#1,365 |
| 43. | 40856 | 16.3% | 6.7%(+9.67)#43 | 6.9%(+9.46)#1,379 |
| 44. | 42049 | 16.3% | 6.7%(+9.59)#44 | 6.9%(+9.38)#1,401 |
| 45. | 42045 | 16.2% | 6.7%(+9.49)#45 | 6.9%(+9.28)#1,415 |
| 46. | 41527 | 16.1% | 6.7%(+9.46)#46 | 6.9%(+9.25)#1,423 |
| 47. | 40486 | 16.1% | 6.7%(+9.44)#47 | 6.9%(+9.23)#1,429 |
| 48. | 41824 | 15.9% | 6.7%(+9.24)#48 | 6.9%(+9.03)#1,472 |
| 49. | 41714 | 15.7% | 6.7%(+9.04)#49 | 6.9%(+8.83)#1,515 |
| 50. | 40202 | 15.4% | 6.7%(+8.72)#50 | 6.9%(+8.50)#1,580 |
| 51. | 41083 | 15.0% | 6.7%(+8.34)#51 | 6.9%(+8.13)#1,667 |
| 52. | 42361 | 14.9% | 6.7%(+8.23)#52 | 6.9%(+8.02)#1,700 |
| 53. | 40824 | 14.9% | 6.7%(+8.22)#53 | 6.9%(+8.01)#1,705 |
| 54. | 42055 | 14.6% | 6.7%(+7.93)#54 | 6.9%(+7.72)#1,794 |
| 55. | 42262 | 14.5% | 6.7%(+7.80)#55 | 6.9%(+7.59)#1,821 |
| 56. | 41168 | 14.4% | 6.7%(+7.76)#56 | 6.9%(+7.55)#1,836 |
| 57. | 42154 | 14.4% | 6.7%(+7.76)#57 | 6.9%(+7.55)#1,837 |
| 58. | 42275 | 14.4% | 6.7%(+7.69)#58 | 6.9%(+7.48)#1,855 |
| 59. | 41016 | 14.2% | 6.7%(+7.53)#59 | 6.9%(+7.32)#1,902 |
| 60. | 40504 | 14.1% | 6.7%(+7.46)#60 | 6.9%(+7.25)#1,926 |
| 61. | 41010 | 14.1% | 6.7%(+7.43)#61 | 6.9%(+7.22)#1,940 |
| 62. | 41204 | 14.0% | 6.7%(+7.30)#62 | 6.9%(+7.09)#1,979 |
| 63. | 41039 | 13.9% | 6.7%(+7.26)#63 | 6.9%(+7.05)#1,996 |
| 64. | 41812 | 13.9% | 6.7%(+7.22)#64 | 6.9%(+7.01)#2,004 |
| 65. | 42207 | 13.9% | 6.7%(+7.20)#65 | 6.9%(+6.99)#2,010 |
| 66. | 41201 | 13.6% | 6.7%(+6.97)#66 | 6.9%(+6.76)#2,078 |
| 67. | 41828 | 13.3% | 6.7%(+6.63)#67 | 6.9%(+6.42)#2,227 |
| 68. | 41649 | 13.1% | 6.7%(+6.47)#68 | 6.9%(+6.26)#2,289 |
| 69. | 41271 | 13.1% | 6.7%(+6.43)#69 | 6.9%(+6.21)#2,307 |
| 70. | 40807 | 12.8% | 6.7%(+6.12)#70 | 6.9%(+5.91)#2,441 |
| 71. | 41632 | 12.7% | 6.7%(+6.06)#71 | 6.9%(+5.85)#2,469 |
| 72. | 41839 | 12.6% | 6.7%(+5.95)#72 | 6.9%(+5.74)#2,522 |
| 73. | 42649 | 12.6% | 6.7%(+5.92)#73 | 6.9%(+5.71)#2,536 |
| 74. | 41101 | 12.5% | 6.7%(+5.78)#74 | 6.9%(+5.57)#2,616 |
| 75. | 41524 | 12.2% | 6.7%(+5.53)#75 | 6.9%(+5.31)#2,718 |
| 76. | 41519 | 12.2% | 6.7%(+5.49)#76 | 6.9%(+5.27)#2,747 |
| 77. | 40208 | 12.1% | 6.7%(+5.42)#77 | 6.9%(+5.21)#2,780 |
| 78. | 41667 | 12.1% | 6.7%(+5.41)#78 | 6.9%(+5.20)#2,790 |
| 79. | 42352 | 12.0% | 6.7%(+5.36)#79 | 6.9%(+5.15)#2,816 |
| 80. | 42740 | 12.0% | 6.7%(+5.31)#80 | 6.9%(+5.09)#2,844 |
| 81. | 41003 | 12.0% | 6.7%(+5.30)#81 | 6.9%(+5.09)#2,846 |
| 82. | 40507 | 12.0% | 6.7%(+5.30)#82 | 6.9%(+5.09)#2,847 |
| 83. | 42041 | 11.9% | 6.7%(+5.25)#83 | 6.9%(+5.03)#2,890 |
| 84. | 40061 | 11.8% | 6.7%(+5.10)#84 | 6.9%(+4.88)#2,983 |
| 85. | 42101 | 11.7% | 6.7%(+5.03)#85 | 6.9%(+4.82)#3,018 |
| 86. | 40468 | 11.4% | 6.7%(+4.75)#86 | 6.9%(+4.54)#3,216 |
| 87. | 41385 | 11.4% | 6.7%(+4.70)#87 | 6.9%(+4.49)#3,257 |
| 88. | 40009 | 11.2% | 6.7%(+4.54)#88 | 6.9%(+4.33)#3,389 |
| 89. | 41773 | 11.2% | 6.7%(+4.54)#89 | 6.9%(+4.33)#3,390 |
| 90. | 42003 | 11.2% | 6.7%(+4.50)#90 | 6.9%(+4.29)#3,417 |
| 91. | 42713 | 11.2% | 6.7%(+4.49)#91 | 6.9%(+4.28)#3,423 |
| 92. | 41008 | 11.1% | 6.7%(+4.44)#92 | 6.9%(+4.23)#3,452 |
| 93. | 42127 | 11.1% | 6.7%(+4.39)#93 | 6.9%(+4.18)#3,502 |
| 94. | 42133 | 11.1% | 6.7%(+4.39)#94 | 6.9%(+4.18)#3,505 |
| 95. | 40210 | 11.1% | 6.7%(+4.38)#95 | 6.9%(+4.17)#3,509 |
| 96. | 40217 | 11.0% | 6.7%(+4.29)#96 | 6.9%(+4.08)#3,580 |
| 97. | 41143 | 10.9% | 6.7%(+4.23)#97 | 6.9%(+4.02)#3,637 |
| 98. | 41501 | 10.9% | 6.7%(+4.20)#98 | 6.9%(+3.99)#3,665 |
| 99. | 40204 | 10.9% | 6.7%(+4.19)#99 | 6.9%(+3.98)#3,668 |
| 100. | 40371 | 10.7% | 6.7%(+4.06)#100 | 6.9%(+3.85)#3,776 |
Common Questions
What are the Top 10 Zip Codes with the Highest Percentage of Population Employed in Accommodation & Food Services in Kentucky?
Top 10 Zip Codes with the Highest Percentage of Population Employed in Accommodation & Food Services in Kentucky are:
What zip code has the Highest Percentage of Population Employed in Accommodation & Food Services in Kentucky?
40803 has the Highest Percentage of Population Employed in Accommodation & Food Services in Kentucky with 100.0%.
What is the Percentage of Population Employed in Accommodation & Food Services in the State of Kentucky?
Percentage of Population Employed in Accommodation & Food Services in Kentucky is 6.7%.
What is the Percentage of Population Employed in Accommodation & Food Services in the United States?
Percentage of Population Employed in Accommodation & Food Services in the United States is 6.9%.