Ekron, KY Map & Demographics
Ekron Map
Ekron Overview
$19,635
PER CAPITA INCOME
$51,250
AVG FAMILY INCOME
$50,179
AVG HOUSEHOLD INCOME
10.2%
WAGE / INCOME GAP [ % ]
89.8¢/ $1
WAGE / INCOME GAP [ $ ]
$11,338
FAMILY INCOME DEFICIT
0.38
INEQUALITY / GINI INDEX
185
TOTAL POPULATION
82
MALE POPULATION
103
FEMALE POPULATION
79.61
MALES / 100 FEMALES
125.61
FEMALES / 100 MALES
37.7
MEDIAN AGE
3.0
AVG FAMILY SIZE
2.9
AVG HOUSEHOLD SIZE
84
LABOR FORCE [ PEOPLE ]
56.0%
PERCENT IN LABOR FORCE
Ekron Zip Codes
Ekron Area Codes
Income in Ekron
Income Overview in Ekron
Per Capita Income in Ekron is $19,635, while median incomes of families and households are $51,250 and $50,179 respectively.
| Characteristic | Number | Measure |
| Per Capita Income | 185 | $19,635 |
| Median Family Income | 49 | $51,250 |
| Mean Family Income | 49 | $56,018 |
| Median Household Income | 65 | $50,179 |
| Mean Household Income | 65 | $50,745 |
| Income Deficit | 49 | $11,338 |
| Wage / Income Gap (%) | 185 | 10.18% |
| Wage / Income Gap ($) | 185 | 89.82¢ per $1 |
| Gini / Inequality Index | 185 | 0.38 |
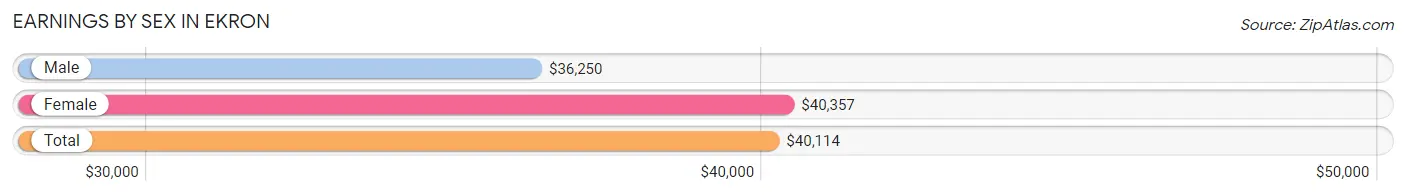
Earnings by Sex in Ekron
Average Earnings in Ekron are $40,114, $36,250 for men and $40,357 for women, a difference of 10.2%.
| Sex | Number | Average Earnings |
| Male | 45 (52.9%) | $36,250 |
| Female | 40 (47.1%) | $40,357 |
| Total | 85 (100.0%) | $40,114 |
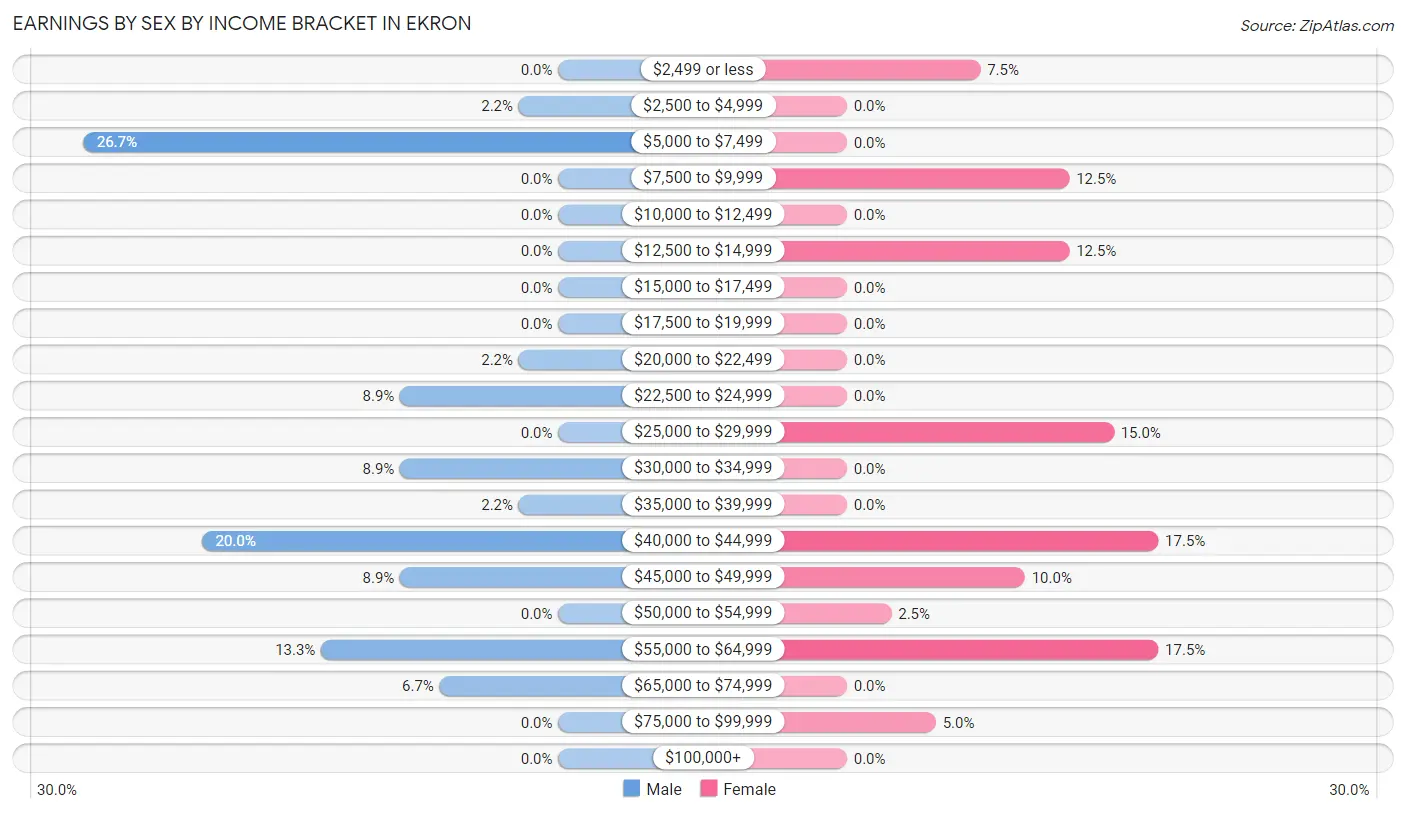
Earnings by Sex by Income Bracket in Ekron
The most common earnings brackets in Ekron are $5,000 to $7,499 for men (12 | 26.7%) and $40,000 to $44,999 for women (7 | 17.5%).
| Income | Male | Female |
| $2,499 or less | 0 (0.0%) | 3 (7.5%) |
| $2,500 to $4,999 | 1 (2.2%) | 0 (0.0%) |
| $5,000 to $7,499 | 12 (26.7%) | 0 (0.0%) |
| $7,500 to $9,999 | 0 (0.0%) | 5 (12.5%) |
| $10,000 to $12,499 | 0 (0.0%) | 0 (0.0%) |
| $12,500 to $14,999 | 0 (0.0%) | 5 (12.5%) |
| $15,000 to $17,499 | 0 (0.0%) | 0 (0.0%) |
| $17,500 to $19,999 | 0 (0.0%) | 0 (0.0%) |
| $20,000 to $22,499 | 1 (2.2%) | 0 (0.0%) |
| $22,500 to $24,999 | 4 (8.9%) | 0 (0.0%) |
| $25,000 to $29,999 | 0 (0.0%) | 6 (15.0%) |
| $30,000 to $34,999 | 4 (8.9%) | 0 (0.0%) |
| $35,000 to $39,999 | 1 (2.2%) | 0 (0.0%) |
| $40,000 to $44,999 | 9 (20.0%) | 7 (17.5%) |
| $45,000 to $49,999 | 4 (8.9%) | 4 (10.0%) |
| $50,000 to $54,999 | 0 (0.0%) | 1 (2.5%) |
| $55,000 to $64,999 | 6 (13.3%) | 7 (17.5%) |
| $65,000 to $74,999 | 3 (6.7%) | 0 (0.0%) |
| $75,000 to $99,999 | 0 (0.0%) | 2 (5.0%) |
| $100,000+ | 0 (0.0%) | 0 (0.0%) |
| Total | 45 (100.0%) | 40 (100.0%) |
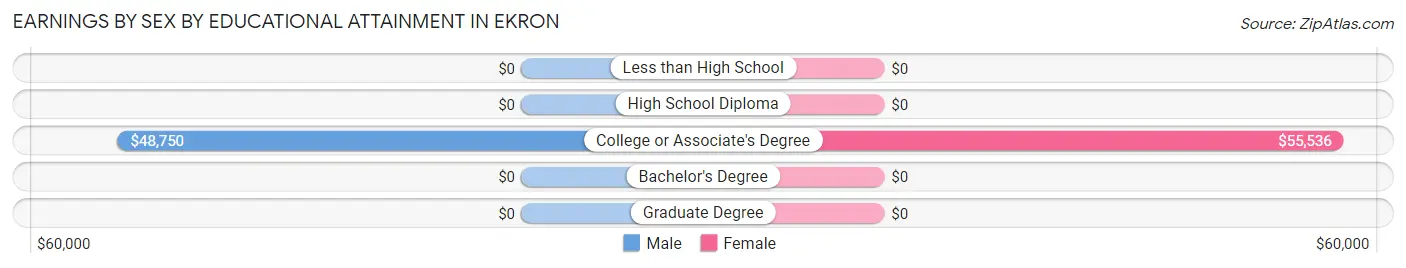
Earnings by Sex by Educational Attainment in Ekron
Average earnings in Ekron are $40,938 for men and $41,250 for women, a difference of 0.8%. Men with an educational attainment of college or associate's degree enjoy the highest average annual earnings of $48,750, while those with college or associate's degree education earn the least with $48,750. Women with an educational attainment of college or associate's degree earn the most with the average annual earnings of $55,536, while those with college or associate's degree education have the smallest earnings of $55,536.
| Educational Attainment | Male Income | Female Income |
| Less than High School | - | - |
| High School Diploma | - | - |
| College or Associate's Degree | $48,750 | $55,536 |
| Bachelor's Degree | - | - |
| Graduate Degree | - | - |
| Total | $40,938 | $41,250 |
Family Income in Ekron
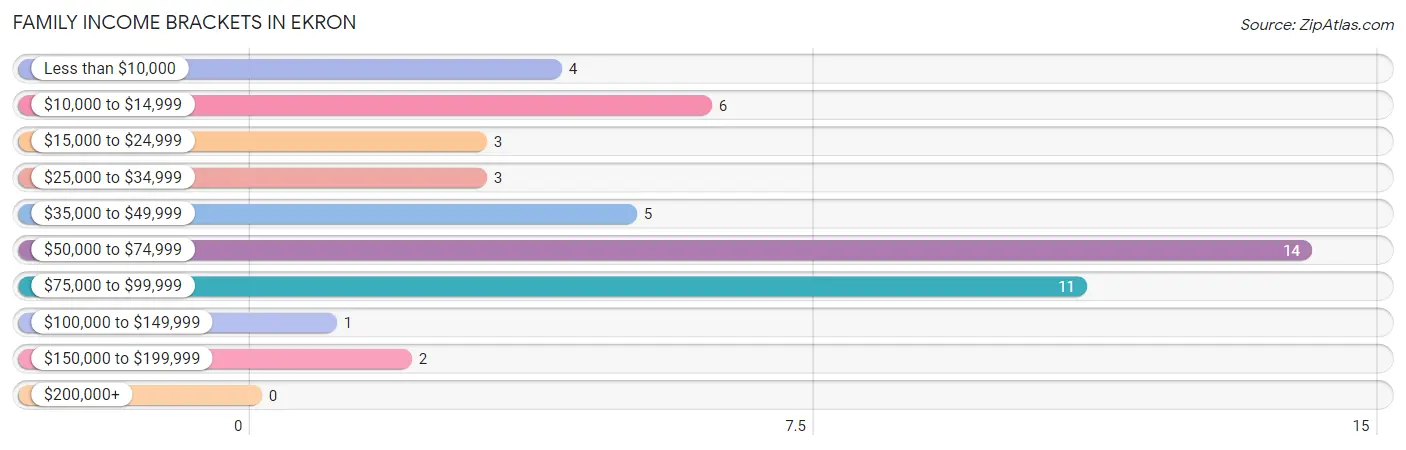
Family Income Brackets in Ekron
According to the Ekron family income data, there are 14 families falling into the $50,000 to $74,999 income range, which is the most common income bracket and makes up 28.6% of all families.
| Income Bracket | # Families | % Families |
| Less than $10,000 | 4 | 8.2% |
| $10,000 to $14,999 | 6 | 12.2% |
| $15,000 to $24,999 | 3 | 6.1% |
| $25,000 to $34,999 | 3 | 6.1% |
| $35,000 to $49,999 | 5 | 10.2% |
| $50,000 to $74,999 | 14 | 28.6% |
| $75,000 to $99,999 | 11 | 22.4% |
| $100,000 to $149,999 | 1 | 2.0% |
| $150,000 to $199,999 | 2 | 4.1% |
| $200,000+ | 0 | 0.0% |
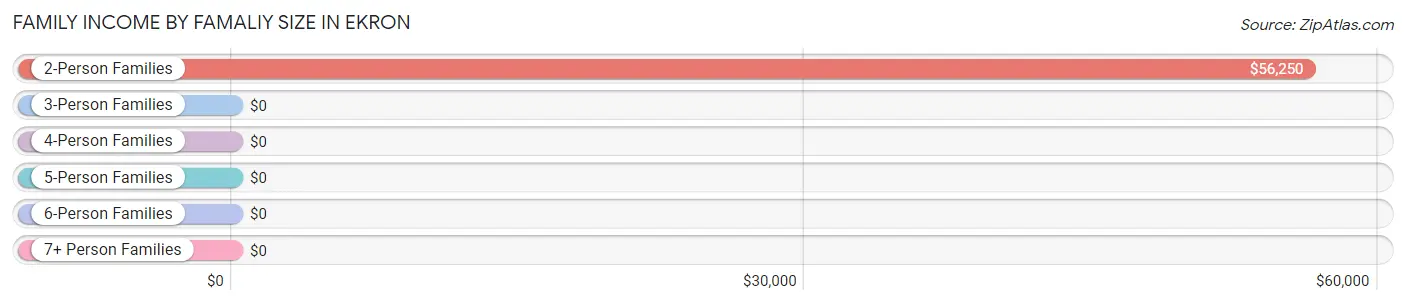
Family Income by Famaliy Size in Ekron
2-person families (28 | 57.1%) account for the highest median family income in Ekron with $56,250 per family, while 2-person families (28 | 57.1%) have the highest median income of $28,125 per family member.
| Income Bracket | # Families | Median Income |
| 2-Person Families | 28 (57.1%) | $56,250 |
| 3-Person Families | 9 (18.4%) | $0 |
| 4-Person Families | 5 (10.2%) | $0 |
| 5-Person Families | 7 (14.3%) | $0 |
| 6-Person Families | 0 (0.0%) | $0 |
| 7+ Person Families | 0 (0.0%) | $0 |
| Total | 49 (100.0%) | $51,250 |
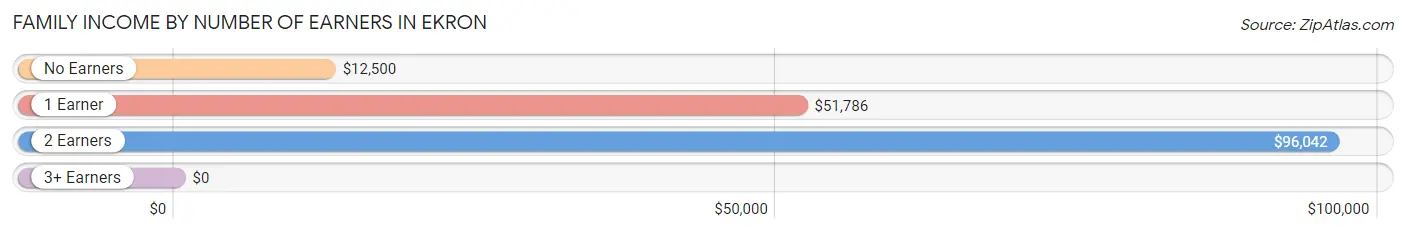
Family Income by Number of Earners in Ekron
| Number of Earners | # Families | Median Income |
| No Earners | 14 (28.6%) | $12,500 |
| 1 Earner | 20 (40.8%) | $51,786 |
| 2 Earners | 15 (30.6%) | $96,042 |
| 3+ Earners | 0 (0.0%) | $0 |
| Total | 49 (100.0%) | $51,250 |
Household Income in Ekron
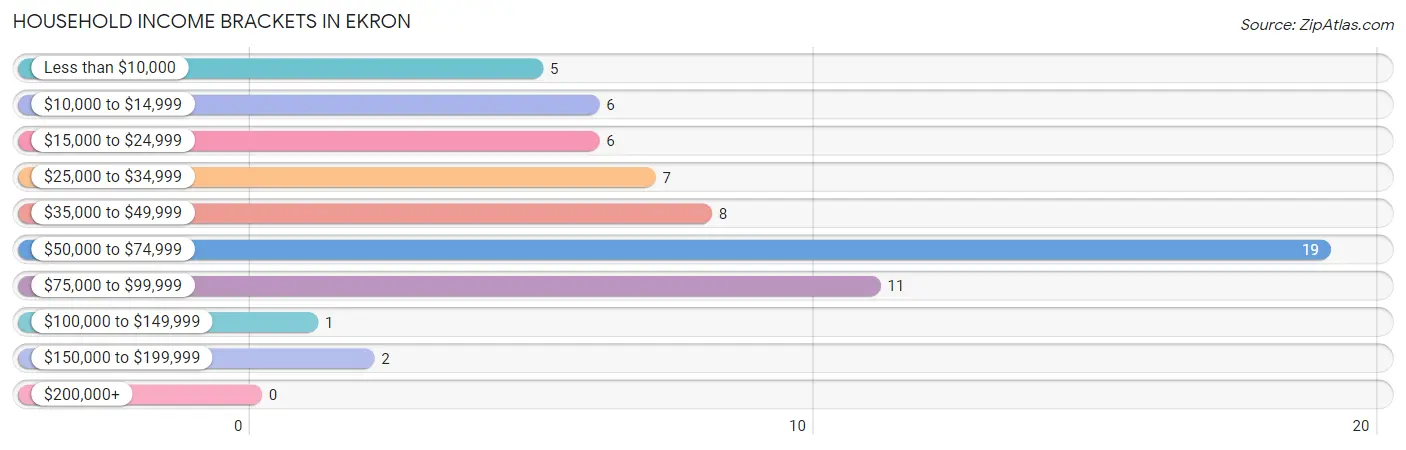
Household Income Brackets in Ekron
With 19 households falling in the category, the $50,000 to $74,999 income range is the most frequent in Ekron, accounting for 29.2% of all households.
| Income Bracket | # Households | % Households |
| Less than $10,000 | 5 | 7.7% |
| $10,000 to $14,999 | 6 | 9.2% |
| $15,000 to $24,999 | 6 | 9.2% |
| $25,000 to $34,999 | 7 | 10.8% |
| $35,000 to $49,999 | 8 | 12.3% |
| $50,000 to $74,999 | 19 | 29.2% |
| $75,000 to $99,999 | 11 | 16.9% |
| $100,000 to $149,999 | 1 | 1.5% |
| $150,000 to $199,999 | 2 | 3.1% |
| $200,000+ | 0 | 0.0% |
Household Income by Householder Age in Ekron
The median household income in Ekron is $50,179, with the highest median household income of $51,786 found in the 25 to 44 years age bracket for the primary householder. A total of 34 households (52.3%) fall into this category.
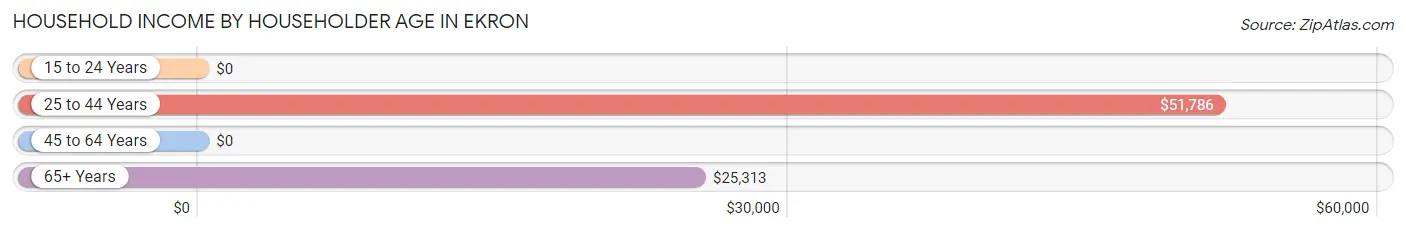
| Income Bracket | # Households | Median Income |
| 15 to 24 Years | 0 (0.0%) | $0 |
| 25 to 44 Years | 34 (52.3%) | $51,786 |
| 45 to 64 Years | 18 (27.7%) | $0 |
| 65+ Years | 13 (20.0%) | $25,313 |
| Total | 65 (100.0%) | $50,179 |
Poverty in Ekron
Income Below Poverty by Sex and Age in Ekron
With 24.0% poverty level for males and 34.9% for females among the residents of Ekron, 6 to 11 year old males and under 5 year old females are the most vulnerable to poverty, with 4 males (100.0%) and 4 females (100.0%) in their respective age groups living below the poverty level.
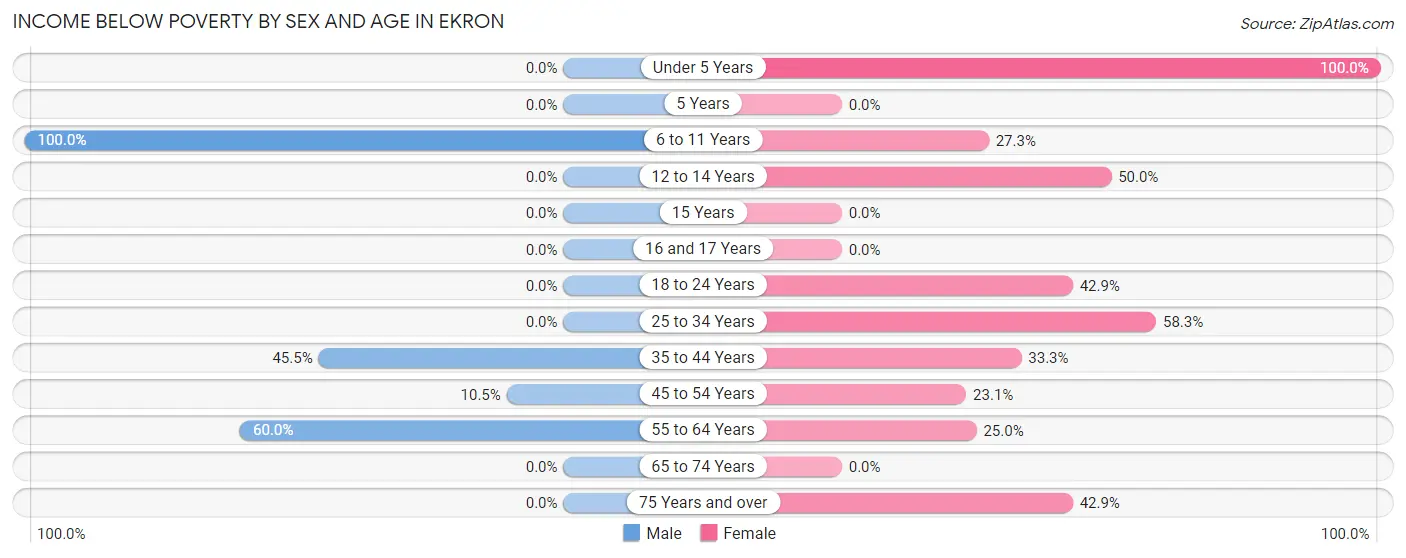
| Age Bracket | Male | Female |
| Under 5 Years | 0 (0.0%) | 4 (100.0%) |
| 5 Years | 0 (0.0%) | 0 (0.0%) |
| 6 to 11 Years | 4 (100.0%) | 3 (27.3%) |
| 12 to 14 Years | 0 (0.0%) | 3 (50.0%) |
| 15 Years | 0 (0.0%) | 0 (0.0%) |
| 16 and 17 Years | 0 (0.0%) | 0 (0.0%) |
| 18 to 24 Years | 0 (0.0%) | 6 (42.9%) |
| 25 to 34 Years | 0 (0.0%) | 7 (58.3%) |
| 35 to 44 Years | 10 (45.5%) | 6 (33.3%) |
| 45 to 54 Years | 2 (10.5%) | 3 (23.1%) |
| 55 to 64 Years | 3 (60.0%) | 1 (25.0%) |
| 65 to 74 Years | 0 (0.0%) | 0 (0.0%) |
| 75 Years and over | 0 (0.0%) | 3 (42.9%) |
| Total | 19 (24.0%) | 36 (34.9%) |
Income Above Poverty by Sex and Age in Ekron
According to the poverty statistics in Ekron, males aged 5 years and females aged 5 years are the age groups that are most secure financially, with 100.0% of males and 100.0% of females in these age groups living above the poverty line.
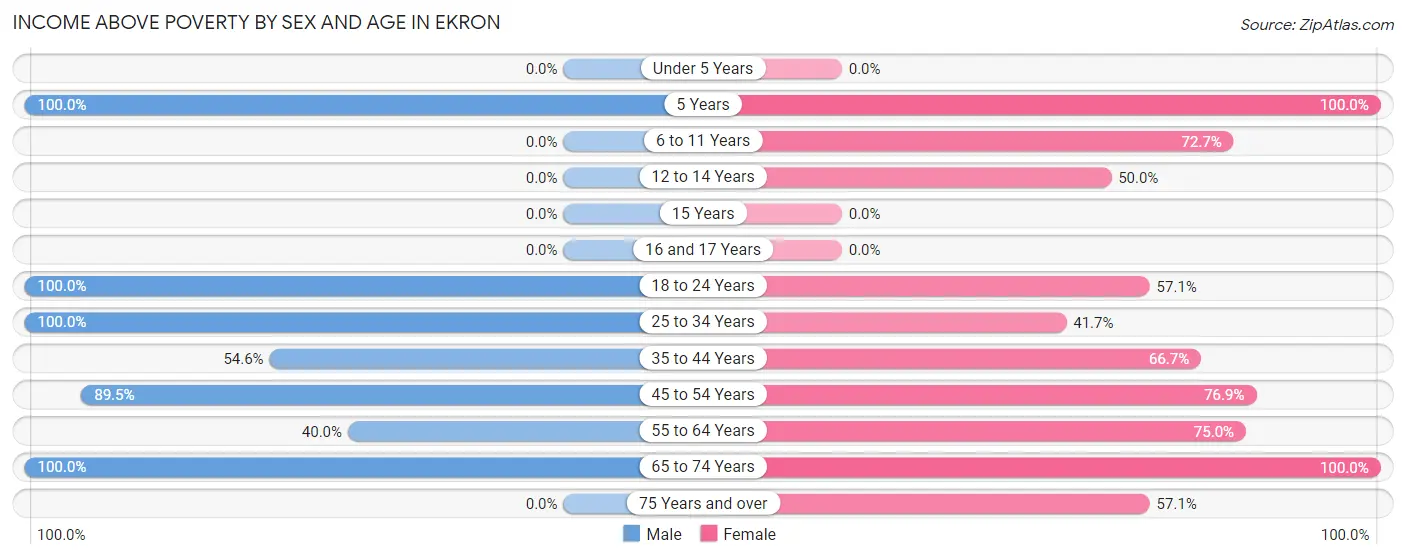
| Age Bracket | Male | Female |
| Under 5 Years | 0 (0.0%) | 0 (0.0%) |
| 5 Years | 1 (100.0%) | 6 (100.0%) |
| 6 to 11 Years | 0 (0.0%) | 8 (72.7%) |
| 12 to 14 Years | 0 (0.0%) | 3 (50.0%) |
| 15 Years | 0 (0.0%) | 0 (0.0%) |
| 16 and 17 Years | 0 (0.0%) | 0 (0.0%) |
| 18 to 24 Years | 15 (100.0%) | 8 (57.1%) |
| 25 to 34 Years | 8 (100.0%) | 5 (41.7%) |
| 35 to 44 Years | 12 (54.5%) | 12 (66.7%) |
| 45 to 54 Years | 17 (89.5%) | 10 (76.9%) |
| 55 to 64 Years | 2 (40.0%) | 3 (75.0%) |
| 65 to 74 Years | 5 (100.0%) | 8 (100.0%) |
| 75 Years and over | 0 (0.0%) | 4 (57.1%) |
| Total | 60 (75.9%) | 67 (65.0%) |
Income Below Poverty Among Married-Couple Families in Ekron
The poverty statistics for married-couple families in Ekron show that 16.7% or 5 of the total 30 families live below the poverty line. Families with 1 or 2 children have the highest poverty rate of 50.0%, comprising of 4 families. On the other hand, families with no children have the lowest poverty rate of 4.5%, which includes 1 families.
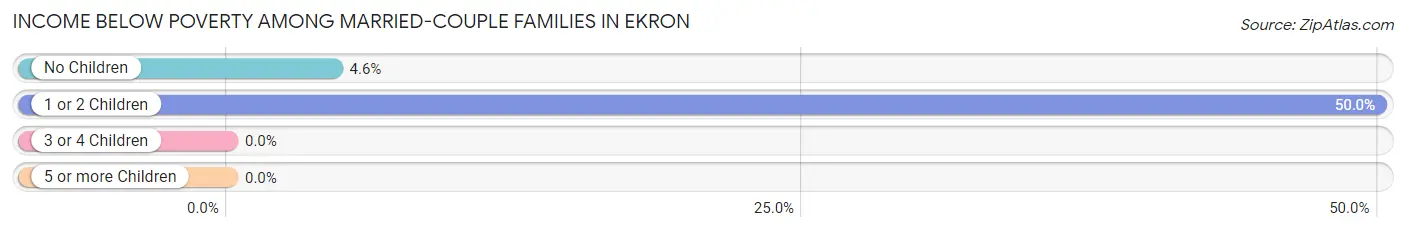
| Children | Above Poverty | Below Poverty |
| No Children | 21 (95.5%) | 1 (4.5%) |
| 1 or 2 Children | 4 (50.0%) | 4 (50.0%) |
| 3 or 4 Children | 0 (0.0%) | 0 (0.0%) |
| 5 or more Children | 0 (0.0%) | 0 (0.0%) |
| Total | 25 (83.3%) | 5 (16.7%) |
Income Below Poverty Among Single-Parent Households in Ekron
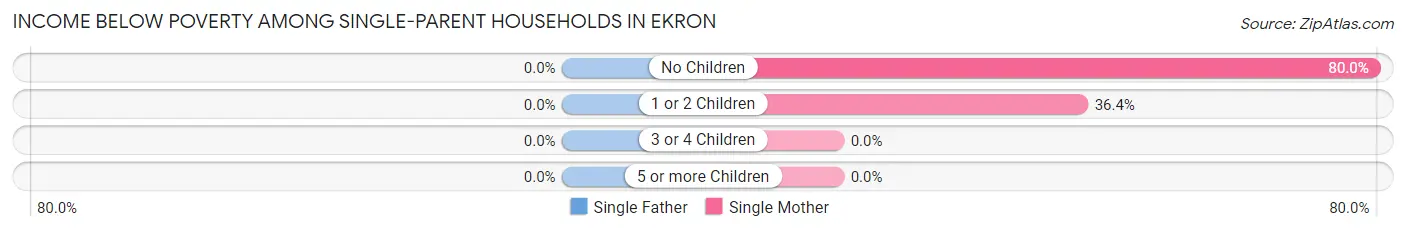
| Children | Single Father | Single Mother |
| No Children | 0 (0.0%) | 4 (80.0%) |
| 1 or 2 Children | 0 (0.0%) | 4 (36.4%) |
| 3 or 4 Children | 0 (0.0%) | 0 (0.0%) |
| 5 or more Children | 0 (0.0%) | 0 (0.0%) |
| Total | 0 (0.0%) | 8 (50.0%) |
Income Below Poverty Among Married-Couple vs Single-Parent Households in Ekron
The poverty data for Ekron shows that 5 of the married-couple family households (16.7%) and 8 of the single-parent households (42.1%) are living below the poverty level. Within the married-couple family households, those with 1 or 2 children have the highest poverty rate, with 4 households (50.0%) falling below the poverty line. Among the single-parent households, those with no children have the highest poverty rate, with 4 household (50.0%) living below poverty.
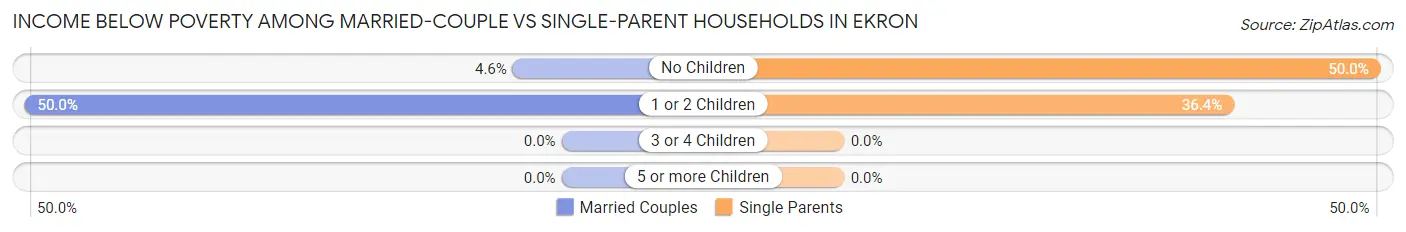
| Children | Married-Couple Families | Single-Parent Households |
| No Children | 1 (4.5%) | 4 (50.0%) |
| 1 or 2 Children | 4 (50.0%) | 4 (36.4%) |
| 3 or 4 Children | 0 (0.0%) | 0 (0.0%) |
| 5 or more Children | 0 (0.0%) | 0 (0.0%) |
| Total | 5 (16.7%) | 8 (42.1%) |
Race in Ekron
The most populous races in Ekron are White / Caucasian (181 | 97.8%), Hispanic or Latino (4 | 2.2%), and Two or more Races (4 | 2.2%).
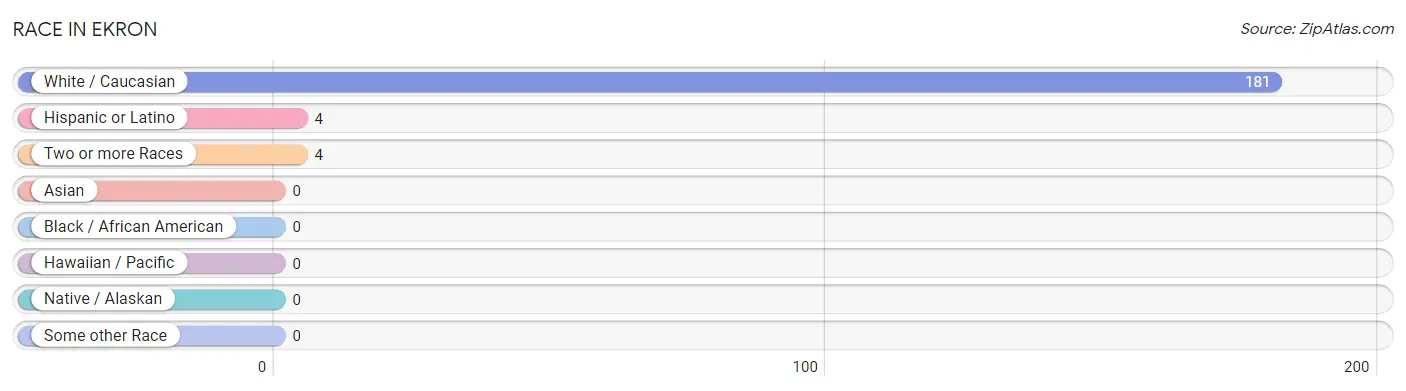
| Race | # Population | % Population |
| Asian | 0 | 0.0% |
| Black / African American | 0 | 0.0% |
| Hawaiian / Pacific | 0 | 0.0% |
| Hispanic or Latino | 4 | 2.2% |
| Native / Alaskan | 0 | 0.0% |
| White / Caucasian | 181 | 97.8% |
| Two or more Races | 4 | 2.2% |
| Some other Race | 0 | 0.0% |
| Total | 185 | 100.0% |
Ancestry in Ekron
The most populous ancestries reported in Ekron are Irish (89 | 48.1%), German (21 | 11.4%), English (12 | 6.5%), American (10 | 5.4%), and European (9 | 4.9%), together accounting for 76.2% of all Ekron residents.
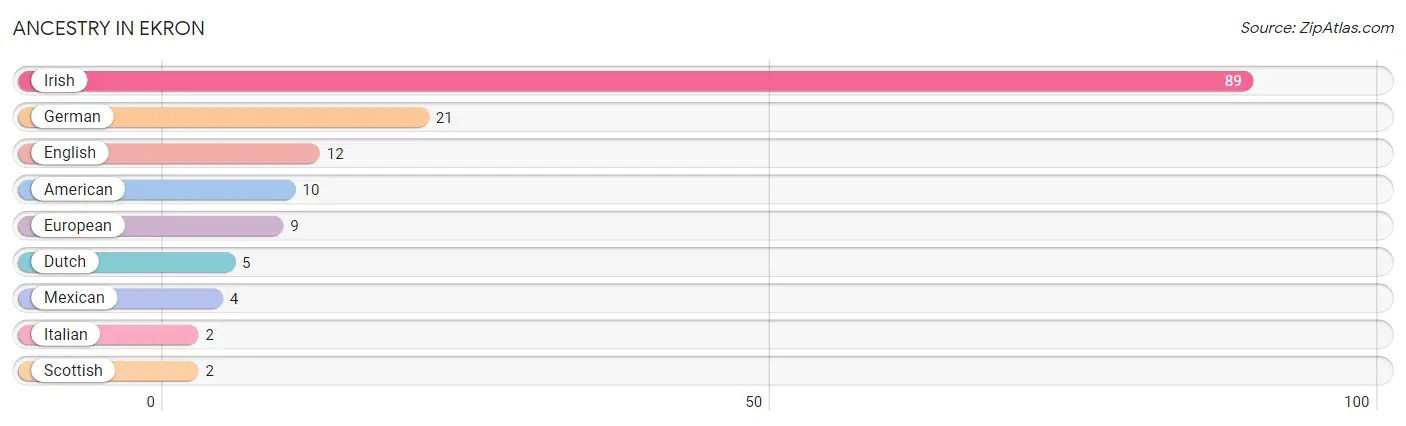
| Ancestry | # Population | % Population |
| American | 10 | 5.4% |
| Dutch | 5 | 2.7% |
| English | 12 | 6.5% |
| European | 9 | 4.9% |
| German | 21 | 11.4% |
| Irish | 89 | 48.1% |
| Italian | 2 | 1.1% |
| Mexican | 4 | 2.2% |
| Scottish | 2 | 1.1% | View All 9 Rows |
Immigrants in Ekron

| Immigration Origin | # Population | % Population | View All 0 Rows |
Sex and Age in Ekron
Sex and Age in Ekron
The most populous age groups in Ekron are 45 to 49 Years (16 | 19.5%) for men and 5 to 9 Years (13 | 12.6%) for women.
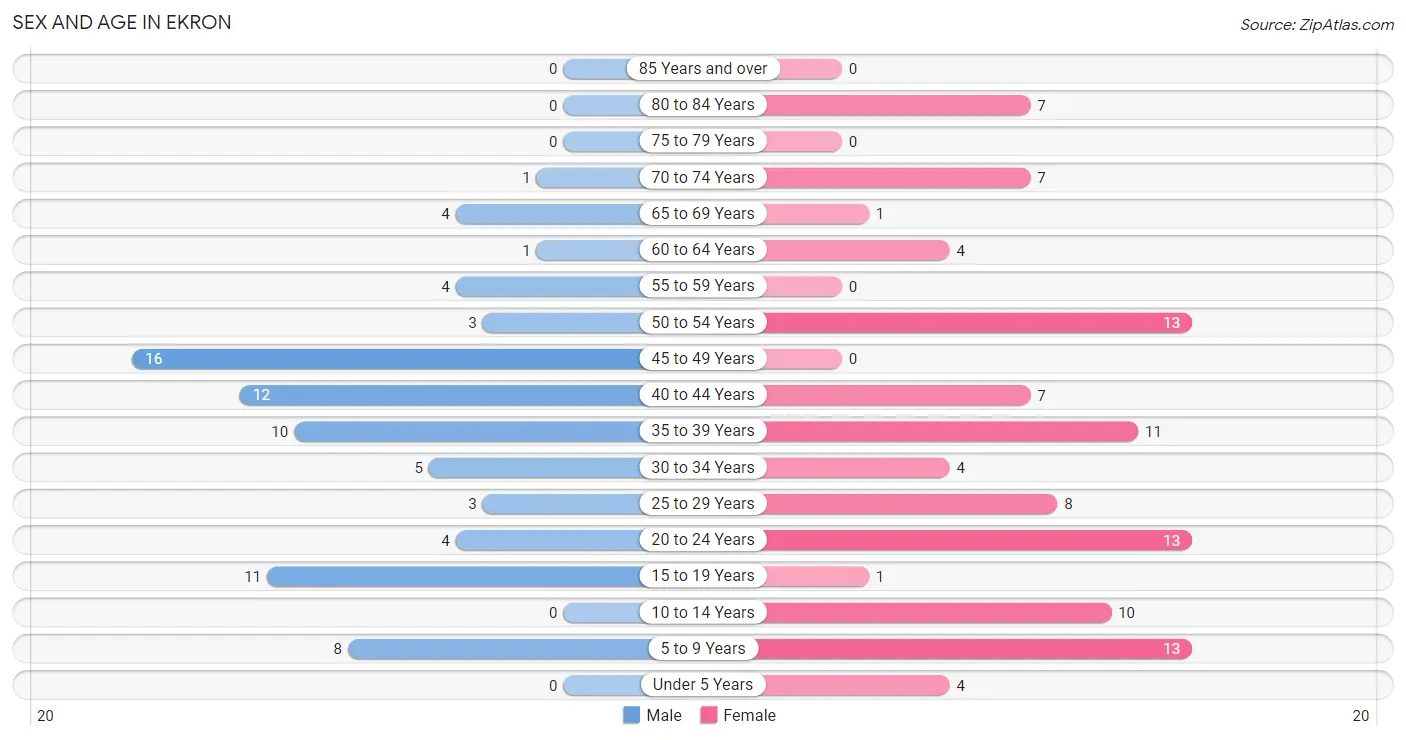
| Age Bracket | Male | Female |
| Under 5 Years | 0 (0.0%) | 4 (3.9%) |
| 5 to 9 Years | 8 (9.8%) | 13 (12.6%) |
| 10 to 14 Years | 0 (0.0%) | 10 (9.7%) |
| 15 to 19 Years | 11 (13.4%) | 1 (1.0%) |
| 20 to 24 Years | 4 (4.9%) | 13 (12.6%) |
| 25 to 29 Years | 3 (3.7%) | 8 (7.8%) |
| 30 to 34 Years | 5 (6.1%) | 4 (3.9%) |
| 35 to 39 Years | 10 (12.2%) | 11 (10.7%) |
| 40 to 44 Years | 12 (14.6%) | 7 (6.8%) |
| 45 to 49 Years | 16 (19.5%) | 0 (0.0%) |
| 50 to 54 Years | 3 (3.7%) | 13 (12.6%) |
| 55 to 59 Years | 4 (4.9%) | 0 (0.0%) |
| 60 to 64 Years | 1 (1.2%) | 4 (3.9%) |
| 65 to 69 Years | 4 (4.9%) | 1 (1.0%) |
| 70 to 74 Years | 1 (1.2%) | 7 (6.8%) |
| 75 to 79 Years | 0 (0.0%) | 0 (0.0%) |
| 80 to 84 Years | 0 (0.0%) | 7 (6.8%) |
| 85 Years and over | 0 (0.0%) | 0 (0.0%) |
| Total | 82 (100.0%) | 103 (100.0%) |
Families and Households in Ekron
Median Family Size in Ekron
The median family size in Ekron is 2.98 persons per family, with single female/mother families (16 | 32.7%) accounting for the largest median family size of 3.88 persons per family. On the other hand, single male/father families (3 | 6.1%) represent the smallest median family size with 2.00 persons per family.
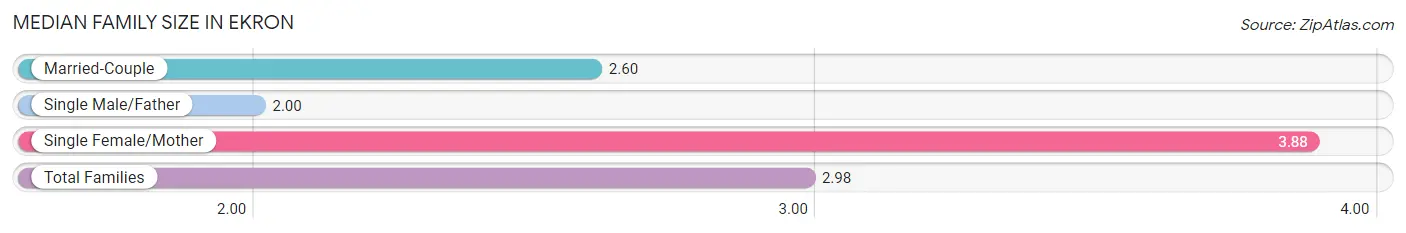
| Family Type | # Families | Family Size |
| Married-Couple | 30 (61.2%) | 2.60 |
| Single Male/Father | 3 (6.1%) | 2.00 |
| Single Female/Mother | 16 (32.7%) | 3.88 |
| Total Families | 49 (100.0%) | 2.98 |
Median Household Size in Ekron
The median household size in Ekron is 2.85 persons per household, with single female/mother households (16 | 24.6%) accounting for the largest median household size of 4.13 persons per household. single male/father households (3 | 4.6%) represent the smallest median household size with 2.00 persons per household.
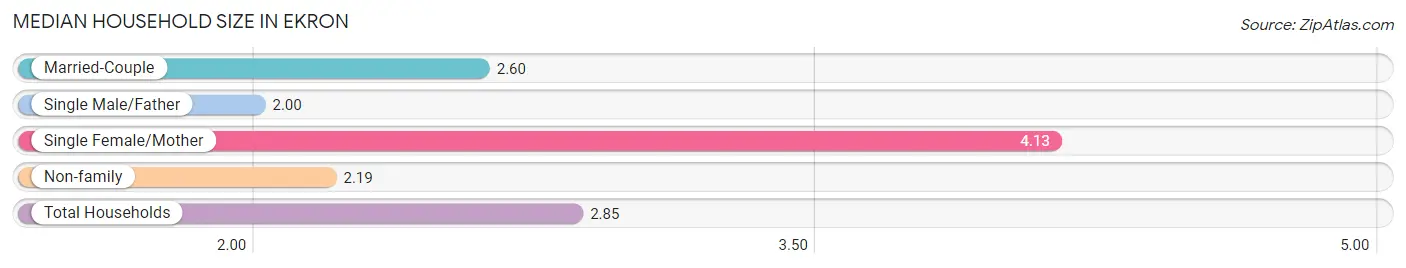
| Household Type | # Households | Household Size |
| Married-Couple | 30 (46.2%) | 2.60 |
| Single Male/Father | 3 (4.6%) | 2.00 |
| Single Female/Mother | 16 (24.6%) | 4.13 |
| Non-family | 16 (24.6%) | 2.19 |
| Total Households | 65 (100.0%) | 2.85 |
Household Size by Marriage Status in Ekron
Out of a total of 65 households in Ekron, 49 (75.4%) are family households, while 16 (24.6%) are nonfamily households. The most numerous type of family households are 2-person households, comprising 28, and the most common type of nonfamily households are 1-person households, comprising 12.
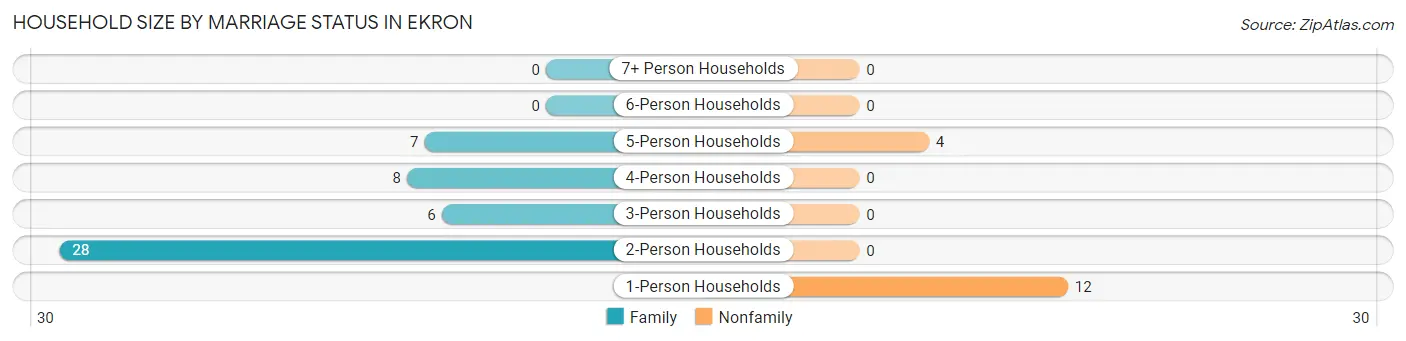
| Household Size | Family Households | Nonfamily Households |
| 1-Person Households | - | 12 (18.5%) |
| 2-Person Households | 28 (43.1%) | 0 (0.0%) |
| 3-Person Households | 6 (9.2%) | 0 (0.0%) |
| 4-Person Households | 8 (12.3%) | 0 (0.0%) |
| 5-Person Households | 7 (10.8%) | 4 (6.1%) |
| 6-Person Households | 0 (0.0%) | 0 (0.0%) |
| 7+ Person Households | 0 (0.0%) | 0 (0.0%) |
| Total | 49 (75.4%) | 16 (24.6%) |
Female Fertility in Ekron
Fertility by Age in Ekron
| Age Bracket | Women with Births | Births / 1,000 Women |
| 15 to 19 years | 0 (0.0%) | 0.0 |
| 20 to 34 years | 0 (0.0%) | 0.0 |
| 35 to 50 years | 0 (0.0%) | 0.0 |
| Total | 0 (0.0%) | 0.0 |
Fertility by Age by Marriage Status in Ekron
| Age Bracket | Married | Unmarried |
| 15 to 19 years | 0 (0.0%) | 0 (0.0%) |
| 20 to 34 years | 0 (0.0%) | 0 (0.0%) |
| 35 to 50 years | 0 (0.0%) | 0 (0.0%) |
| Total | 0 (0.0%) | 0 (0.0%) |
Fertility by Education in Ekron
| Educational Attainment | Women with Births | Births / 1,000 Women |
| Less than High School | 0 (0.0%) | 0.0 |
| High School Diploma | 0 (0.0%) | 0.0 |
| College or Associate's Degree | 0 (0.0%) | 0.0 |
| Bachelor's Degree | 0 (0.0%) | 0.0 |
| Graduate Degree | 0 (0.0%) | 0.0 |
| Total | 0 (0.0%) | 0.0 |
Fertility by Education by Marriage Status in Ekron
| Educational Attainment | Married | Unmarried |
| Less than High School | 0 (0.0%) | 0 (0.0%) |
| High School Diploma | 0 (0.0%) | 0 (0.0%) |
| College or Associate's Degree | 0 (0.0%) | 0 (0.0%) |
| Bachelor's Degree | 0 (0.0%) | 0 (0.0%) |
| Graduate Degree | 0 (0.0%) | 0 (0.0%) |
| Total | 0 (0.0%) | 0 (0.0%) |
Employment Characteristics in Ekron
Employment by Class of Employer in Ekron
Among the 81 employed individuals in Ekron, private company employees (65 | 80.2%), state government employees (10 | 12.3%), and self-employed (not incorporated) (4 | 4.9%) make up the most common classes of employment.
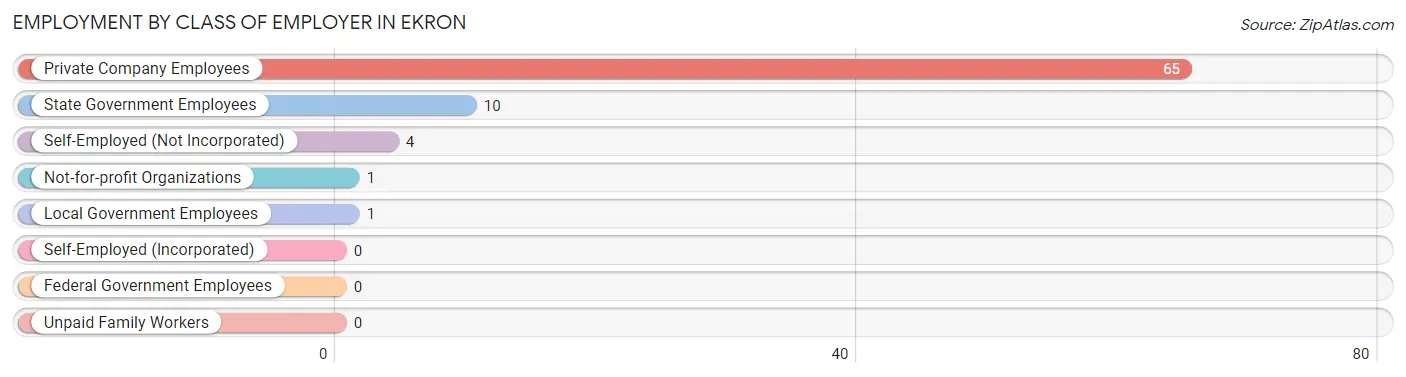
| Employer Class | # Employees | % Employees |
| Private Company Employees | 65 | 80.2% |
| Self-Employed (Incorporated) | 0 | 0.0% |
| Self-Employed (Not Incorporated) | 4 | 4.9% |
| Not-for-profit Organizations | 1 | 1.2% |
| Local Government Employees | 1 | 1.2% |
| State Government Employees | 10 | 12.3% |
| Federal Government Employees | 0 | 0.0% |
| Unpaid Family Workers | 0 | 0.0% |
| Total | 81 | 100.0% |
Employment Status by Age in Ekron
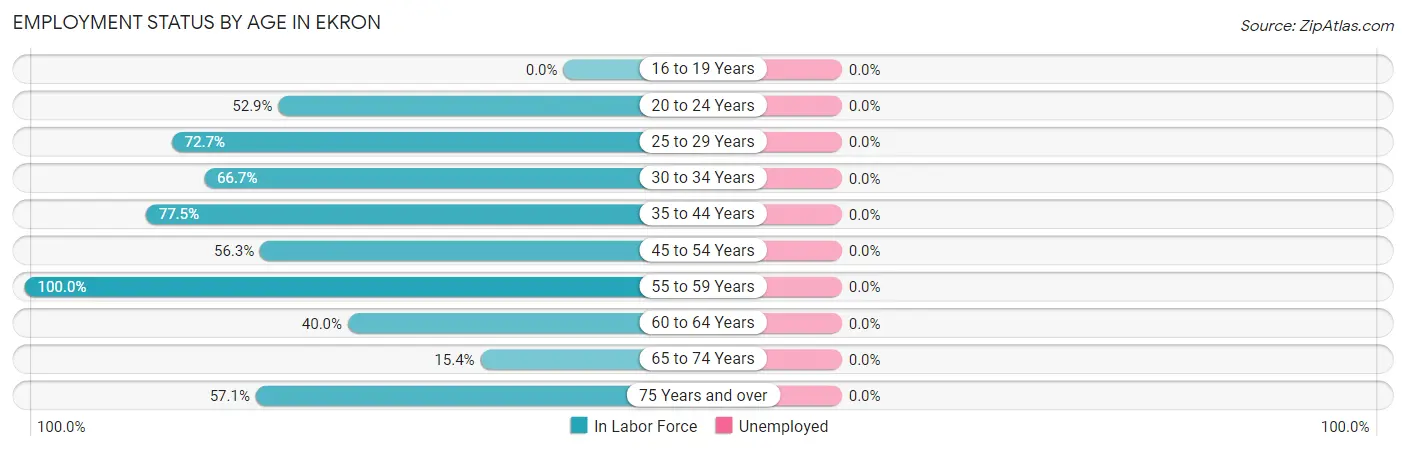
| Age Bracket | In Labor Force | Unemployed |
| 16 to 19 Years | 0 (0.0%) | 0 (0.0%) |
| 20 to 24 Years | 9 (52.9%) | 0 (0.0%) |
| 25 to 29 Years | 8 (72.7%) | 0 (0.0%) |
| 30 to 34 Years | 6 (66.7%) | 0 (0.0%) |
| 35 to 44 Years | 31 (77.5%) | 0 (0.0%) |
| 45 to 54 Years | 18 (56.3%) | 0 (0.0%) |
| 55 to 59 Years | 4 (100.0%) | 0 (0.0%) |
| 60 to 64 Years | 2 (40.0%) | 0 (0.0%) |
| 65 to 74 Years | 2 (15.4%) | 0 (0.0%) |
| 75 Years and over | 4 (57.1%) | 0 (0.0%) |
| Total | 84 (56.0%) | 0 (0.0%) |
Employment Status by Educational Attainment in Ekron
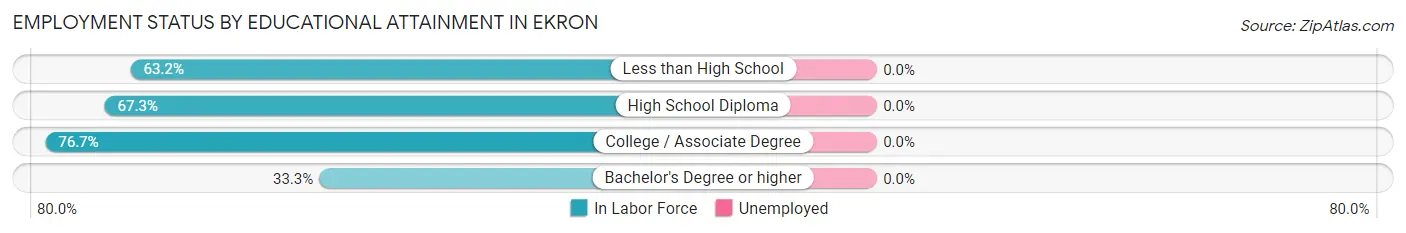
| Educational Attainment | In Labor Force | Unemployed |
| Less than High School | 12 (63.2%) | 0 (0.0%) |
| High School Diploma | 33 (67.3%) | 0 (0.0%) |
| College / Associate Degree | 23 (76.7%) | 0 (0.0%) |
| Bachelor's Degree or higher | 1 (33.3%) | 0 (0.0%) |
| Total | 69 (68.3%) | 0 (0.0%) |
Employment Occupations by Sex in Ekron
Management, Business, Science and Arts Occupations
The most common Management, Business, Science and Arts occupations in Ekron are Computers, Engineering & Science (3 | 3.6%), Architecture & Engineering (3 | 3.6%), Business & Financial (2 | 2.4%), Health Diagnosing & Treating (2 | 2.4%), and Community & Social Service (1 | 1.2%).
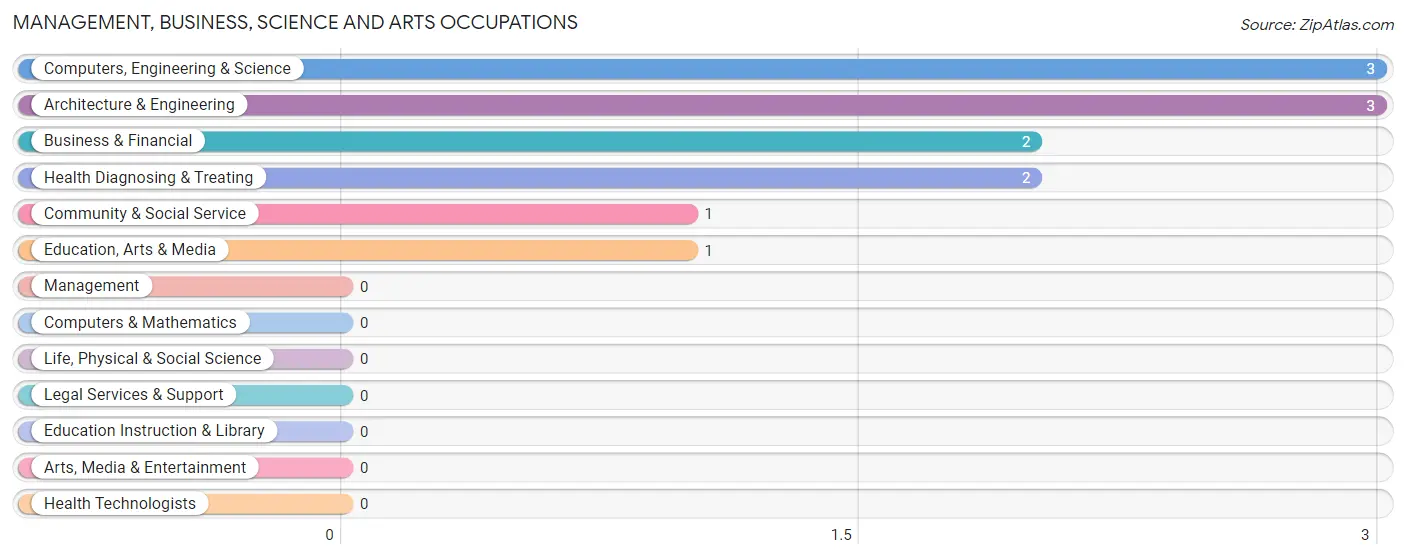
Management, Business, Science and Arts Occupations by Sex
Within the Management, Business, Science and Arts occupations in Ekron, the most male-oriented occupations are Business & Financial (100.0%), Computers, Engineering & Science (100.0%), and Architecture & Engineering (100.0%), while the most female-oriented occupations are Community & Social Service (100.0%), and Education, Arts & Media (100.0%).
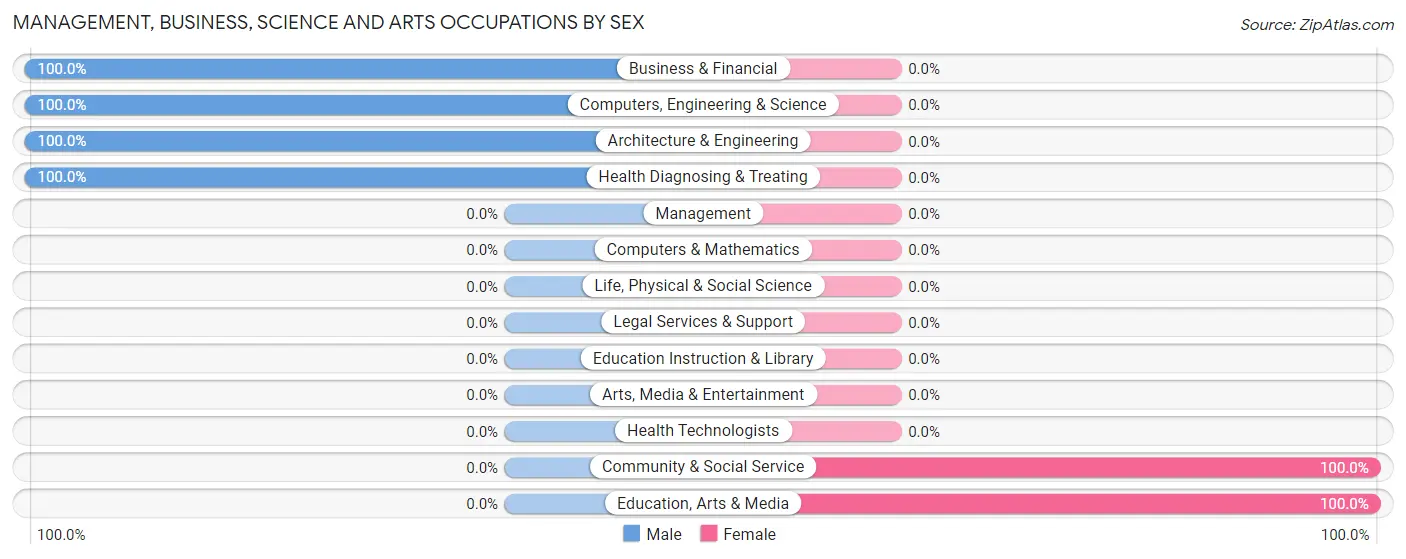
| Occupation | Male | Female |
| Management | 0 (0.0%) | 0 (0.0%) |
| Business & Financial | 2 (100.0%) | 0 (0.0%) |
| Computers, Engineering & Science | 3 (100.0%) | 0 (0.0%) |
| Computers & Mathematics | 0 (0.0%) | 0 (0.0%) |
| Architecture & Engineering | 3 (100.0%) | 0 (0.0%) |
| Life, Physical & Social Science | 0 (0.0%) | 0 (0.0%) |
| Community & Social Service | 0 (0.0%) | 1 (100.0%) |
| Education, Arts & Media | 0 (0.0%) | 1 (100.0%) |
| Legal Services & Support | 0 (0.0%) | 0 (0.0%) |
| Education Instruction & Library | 0 (0.0%) | 0 (0.0%) |
| Arts, Media & Entertainment | 0 (0.0%) | 0 (0.0%) |
| Health Diagnosing & Treating | 2 (100.0%) | 0 (0.0%) |
| Health Technologists | 0 (0.0%) | 0 (0.0%) |
| Total (Category) | 7 (87.5%) | 1 (12.5%) |
| Total (Overall) | 45 (53.6%) | 39 (46.4%) |
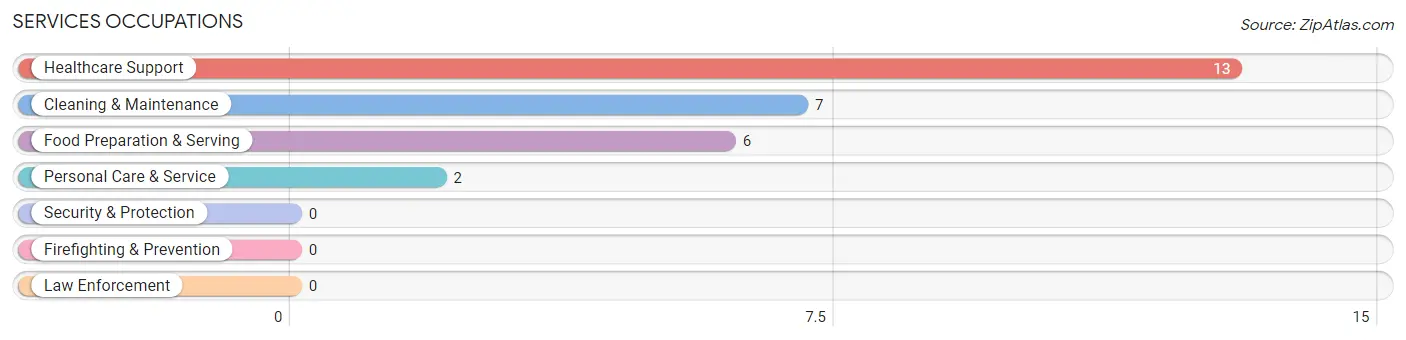
Services Occupations
The most common Services occupations in Ekron are Healthcare Support (13 | 15.5%), Cleaning & Maintenance (7 | 8.3%), Food Preparation & Serving (6 | 7.1%), and Personal Care & Service (2 | 2.4%).
Services Occupations by Sex
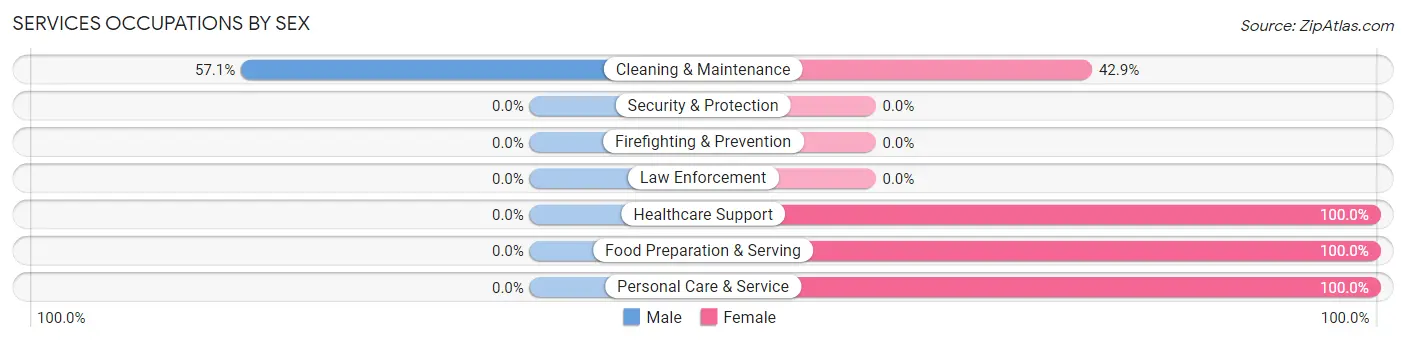
| Occupation | Male | Female |
| Healthcare Support | 0 (0.0%) | 13 (100.0%) |
| Security & Protection | 0 (0.0%) | 0 (0.0%) |
| Firefighting & Prevention | 0 (0.0%) | 0 (0.0%) |
| Law Enforcement | 0 (0.0%) | 0 (0.0%) |
| Food Preparation & Serving | 0 (0.0%) | 6 (100.0%) |
| Cleaning & Maintenance | 4 (57.1%) | 3 (42.9%) |
| Personal Care & Service | 0 (0.0%) | 2 (100.0%) |
| Total (Category) | 4 (14.3%) | 24 (85.7%) |
| Total (Overall) | 45 (53.6%) | 39 (46.4%) |
Sales and Office Occupations
The most common Sales and Office occupations in Ekron are Sales & Related (6 | 7.1%), and Office & Administration (3 | 3.6%).
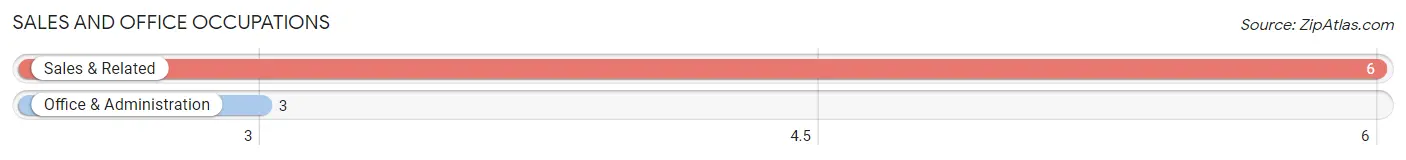
Sales and Office Occupations by Sex

| Occupation | Male | Female |
| Sales & Related | 4 (66.7%) | 2 (33.3%) |
| Office & Administration | 1 (33.3%) | 2 (66.7%) |
| Total (Category) | 5 (55.6%) | 4 (44.4%) |
| Total (Overall) | 45 (53.6%) | 39 (46.4%) |
Natural Resources, Construction and Maintenance Occupations
The most common Natural Resources, Construction and Maintenance occupations in Ekron are Construction & Extraction (17 | 20.2%), and Installation, Maintenance & Repair (2 | 2.4%).
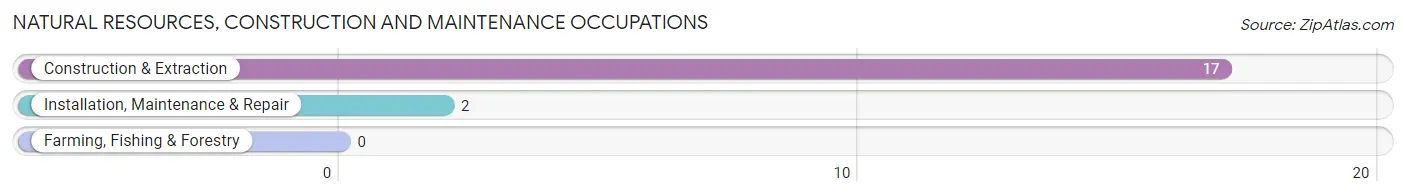
Natural Resources, Construction and Maintenance Occupations by Sex
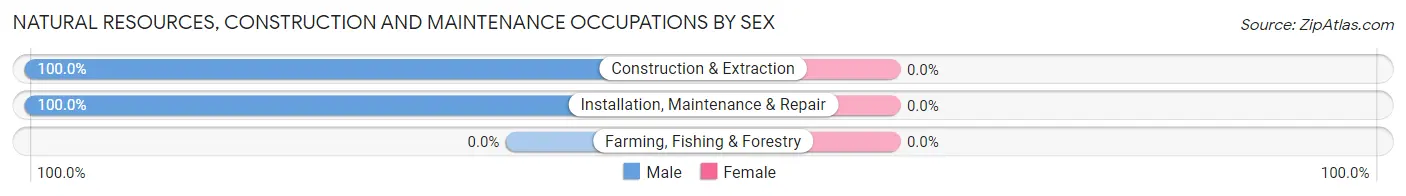
| Occupation | Male | Female |
| Farming, Fishing & Forestry | 0 (0.0%) | 0 (0.0%) |
| Construction & Extraction | 17 (100.0%) | 0 (0.0%) |
| Installation, Maintenance & Repair | 2 (100.0%) | 0 (0.0%) |
| Total (Category) | 19 (100.0%) | 0 (0.0%) |
| Total (Overall) | 45 (53.6%) | 39 (46.4%) |
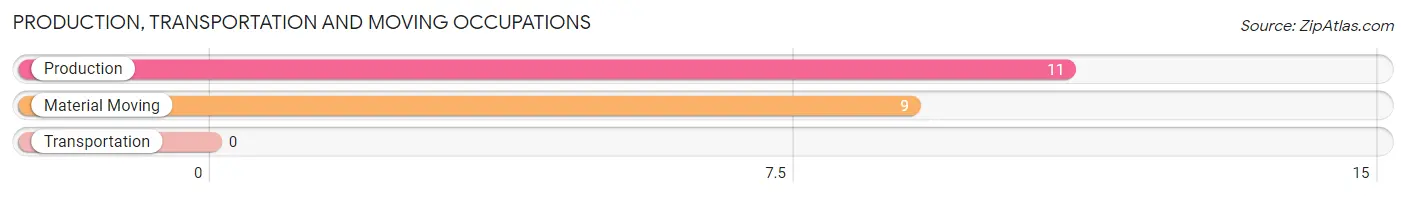
Production, Transportation and Moving Occupations
The most common Production, Transportation and Moving occupations in Ekron are Production (11 | 13.1%), and Material Moving (9 | 10.7%).
Production, Transportation and Moving Occupations by Sex
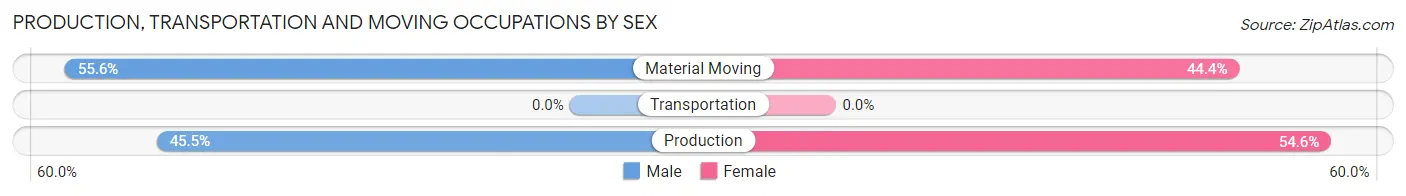
| Occupation | Male | Female |
| Production | 5 (45.5%) | 6 (54.5%) |
| Transportation | 0 (0.0%) | 0 (0.0%) |
| Material Moving | 5 (55.6%) | 4 (44.4%) |
| Total (Category) | 10 (50.0%) | 10 (50.0%) |
| Total (Overall) | 45 (53.6%) | 39 (46.4%) |
Employment Industries by Sex in Ekron
Employment Industries in Ekron
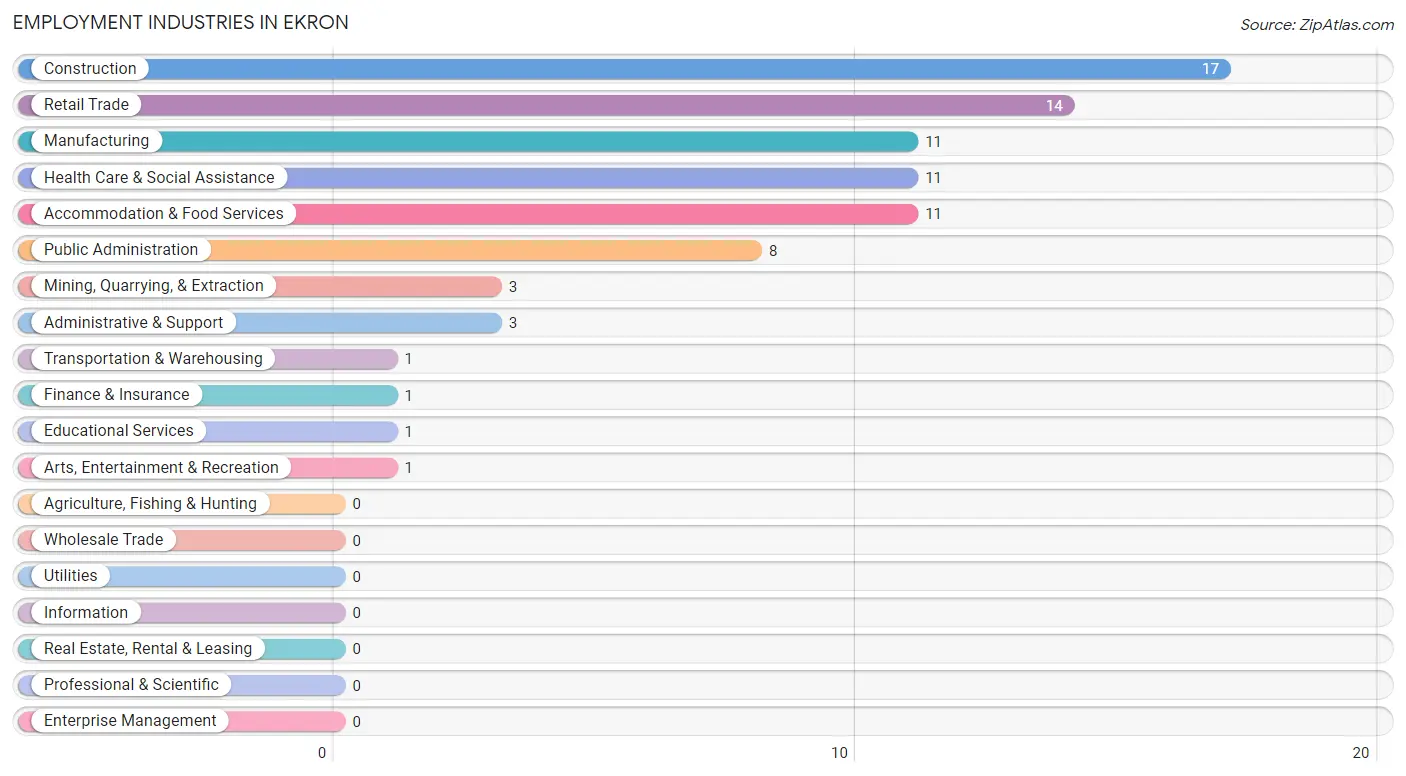
The major employment industries in Ekron include Construction (17 | 20.2%), Retail Trade (14 | 16.7%), Manufacturing (11 | 13.1%), Health Care & Social Assistance (11 | 13.1%), and Accommodation & Food Services (11 | 13.1%).
Employment Industries by Sex in Ekron
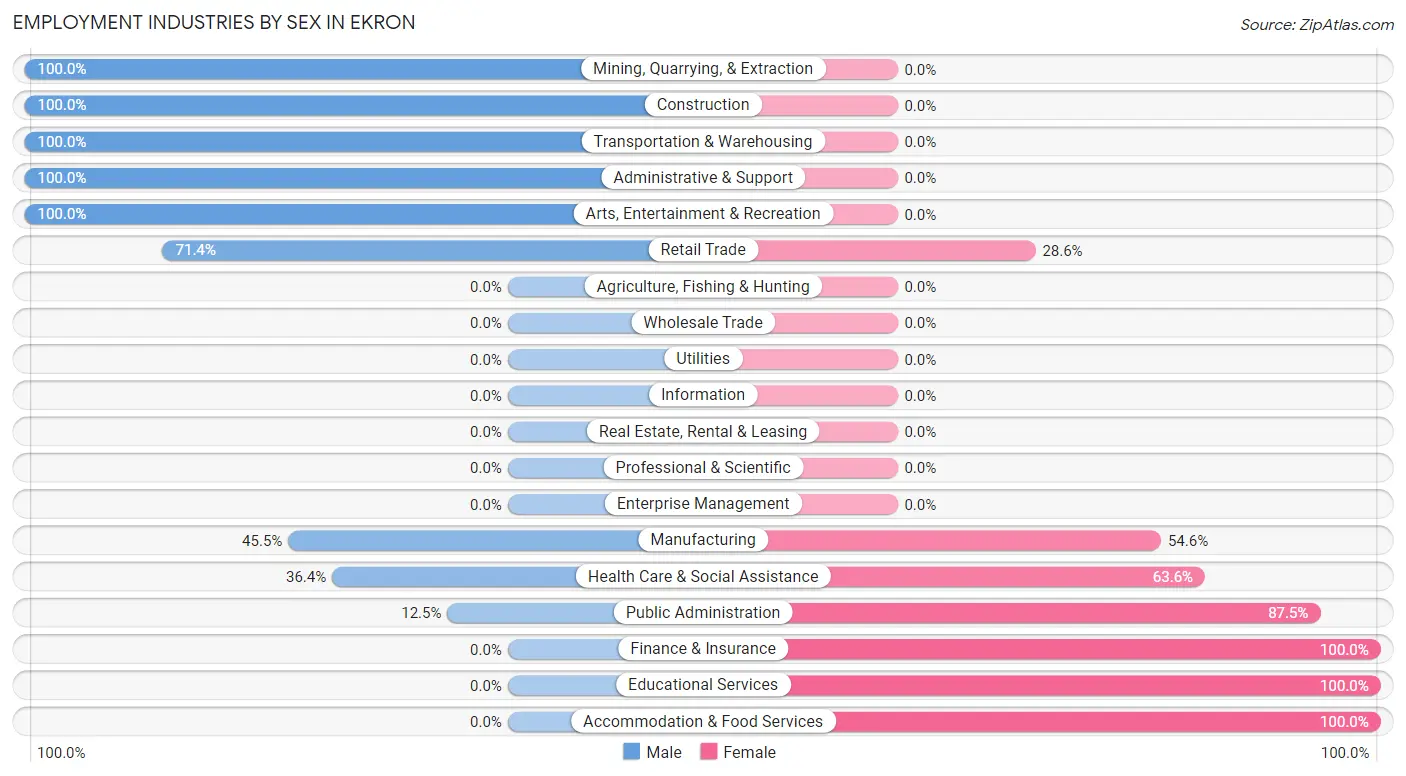
The Ekron industries that see more men than women are Mining, Quarrying, & Extraction (100.0%), Construction (100.0%), and Transportation & Warehousing (100.0%), whereas the industries that tend to have a higher number of women are Finance & Insurance (100.0%), Educational Services (100.0%), and Accommodation & Food Services (100.0%).
| Industry | Male | Female |
| Agriculture, Fishing & Hunting | 0 (0.0%) | 0 (0.0%) |
| Mining, Quarrying, & Extraction | 3 (100.0%) | 0 (0.0%) |
| Construction | 17 (100.0%) | 0 (0.0%) |
| Manufacturing | 5 (45.5%) | 6 (54.5%) |
| Wholesale Trade | 0 (0.0%) | 0 (0.0%) |
| Retail Trade | 10 (71.4%) | 4 (28.6%) |
| Transportation & Warehousing | 1 (100.0%) | 0 (0.0%) |
| Utilities | 0 (0.0%) | 0 (0.0%) |
| Information | 0 (0.0%) | 0 (0.0%) |
| Finance & Insurance | 0 (0.0%) | 1 (100.0%) |
| Real Estate, Rental & Leasing | 0 (0.0%) | 0 (0.0%) |
| Professional & Scientific | 0 (0.0%) | 0 (0.0%) |
| Enterprise Management | 0 (0.0%) | 0 (0.0%) |
| Administrative & Support | 3 (100.0%) | 0 (0.0%) |
| Educational Services | 0 (0.0%) | 1 (100.0%) |
| Health Care & Social Assistance | 4 (36.4%) | 7 (63.6%) |
| Arts, Entertainment & Recreation | 1 (100.0%) | 0 (0.0%) |
| Accommodation & Food Services | 0 (0.0%) | 11 (100.0%) |
| Public Administration | 1 (12.5%) | 7 (87.5%) |
| Total | 45 (53.6%) | 39 (46.4%) |
Education in Ekron
School Enrollment in Ekron
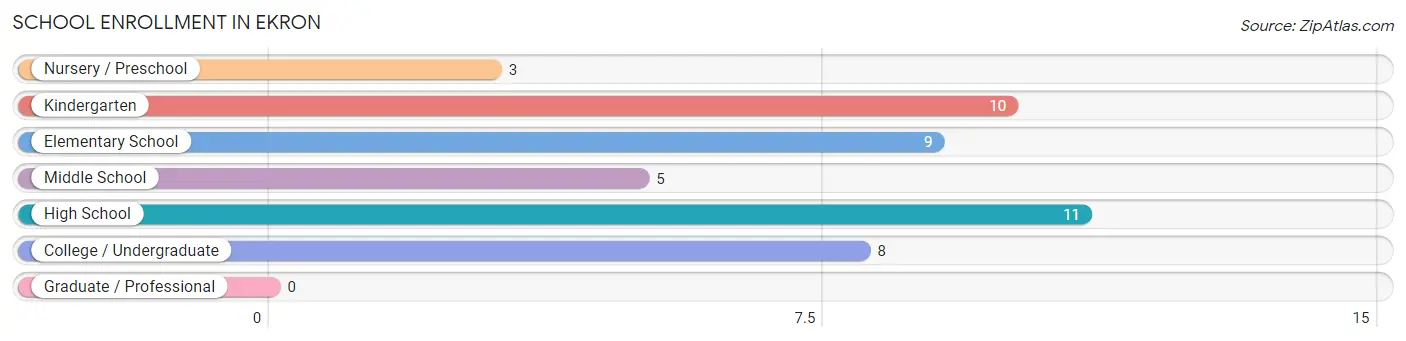
The most common levels of schooling among the 46 students in Ekron are high school (11 | 23.9%), kindergarten (10 | 21.7%), and elementary school (9 | 19.6%).
| School Level | # Students | % Students |
| Nursery / Preschool | 3 | 6.5% |
| Kindergarten | 10 | 21.7% |
| Elementary School | 9 | 19.6% |
| Middle School | 5 | 10.9% |
| High School | 11 | 23.9% |
| College / Undergraduate | 8 | 17.4% |
| Graduate / Professional | 0 | 0.0% |
| Total | 46 | 100.0% |
School Enrollment by Age by Funding Source in Ekron
| Age Bracket | Public School | Private School |
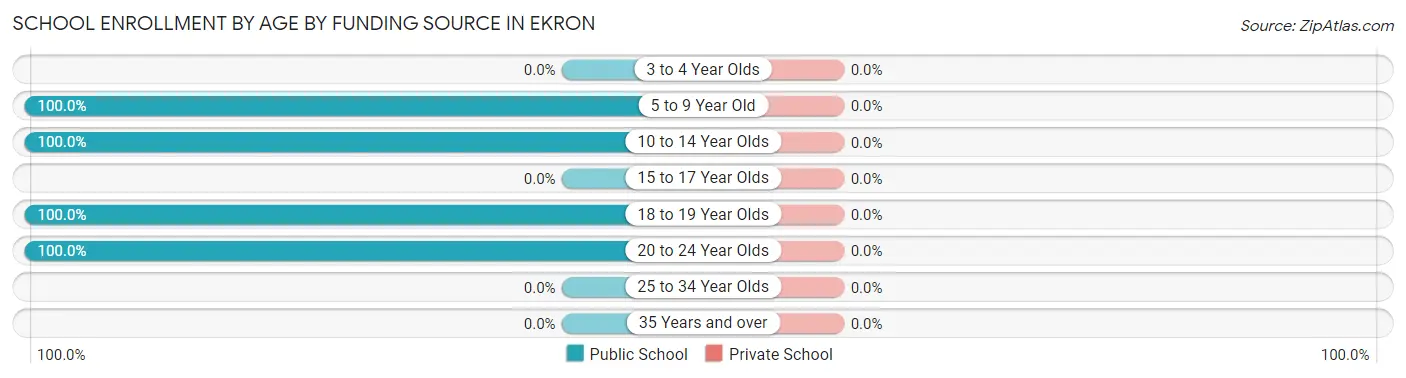
| 3 to 4 Year Olds | 0 (0.0%) | 0 (0.0%) |
| 5 to 9 Year Old | 20 (100.0%) | 0 (0.0%) |
| 10 to 14 Year Olds | 7 (100.0%) | 0 (0.0%) |
| 15 to 17 Year Olds | 0 (0.0%) | 0 (0.0%) |
| 18 to 19 Year Olds | 11 (100.0%) | 0 (0.0%) |
| 20 to 24 Year Olds | 8 (100.0%) | 0 (0.0%) |
| 25 to 34 Year Olds | 0 (0.0%) | 0 (0.0%) |
| 35 Years and over | 0 (0.0%) | 0 (0.0%) |
| Total | 46 (100.0%) | 0 (0.0%) |
Educational Attainment by Field of Study in Ekron
Liberal arts & history (2 | 66.7%), and multidisciplinary studies (1 | 33.3%) are the most common fields of study among 3 individuals in Ekron who have obtained a bachelor's degree or higher.
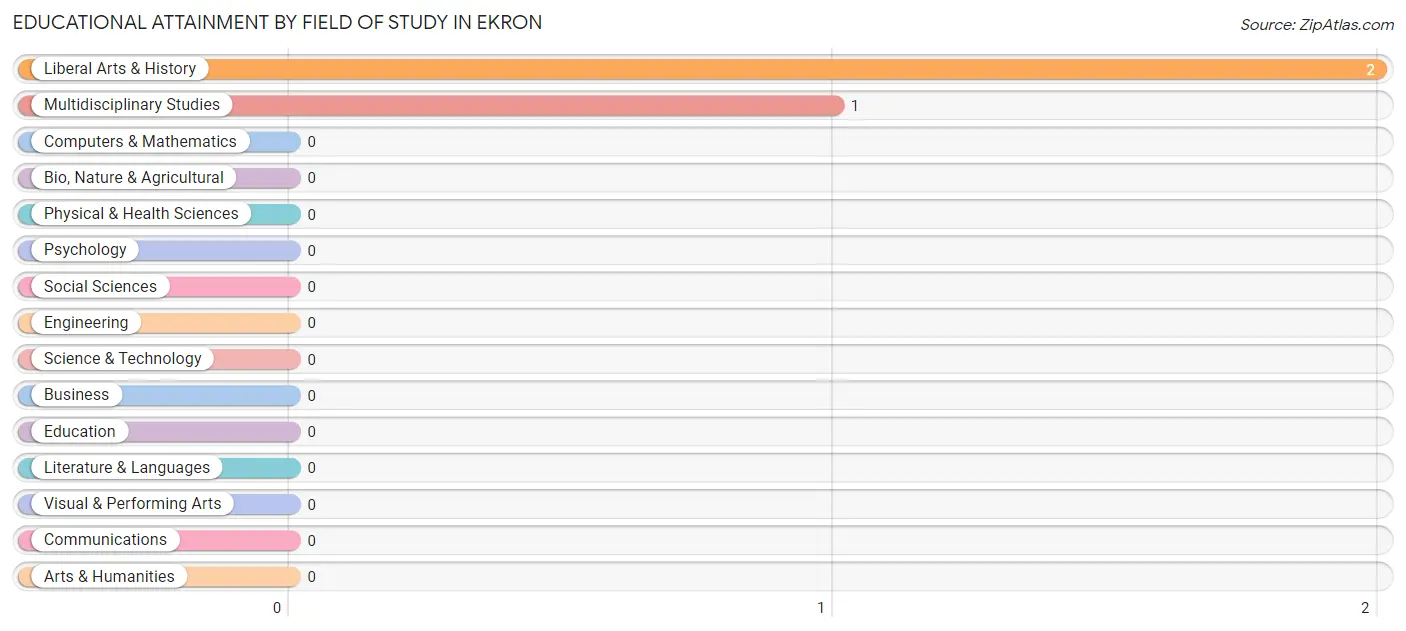
| Field of Study | # Graduates | % Graduates |
| Computers & Mathematics | 0 | 0.0% |
| Bio, Nature & Agricultural | 0 | 0.0% |
| Physical & Health Sciences | 0 | 0.0% |
| Psychology | 0 | 0.0% |
| Social Sciences | 0 | 0.0% |
| Engineering | 0 | 0.0% |
| Multidisciplinary Studies | 1 | 33.3% |
| Science & Technology | 0 | 0.0% |
| Business | 0 | 0.0% |
| Education | 0 | 0.0% |
| Literature & Languages | 0 | 0.0% |
| Liberal Arts & History | 2 | 66.7% |
| Visual & Performing Arts | 0 | 0.0% |
| Communications | 0 | 0.0% |
| Arts & Humanities | 0 | 0.0% |
| Total | 3 | 100.0% |
Transportation & Commute in Ekron
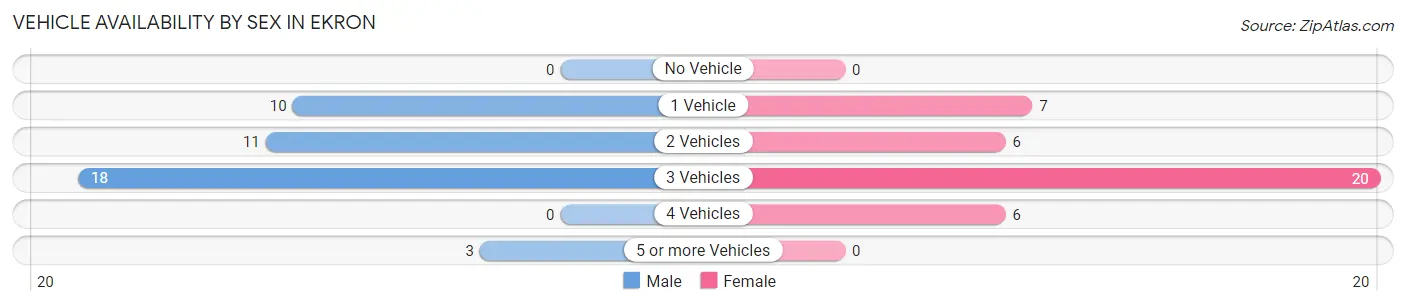
Vehicle Availability by Sex in Ekron
The most prevalent vehicle ownership categories in Ekron are males with 3 vehicles (18, accounting for 42.9%) and females with 3 vehicles (20, making up 46.2%).
| Vehicles Available | Male | Female |
| No Vehicle | 0 (0.0%) | 0 (0.0%) |
| 1 Vehicle | 10 (23.8%) | 7 (17.9%) |
| 2 Vehicles | 11 (26.2%) | 6 (15.4%) |
| 3 Vehicles | 18 (42.9%) | 20 (51.3%) |
| 4 Vehicles | 0 (0.0%) | 6 (15.4%) |
| 5 or more Vehicles | 3 (7.1%) | 0 (0.0%) |
| Total | 42 (100.0%) | 39 (100.0%) |
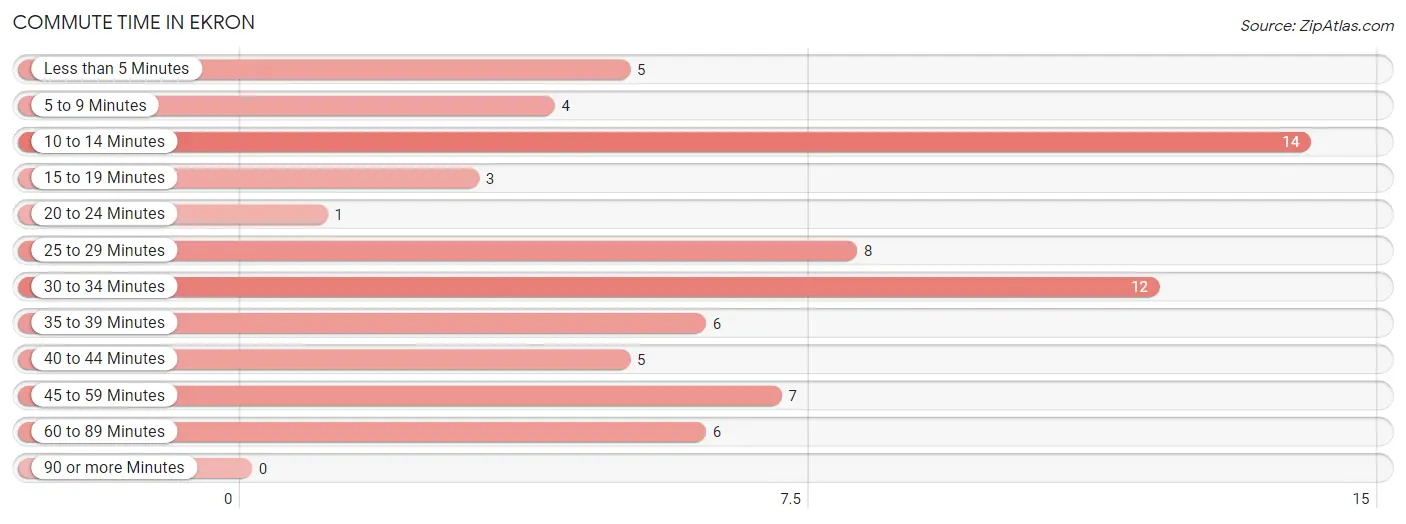
Commute Time in Ekron
The most frequently occuring commute durations in Ekron are 10 to 14 minutes (14 commuters, 19.7%), 30 to 34 minutes (12 commuters, 16.9%), and 25 to 29 minutes (8 commuters, 11.3%).
| Commute Time | # Commuters | % Commuters |
| Less than 5 Minutes | 5 | 7.0% |
| 5 to 9 Minutes | 4 | 5.6% |
| 10 to 14 Minutes | 14 | 19.7% |
| 15 to 19 Minutes | 3 | 4.2% |
| 20 to 24 Minutes | 1 | 1.4% |
| 25 to 29 Minutes | 8 | 11.3% |
| 30 to 34 Minutes | 12 | 16.9% |
| 35 to 39 Minutes | 6 | 8.5% |
| 40 to 44 Minutes | 5 | 7.0% |
| 45 to 59 Minutes | 7 | 9.9% |
| 60 to 89 Minutes | 6 | 8.5% |
| 90 or more Minutes | 0 | 0.0% |
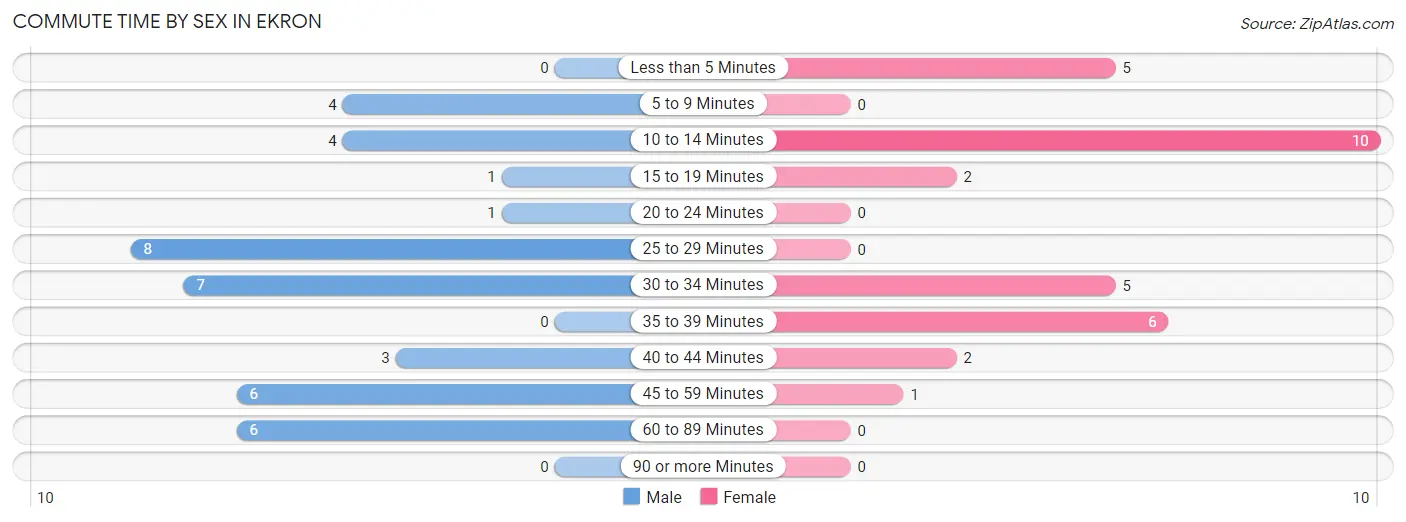
Commute Time by Sex in Ekron
The most common commute times in Ekron are 25 to 29 minutes (8 commuters, 20.0%) for males and 10 to 14 minutes (10 commuters, 32.3%) for females.
| Commute Time | Male | Female |
| Less than 5 Minutes | 0 (0.0%) | 5 (16.1%) |
| 5 to 9 Minutes | 4 (10.0%) | 0 (0.0%) |
| 10 to 14 Minutes | 4 (10.0%) | 10 (32.3%) |
| 15 to 19 Minutes | 1 (2.5%) | 2 (6.5%) |
| 20 to 24 Minutes | 1 (2.5%) | 0 (0.0%) |
| 25 to 29 Minutes | 8 (20.0%) | 0 (0.0%) |
| 30 to 34 Minutes | 7 (17.5%) | 5 (16.1%) |
| 35 to 39 Minutes | 0 (0.0%) | 6 (19.4%) |
| 40 to 44 Minutes | 3 (7.5%) | 2 (6.5%) |
| 45 to 59 Minutes | 6 (15.0%) | 1 (3.2%) |
| 60 to 89 Minutes | 6 (15.0%) | 0 (0.0%) |
| 90 or more Minutes | 0 (0.0%) | 0 (0.0%) |
Time of Departure to Work by Sex in Ekron
The most frequent times of departure to work in Ekron are 8:00 AM to 8:29 AM (12, 30.0%) for males and 5:00 AM to 5:29 AM (6, 19.4%) for females.
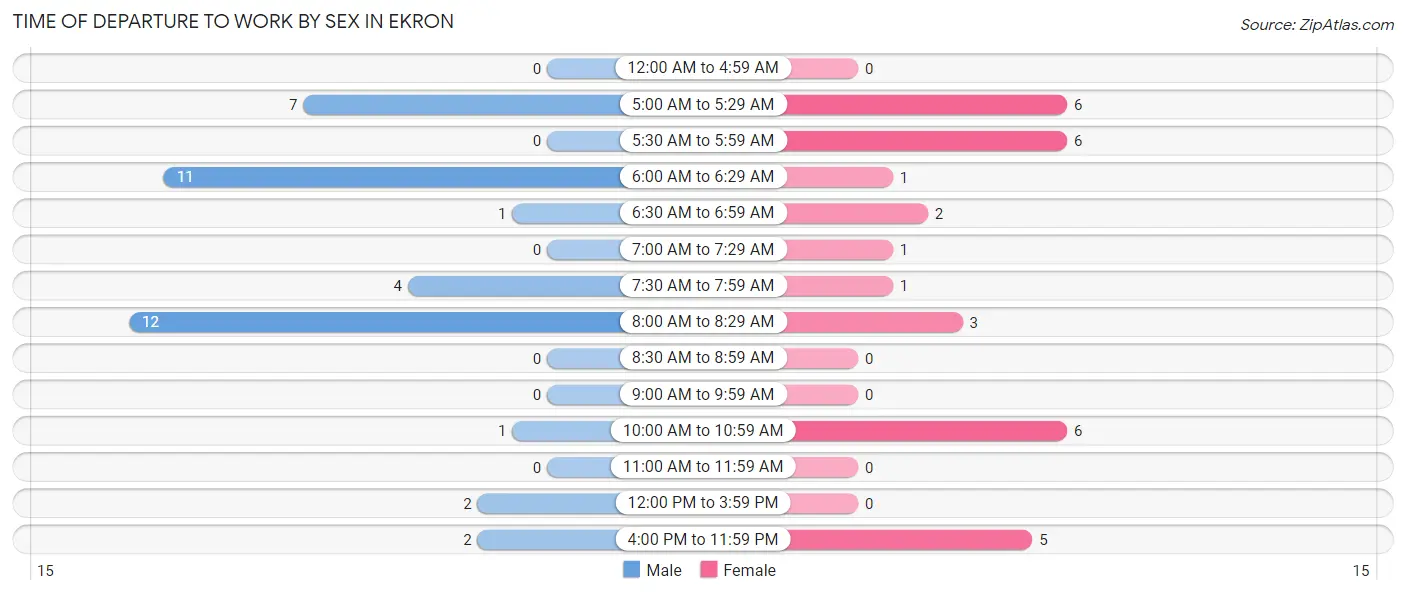
| Time of Departure | Male | Female |
| 12:00 AM to 4:59 AM | 0 (0.0%) | 0 (0.0%) |
| 5:00 AM to 5:29 AM | 7 (17.5%) | 6 (19.4%) |
| 5:30 AM to 5:59 AM | 0 (0.0%) | 6 (19.4%) |
| 6:00 AM to 6:29 AM | 11 (27.5%) | 1 (3.2%) |
| 6:30 AM to 6:59 AM | 1 (2.5%) | 2 (6.5%) |
| 7:00 AM to 7:29 AM | 0 (0.0%) | 1 (3.2%) |
| 7:30 AM to 7:59 AM | 4 (10.0%) | 1 (3.2%) |
| 8:00 AM to 8:29 AM | 12 (30.0%) | 3 (9.7%) |
| 8:30 AM to 8:59 AM | 0 (0.0%) | 0 (0.0%) |
| 9:00 AM to 9:59 AM | 0 (0.0%) | 0 (0.0%) |
| 10:00 AM to 10:59 AM | 1 (2.5%) | 6 (19.4%) |
| 11:00 AM to 11:59 AM | 0 (0.0%) | 0 (0.0%) |
| 12:00 PM to 3:59 PM | 2 (5.0%) | 0 (0.0%) |
| 4:00 PM to 11:59 PM | 2 (5.0%) | 5 (16.1%) |
| Total | 40 (100.0%) | 31 (100.0%) |
Housing Occupancy in Ekron
Occupancy by Ownership in Ekron
Of the total 65 dwellings in Ekron, owner-occupied units account for 43 (66.1%), while renter-occupied units make up 22 (33.9%).
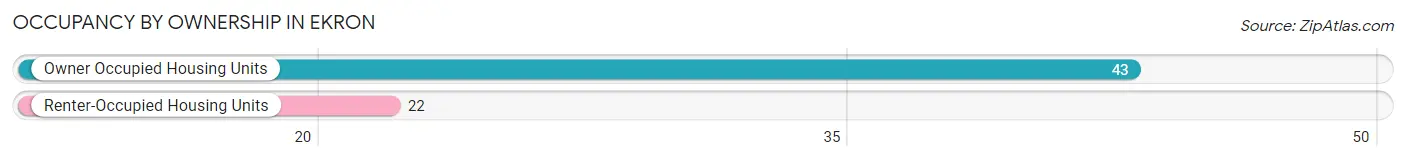
| Occupancy | # Housing Units | % Housing Units |
| Owner Occupied Housing Units | 43 | 66.1% |
| Renter-Occupied Housing Units | 22 | 33.9% |
| Total Occupied Housing Units | 65 | 100.0% |
Occupancy by Household Size in Ekron
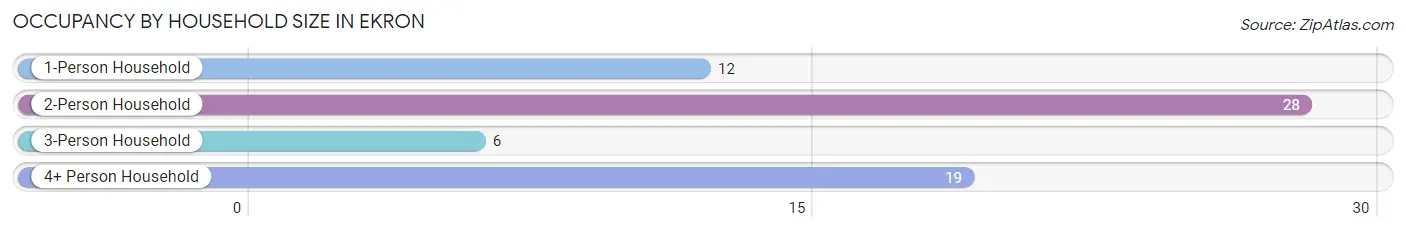
| Household Size | # Housing Units | % Housing Units |
| 1-Person Household | 12 | 18.5% |
| 2-Person Household | 28 | 43.1% |
| 3-Person Household | 6 | 9.2% |
| 4+ Person Household | 19 | 29.2% |
| Total Housing Units | 65 | 100.0% |
Occupancy by Ownership by Household Size in Ekron
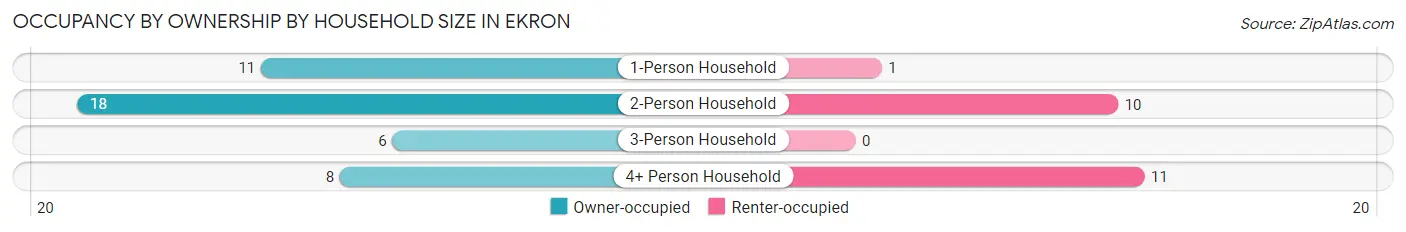
| Household Size | Owner-occupied | Renter-occupied |
| 1-Person Household | 11 (91.7%) | 1 (8.3%) |
| 2-Person Household | 18 (64.3%) | 10 (35.7%) |
| 3-Person Household | 6 (100.0%) | 0 (0.0%) |
| 4+ Person Household | 8 (42.1%) | 11 (57.9%) |
| Total Housing Units | 43 (66.1%) | 22 (33.9%) |
Occupancy by Educational Attainment in Ekron
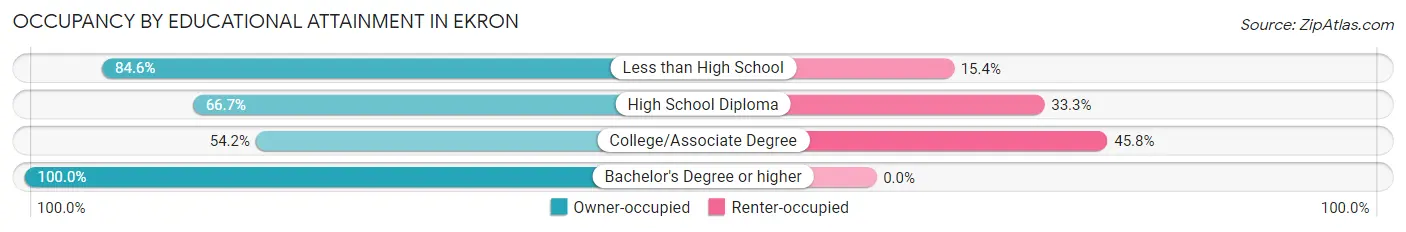
| Household Size | Owner-occupied | Renter-occupied |
| Less than High School | 11 (84.6%) | 2 (15.4%) |
| High School Diploma | 18 (66.7%) | 9 (33.3%) |
| College/Associate Degree | 13 (54.2%) | 11 (45.8%) |
| Bachelor's Degree or higher | 1 (100.0%) | 0 (0.0%) |
Occupancy by Age of Householder in Ekron
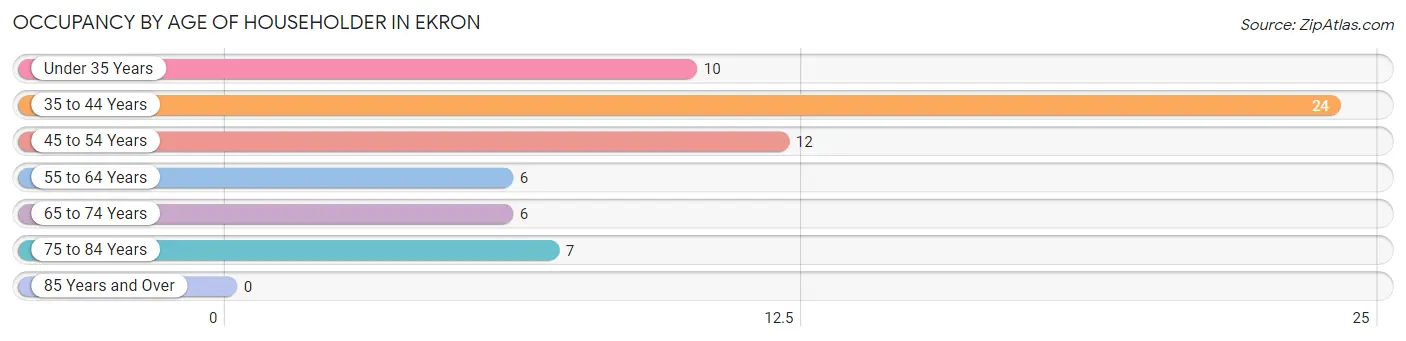
| Age Bracket | # Households | % Households |
| Under 35 Years | 10 | 15.4% |
| 35 to 44 Years | 24 | 36.9% |
| 45 to 54 Years | 12 | 18.5% |
| 55 to 64 Years | 6 | 9.2% |
| 65 to 74 Years | 6 | 9.2% |
| 75 to 84 Years | 7 | 10.8% |
| 85 Years and Over | 0 | 0.0% |
| Total | 65 | 100.0% |
Housing Finances in Ekron
Median Income by Occupancy in Ekron
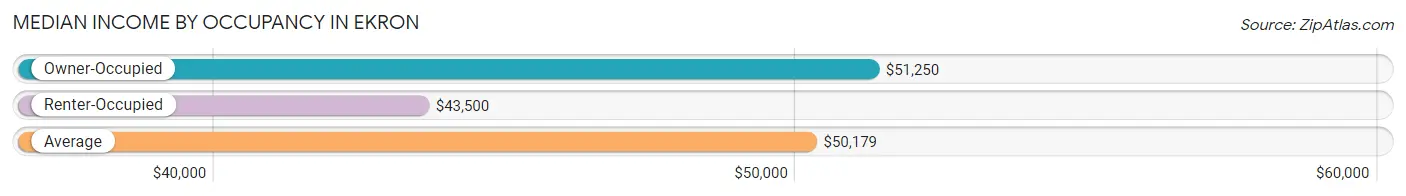
| Occupancy Type | # Households | Median Income |
| Owner-Occupied | 43 (66.1%) | $51,250 |
| Renter-Occupied | 22 (33.9%) | $43,500 |
| Average | 65 (100.0%) | $50,179 |
Occupancy by Householder Income Bracket in Ekron
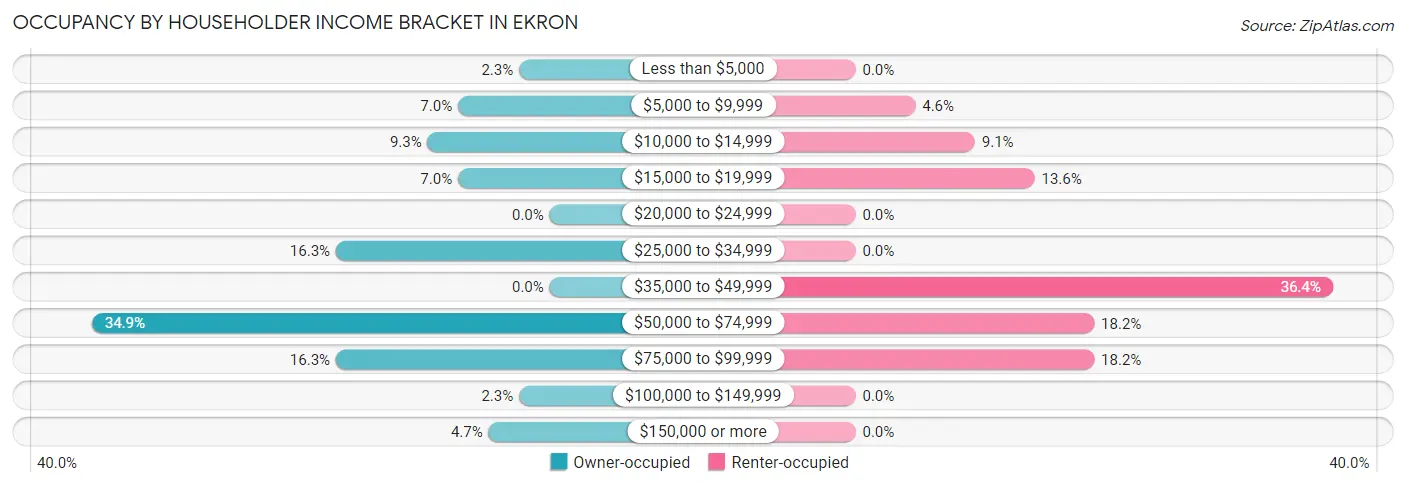
| Income Bracket | Owner-occupied | Renter-occupied |
| Less than $5,000 | 1 (2.3%) | 0 (0.0%) |
| $5,000 to $9,999 | 3 (7.0%) | 1 (4.5%) |
| $10,000 to $14,999 | 4 (9.3%) | 2 (9.1%) |
| $15,000 to $19,999 | 3 (7.0%) | 3 (13.6%) |
| $20,000 to $24,999 | 0 (0.0%) | 0 (0.0%) |
| $25,000 to $34,999 | 7 (16.3%) | 0 (0.0%) |
| $35,000 to $49,999 | 0 (0.0%) | 8 (36.4%) |
| $50,000 to $74,999 | 15 (34.9%) | 4 (18.2%) |
| $75,000 to $99,999 | 7 (16.3%) | 4 (18.2%) |
| $100,000 to $149,999 | 1 (2.3%) | 0 (0.0%) |
| $150,000 or more | 2 (4.6%) | 0 (0.0%) |
| Total | 43 (100.0%) | 22 (100.0%) |
Monthly Housing Cost Tiers in Ekron
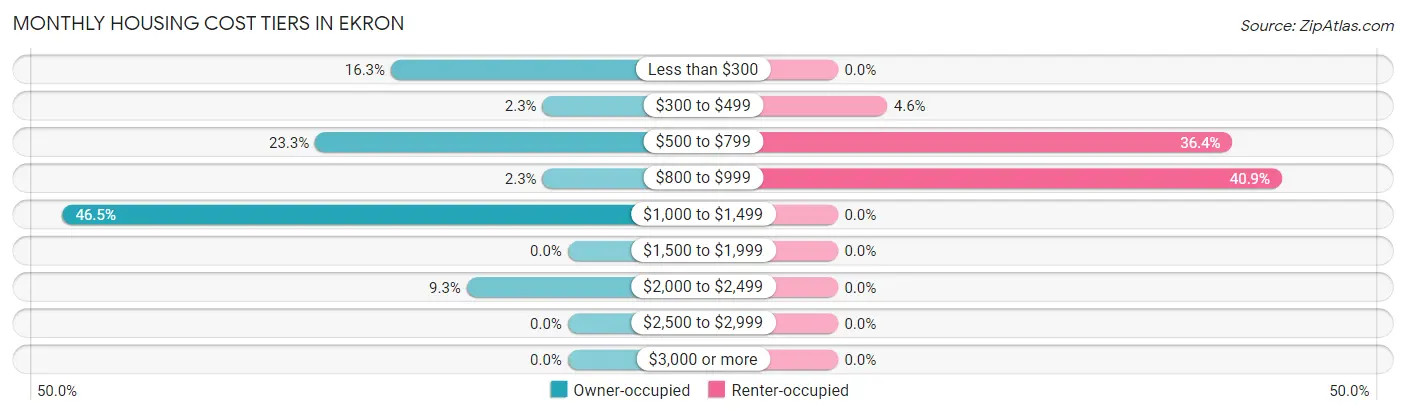
| Monthly Cost | Owner-occupied | Renter-occupied |
| Less than $300 | 7 (16.3%) | 0 (0.0%) |
| $300 to $499 | 1 (2.3%) | 1 (4.5%) |
| $500 to $799 | 10 (23.3%) | 8 (36.4%) |
| $800 to $999 | 1 (2.3%) | 9 (40.9%) |
| $1,000 to $1,499 | 20 (46.5%) | 0 (0.0%) |
| $1,500 to $1,999 | 0 (0.0%) | 0 (0.0%) |
| $2,000 to $2,499 | 4 (9.3%) | 0 (0.0%) |
| $2,500 to $2,999 | 0 (0.0%) | 0 (0.0%) |
| $3,000 or more | 0 (0.0%) | 0 (0.0%) |
| Total | 43 (100.0%) | 22 (100.0%) |
Physical Housing Characteristics in Ekron
Housing Structures in Ekron
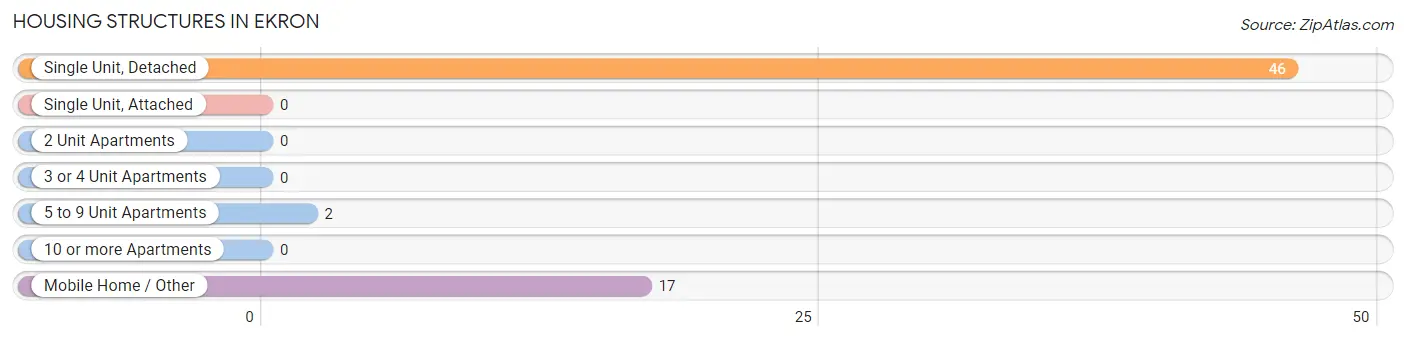
| Structure Type | # Housing Units | % Housing Units |
| Single Unit, Detached | 46 | 70.8% |
| Single Unit, Attached | 0 | 0.0% |
| 2 Unit Apartments | 0 | 0.0% |
| 3 or 4 Unit Apartments | 0 | 0.0% |
| 5 to 9 Unit Apartments | 2 | 3.1% |
| 10 or more Apartments | 0 | 0.0% |
| Mobile Home / Other | 17 | 26.2% |
| Total | 65 | 100.0% |
Housing Structures by Occupancy in Ekron
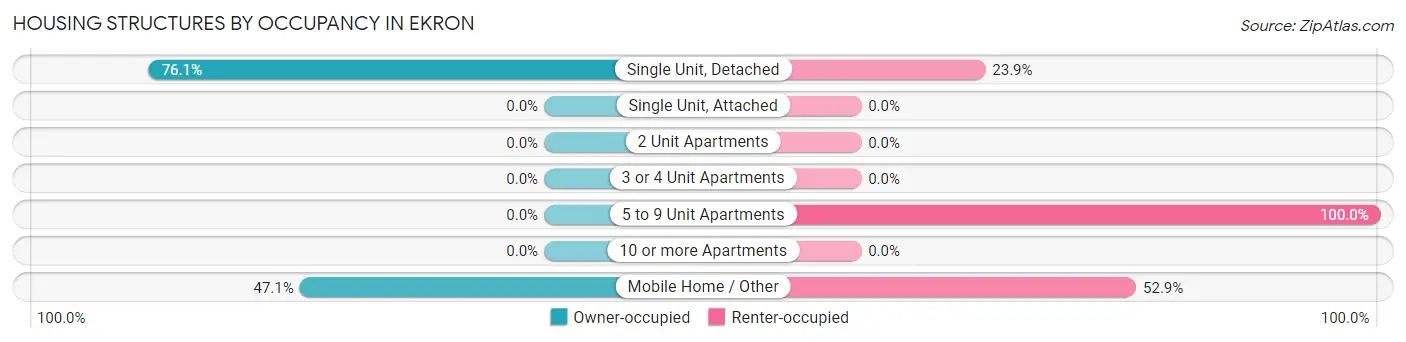
| Structure Type | Owner-occupied | Renter-occupied |
| Single Unit, Detached | 35 (76.1%) | 11 (23.9%) |
| Single Unit, Attached | 0 (0.0%) | 0 (0.0%) |
| 2 Unit Apartments | 0 (0.0%) | 0 (0.0%) |
| 3 or 4 Unit Apartments | 0 (0.0%) | 0 (0.0%) |
| 5 to 9 Unit Apartments | 0 (0.0%) | 2 (100.0%) |
| 10 or more Apartments | 0 (0.0%) | 0 (0.0%) |
| Mobile Home / Other | 8 (47.1%) | 9 (52.9%) |
| Total | 43 (66.1%) | 22 (33.9%) |
Housing Structures by Number of Rooms in Ekron
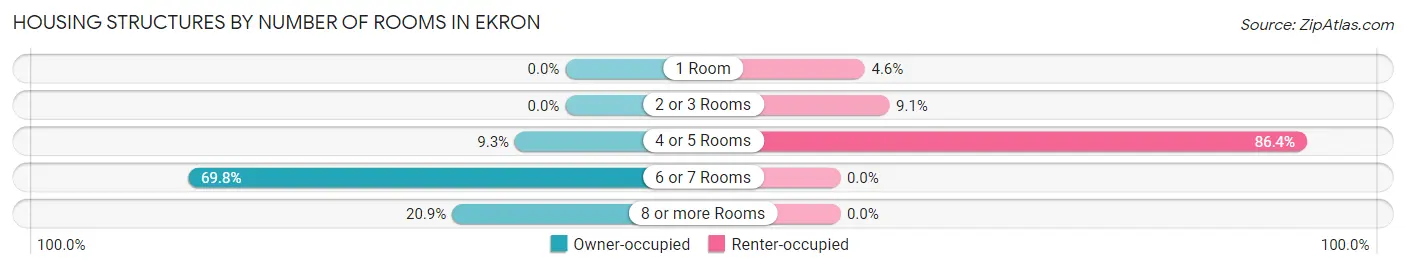
| Number of Rooms | Owner-occupied | Renter-occupied |
| 1 Room | 0 (0.0%) | 1 (4.5%) |
| 2 or 3 Rooms | 0 (0.0%) | 2 (9.1%) |
| 4 or 5 Rooms | 4 (9.3%) | 19 (86.4%) |
| 6 or 7 Rooms | 30 (69.8%) | 0 (0.0%) |
| 8 or more Rooms | 9 (20.9%) | 0 (0.0%) |
| Total | 43 (100.0%) | 22 (100.0%) |
Housing Structure by Heating Type in Ekron
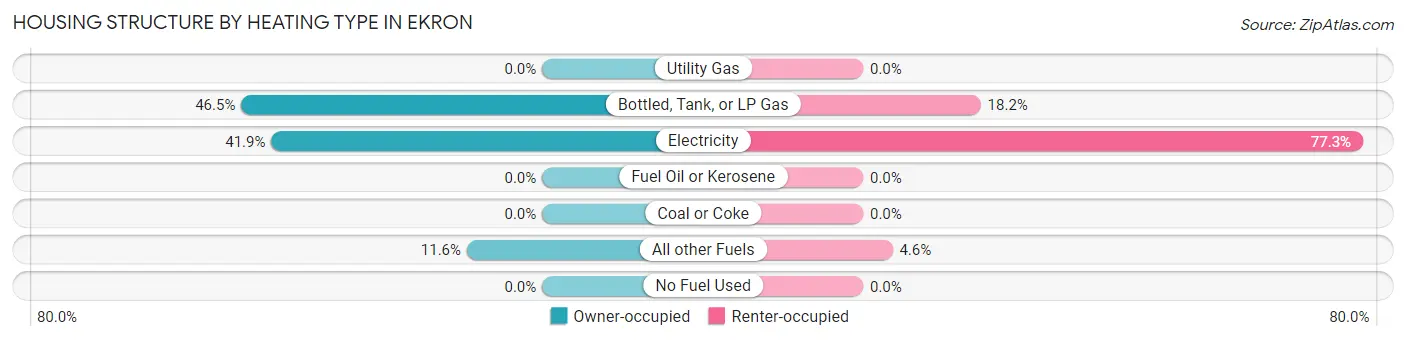
| Heating Type | Owner-occupied | Renter-occupied |
| Utility Gas | 0 (0.0%) | 0 (0.0%) |
| Bottled, Tank, or LP Gas | 20 (46.5%) | 4 (18.2%) |
| Electricity | 18 (41.9%) | 17 (77.3%) |
| Fuel Oil or Kerosene | 0 (0.0%) | 0 (0.0%) |
| Coal or Coke | 0 (0.0%) | 0 (0.0%) |
| All other Fuels | 5 (11.6%) | 1 (4.5%) |
| No Fuel Used | 0 (0.0%) | 0 (0.0%) |
| Total | 43 (100.0%) | 22 (100.0%) |
Household Vehicle Usage in Ekron
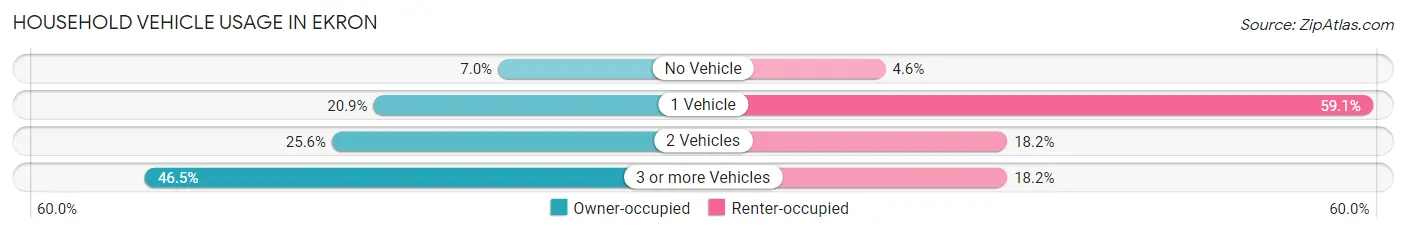
| Vehicles per Household | Owner-occupied | Renter-occupied |
| No Vehicle | 3 (7.0%) | 1 (4.5%) |
| 1 Vehicle | 9 (20.9%) | 13 (59.1%) |
| 2 Vehicles | 11 (25.6%) | 4 (18.2%) |
| 3 or more Vehicles | 20 (46.5%) | 4 (18.2%) |
| Total | 43 (100.0%) | 22 (100.0%) |
Real Estate & Mortgages in Ekron
Real Estate and Mortgage Overview in Ekron
| Characteristic | Without Mortgage | With Mortgage |
| Housing Units | 10 | 33 |
| Median Property Value | $72,500 | $87,900 |
| Median Household Income | - | - |
| Monthly Housing Costs | $275 | $0 |
| Real Estate Taxes | - | - |
Property Value by Mortgage Status in Ekron
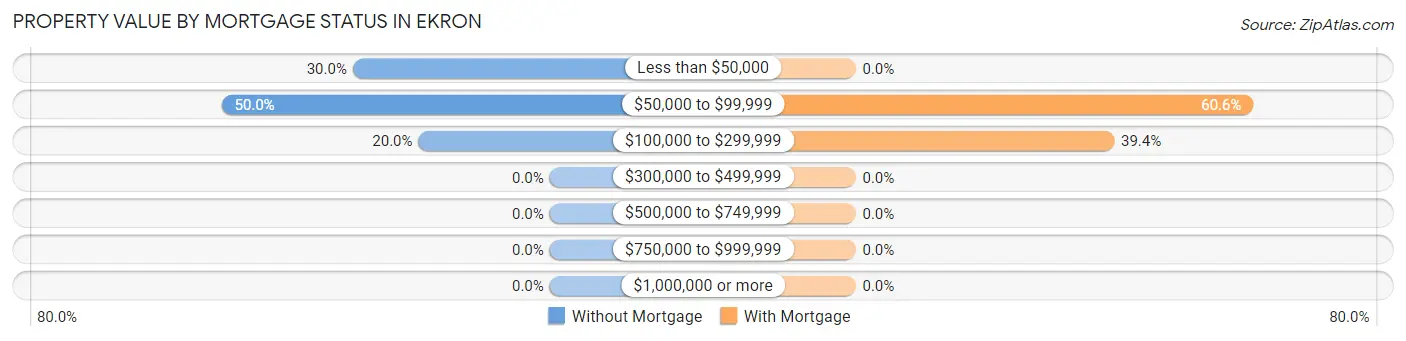
| Property Value | Without Mortgage | With Mortgage |
| Less than $50,000 | 3 (30.0%) | 0 (0.0%) |
| $50,000 to $99,999 | 5 (50.0%) | 20 (60.6%) |
| $100,000 to $299,999 | 2 (20.0%) | 13 (39.4%) |
| $300,000 to $499,999 | 0 (0.0%) | 0 (0.0%) |
| $500,000 to $749,999 | 0 (0.0%) | 0 (0.0%) |
| $750,000 to $999,999 | 0 (0.0%) | 0 (0.0%) |
| $1,000,000 or more | 0 (0.0%) | 0 (0.0%) |
| Total | 10 (100.0%) | 33 (100.0%) |
Household Income by Mortgage Status in Ekron
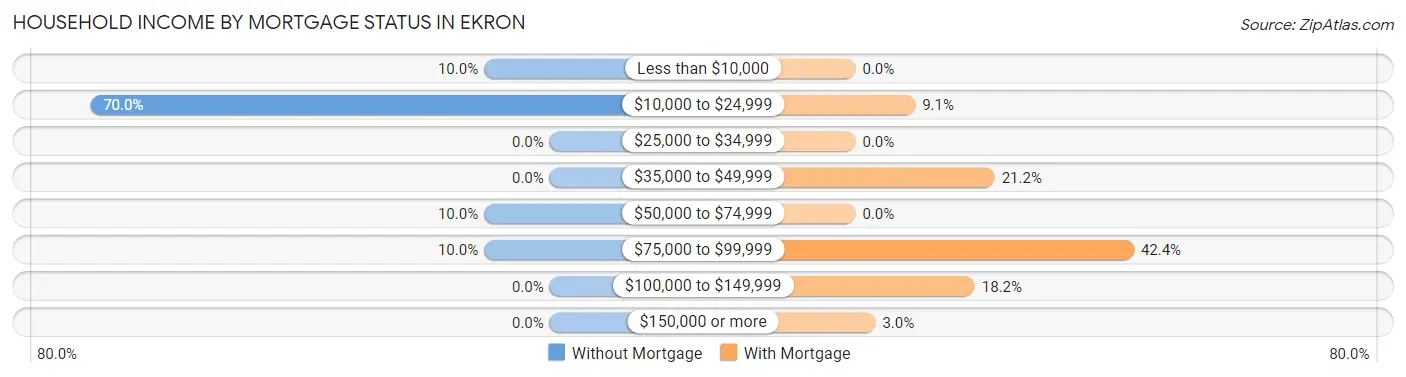
| Household Income | Without Mortgage | With Mortgage |
| Less than $10,000 | 1 (10.0%) | 0 (0.0%) |
| $10,000 to $24,999 | 7 (70.0%) | 3 (9.1%) |
| $25,000 to $34,999 | 0 (0.0%) | 0 (0.0%) |
| $35,000 to $49,999 | 0 (0.0%) | 7 (21.2%) |
| $50,000 to $74,999 | 1 (10.0%) | 0 (0.0%) |
| $75,000 to $99,999 | 1 (10.0%) | 14 (42.4%) |
| $100,000 to $149,999 | 0 (0.0%) | 6 (18.2%) |
| $150,000 or more | 0 (0.0%) | 1 (3.0%) |
| Total | 10 (100.0%) | 33 (100.0%) |
Property Value to Household Income Ratio in Ekron
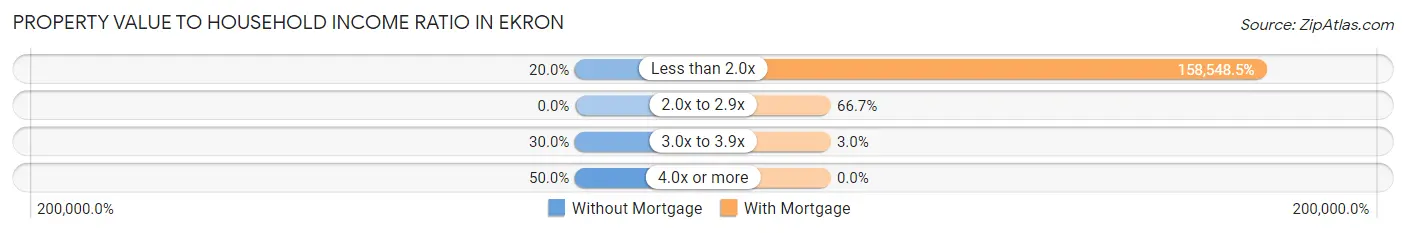
| Value-to-Income Ratio | Without Mortgage | With Mortgage |
| Less than 2.0x | 2 (20.0%) | 52,321 (158,548.5%) |
| 2.0x to 2.9x | 0 (0.0%) | 22 (66.7%) |
| 3.0x to 3.9x | 3 (30.0%) | 1 (3.0%) |
| 4.0x or more | 5 (50.0%) | 0 (0.0%) |
| Total | 10 (100.0%) | 33 (100.0%) |
Real Estate Taxes by Mortgage Status in Ekron
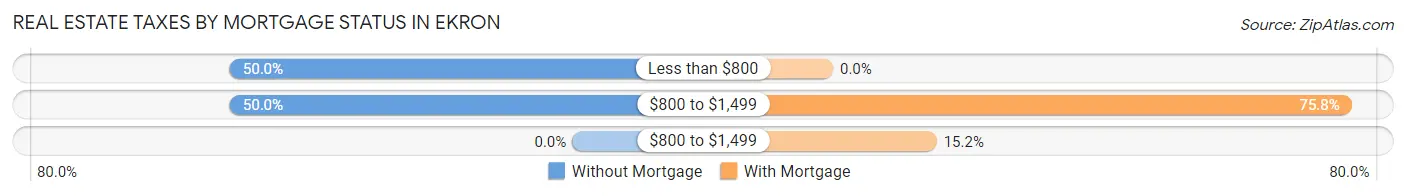
| Property Taxes | Without Mortgage | With Mortgage |
| Less than $800 | 5 (50.0%) | 0 (0.0%) |
| $800 to $1,499 | 5 (50.0%) | 25 (75.8%) |
| $800 to $1,499 | 0 (0.0%) | 5 (15.1%) |
| Total | 10 (100.0%) | 33 (100.0%) |
Health & Disability in Ekron
Health Insurance Coverage by Age in Ekron
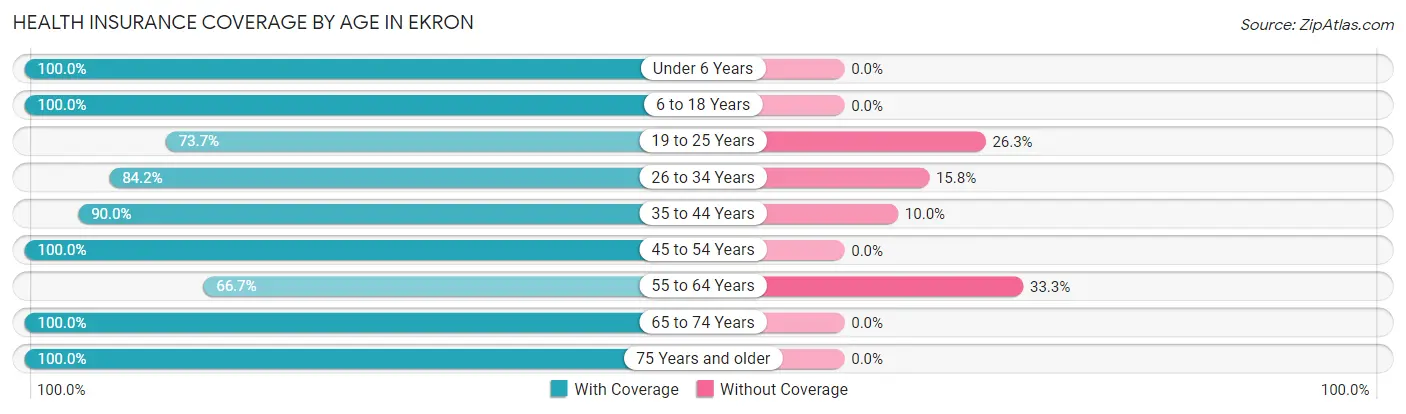
| Age Bracket | With Coverage | Without Coverage |
| Under 6 Years | 14 (100.0%) | 0 (0.0%) |
| 6 to 18 Years | 32 (100.0%) | 0 (0.0%) |
| 19 to 25 Years | 14 (73.7%) | 5 (26.3%) |
| 26 to 34 Years | 16 (84.2%) | 3 (15.8%) |
| 35 to 44 Years | 36 (90.0%) | 4 (10.0%) |
| 45 to 54 Years | 32 (100.0%) | 0 (0.0%) |
| 55 to 64 Years | 6 (66.7%) | 3 (33.3%) |
| 65 to 74 Years | 13 (100.0%) | 0 (0.0%) |
| 75 Years and older | 7 (100.0%) | 0 (0.0%) |
| Total | 170 (91.9%) | 15 (8.1%) |
Health Insurance Coverage by Citizenship Status in Ekron
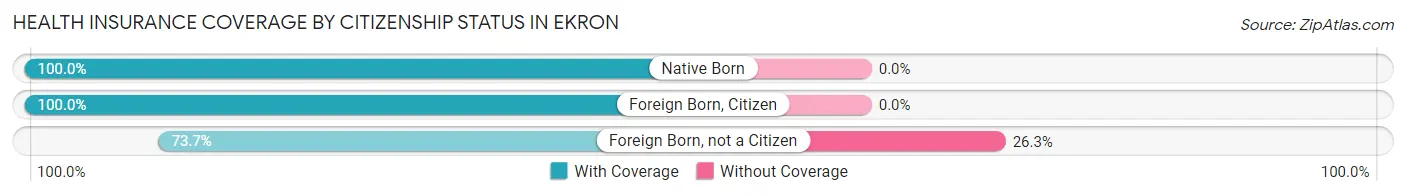
| Citizenship Status | With Coverage | Without Coverage |
| Native Born | 14 (100.0%) | 0 (0.0%) |
| Foreign Born, Citizen | 32 (100.0%) | 0 (0.0%) |
| Foreign Born, not a Citizen | 14 (73.7%) | 5 (26.3%) |
Health Insurance Coverage by Household Income in Ekron
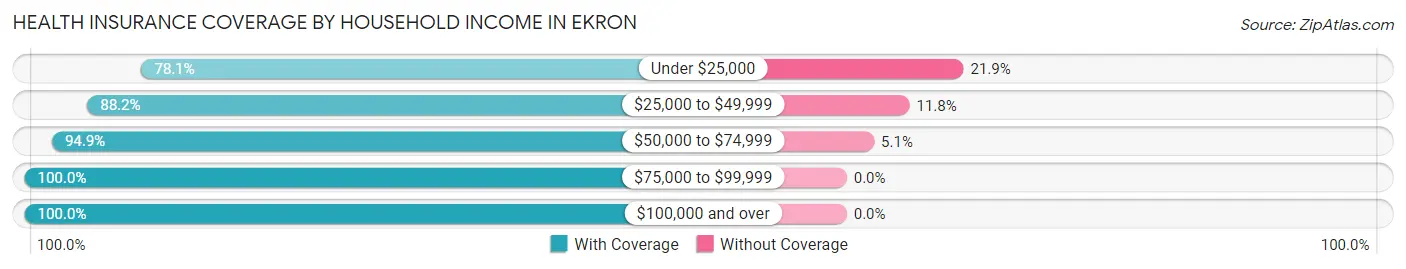
| Household Income | With Coverage | Without Coverage |
| Under $25,000 | 25 (78.1%) | 7 (21.9%) |
| $25,000 to $49,999 | 30 (88.2%) | 4 (11.8%) |
| $50,000 to $74,999 | 74 (94.9%) | 4 (5.1%) |
| $75,000 to $99,999 | 35 (100.0%) | 0 (0.0%) |
| $100,000 and over | 6 (100.0%) | 0 (0.0%) |
Public vs Private Health Insurance Coverage by Age in Ekron
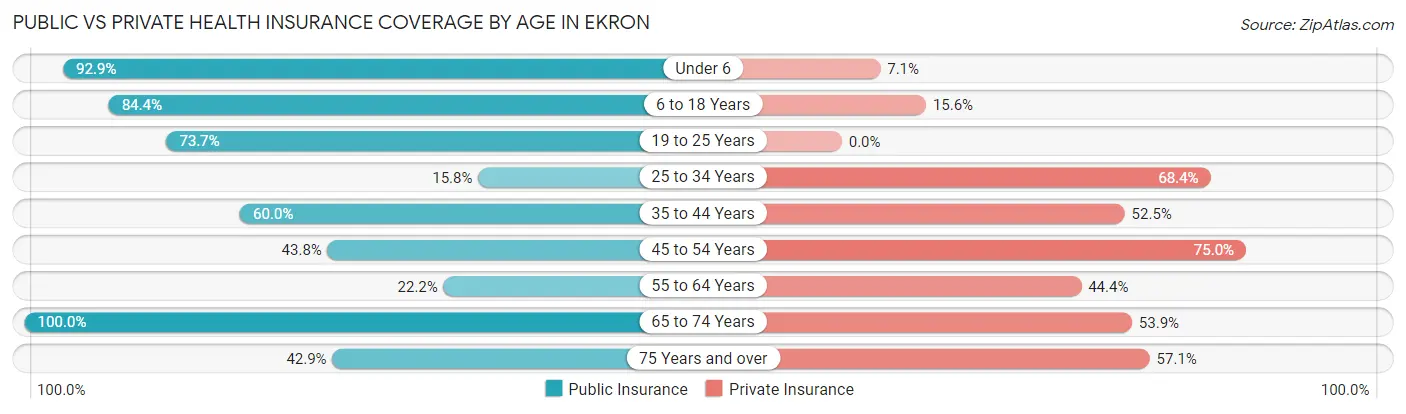
| Age Bracket | Public Insurance | Private Insurance |
| Under 6 | 13 (92.9%) | 1 (7.1%) |
| 6 to 18 Years | 27 (84.4%) | 5 (15.6%) |
| 19 to 25 Years | 14 (73.7%) | 0 (0.0%) |
| 25 to 34 Years | 3 (15.8%) | 13 (68.4%) |
| 35 to 44 Years | 24 (60.0%) | 21 (52.5%) |
| 45 to 54 Years | 14 (43.8%) | 24 (75.0%) |
| 55 to 64 Years | 2 (22.2%) | 4 (44.4%) |
| 65 to 74 Years | 13 (100.0%) | 7 (53.8%) |
| 75 Years and over | 3 (42.9%) | 4 (57.1%) |
| Total | 113 (61.1%) | 79 (42.7%) |
Disability Status by Sex by Age in Ekron
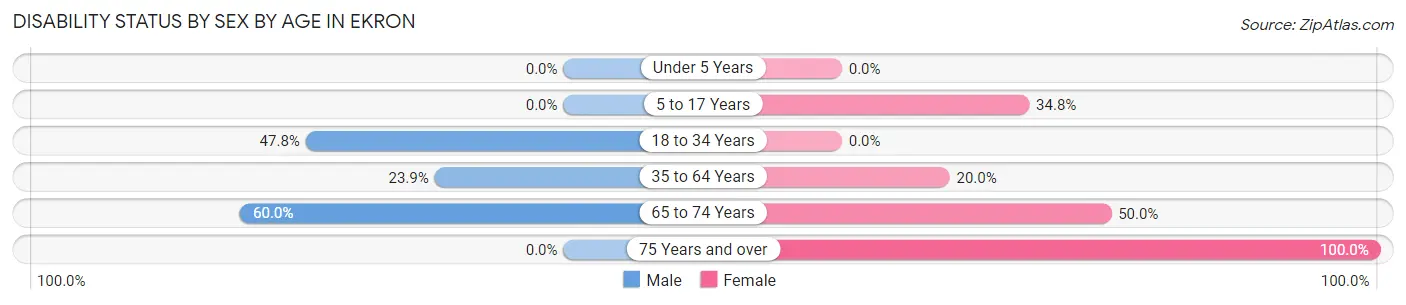
| Age Bracket | Male | Female |
| Under 5 Years | 0 (0.0%) | 0 (0.0%) |
| 5 to 17 Years | 0 (0.0%) | 8 (34.8%) |
| 18 to 34 Years | 11 (47.8%) | 0 (0.0%) |
| 35 to 64 Years | 11 (23.9%) | 7 (20.0%) |
| 65 to 74 Years | 3 (60.0%) | 4 (50.0%) |
| 75 Years and over | 0 (0.0%) | 7 (100.0%) |
Disability Class by Sex by Age in Ekron
Disability Class: Hearing Difficulty
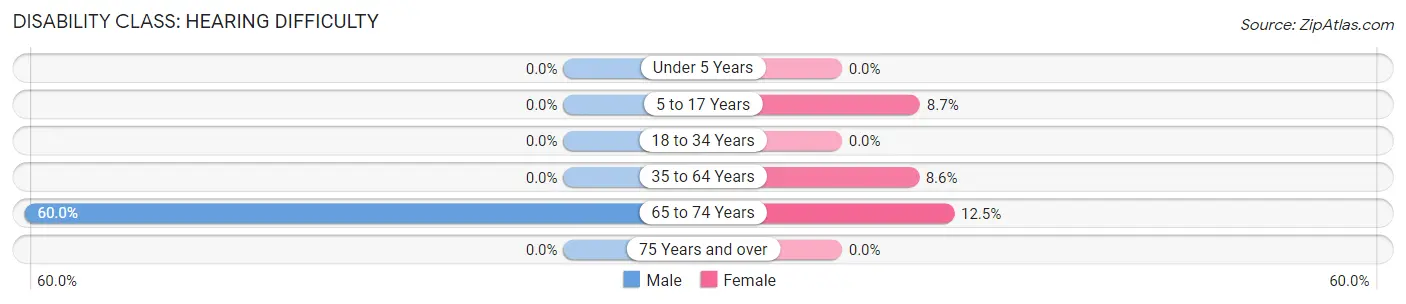
| Age Bracket | Male | Female |
| Under 5 Years | 0 (0.0%) | 0 (0.0%) |
| 5 to 17 Years | 0 (0.0%) | 2 (8.7%) |
| 18 to 34 Years | 0 (0.0%) | 0 (0.0%) |
| 35 to 64 Years | 0 (0.0%) | 3 (8.6%) |
| 65 to 74 Years | 3 (60.0%) | 1 (12.5%) |
| 75 Years and over | 0 (0.0%) | 0 (0.0%) |
Disability Class: Vision Difficulty
| Age Bracket | Male | Female |
| Under 5 Years | 0 (0.0%) | 0 (0.0%) |
| 5 to 17 Years | 0 (0.0%) | 0 (0.0%) |
| 18 to 34 Years | 0 (0.0%) | 0 (0.0%) |
| 35 to 64 Years | 0 (0.0%) | 0 (0.0%) |
| 65 to 74 Years | 0 (0.0%) | 0 (0.0%) |
| 75 Years and over | 0 (0.0%) | 0 (0.0%) |
Disability Class: Cognitive Difficulty
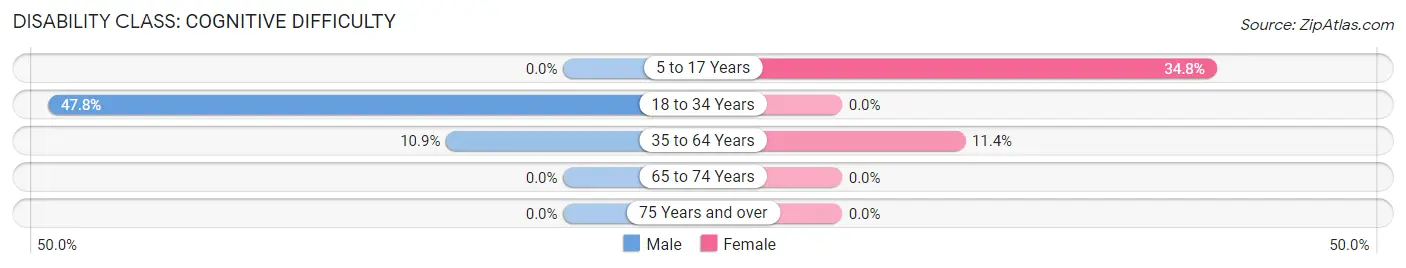
| Age Bracket | Male | Female |
| 5 to 17 Years | 0 (0.0%) | 8 (34.8%) |
| 18 to 34 Years | 11 (47.8%) | 0 (0.0%) |
| 35 to 64 Years | 5 (10.9%) | 4 (11.4%) |
| 65 to 74 Years | 0 (0.0%) | 0 (0.0%) |
| 75 Years and over | 0 (0.0%) | 0 (0.0%) |
Disability Class: Ambulatory Difficulty
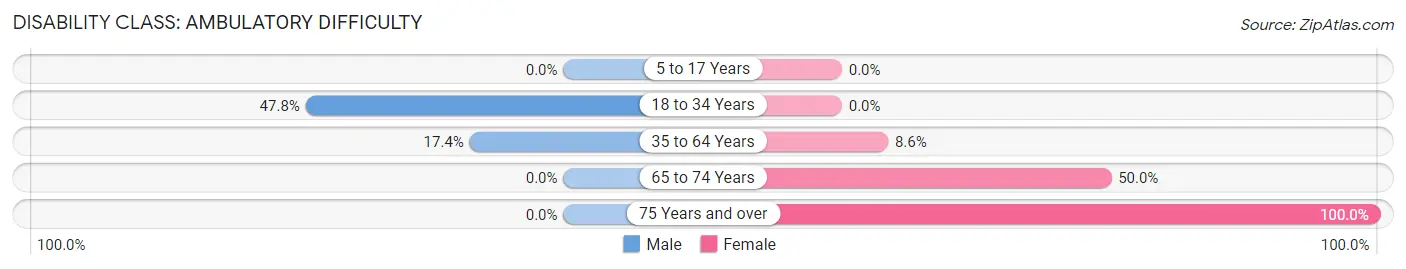
| Age Bracket | Male | Female |
| 5 to 17 Years | 0 (0.0%) | 0 (0.0%) |
| 18 to 34 Years | 11 (47.8%) | 0 (0.0%) |
| 35 to 64 Years | 8 (17.4%) | 3 (8.6%) |
| 65 to 74 Years | 0 (0.0%) | 4 (50.0%) |
| 75 Years and over | 0 (0.0%) | 7 (100.0%) |
Disability Class: Self-Care Difficulty
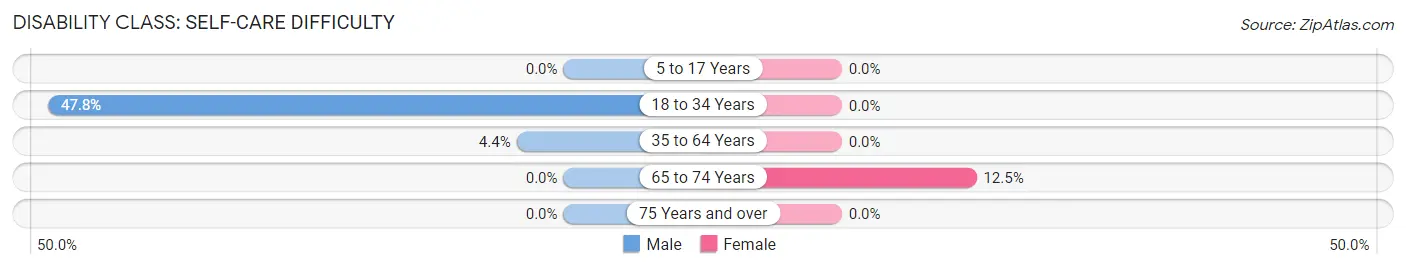
| Age Bracket | Male | Female |
| 5 to 17 Years | 0 (0.0%) | 0 (0.0%) |
| 18 to 34 Years | 11 (47.8%) | 0 (0.0%) |
| 35 to 64 Years | 2 (4.3%) | 0 (0.0%) |
| 65 to 74 Years | 0 (0.0%) | 1 (12.5%) |
| 75 Years and over | 0 (0.0%) | 0 (0.0%) |
Technology Access in Ekron
Computing Device Access in Ekron
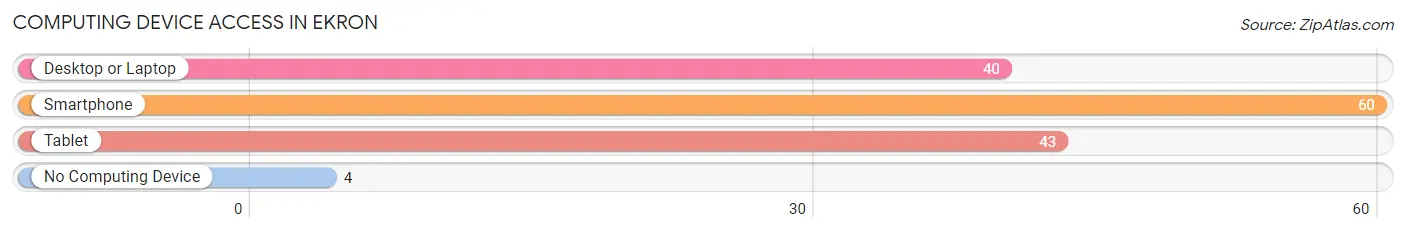
| Device Type | # Households | % Households |
| Desktop or Laptop | 40 | 61.5% |
| Smartphone | 60 | 92.3% |
| Tablet | 43 | 66.1% |
| No Computing Device | 4 | 6.1% |
| Total | 65 | 100.0% |
Internet Access in Ekron
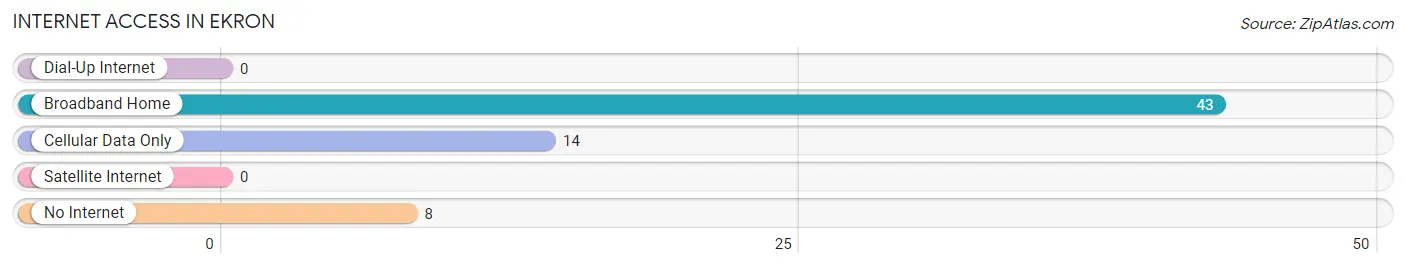
| Internet Type | # Households | % Households |
| Dial-Up Internet | 0 | 0.0% |
| Broadband Home | 43 | 66.1% |
| Cellular Data Only | 14 | 21.5% |
| Satellite Internet | 0 | 0.0% |
| No Internet | 8 | 12.3% |
| Total | 65 | 100.0% |
Ekron Summary
Ekron is a small unincorporated community located in Meade County, Kentucky. It is situated along the Ohio River, approximately 25 miles southwest of Louisville. The population of Ekron was estimated to be around 1,000 in 2020.
History
Ekron was first settled in the early 1800s by a group of German immigrants. The town was originally known as “Eckron”, which is derived from the German word for “corner”. The town was officially incorporated in 1837 and was named after the biblical city of Ekron.
In the late 1800s, Ekron was a thriving river port town. It was home to several businesses, including a sawmill, a gristmill, a blacksmith shop, and a general store. The town also had a post office, a school, and a church.
In the early 1900s, Ekron began to decline as the river port industry moved elsewhere. The town’s population decreased and many of the businesses closed. In the 1950s, the town was revitalized when the Ekron Army Airfield was built nearby. The airfield was used as a training facility for the U.S. Air Force and the Kentucky Air National Guard.
Geography
Ekron is located in Meade County, Kentucky, along the Ohio River. The town is situated on the western edge of the county, approximately 25 miles southwest of Louisville. The terrain in the area is mostly flat, with some rolling hills. The climate is humid subtropical, with hot summers and mild winters.
Economy
The economy of Ekron is largely based on agriculture. The town is home to several farms, which produce corn, soybeans, wheat, and hay. There are also several small businesses in the area, including a gas station, a convenience store, and a restaurant.
Demographics
As of 2020, the population of Ekron was estimated to be around 1,000. The town is predominantly white, with a small African American population. The median household income in Ekron is $45,000, and the median home value is $125,000. The town has a low unemployment rate and a high rate of homeownership.
Conclusion
Ekron is a small unincorporated community located in Meade County, Kentucky. It is situated along the Ohio River, approximately 25 miles southwest of Louisville. The town was first settled in the early 1800s by a group of German immigrants and was officially incorporated in 1837. The economy of Ekron is largely based on agriculture, and the town is home to several small businesses. The population of Ekron was estimated to be around 1,000 in 2020.
Common Questions
What is Per Capita Income in Ekron?
Per Capita income in Ekron is $19,635.
What is the Median Family Income in Ekron?
Median Family Income in Ekron is $51,250.
What is the Median Household income in Ekron?
Median Household Income in Ekron is $50,179.
What is Income or Wage Gap in Ekron?
Income or Wage Gap in Ekron is 10.2%.
Women in Ekron earn 89.8 cents for every dollar earned by a man.
What is Family Income Deficit in Ekron?
Family Income Deficit in Ekron is $11,338.
Families that are below poverty line in Ekron earn $11,338 less on average than the poverty threshold level.
What is Inequality or Gini Index in Ekron?
Inequality or Gini Index in Ekron is 0.38.
What is the Total Population of Ekron?
Total Population of Ekron is 185.
What is the Total Male Population of Ekron?
Total Male Population of Ekron is 82.
What is the Total Female Population of Ekron?
Total Female Population of Ekron is 103.
What is the Ratio of Males per 100 Females in Ekron?
There are 79.61 Males per 100 Females in Ekron.
What is the Ratio of Females per 100 Males in Ekron?
There are 125.61 Females per 100 Males in Ekron.
What is the Median Population Age in Ekron?
Median Population Age in Ekron is 37.7 Years.
What is the Average Family Size in Ekron
Average Family Size in Ekron is 3.0 People.
What is the Average Household Size in Ekron
Average Household Size in Ekron is 2.9 People.
How Large is the Labor Force in Ekron?
There are 84 People in the Labor Forcein in Ekron.
What is the Percentage of People in the Labor Force in Ekron?
56.0% of People are in the Labor Force in Ekron.