Cawood, KY Map & Demographics
Cawood Map
Cawood Overview
$20,920
PER CAPITA INCOME
$42,333
AVG FAMILY INCOME
$41,556
AVG HOUSEHOLD INCOME
0.33
INEQUALITY / GINI INDEX
526
TOTAL POPULATION
319
MALE POPULATION
207
FEMALE POPULATION
154.11
MALES / 100 FEMALES
64.89
FEMALES / 100 MALES
40.6
MEDIAN AGE
2.5
AVG FAMILY SIZE
2.3
AVG HOUSEHOLD SIZE
179
LABOR FORCE [ PEOPLE ]
40.2%
PERCENT IN LABOR FORCE
Cawood Zip Codes
Cawood Area Codes
Income in Cawood
Income Overview in Cawood
Per Capita Income in Cawood is $20,920, while median incomes of families and households are $42,333 and $41,556 respectively.
| Characteristic | Number | Measure |
| Per Capita Income | 526 | $20,920 |
| Median Family Income | 198 | $42,333 |
| Mean Family Income | 198 | $56,367 |
| Median Household Income | 226 | $41,556 |
| Mean Household Income | 226 | $52,567 |
| Income Deficit | 198 | $0 |
| Wage / Income Gap (%) | 526 | 0.00% |
| Wage / Income Gap ($) | 526 | 100.00¢ per $1 |
| Gini / Inequality Index | 526 | 0.33 |
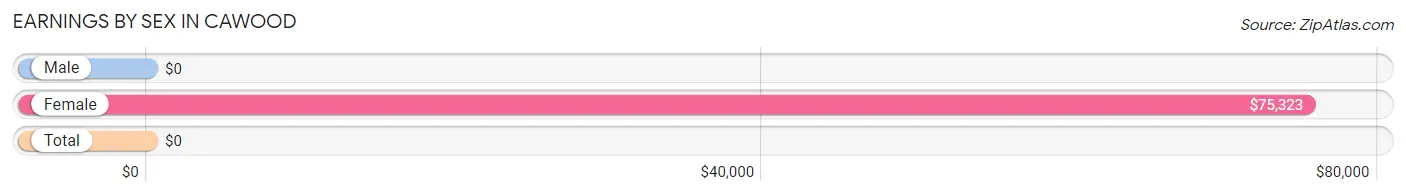
Earnings by Sex in Cawood
| Sex | Number | Average Earnings |
| Male | 125 (69.8%) | $0 |
| Female | 54 (30.2%) | $75,323 |
| Total | 179 (100.0%) | $0 |
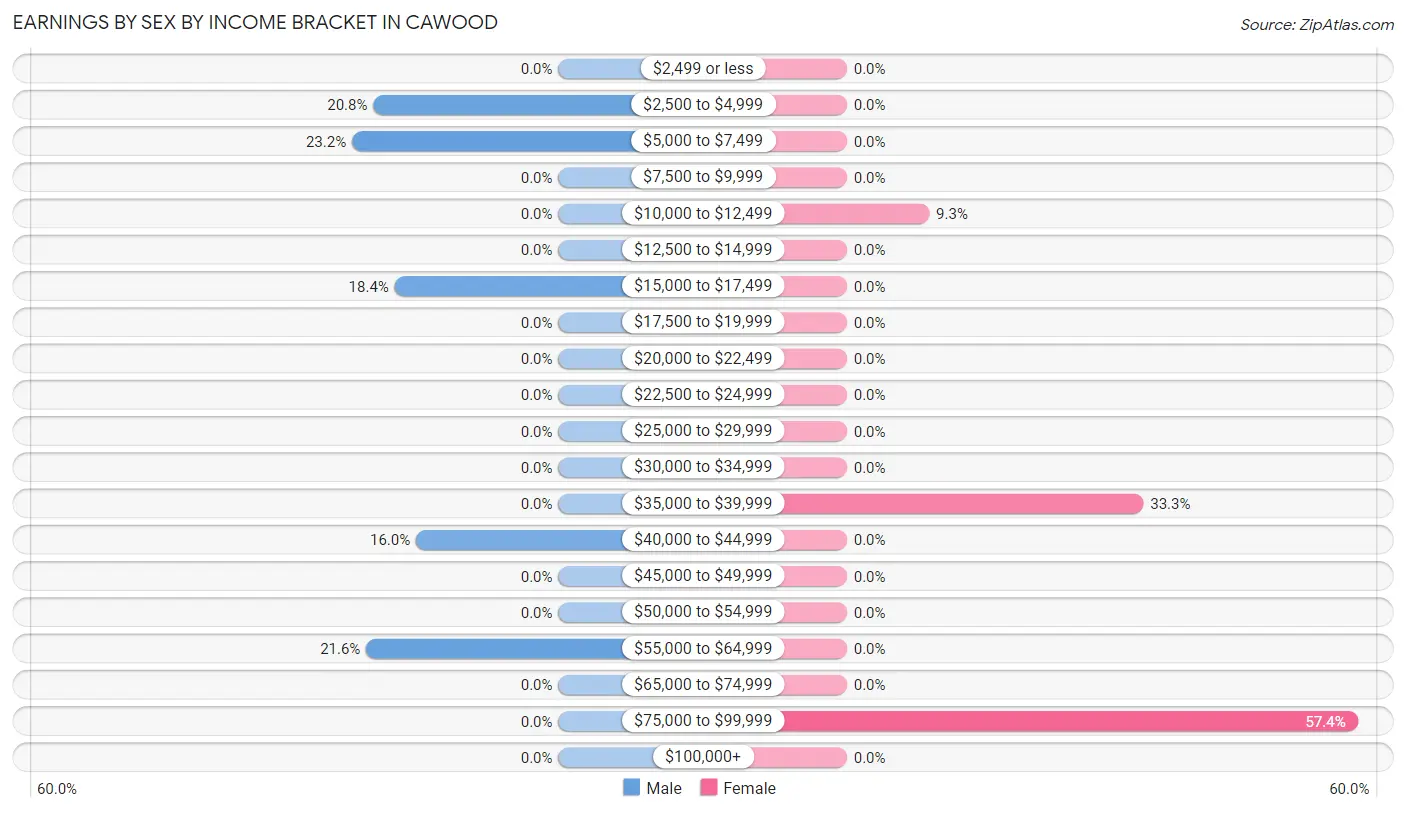
Earnings by Sex by Income Bracket in Cawood
The most common earnings brackets in Cawood are $5,000 to $7,499 for men (29 | 23.2%) and $75,000 to $99,999 for women (31 | 57.4%).
| Income | Male | Female |
| $2,499 or less | 0 (0.0%) | 0 (0.0%) |
| $2,500 to $4,999 | 26 (20.8%) | 0 (0.0%) |
| $5,000 to $7,499 | 29 (23.2%) | 0 (0.0%) |
| $7,500 to $9,999 | 0 (0.0%) | 0 (0.0%) |
| $10,000 to $12,499 | 0 (0.0%) | 5 (9.3%) |
| $12,500 to $14,999 | 0 (0.0%) | 0 (0.0%) |
| $15,000 to $17,499 | 23 (18.4%) | 0 (0.0%) |
| $17,500 to $19,999 | 0 (0.0%) | 0 (0.0%) |
| $20,000 to $22,499 | 0 (0.0%) | 0 (0.0%) |
| $22,500 to $24,999 | 0 (0.0%) | 0 (0.0%) |
| $25,000 to $29,999 | 0 (0.0%) | 0 (0.0%) |
| $30,000 to $34,999 | 0 (0.0%) | 0 (0.0%) |
| $35,000 to $39,999 | 0 (0.0%) | 18 (33.3%) |
| $40,000 to $44,999 | 20 (16.0%) | 0 (0.0%) |
| $45,000 to $49,999 | 0 (0.0%) | 0 (0.0%) |
| $50,000 to $54,999 | 0 (0.0%) | 0 (0.0%) |
| $55,000 to $64,999 | 27 (21.6%) | 0 (0.0%) |
| $65,000 to $74,999 | 0 (0.0%) | 0 (0.0%) |
| $75,000 to $99,999 | 0 (0.0%) | 31 (57.4%) |
| $100,000+ | 0 (0.0%) | 0 (0.0%) |
| Total | 125 (100.0%) | 54 (100.0%) |
Earnings by Sex by Educational Attainment in Cawood
| Educational Attainment | Male Income | Female Income |
| Less than High School | - | - |
| High School Diploma | - | - |
| College or Associate's Degree | - | - |
| Bachelor's Degree | - | - |
| Graduate Degree | - | - |
| Total | - | - |
Family Income in Cawood
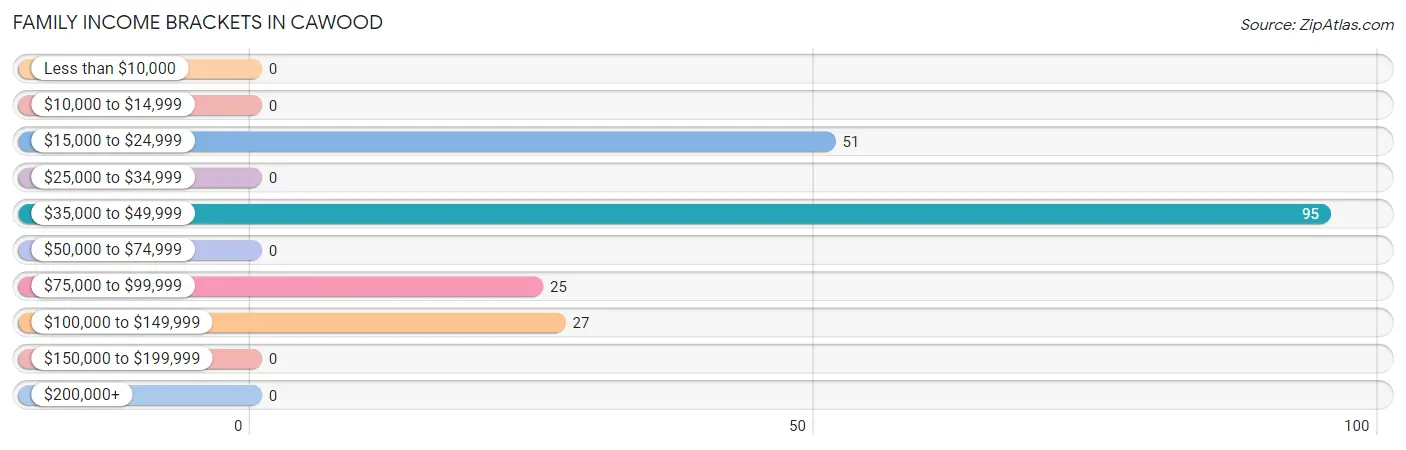
Family Income Brackets in Cawood
According to the Cawood family income data, there are 95 families falling into the $35,000 to $49,999 income range, which is the most common income bracket and makes up 48.0% of all families.
| Income Bracket | # Families | % Families |
| Less than $10,000 | 0 | 0.0% |
| $10,000 to $14,999 | 0 | 0.0% |
| $15,000 to $24,999 | 51 | 25.8% |
| $25,000 to $34,999 | 0 | 0.0% |
| $35,000 to $49,999 | 95 | 48.0% |
| $50,000 to $74,999 | 0 | 0.0% |
| $75,000 to $99,999 | 25 | 12.6% |
| $100,000 to $149,999 | 27 | 13.6% |
| $150,000 to $199,999 | 0 | 0.0% |
| $200,000+ | 0 | 0.0% |
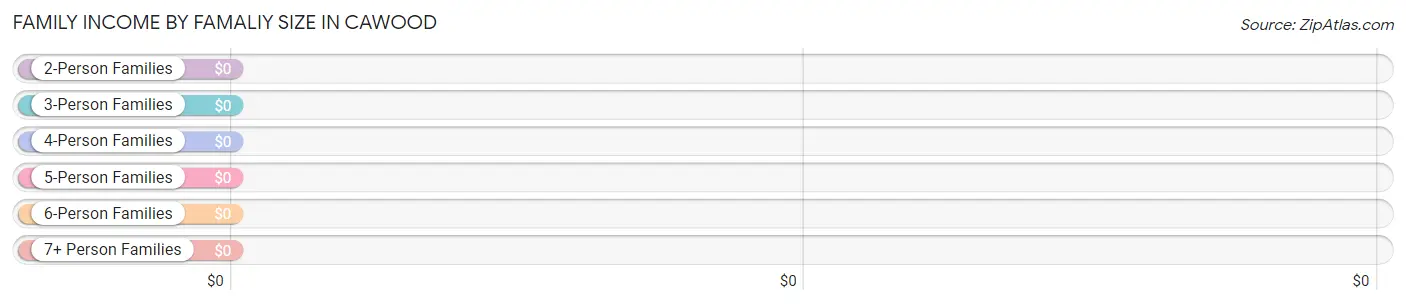
Family Income by Famaliy Size in Cawood
| Income Bracket | # Families | Median Income |
| 2-Person Families | 110 (55.6%) | $0 |
| 3-Person Families | 43 (21.7%) | $0 |
| 4-Person Families | 45 (22.7%) | $0 |
| 5-Person Families | 0 (0.0%) | $0 |
| 6-Person Families | 0 (0.0%) | $0 |
| 7+ Person Families | 0 (0.0%) | $0 |
| Total | 198 (100.0%) | $42,333 |
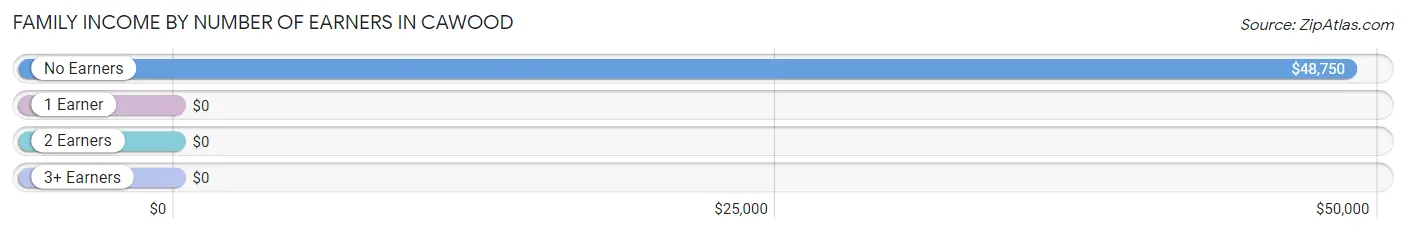
Family Income by Number of Earners in Cawood
| Number of Earners | # Families | Median Income |
| No Earners | 76 (38.4%) | $48,750 |
| 1 Earner | 51 (25.8%) | $0 |
| 2 Earners | 71 (35.9%) | $0 |
| 3+ Earners | 0 (0.0%) | $0 |
| Total | 198 (100.0%) | $42,333 |
Household Income in Cawood
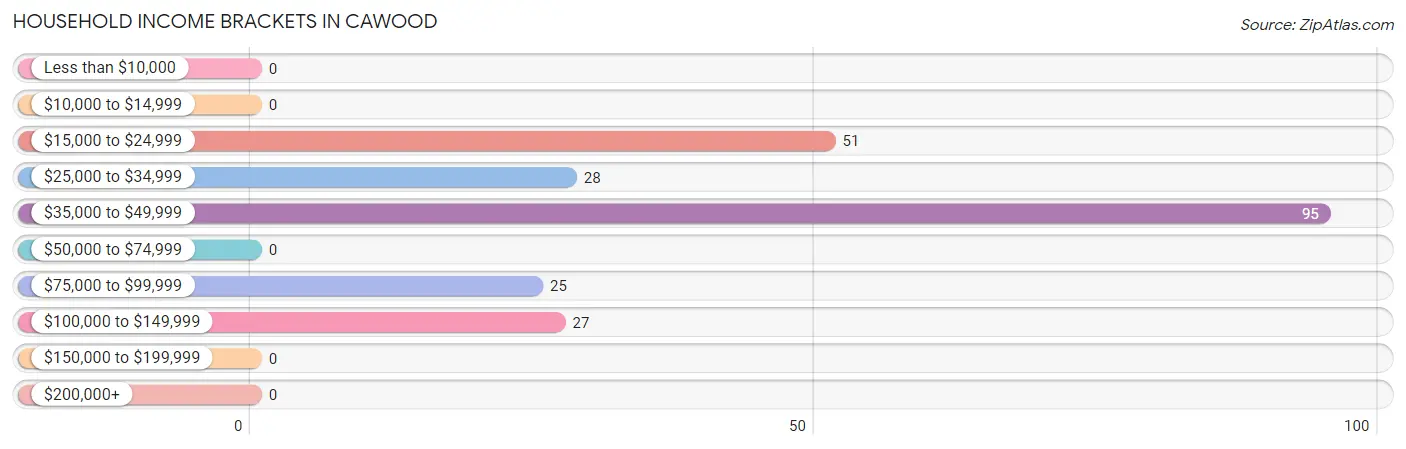
Household Income Brackets in Cawood
With 95 households falling in the category, the $35,000 to $49,999 income range is the most frequent in Cawood, accounting for 42.0% of all households.
| Income Bracket | # Households | % Households |
| Less than $10,000 | 0 | 0.0% |
| $10,000 to $14,999 | 0 | 0.0% |
| $15,000 to $24,999 | 51 | 22.6% |
| $25,000 to $34,999 | 28 | 12.4% |
| $35,000 to $49,999 | 95 | 42.0% |
| $50,000 to $74,999 | 0 | 0.0% |
| $75,000 to $99,999 | 25 | 11.1% |
| $100,000 to $149,999 | 27 | 11.9% |
| $150,000 to $199,999 | 0 | 0.0% |
| $200,000+ | 0 | 0.0% |
Household Income by Householder Age in Cawood
| Income Bracket | # Households | Median Income |
| 15 to 24 Years | 0 (0.0%) | $0 |
| 25 to 44 Years | 90 (39.8%) | $0 |
| 45 to 64 Years | 32 (14.2%) | $0 |
| 65+ Years | 104 (46.0%) | $0 |
| Total | 226 (100.0%) | $41,556 |
Poverty in Cawood
Income Below Poverty by Sex and Age in Cawood
| Age Bracket | Male | Female |
| Under 5 Years | 0 (0.0%) | 0 (0.0%) |
| 5 Years | 0 (0.0%) | 0 (0.0%) |
| 6 to 11 Years | 0 (0.0%) | 0 (0.0%) |
| 12 to 14 Years | 0 (0.0%) | 0 (0.0%) |
| 15 Years | 0 (0.0%) | 0 (0.0%) |
| 16 and 17 Years | 0 (0.0%) | 0 (0.0%) |
| 18 to 24 Years | 0 (0.0%) | 0 (0.0%) |
| 25 to 34 Years | 0 (0.0%) | 0 (0.0%) |
| 35 to 44 Years | 0 (0.0%) | 0 (0.0%) |
| 45 to 54 Years | 0 (0.0%) | 0 (0.0%) |
| 55 to 64 Years | 0 (0.0%) | 0 (0.0%) |
| 65 to 74 Years | 0 (0.0%) | 0 (0.0%) |
| 75 Years and over | 0 (0.0%) | 0 (0.0%) |
| Total | 0 (0.0%) | 0 (0.0%) |
Income Above Poverty by Sex and Age in Cawood
According to the poverty statistics in Cawood, males aged 12 to 14 years and females aged 25 to 34 years are the age groups that are most secure financially, with 100.0% of males and 100.0% of females in these age groups living above the poverty line.
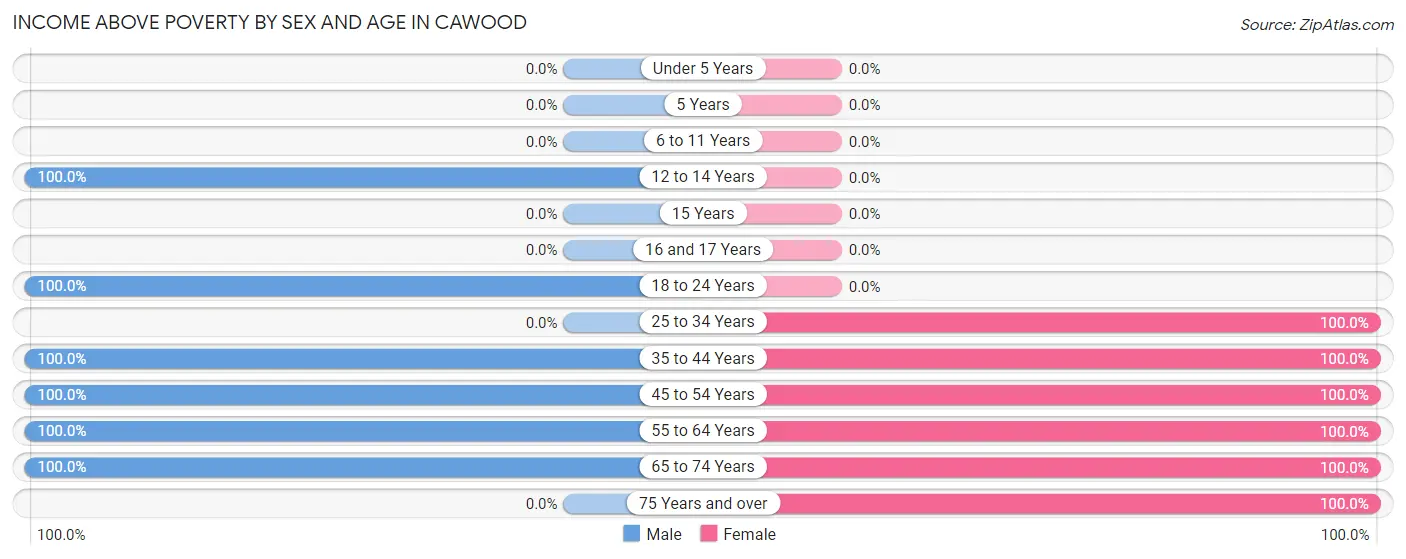
| Age Bracket | Male | Female |
| Under 5 Years | 0 (0.0%) | 0 (0.0%) |
| 5 Years | 0 (0.0%) | 0 (0.0%) |
| 6 to 11 Years | 0 (0.0%) | 0 (0.0%) |
| 12 to 14 Years | 81 (100.0%) | 0 (0.0%) |
| 15 Years | 0 (0.0%) | 0 (0.0%) |
| 16 and 17 Years | 0 (0.0%) | 0 (0.0%) |
| 18 to 24 Years | 78 (100.0%) | 0 (0.0%) |
| 25 to 34 Years | 0 (0.0%) | 49 (100.0%) |
| 35 to 44 Years | 55 (100.0%) | 45 (100.0%) |
| 45 to 54 Years | 73 (100.0%) | 8 (100.0%) |
| 55 to 64 Years | 6 (100.0%) | 27 (100.0%) |
| 65 to 74 Years | 26 (100.0%) | 53 (100.0%) |
| 75 Years and over | 0 (0.0%) | 25 (100.0%) |
| Total | 319 (100.0%) | 207 (100.0%) |
Income Below Poverty Among Married-Couple Families in Cawood
| Children | Above Poverty | Below Poverty |
| No Children | 59 (100.0%) | 0 (0.0%) |
| 1 or 2 Children | 45 (100.0%) | 0 (0.0%) |
| 3 or 4 Children | 0 (0.0%) | 0 (0.0%) |
| 5 or more Children | 0 (0.0%) | 0 (0.0%) |
| Total | 104 (100.0%) | 0 (0.0%) |
Income Below Poverty Among Single-Parent Households in Cawood
| Children | Single Father | Single Mother |
| No Children | 0 (0.0%) | 0 (0.0%) |
| 1 or 2 Children | 0 (0.0%) | 0 (0.0%) |
| 3 or 4 Children | 0 (0.0%) | 0 (0.0%) |
| 5 or more Children | 0 (0.0%) | 0 (0.0%) |
| Total | 0 (0.0%) | 0 (0.0%) |
Income Below Poverty Among Married-Couple vs Single-Parent Households in Cawood
| Children | Married-Couple Families | Single-Parent Households |
| No Children | 0 (0.0%) | 0 (0.0%) |
| 1 or 2 Children | 0 (0.0%) | 0 (0.0%) |
| 3 or 4 Children | 0 (0.0%) | 0 (0.0%) |
| 5 or more Children | 0 (0.0%) | 0 (0.0%) |
| Total | 0 (0.0%) | 0 (0.0%) |
Race in Cawood
The most populous races in Cawood are White / Caucasian (435 | 82.7%), Black / African American (64 | 12.2%), and Two or more Races (27 | 5.1%).
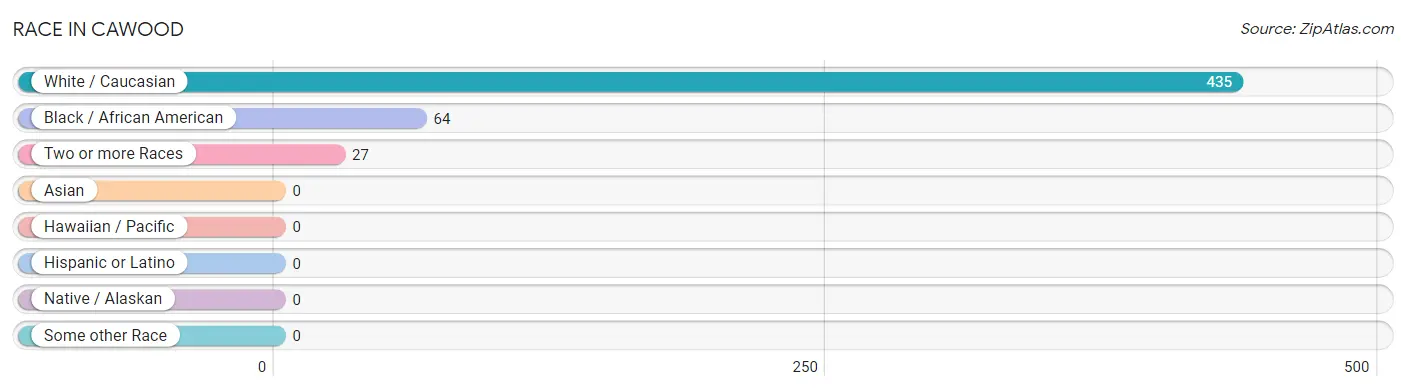
| Race | # Population | % Population |
| Asian | 0 | 0.0% |
| Black / African American | 64 | 12.2% |
| Hawaiian / Pacific | 0 | 0.0% |
| Hispanic or Latino | 0 | 0.0% |
| Native / Alaskan | 0 | 0.0% |
| White / Caucasian | 435 | 82.7% |
| Two or more Races | 27 | 5.1% |
| Some other Race | 0 | 0.0% |
| Total | 526 | 100.0% |
Ancestry in Cawood
The most populous ancestries reported in Cawood are English (48 | 9.1%), Northern European (28 | 5.3%), Irish (27 | 5.1%), American (11 | 2.1%), and German (8 | 1.5%), together accounting for 23.2% of all Cawood residents.
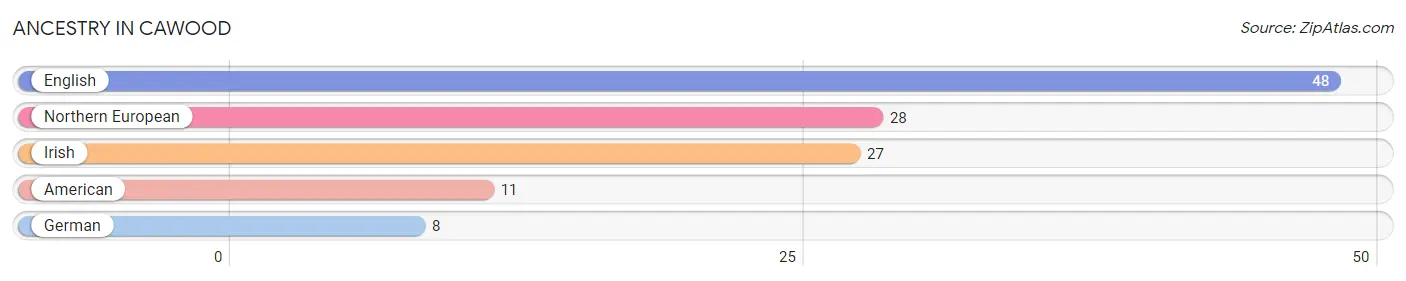
| Ancestry | # Population | % Population |
| American | 11 | 2.1% |
| English | 48 | 9.1% |
| German | 8 | 1.5% |
| Irish | 27 | 5.1% |
| Northern European | 28 | 5.3% | View All 5 Rows |
Immigrants in Cawood

| Immigration Origin | # Population | % Population | View All 0 Rows |
Sex and Age in Cawood
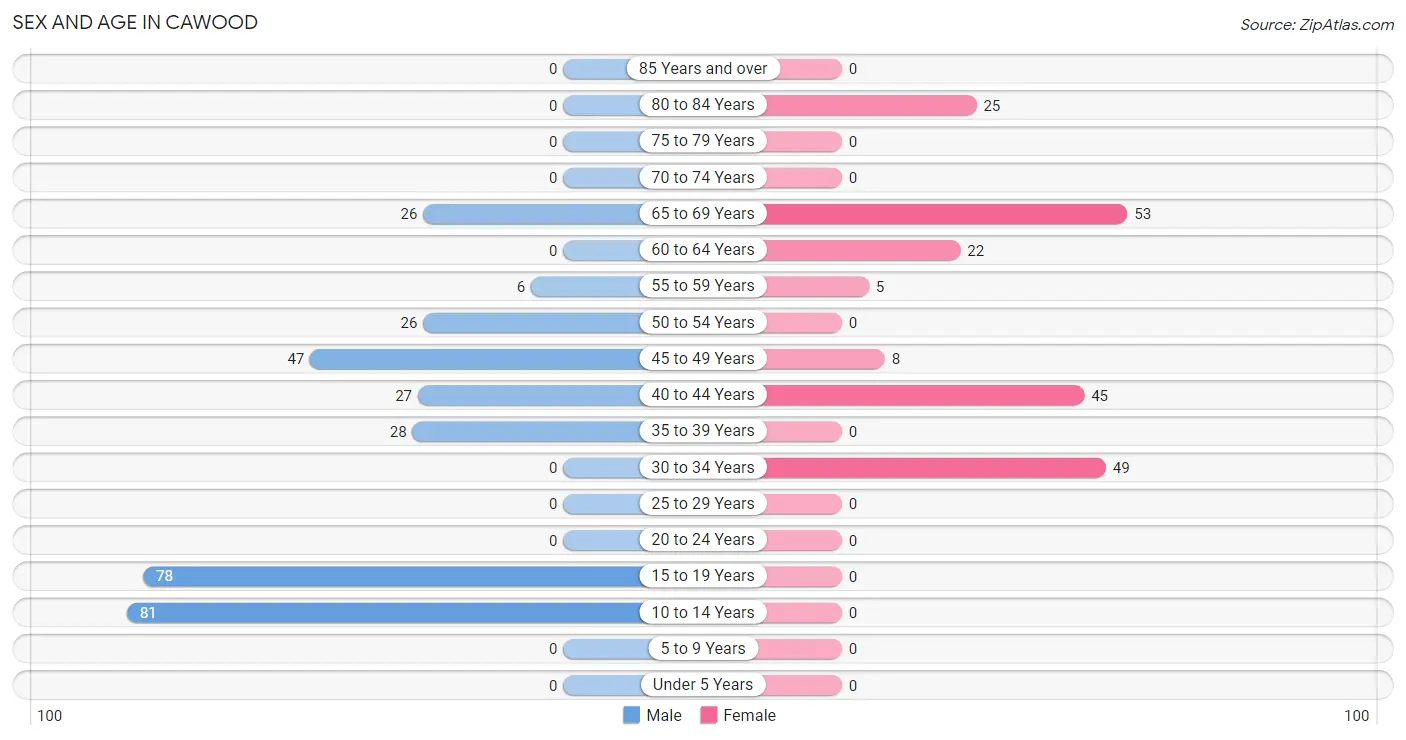
Sex and Age in Cawood
The most populous age groups in Cawood are 10 to 14 Years (81 | 25.4%) for men and 65 to 69 Years (53 | 25.6%) for women.
| Age Bracket | Male | Female |
| Under 5 Years | 0 (0.0%) | 0 (0.0%) |
| 5 to 9 Years | 0 (0.0%) | 0 (0.0%) |
| 10 to 14 Years | 81 (25.4%) | 0 (0.0%) |
| 15 to 19 Years | 78 (24.4%) | 0 (0.0%) |
| 20 to 24 Years | 0 (0.0%) | 0 (0.0%) |
| 25 to 29 Years | 0 (0.0%) | 0 (0.0%) |
| 30 to 34 Years | 0 (0.0%) | 49 (23.7%) |
| 35 to 39 Years | 28 (8.8%) | 0 (0.0%) |
| 40 to 44 Years | 27 (8.5%) | 45 (21.7%) |
| 45 to 49 Years | 47 (14.7%) | 8 (3.9%) |
| 50 to 54 Years | 26 (8.2%) | 0 (0.0%) |
| 55 to 59 Years | 6 (1.9%) | 5 (2.4%) |
| 60 to 64 Years | 0 (0.0%) | 22 (10.6%) |
| 65 to 69 Years | 26 (8.2%) | 53 (25.6%) |
| 70 to 74 Years | 0 (0.0%) | 0 (0.0%) |
| 75 to 79 Years | 0 (0.0%) | 0 (0.0%) |
| 80 to 84 Years | 0 (0.0%) | 25 (12.1%) |
| 85 Years and over | 0 (0.0%) | 0 (0.0%) |
| Total | 319 (100.0%) | 207 (100.0%) |
Families and Households in Cawood
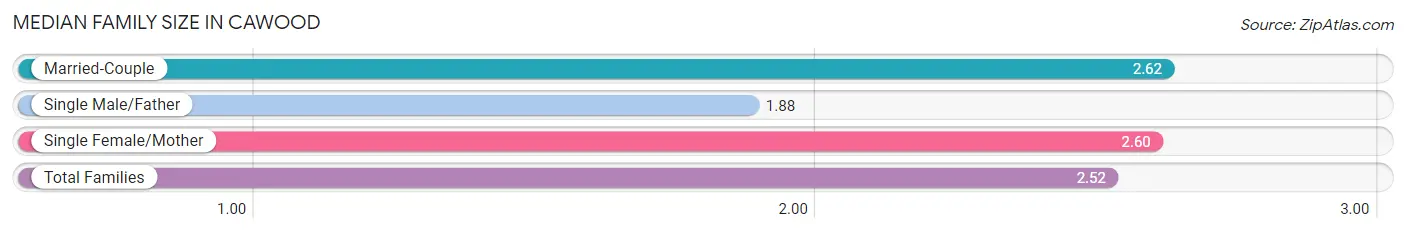
Median Family Size in Cawood
The median family size in Cawood is 2.52 persons per family, with married-couple families (104 | 52.5%) accounting for the largest median family size of 2.62 persons per family. On the other hand, single male/father families (26 | 13.1%) represent the smallest median family size with 1.88 persons per family.
| Family Type | # Families | Family Size |
| Married-Couple | 104 (52.5%) | 2.62 |
| Single Male/Father | 26 (13.1%) | 1.88 |
| Single Female/Mother | 68 (34.3%) | 2.60 |
| Total Families | 198 (100.0%) | 2.52 |
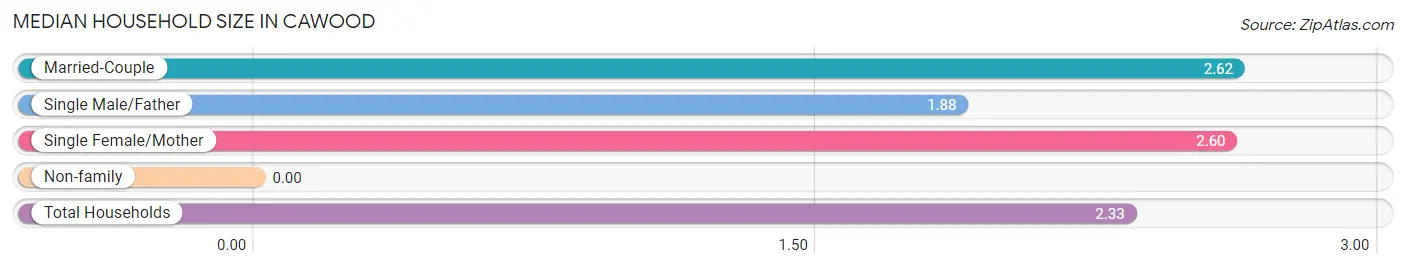
Median Household Size in Cawood
| Household Type | # Households | Household Size |
| Married-Couple | 104 (46.0%) | 2.62 |
| Single Male/Father | 26 (11.5%) | 1.88 |
| Single Female/Mother | 68 (30.1%) | 2.60 |
| Non-family | 28 (12.4%) | - |
| Total Households | 226 (100.0%) | 2.33 |
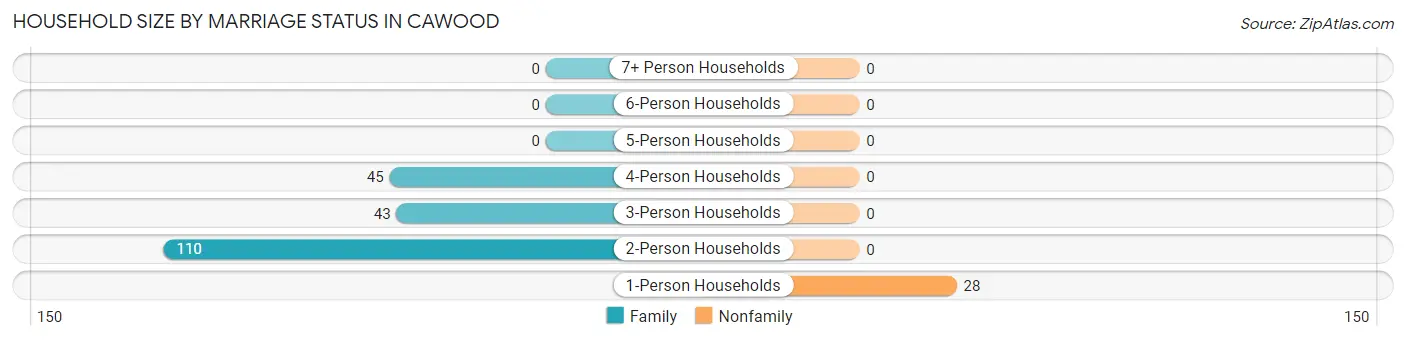
Household Size by Marriage Status in Cawood
Out of a total of 226 households in Cawood, 198 (87.6%) are family households, while 28 (12.4%) are nonfamily households. The most numerous type of family households are 2-person households, comprising 110, and the most common type of nonfamily households are 1-person households, comprising 28.
| Household Size | Family Households | Nonfamily Households |
| 1-Person Households | - | 28 (12.4%) |
| 2-Person Households | 110 (48.7%) | 0 (0.0%) |
| 3-Person Households | 43 (19.0%) | 0 (0.0%) |
| 4-Person Households | 45 (19.9%) | 0 (0.0%) |
| 5-Person Households | 0 (0.0%) | 0 (0.0%) |
| 6-Person Households | 0 (0.0%) | 0 (0.0%) |
| 7+ Person Households | 0 (0.0%) | 0 (0.0%) |
| Total | 198 (87.6%) | 28 (12.4%) |
Female Fertility in Cawood
Fertility by Age in Cawood
| Age Bracket | Women with Births | Births / 1,000 Women |
| 15 to 19 years | 0 (0.0%) | 0.0 |
| 20 to 34 years | 0 (0.0%) | 0.0 |
| 35 to 50 years | 0 (0.0%) | 0.0 |
| Total | 0 (0.0%) | 0.0 |
Fertility by Age by Marriage Status in Cawood
| Age Bracket | Married | Unmarried |
| 15 to 19 years | 0 (0.0%) | 0 (0.0%) |
| 20 to 34 years | 0 (0.0%) | 0 (0.0%) |
| 35 to 50 years | 0 (0.0%) | 0 (0.0%) |
| Total | 0 (0.0%) | 0 (0.0%) |
Fertility by Education in Cawood
| Educational Attainment | Women with Births | Births / 1,000 Women |
| Less than High School | 0 (0.0%) | 0.0 |
| High School Diploma | 0 (0.0%) | 0.0 |
| College or Associate's Degree | 0 (0.0%) | 0.0 |
| Bachelor's Degree | 0 (0.0%) | 0.0 |
| Graduate Degree | 0 (0.0%) | 0.0 |
| Total | 0 (0.0%) | 0.0 |
Fertility by Education by Marriage Status in Cawood
| Educational Attainment | Married | Unmarried |
| Less than High School | 0 (0.0%) | 0 (0.0%) |
| High School Diploma | 0 (0.0%) | 0 (0.0%) |
| College or Associate's Degree | 0 (0.0%) | 0 (0.0%) |
| Bachelor's Degree | 0 (0.0%) | 0 (0.0%) |
| Graduate Degree | 0 (0.0%) | 0 (0.0%) |
| Total | 0 (0.0%) | 0 (0.0%) |
Employment Characteristics in Cawood
Employment by Class of Employer in Cawood
Among the 179 employed individuals in Cawood, private company employees (93 | 52.0%), not-for-profit organizations (58 | 32.4%), and local government employees (23 | 12.9%) make up the most common classes of employment.
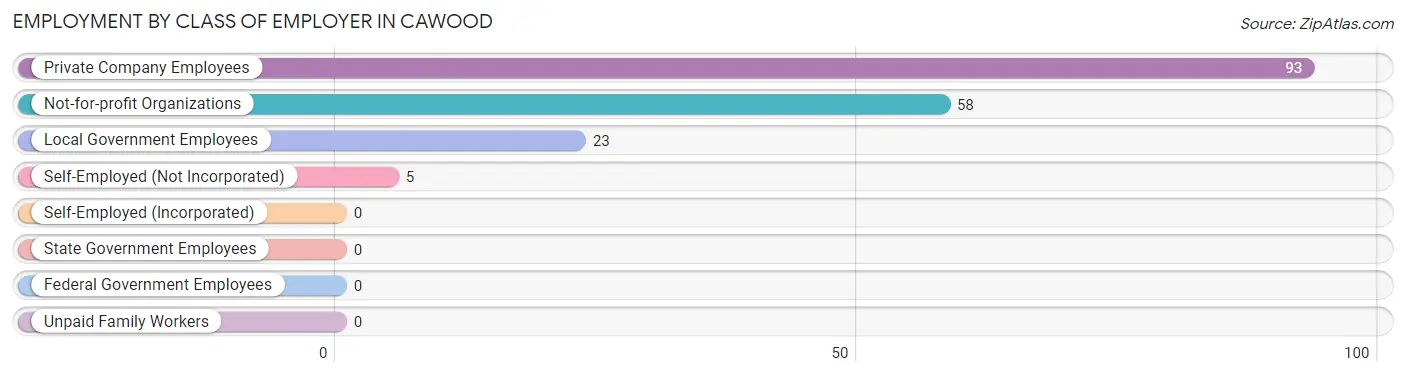
| Employer Class | # Employees | % Employees |
| Private Company Employees | 93 | 52.0% |
| Self-Employed (Incorporated) | 0 | 0.0% |
| Self-Employed (Not Incorporated) | 5 | 2.8% |
| Not-for-profit Organizations | 58 | 32.4% |
| Local Government Employees | 23 | 12.9% |
| State Government Employees | 0 | 0.0% |
| Federal Government Employees | 0 | 0.0% |
| Unpaid Family Workers | 0 | 0.0% |
| Total | 179 | 100.0% |
Employment Status by Age in Cawood
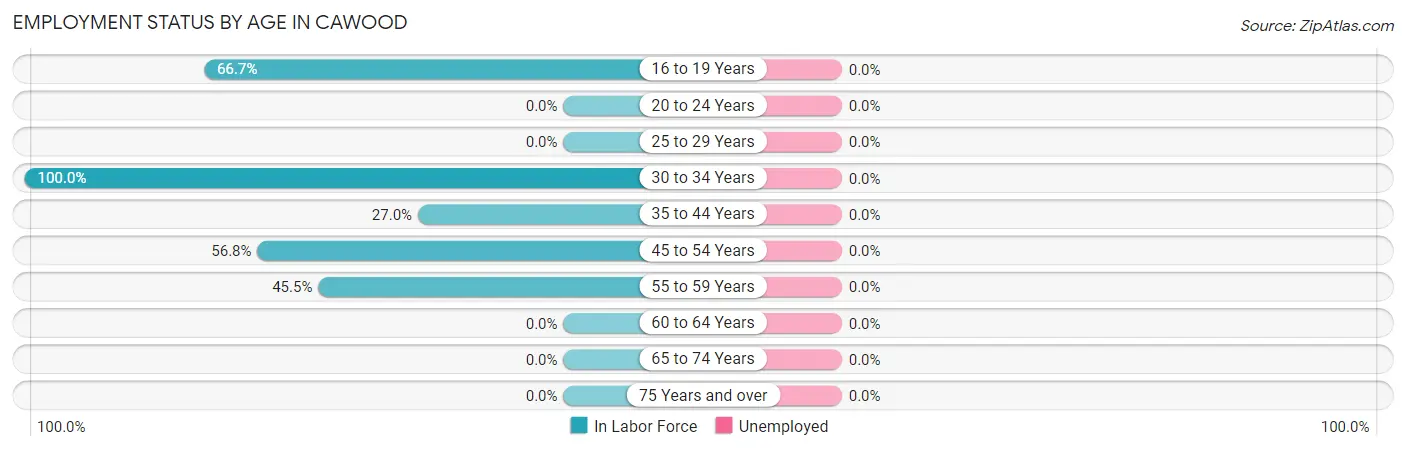
| Age Bracket | In Labor Force | Unemployed |
| 16 to 19 Years | 52 (66.7%) | 0 (0.0%) |
| 20 to 24 Years | 0 (0.0%) | 0 (0.0%) |
| 25 to 29 Years | 0 (0.0%) | 0 (0.0%) |
| 30 to 34 Years | 49 (100.0%) | 0 (0.0%) |
| 35 to 44 Years | 27 (27.0%) | 0 (0.0%) |
| 45 to 54 Years | 46 (56.8%) | 0 (0.0%) |
| 55 to 59 Years | 5 (45.5%) | 0 (0.0%) |
| 60 to 64 Years | 0 (0.0%) | 0 (0.0%) |
| 65 to 74 Years | 0 (0.0%) | 0 (0.0%) |
| 75 Years and over | 0 (0.0%) | 0 (0.0%) |
| Total | 179 (40.2%) | 0 (0.0%) |
Employment Status by Educational Attainment in Cawood
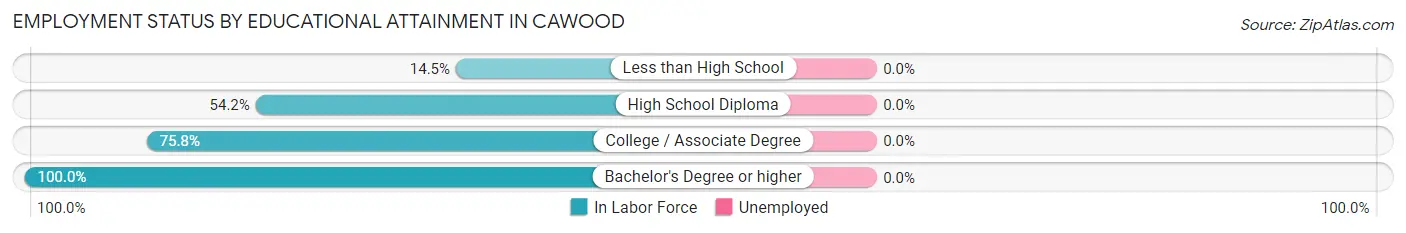
| Educational Attainment | In Labor Force | Unemployed |
| Less than High School | 18 (14.5%) | 0 (0.0%) |
| High School Diploma | 26 (54.2%) | 0 (0.0%) |
| College / Associate Degree | 25 (75.8%) | 0 (0.0%) |
| Bachelor's Degree or higher | 58 (100.0%) | 0 (0.0%) |
| Total | 127 (48.3%) | 0 (0.0%) |
Employment Occupations by Sex in Cawood
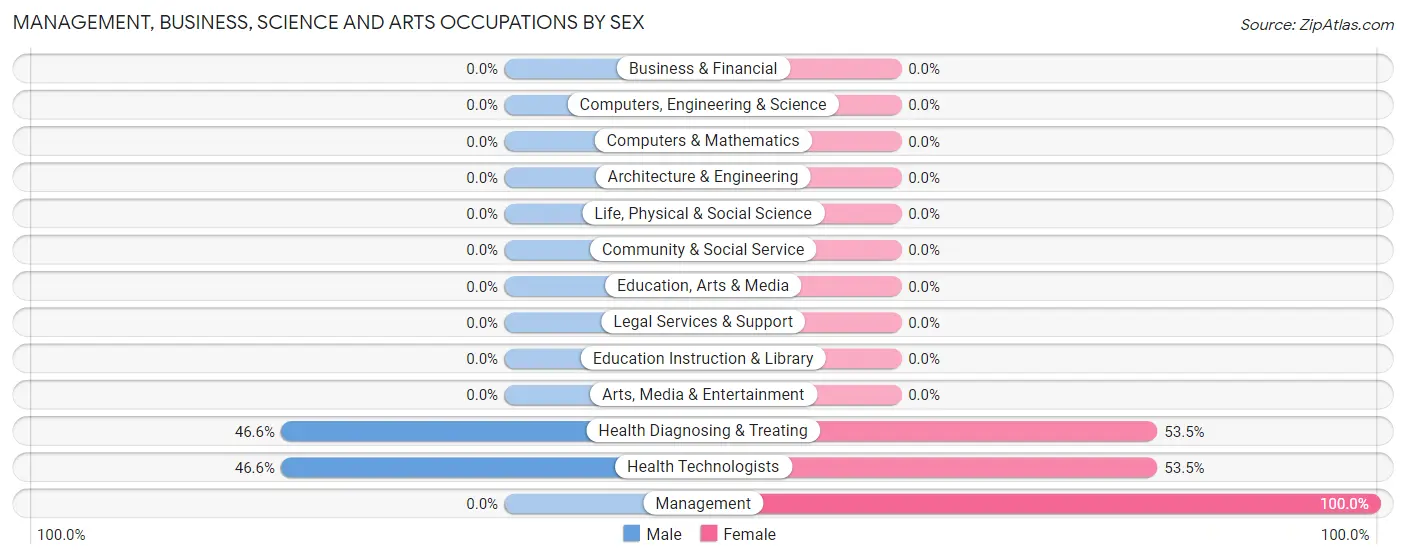
Management, Business, Science and Arts Occupations
The most common Management, Business, Science and Arts occupations in Cawood are Health Diagnosing & Treating (58 | 32.4%), Health Technologists (58 | 32.4%), and Management (18 | 10.1%).
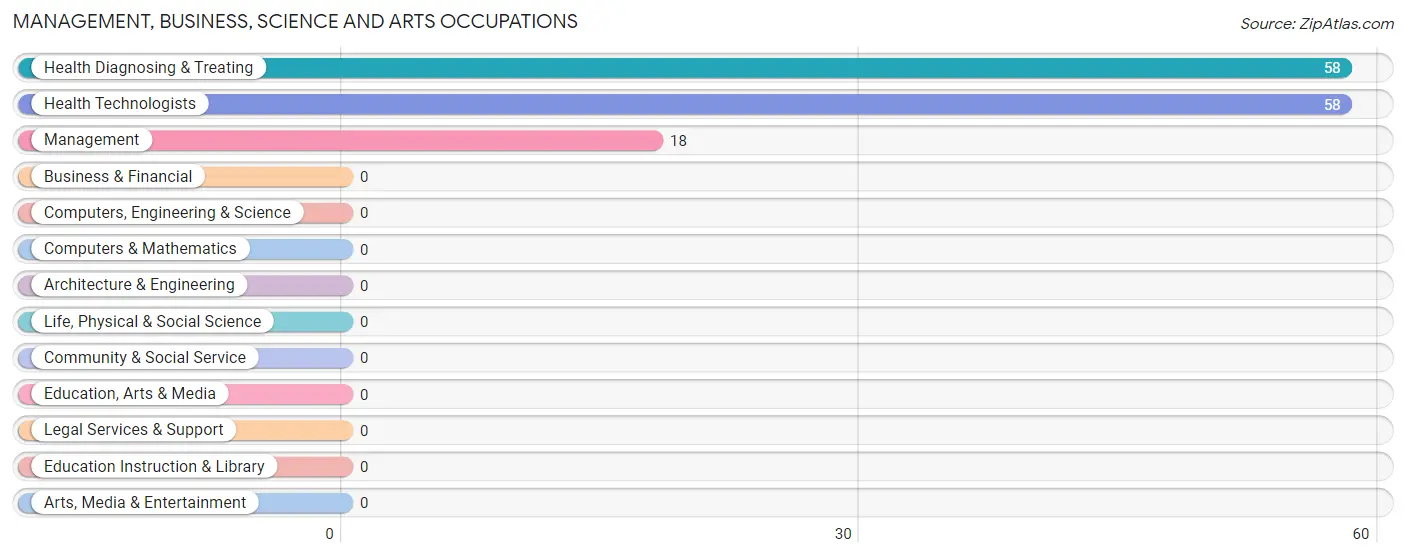
Management, Business, Science and Arts Occupations by Sex
Within the Management, Business, Science and Arts occupations in Cawood, the most male-oriented occupations are Health Diagnosing & Treating (46.6%), and Health Technologists (46.6%), while the most female-oriented occupations are Management (100.0%), Health Diagnosing & Treating (53.4%), and Health Technologists (53.4%).
| Occupation | Male | Female |
| Management | 0 (0.0%) | 18 (100.0%) |
| Business & Financial | 0 (0.0%) | 0 (0.0%) |
| Computers, Engineering & Science | 0 (0.0%) | 0 (0.0%) |
| Computers & Mathematics | 0 (0.0%) | 0 (0.0%) |
| Architecture & Engineering | 0 (0.0%) | 0 (0.0%) |
| Life, Physical & Social Science | 0 (0.0%) | 0 (0.0%) |
| Community & Social Service | 0 (0.0%) | 0 (0.0%) |
| Education, Arts & Media | 0 (0.0%) | 0 (0.0%) |
| Legal Services & Support | 0 (0.0%) | 0 (0.0%) |
| Education Instruction & Library | 0 (0.0%) | 0 (0.0%) |
| Arts, Media & Entertainment | 0 (0.0%) | 0 (0.0%) |
| Health Diagnosing & Treating | 27 (46.6%) | 31 (53.4%) |
| Health Technologists | 27 (46.6%) | 31 (53.4%) |
| Total (Category) | 27 (35.5%) | 49 (64.5%) |
| Total (Overall) | 125 (69.8%) | 54 (30.2%) |
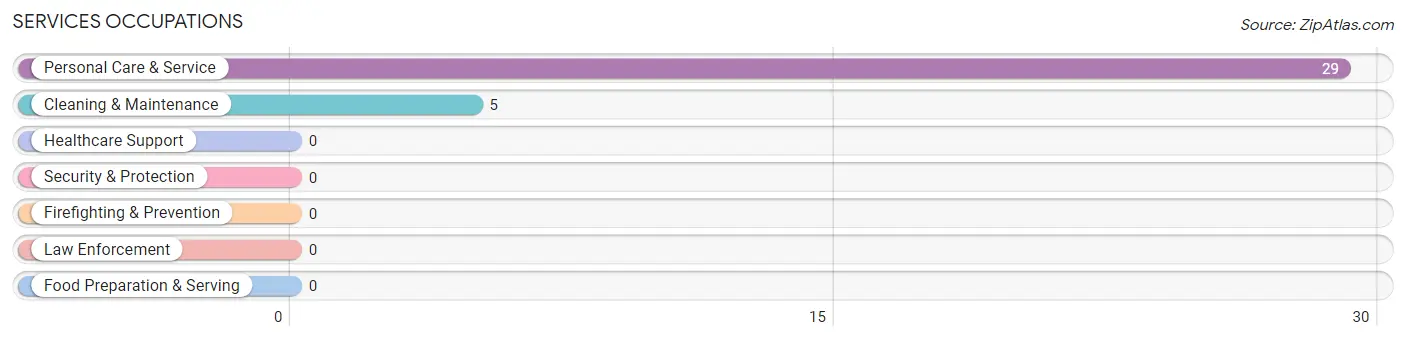
Services Occupations
The most common Services occupations in Cawood are Personal Care & Service (29 | 16.2%), and Cleaning & Maintenance (5 | 2.8%).
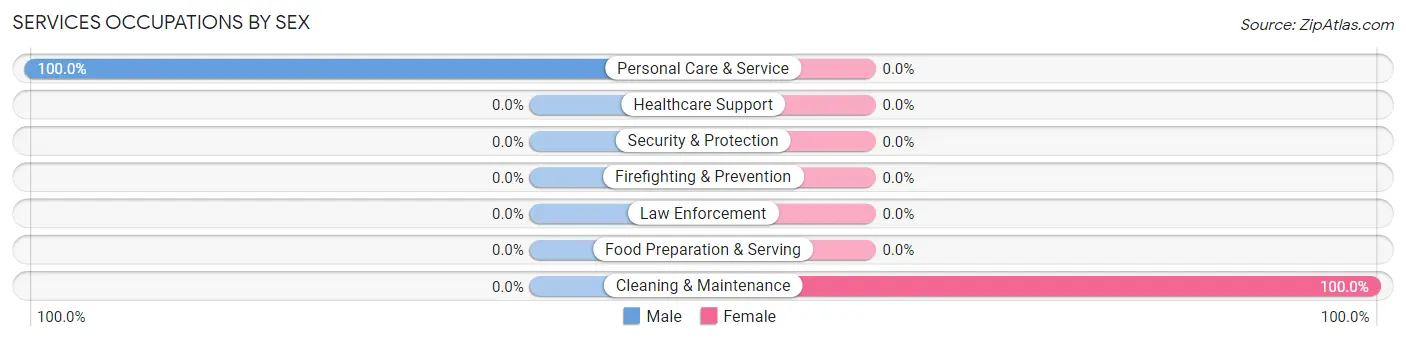
Services Occupations by Sex
| Occupation | Male | Female |
| Healthcare Support | 0 (0.0%) | 0 (0.0%) |
| Security & Protection | 0 (0.0%) | 0 (0.0%) |
| Firefighting & Prevention | 0 (0.0%) | 0 (0.0%) |
| Law Enforcement | 0 (0.0%) | 0 (0.0%) |
| Food Preparation & Serving | 0 (0.0%) | 0 (0.0%) |
| Cleaning & Maintenance | 0 (0.0%) | 5 (100.0%) |
| Personal Care & Service | 29 (100.0%) | 0 (0.0%) |
| Total (Category) | 29 (85.3%) | 5 (14.7%) |
| Total (Overall) | 125 (69.8%) | 54 (30.2%) |
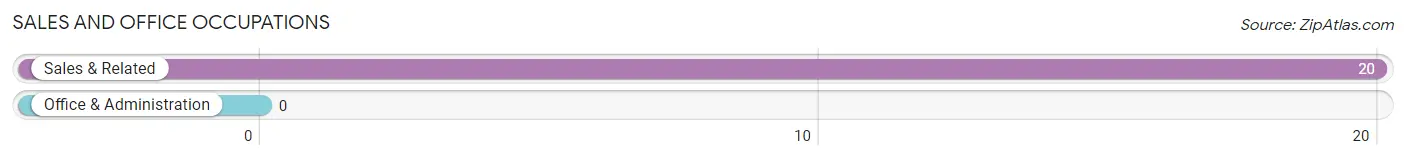
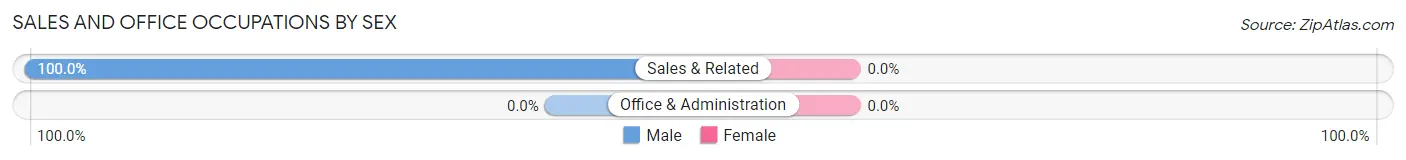
Sales and Office Occupations
The most common Sales and Office occupations in Cawood are , and Sales & Related (20 | 11.2%).
Sales and Office Occupations by Sex
| Occupation | Male | Female |
| Sales & Related | 20 (100.0%) | 0 (0.0%) |
| Office & Administration | 0 (0.0%) | 0 (0.0%) |
| Total (Category) | 20 (100.0%) | 0 (0.0%) |
| Total (Overall) | 125 (69.8%) | 54 (30.2%) |
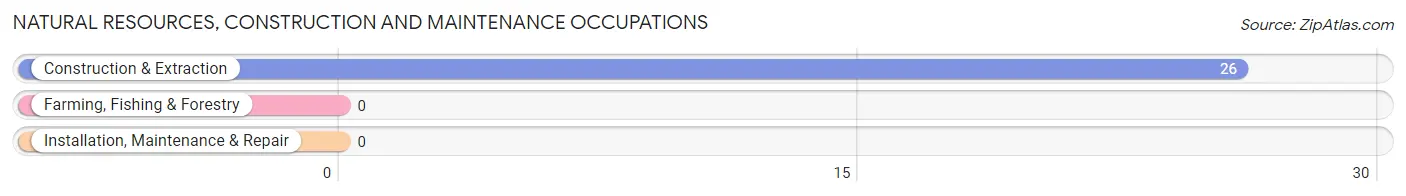
Natural Resources, Construction and Maintenance Occupations
The most common Natural Resources, Construction and Maintenance occupations in Cawood are , and Construction & Extraction (26 | 14.5%).
Natural Resources, Construction and Maintenance Occupations by Sex
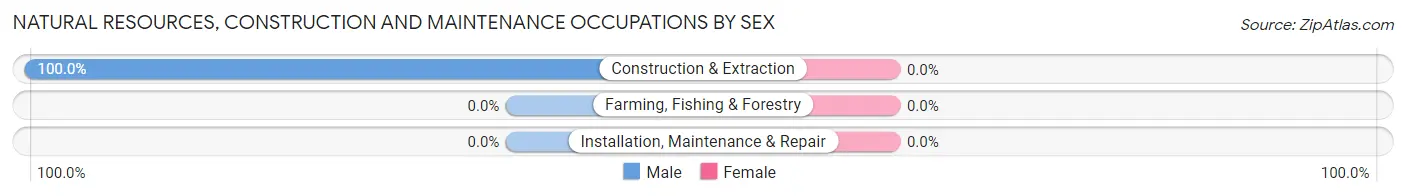
| Occupation | Male | Female |
| Farming, Fishing & Forestry | 0 (0.0%) | 0 (0.0%) |
| Construction & Extraction | 26 (100.0%) | 0 (0.0%) |
| Installation, Maintenance & Repair | 0 (0.0%) | 0 (0.0%) |
| Total (Category) | 26 (100.0%) | 0 (0.0%) |
| Total (Overall) | 125 (69.8%) | 54 (30.2%) |
Production, Transportation and Moving Occupations
The most common Production, Transportation and Moving occupations in Cawood are , and Material Moving (23 | 12.9%).
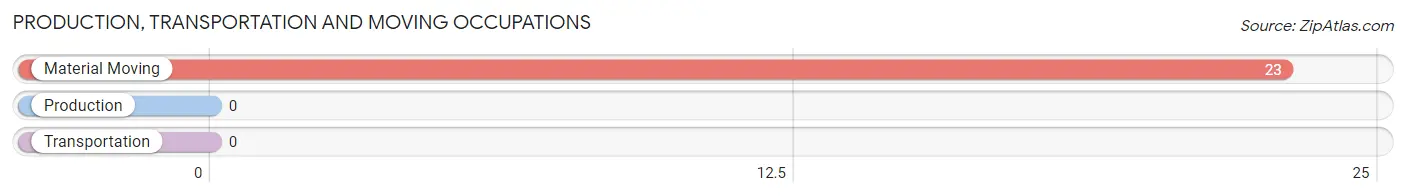
Production, Transportation and Moving Occupations by Sex
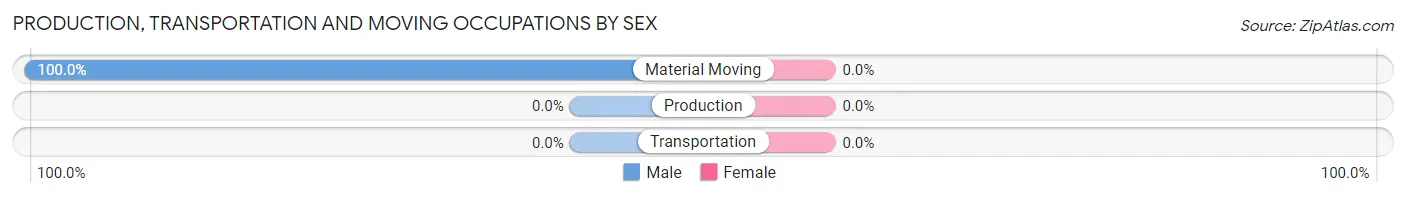
| Occupation | Male | Female |
| Production | 0 (0.0%) | 0 (0.0%) |
| Transportation | 0 (0.0%) | 0 (0.0%) |
| Material Moving | 23 (100.0%) | 0 (0.0%) |
| Total (Category) | 23 (100.0%) | 0 (0.0%) |
| Total (Overall) | 125 (69.8%) | 54 (30.2%) |
Employment Industries by Sex in Cawood
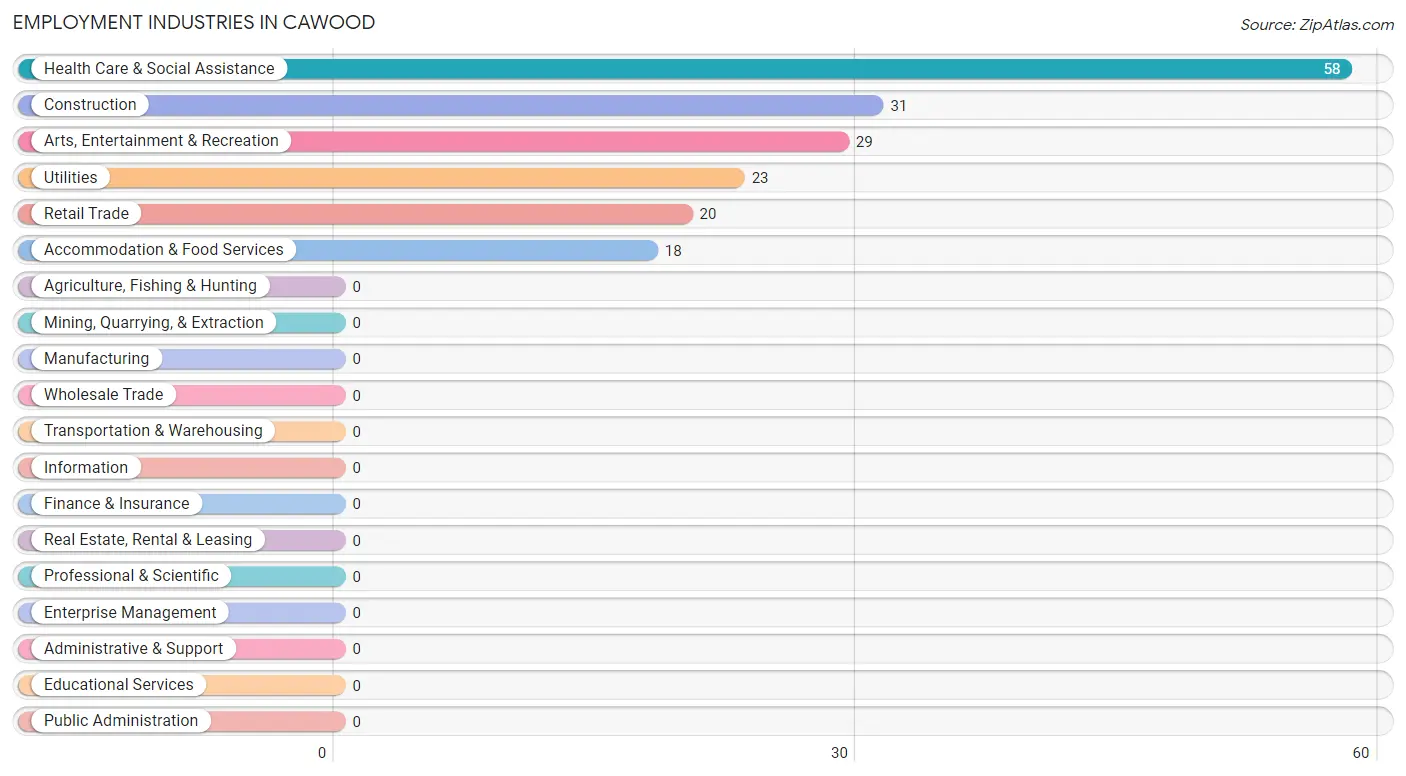
Employment Industries in Cawood
The major employment industries in Cawood include Health Care & Social Assistance (58 | 32.4%), Construction (31 | 17.3%), Arts, Entertainment & Recreation (29 | 16.2%), Utilities (23 | 12.9%), and Retail Trade (20 | 11.2%).
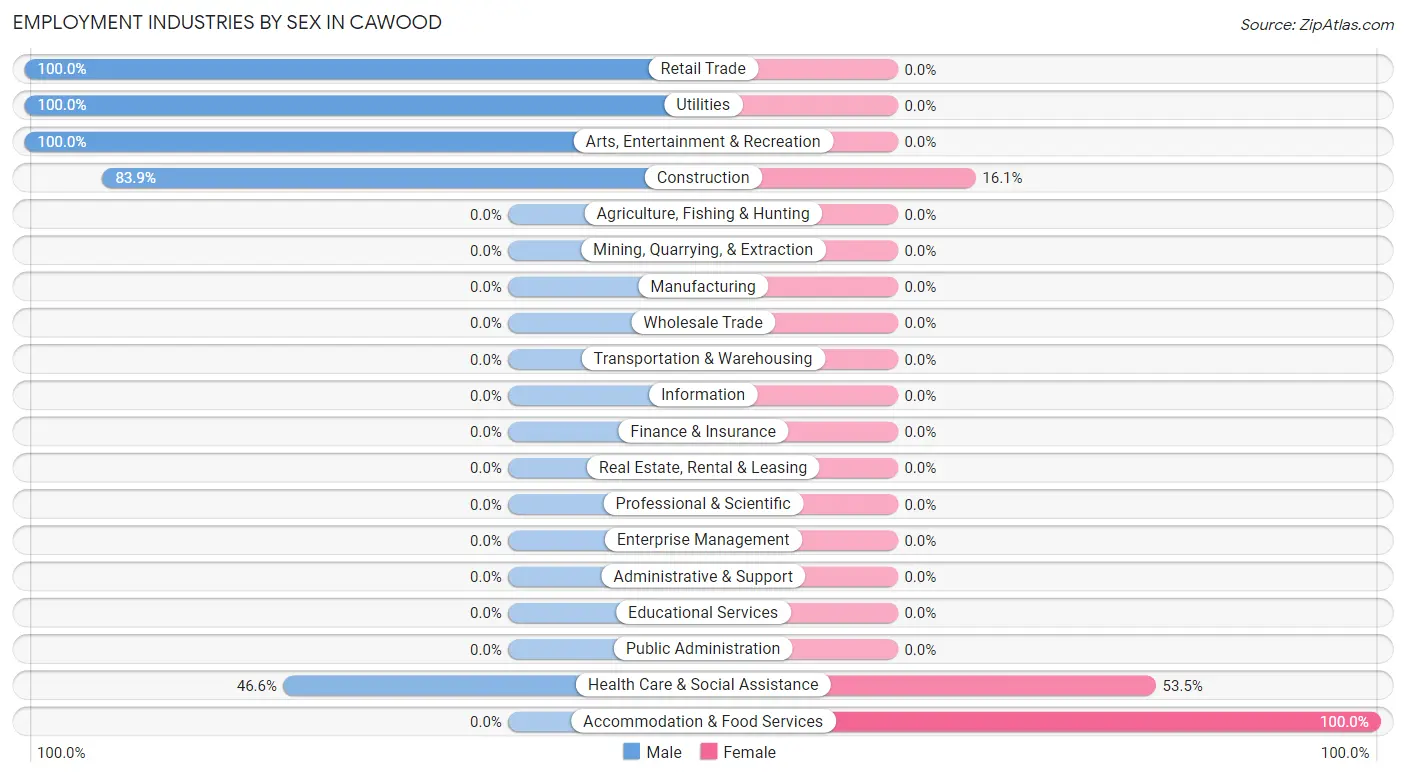
Employment Industries by Sex in Cawood
The Cawood industries that see more men than women are Retail Trade (100.0%), Utilities (100.0%), and Arts, Entertainment & Recreation (100.0%), whereas the industries that tend to have a higher number of women are Accommodation & Food Services (100.0%), Health Care & Social Assistance (53.4%), and Construction (16.1%).
| Industry | Male | Female |
| Agriculture, Fishing & Hunting | 0 (0.0%) | 0 (0.0%) |
| Mining, Quarrying, & Extraction | 0 (0.0%) | 0 (0.0%) |
| Construction | 26 (83.9%) | 5 (16.1%) |
| Manufacturing | 0 (0.0%) | 0 (0.0%) |
| Wholesale Trade | 0 (0.0%) | 0 (0.0%) |
| Retail Trade | 20 (100.0%) | 0 (0.0%) |
| Transportation & Warehousing | 0 (0.0%) | 0 (0.0%) |
| Utilities | 23 (100.0%) | 0 (0.0%) |
| Information | 0 (0.0%) | 0 (0.0%) |
| Finance & Insurance | 0 (0.0%) | 0 (0.0%) |
| Real Estate, Rental & Leasing | 0 (0.0%) | 0 (0.0%) |
| Professional & Scientific | 0 (0.0%) | 0 (0.0%) |
| Enterprise Management | 0 (0.0%) | 0 (0.0%) |
| Administrative & Support | 0 (0.0%) | 0 (0.0%) |
| Educational Services | 0 (0.0%) | 0 (0.0%) |
| Health Care & Social Assistance | 27 (46.6%) | 31 (53.4%) |
| Arts, Entertainment & Recreation | 29 (100.0%) | 0 (0.0%) |
| Accommodation & Food Services | 0 (0.0%) | 18 (100.0%) |
| Public Administration | 0 (0.0%) | 0 (0.0%) |
| Total | 125 (69.8%) | 54 (30.2%) |
Education in Cawood
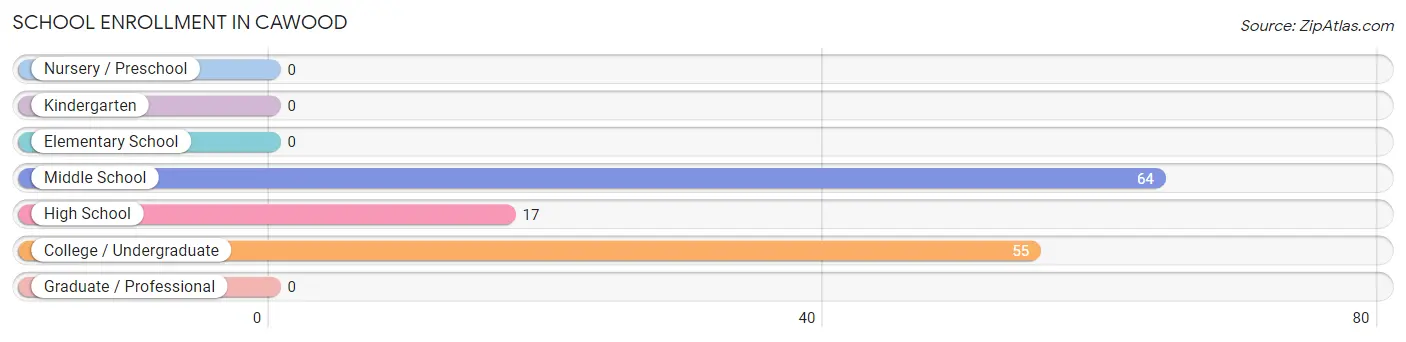
School Enrollment in Cawood
The most common levels of schooling among the 136 students in Cawood are middle school (64 | 47.1%), college / undergraduate (55 | 40.4%), and high school (17 | 12.5%).
| School Level | # Students | % Students |
| Nursery / Preschool | 0 | 0.0% |
| Kindergarten | 0 | 0.0% |
| Elementary School | 0 | 0.0% |
| Middle School | 64 | 47.1% |
| High School | 17 | 12.5% |
| College / Undergraduate | 55 | 40.4% |
| Graduate / Professional | 0 | 0.0% |
| Total | 136 | 100.0% |
School Enrollment by Age by Funding Source in Cawood
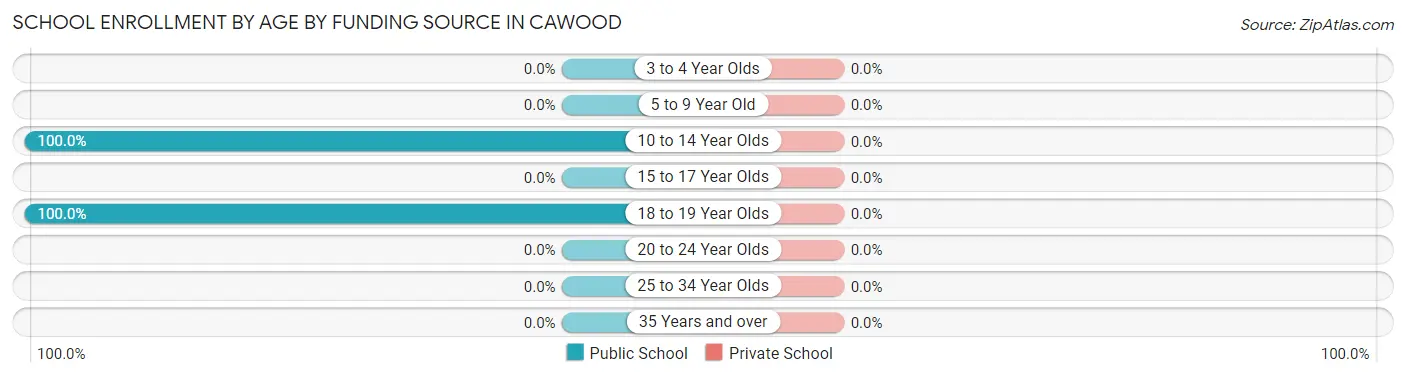
| Age Bracket | Public School | Private School |
| 3 to 4 Year Olds | 0 (0.0%) | 0 (0.0%) |
| 5 to 9 Year Old | 0 (0.0%) | 0 (0.0%) |
| 10 to 14 Year Olds | 81 (100.0%) | 0 (0.0%) |
| 15 to 17 Year Olds | 0 (0.0%) | 0 (0.0%) |
| 18 to 19 Year Olds | 55 (100.0%) | 0 (0.0%) |
| 20 to 24 Year Olds | 0 (0.0%) | 0 (0.0%) |
| 25 to 34 Year Olds | 0 (0.0%) | 0 (0.0%) |
| 35 Years and over | 0 (0.0%) | 0 (0.0%) |
| Total | 136 (100.0%) | 0 (0.0%) |
Educational Attainment by Field of Study in Cawood
Science & technology (58 | 67.4%), and psychology (28 | 32.6%) are the most common fields of study among 86 individuals in Cawood who have obtained a bachelor's degree or higher.
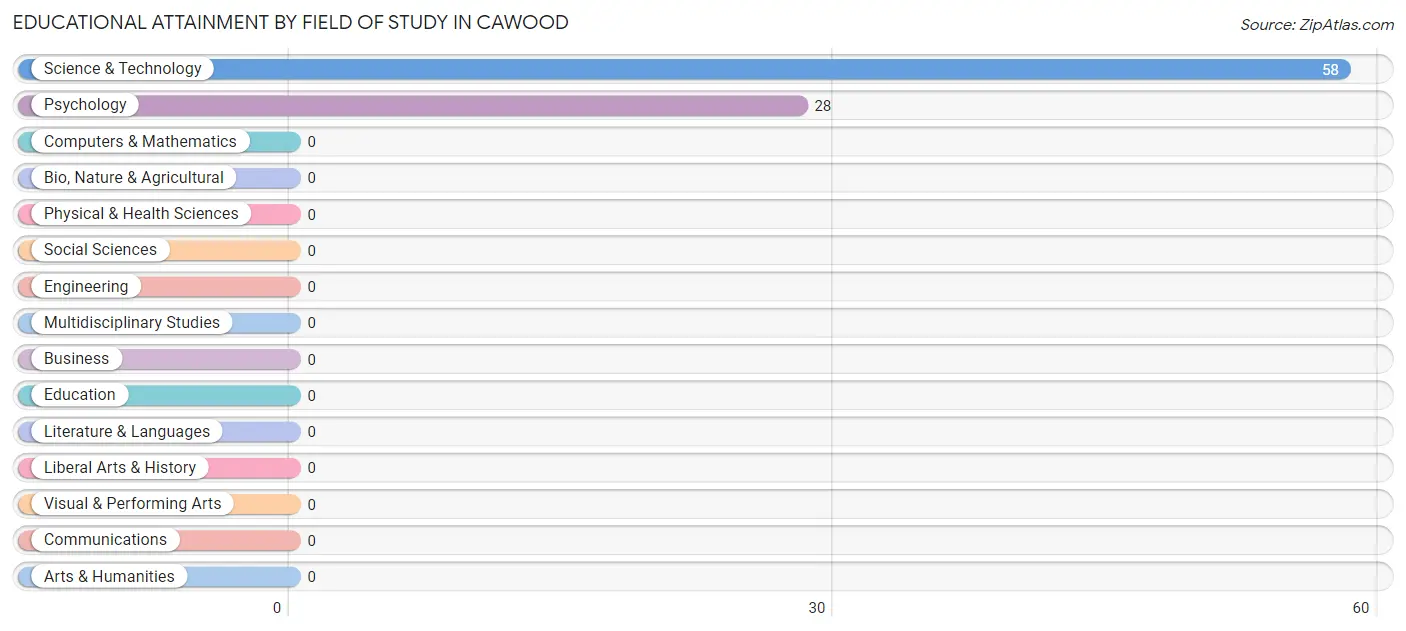
| Field of Study | # Graduates | % Graduates |
| Computers & Mathematics | 0 | 0.0% |
| Bio, Nature & Agricultural | 0 | 0.0% |
| Physical & Health Sciences | 0 | 0.0% |
| Psychology | 28 | 32.6% |
| Social Sciences | 0 | 0.0% |
| Engineering | 0 | 0.0% |
| Multidisciplinary Studies | 0 | 0.0% |
| Science & Technology | 58 | 67.4% |
| Business | 0 | 0.0% |
| Education | 0 | 0.0% |
| Literature & Languages | 0 | 0.0% |
| Liberal Arts & History | 0 | 0.0% |
| Visual & Performing Arts | 0 | 0.0% |
| Communications | 0 | 0.0% |
| Arts & Humanities | 0 | 0.0% |
| Total | 86 | 100.0% |
Transportation & Commute in Cawood
Vehicle Availability by Sex in Cawood
The most prevalent vehicle ownership categories in Cawood are males with 1 vehicle (78, accounting for 62.4%) and females with 1 vehicle (23, making up 144.4%).
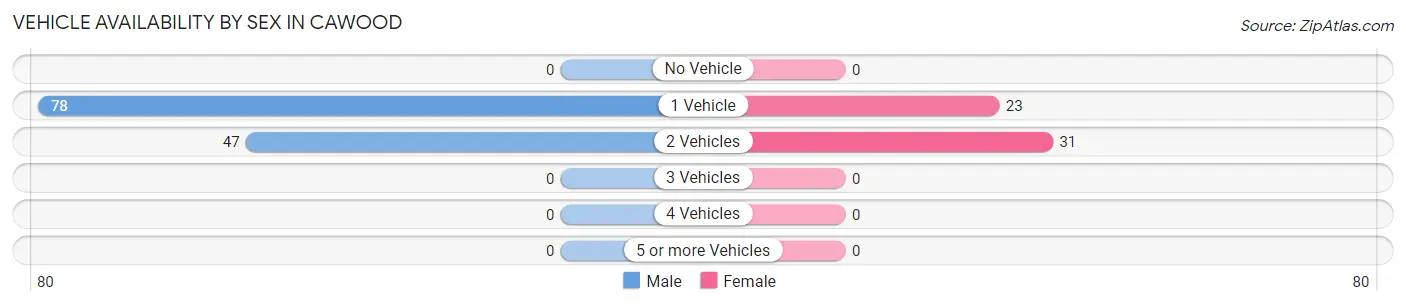
| Vehicles Available | Male | Female |
| No Vehicle | 0 (0.0%) | 0 (0.0%) |
| 1 Vehicle | 78 (62.4%) | 23 (42.6%) |
| 2 Vehicles | 47 (37.6%) | 31 (57.4%) |
| 3 Vehicles | 0 (0.0%) | 0 (0.0%) |
| 4 Vehicles | 0 (0.0%) | 0 (0.0%) |
| 5 or more Vehicles | 0 (0.0%) | 0 (0.0%) |
| Total | 125 (100.0%) | 54 (100.0%) |
Commute Time in Cawood
The most frequently occuring commute durations in Cawood are 10 to 14 minutes (78 commuters, 43.6%), 15 to 19 minutes (52 commuters, 29.0%), and 30 to 34 minutes (26 commuters, 14.5%).
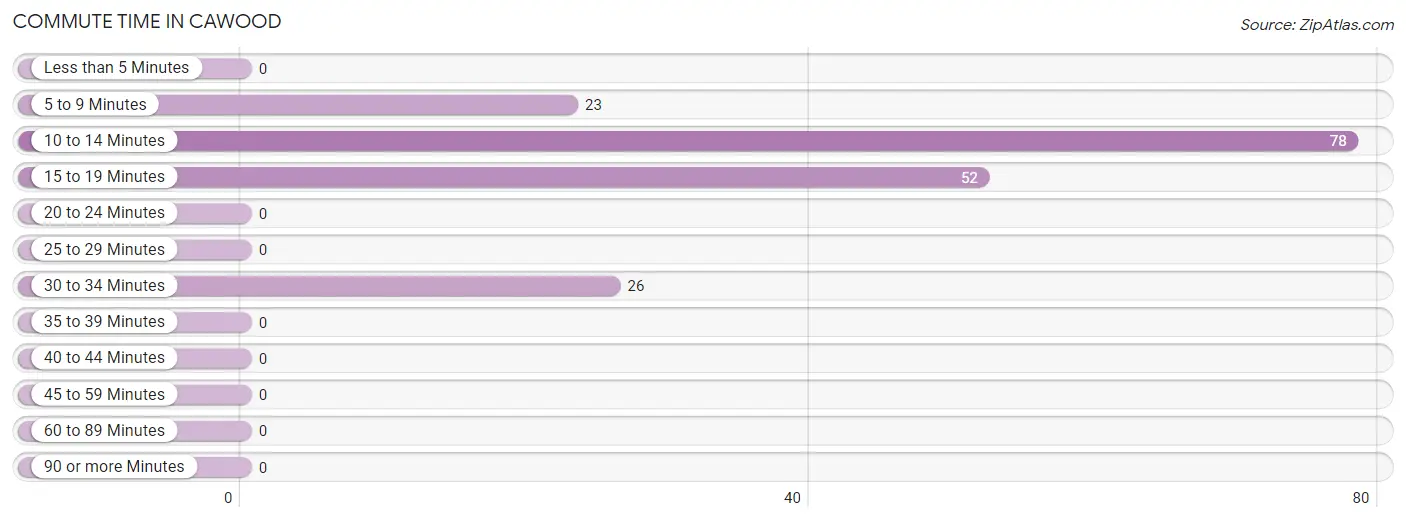
| Commute Time | # Commuters | % Commuters |
| Less than 5 Minutes | 0 | 0.0% |
| 5 to 9 Minutes | 23 | 12.9% |
| 10 to 14 Minutes | 78 | 43.6% |
| 15 to 19 Minutes | 52 | 29.0% |
| 20 to 24 Minutes | 0 | 0.0% |
| 25 to 29 Minutes | 0 | 0.0% |
| 30 to 34 Minutes | 26 | 14.5% |
| 35 to 39 Minutes | 0 | 0.0% |
| 40 to 44 Minutes | 0 | 0.0% |
| 45 to 59 Minutes | 0 | 0.0% |
| 60 to 89 Minutes | 0 | 0.0% |
| 90 or more Minutes | 0 | 0.0% |
Commute Time by Sex in Cawood
The most common commute times in Cawood are 10 to 14 minutes (47 commuters, 37.6%) for males and 10 to 14 minutes (31 commuters, 57.4%) for females.
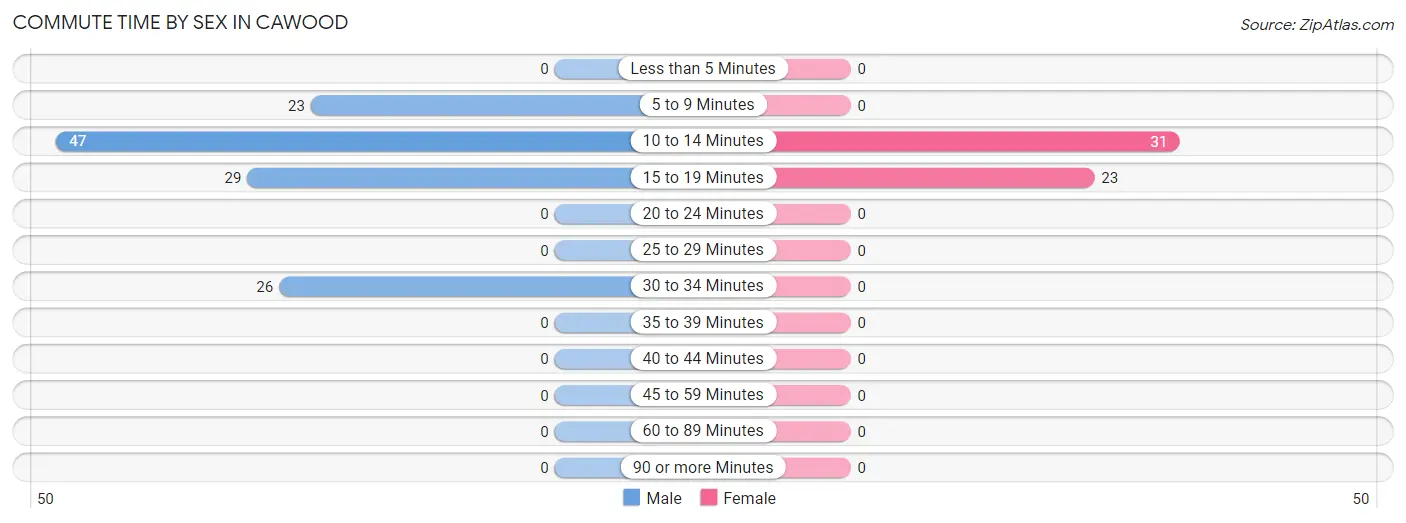
| Commute Time | Male | Female |
| Less than 5 Minutes | 0 (0.0%) | 0 (0.0%) |
| 5 to 9 Minutes | 23 (18.4%) | 0 (0.0%) |
| 10 to 14 Minutes | 47 (37.6%) | 31 (57.4%) |
| 15 to 19 Minutes | 29 (23.2%) | 23 (42.6%) |
| 20 to 24 Minutes | 0 (0.0%) | 0 (0.0%) |
| 25 to 29 Minutes | 0 (0.0%) | 0 (0.0%) |
| 30 to 34 Minutes | 26 (20.8%) | 0 (0.0%) |
| 35 to 39 Minutes | 0 (0.0%) | 0 (0.0%) |
| 40 to 44 Minutes | 0 (0.0%) | 0 (0.0%) |
| 45 to 59 Minutes | 0 (0.0%) | 0 (0.0%) |
| 60 to 89 Minutes | 0 (0.0%) | 0 (0.0%) |
| 90 or more Minutes | 0 (0.0%) | 0 (0.0%) |
Time of Departure to Work by Sex in Cawood
The most frequent times of departure to work in Cawood are 4:00 PM to 11:59 PM (79, 63.2%) for males and 4:00 PM to 11:59 PM (31, 57.4%) for females.
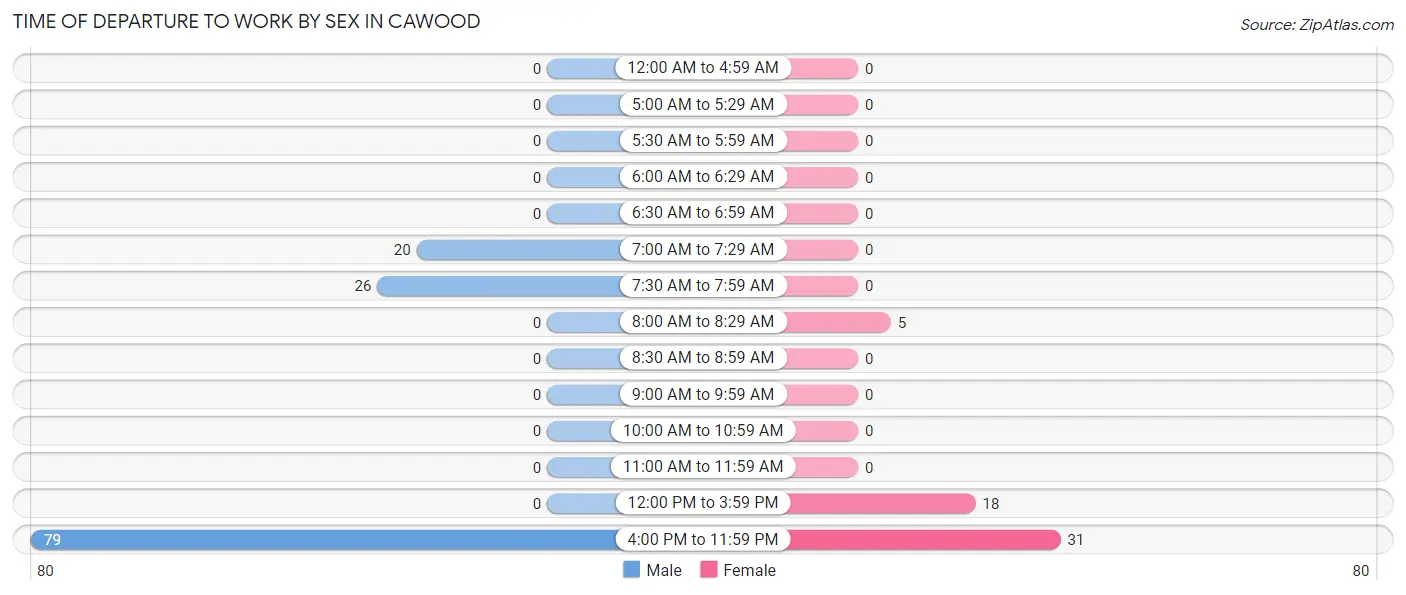
| Time of Departure | Male | Female |
| 12:00 AM to 4:59 AM | 0 (0.0%) | 0 (0.0%) |
| 5:00 AM to 5:29 AM | 0 (0.0%) | 0 (0.0%) |
| 5:30 AM to 5:59 AM | 0 (0.0%) | 0 (0.0%) |
| 6:00 AM to 6:29 AM | 0 (0.0%) | 0 (0.0%) |
| 6:30 AM to 6:59 AM | 0 (0.0%) | 0 (0.0%) |
| 7:00 AM to 7:29 AM | 20 (16.0%) | 0 (0.0%) |
| 7:30 AM to 7:59 AM | 26 (20.8%) | 0 (0.0%) |
| 8:00 AM to 8:29 AM | 0 (0.0%) | 5 (9.3%) |
| 8:30 AM to 8:59 AM | 0 (0.0%) | 0 (0.0%) |
| 9:00 AM to 9:59 AM | 0 (0.0%) | 0 (0.0%) |
| 10:00 AM to 10:59 AM | 0 (0.0%) | 0 (0.0%) |
| 11:00 AM to 11:59 AM | 0 (0.0%) | 0 (0.0%) |
| 12:00 PM to 3:59 PM | 0 (0.0%) | 18 (33.3%) |
| 4:00 PM to 11:59 PM | 79 (63.2%) | 31 (57.4%) |
| Total | 125 (100.0%) | 54 (100.0%) |
Housing Occupancy in Cawood
Occupancy by Ownership in Cawood
Of the total 226 dwellings in Cawood, owner-occupied units account for 157 (69.5%), while renter-occupied units make up 69 (30.5%).
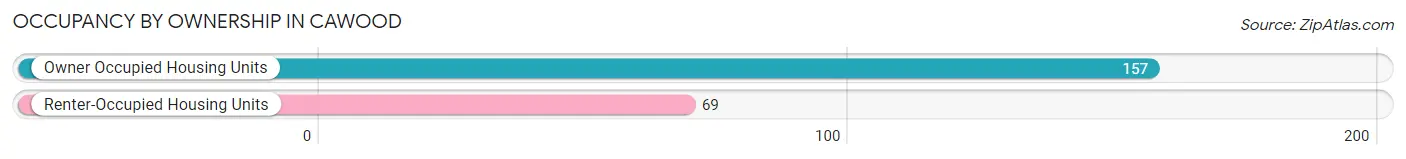
| Occupancy | # Housing Units | % Housing Units |
| Owner Occupied Housing Units | 157 | 69.5% |
| Renter-Occupied Housing Units | 69 | 30.5% |
| Total Occupied Housing Units | 226 | 100.0% |
Occupancy by Household Size in Cawood
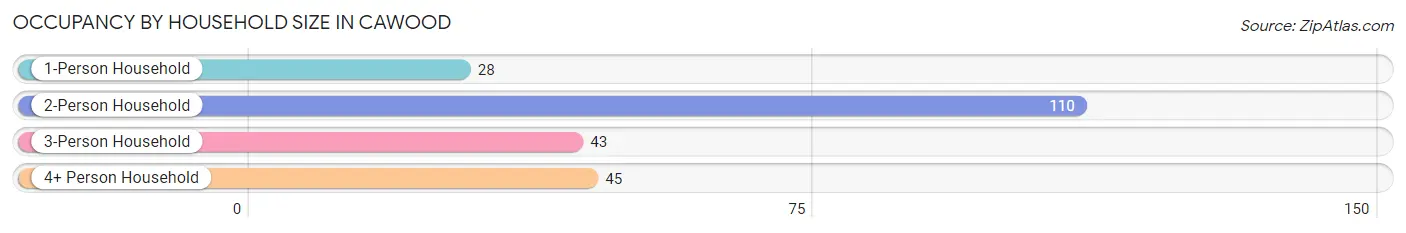
| Household Size | # Housing Units | % Housing Units |
| 1-Person Household | 28 | 12.4% |
| 2-Person Household | 110 | 48.7% |
| 3-Person Household | 43 | 19.0% |
| 4+ Person Household | 45 | 19.9% |
| Total Housing Units | 226 | 100.0% |
Occupancy by Ownership by Household Size in Cawood
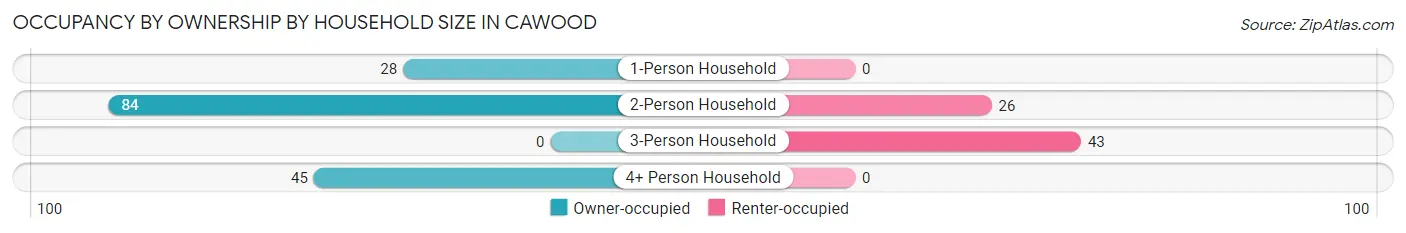
| Household Size | Owner-occupied | Renter-occupied |
| 1-Person Household | 28 (100.0%) | 0 (0.0%) |
| 2-Person Household | 84 (76.4%) | 26 (23.6%) |
| 3-Person Household | 0 (0.0%) | 43 (100.0%) |
| 4+ Person Household | 45 (100.0%) | 0 (0.0%) |
| Total Housing Units | 157 (69.5%) | 69 (30.5%) |
Occupancy by Educational Attainment in Cawood
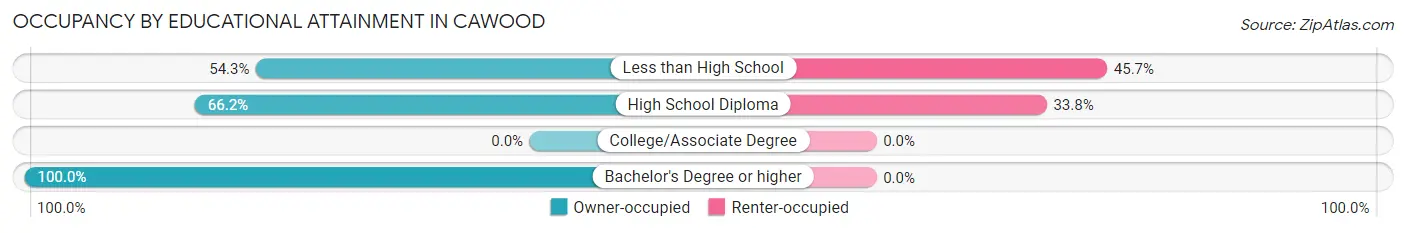
| Household Size | Owner-occupied | Renter-occupied |
| Less than High School | 51 (54.3%) | 43 (45.7%) |
| High School Diploma | 51 (66.2%) | 26 (33.8%) |
| College/Associate Degree | 0 (0.0%) | 0 (0.0%) |
| Bachelor's Degree or higher | 55 (100.0%) | 0 (0.0%) |
Occupancy by Age of Householder in Cawood
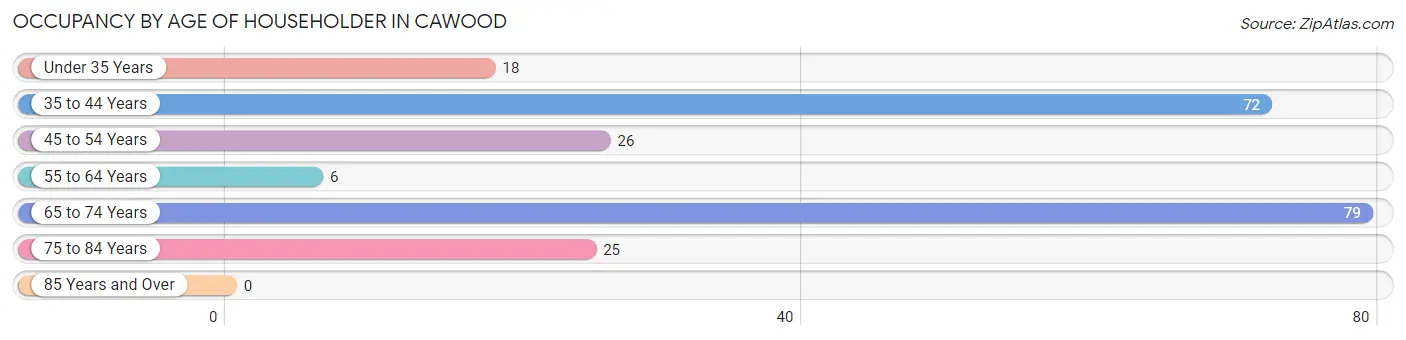
| Age Bracket | # Households | % Households |
| Under 35 Years | 18 | 8.0% |
| 35 to 44 Years | 72 | 31.9% |
| 45 to 54 Years | 26 | 11.5% |
| 55 to 64 Years | 6 | 2.6% |
| 65 to 74 Years | 79 | 35.0% |
| 75 to 84 Years | 25 | 11.1% |
| 85 Years and Over | 0 | 0.0% |
| Total | 226 | 100.0% |
Housing Finances in Cawood
Median Income by Occupancy in Cawood
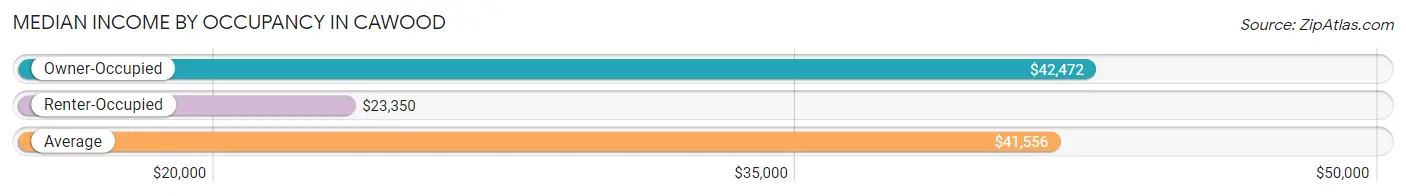
| Occupancy Type | # Households | Median Income |
| Owner-Occupied | 157 (69.5%) | $42,472 |
| Renter-Occupied | 69 (30.5%) | $23,350 |
| Average | 226 (100.0%) | $41,556 |
Occupancy by Householder Income Bracket in Cawood
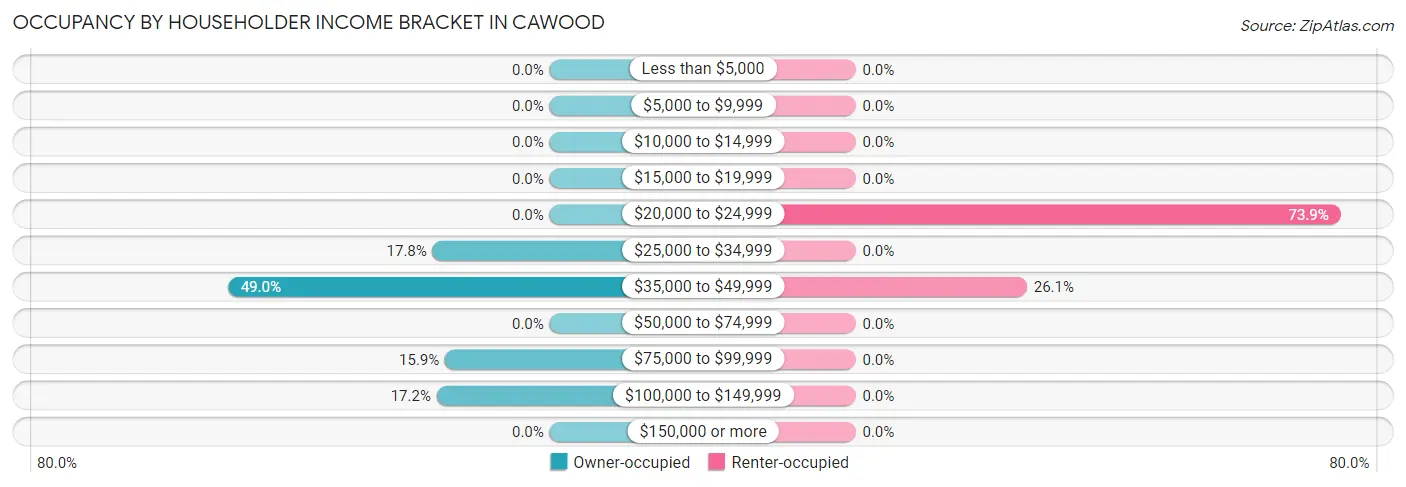
| Income Bracket | Owner-occupied | Renter-occupied |
| Less than $5,000 | 0 (0.0%) | 0 (0.0%) |
| $5,000 to $9,999 | 0 (0.0%) | 0 (0.0%) |
| $10,000 to $14,999 | 0 (0.0%) | 0 (0.0%) |
| $15,000 to $19,999 | 0 (0.0%) | 0 (0.0%) |
| $20,000 to $24,999 | 0 (0.0%) | 51 (73.9%) |
| $25,000 to $34,999 | 28 (17.8%) | 0 (0.0%) |
| $35,000 to $49,999 | 77 (49.0%) | 18 (26.1%) |
| $50,000 to $74,999 | 0 (0.0%) | 0 (0.0%) |
| $75,000 to $99,999 | 25 (15.9%) | 0 (0.0%) |
| $100,000 to $149,999 | 27 (17.2%) | 0 (0.0%) |
| $150,000 or more | 0 (0.0%) | 0 (0.0%) |
| Total | 157 (100.0%) | 69 (100.0%) |
Monthly Housing Cost Tiers in Cawood
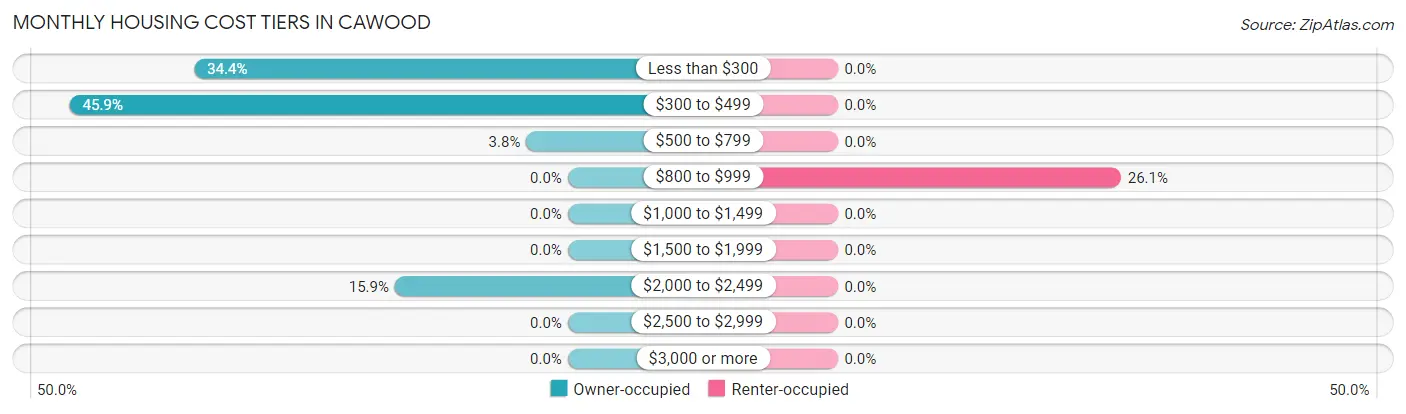
| Monthly Cost | Owner-occupied | Renter-occupied |
| Less than $300 | 54 (34.4%) | 0 (0.0%) |
| $300 to $499 | 72 (45.9%) | 0 (0.0%) |
| $500 to $799 | 6 (3.8%) | 0 (0.0%) |
| $800 to $999 | 0 (0.0%) | 18 (26.1%) |
| $1,000 to $1,499 | 0 (0.0%) | 0 (0.0%) |
| $1,500 to $1,999 | 0 (0.0%) | 0 (0.0%) |
| $2,000 to $2,499 | 25 (15.9%) | 0 (0.0%) |
| $2,500 to $2,999 | 0 (0.0%) | 0 (0.0%) |
| $3,000 or more | 0 (0.0%) | 0 (0.0%) |
| Total | 157 (100.0%) | 69 (100.0%) |
Physical Housing Characteristics in Cawood
Housing Structures in Cawood
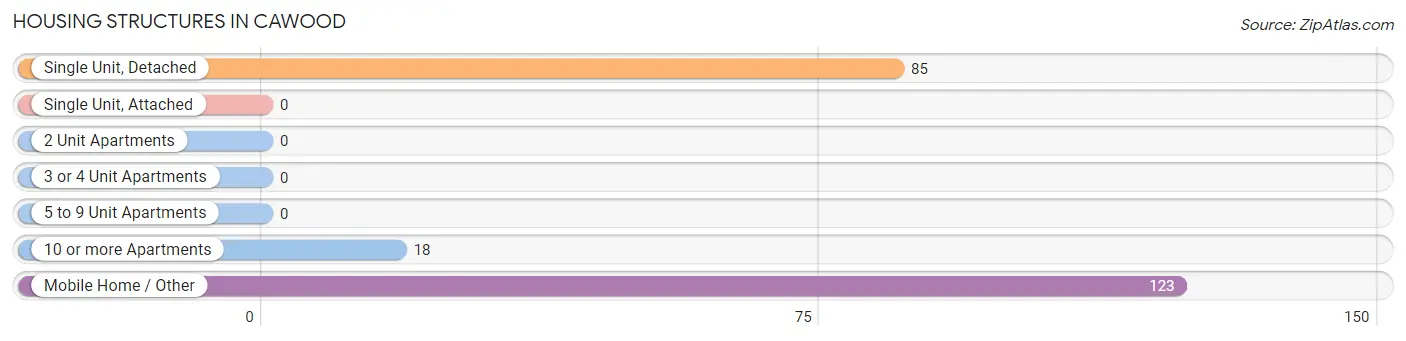
| Structure Type | # Housing Units | % Housing Units |
| Single Unit, Detached | 85 | 37.6% |
| Single Unit, Attached | 0 | 0.0% |
| 2 Unit Apartments | 0 | 0.0% |
| 3 or 4 Unit Apartments | 0 | 0.0% |
| 5 to 9 Unit Apartments | 0 | 0.0% |
| 10 or more Apartments | 18 | 8.0% |
| Mobile Home / Other | 123 | 54.4% |
| Total | 226 | 100.0% |
Housing Structures by Occupancy in Cawood
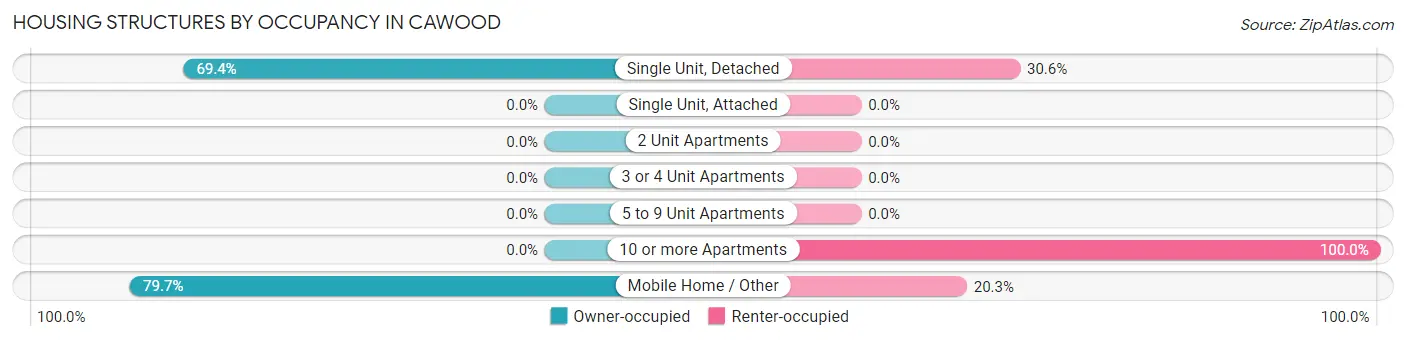
| Structure Type | Owner-occupied | Renter-occupied |
| Single Unit, Detached | 59 (69.4%) | 26 (30.6%) |
| Single Unit, Attached | 0 (0.0%) | 0 (0.0%) |
| 2 Unit Apartments | 0 (0.0%) | 0 (0.0%) |
| 3 or 4 Unit Apartments | 0 (0.0%) | 0 (0.0%) |
| 5 to 9 Unit Apartments | 0 (0.0%) | 0 (0.0%) |
| 10 or more Apartments | 0 (0.0%) | 18 (100.0%) |
| Mobile Home / Other | 98 (79.7%) | 25 (20.3%) |
| Total | 157 (69.5%) | 69 (30.5%) |
Housing Structures by Number of Rooms in Cawood
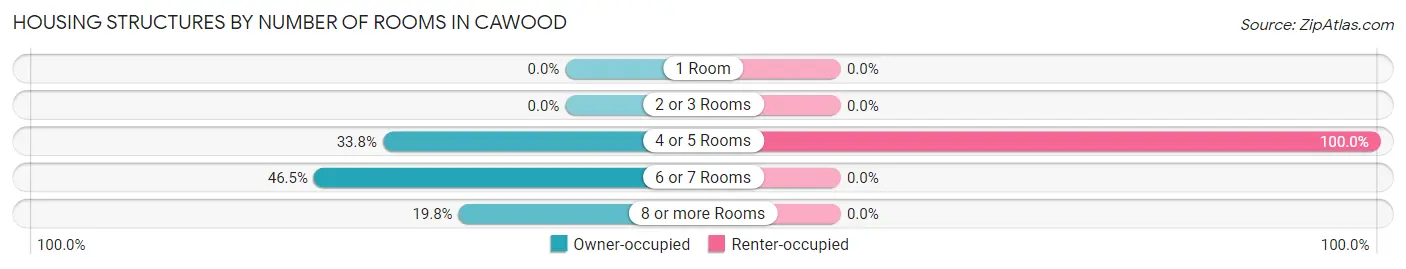
| Number of Rooms | Owner-occupied | Renter-occupied |
| 1 Room | 0 (0.0%) | 0 (0.0%) |
| 2 or 3 Rooms | 0 (0.0%) | 0 (0.0%) |
| 4 or 5 Rooms | 53 (33.8%) | 69 (100.0%) |
| 6 or 7 Rooms | 73 (46.5%) | 0 (0.0%) |
| 8 or more Rooms | 31 (19.8%) | 0 (0.0%) |
| Total | 157 (100.0%) | 69 (100.0%) |
Housing Structure by Heating Type in Cawood
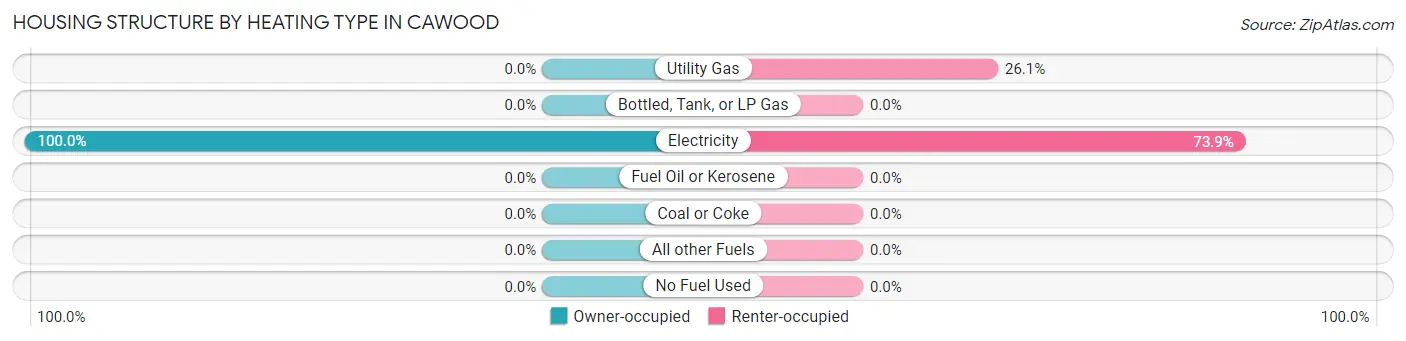
| Heating Type | Owner-occupied | Renter-occupied |
| Utility Gas | 0 (0.0%) | 18 (26.1%) |
| Bottled, Tank, or LP Gas | 0 (0.0%) | 0 (0.0%) |
| Electricity | 157 (100.0%) | 51 (73.9%) |
| Fuel Oil or Kerosene | 0 (0.0%) | 0 (0.0%) |
| Coal or Coke | 0 (0.0%) | 0 (0.0%) |
| All other Fuels | 0 (0.0%) | 0 (0.0%) |
| No Fuel Used | 0 (0.0%) | 0 (0.0%) |
| Total | 157 (100.0%) | 69 (100.0%) |
Household Vehicle Usage in Cawood
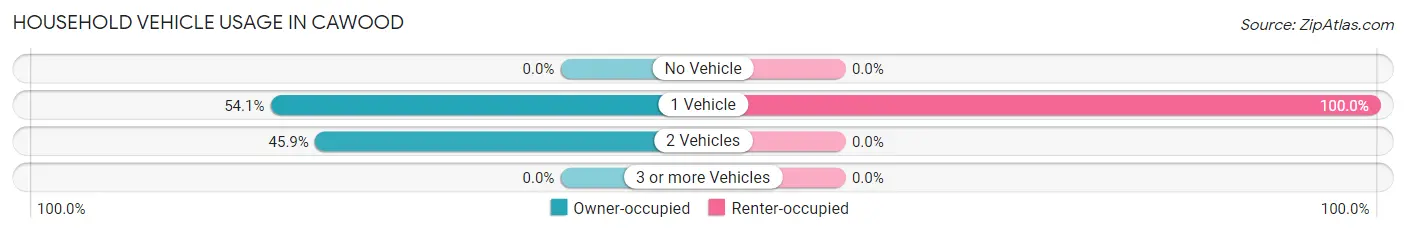
| Vehicles per Household | Owner-occupied | Renter-occupied |
| No Vehicle | 0 (0.0%) | 0 (0.0%) |
| 1 Vehicle | 85 (54.1%) | 69 (100.0%) |
| 2 Vehicles | 72 (45.9%) | 0 (0.0%) |
| 3 or more Vehicles | 0 (0.0%) | 0 (0.0%) |
| Total | 157 (100.0%) | 69 (100.0%) |
Real Estate & Mortgages in Cawood
Real Estate and Mortgage Overview in Cawood
| Characteristic | Without Mortgage | With Mortgage |
| Housing Units | 126 | 31 |
| Median Property Value | $62,000 | $0 |
| Median Household Income | $41,944 | $0 |
| Monthly Housing Costs | $356 | $0 |
| Real Estate Taxes | $861 | $0 |
Property Value by Mortgage Status in Cawood
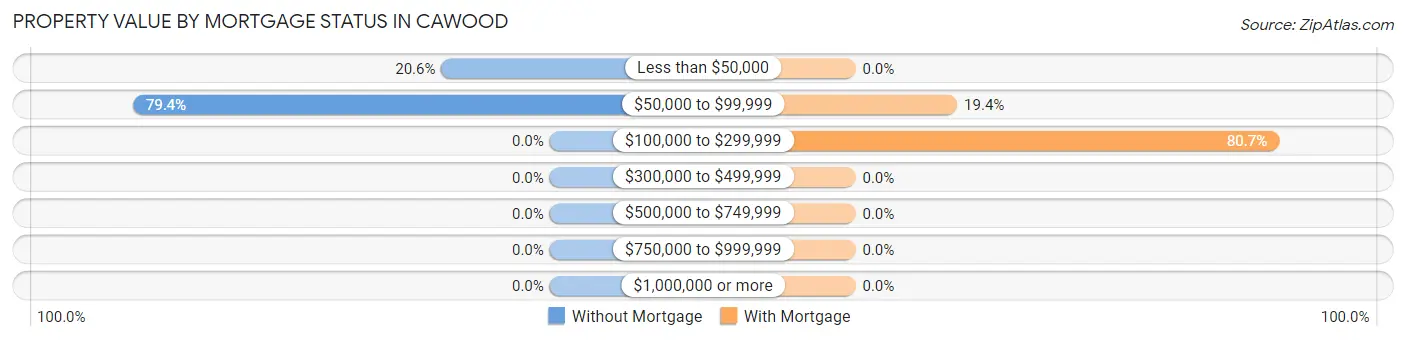
| Property Value | Without Mortgage | With Mortgage |
| Less than $50,000 | 26 (20.6%) | 0 (0.0%) |
| $50,000 to $99,999 | 100 (79.4%) | 6 (19.4%) |
| $100,000 to $299,999 | 0 (0.0%) | 25 (80.6%) |
| $300,000 to $499,999 | 0 (0.0%) | 0 (0.0%) |
| $500,000 to $749,999 | 0 (0.0%) | 0 (0.0%) |
| $750,000 to $999,999 | 0 (0.0%) | 0 (0.0%) |
| $1,000,000 or more | 0 (0.0%) | 0 (0.0%) |
| Total | 126 (100.0%) | 31 (100.0%) |
Household Income by Mortgage Status in Cawood
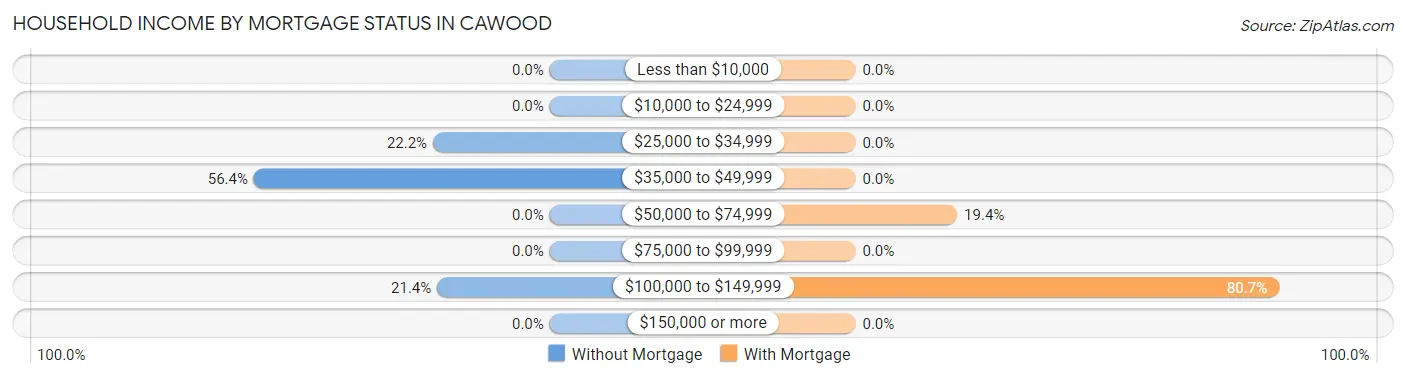
| Household Income | Without Mortgage | With Mortgage |
| Less than $10,000 | 0 (0.0%) | 0 (0.0%) |
| $10,000 to $24,999 | 0 (0.0%) | 0 (0.0%) |
| $25,000 to $34,999 | 28 (22.2%) | 0 (0.0%) |
| $35,000 to $49,999 | 71 (56.4%) | 0 (0.0%) |
| $50,000 to $74,999 | 0 (0.0%) | 6 (19.4%) |
| $75,000 to $99,999 | 0 (0.0%) | 0 (0.0%) |
| $100,000 to $149,999 | 27 (21.4%) | 25 (80.6%) |
| $150,000 or more | 0 (0.0%) | 0 (0.0%) |
| Total | 126 (100.0%) | 31 (100.0%) |
Property Value to Household Income Ratio in Cawood
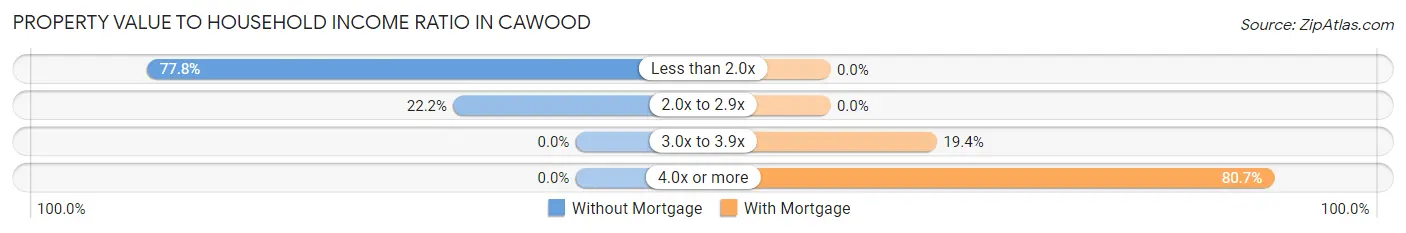
| Value-to-Income Ratio | Without Mortgage | With Mortgage |
| Less than 2.0x | 98 (77.8%) | 0 (0.0%) |
| 2.0x to 2.9x | 28 (22.2%) | 0 (0.0%) |
| 3.0x to 3.9x | 0 (0.0%) | 6 (19.4%) |
| 4.0x or more | 0 (0.0%) | 25 (80.6%) |
| Total | 126 (100.0%) | 31 (100.0%) |
Real Estate Taxes by Mortgage Status in Cawood
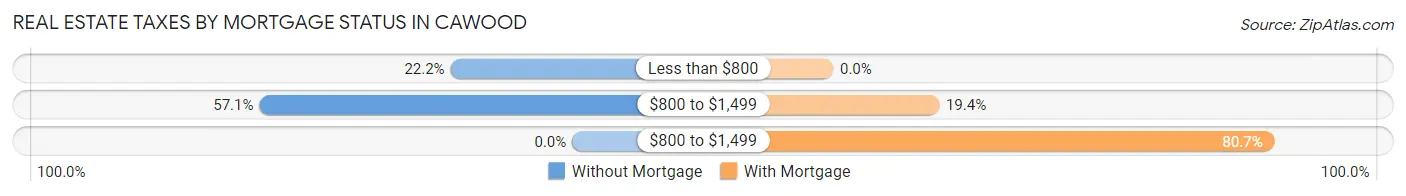
| Property Taxes | Without Mortgage | With Mortgage |
| Less than $800 | 28 (22.2%) | 0 (0.0%) |
| $800 to $1,499 | 72 (57.1%) | 6 (19.4%) |
| $800 to $1,499 | 0 (0.0%) | 25 (80.6%) |
| Total | 126 (100.0%) | 31 (100.0%) |
Health & Disability in Cawood
Health Insurance Coverage by Age in Cawood
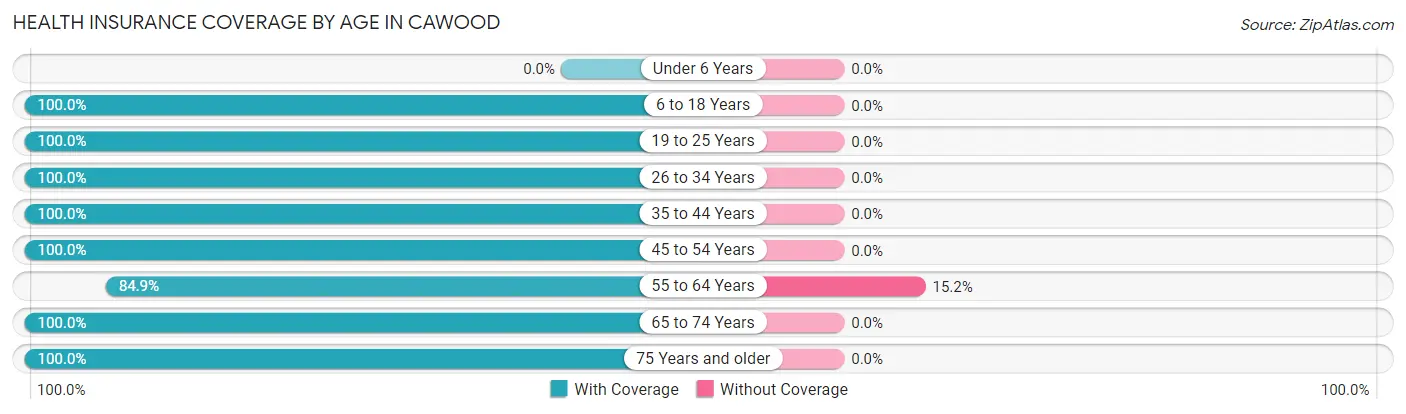
| Age Bracket | With Coverage | Without Coverage |
| Under 6 Years | 0 (0.0%) | 0 (0.0%) |
| 6 to 18 Years | 110 (100.0%) | 0 (0.0%) |
| 19 to 25 Years | 49 (100.0%) | 0 (0.0%) |
| 26 to 34 Years | 49 (100.0%) | 0 (0.0%) |
| 35 to 44 Years | 100 (100.0%) | 0 (0.0%) |
| 45 to 54 Years | 81 (100.0%) | 0 (0.0%) |
| 55 to 64 Years | 28 (84.9%) | 5 (15.1%) |
| 65 to 74 Years | 79 (100.0%) | 0 (0.0%) |
| 75 Years and older | 25 (100.0%) | 0 (0.0%) |
| Total | 521 (99.1%) | 5 (0.9%) |
Health Insurance Coverage by Citizenship Status in Cawood
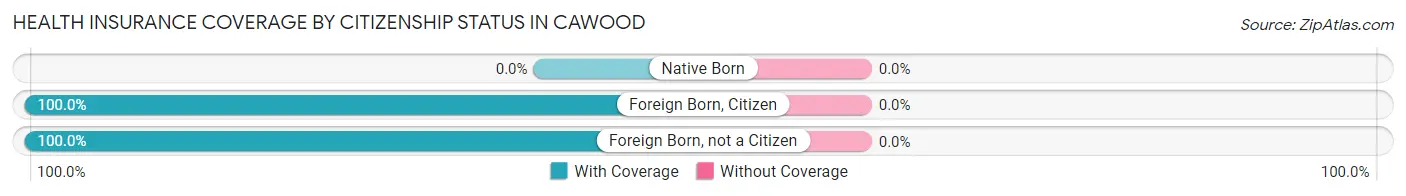
| Citizenship Status | With Coverage | Without Coverage |
| Native Born | 0 (0.0%) | 0 (0.0%) |
| Foreign Born, Citizen | 110 (100.0%) | 0 (0.0%) |
| Foreign Born, not a Citizen | 49 (100.0%) | 0 (0.0%) |
Health Insurance Coverage by Household Income in Cawood
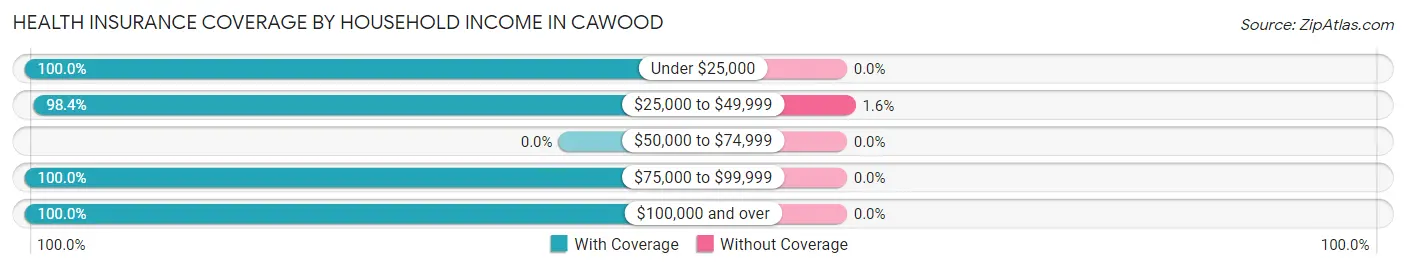
| Household Income | With Coverage | Without Coverage |
| Under $25,000 | 129 (100.0%) | 0 (0.0%) |
| $25,000 to $49,999 | 301 (98.4%) | 5 (1.6%) |
| $50,000 to $74,999 | 0 (0.0%) | 0 (0.0%) |
| $75,000 to $99,999 | 33 (100.0%) | 0 (0.0%) |
| $100,000 and over | 58 (100.0%) | 0 (0.0%) |
Public vs Private Health Insurance Coverage by Age in Cawood
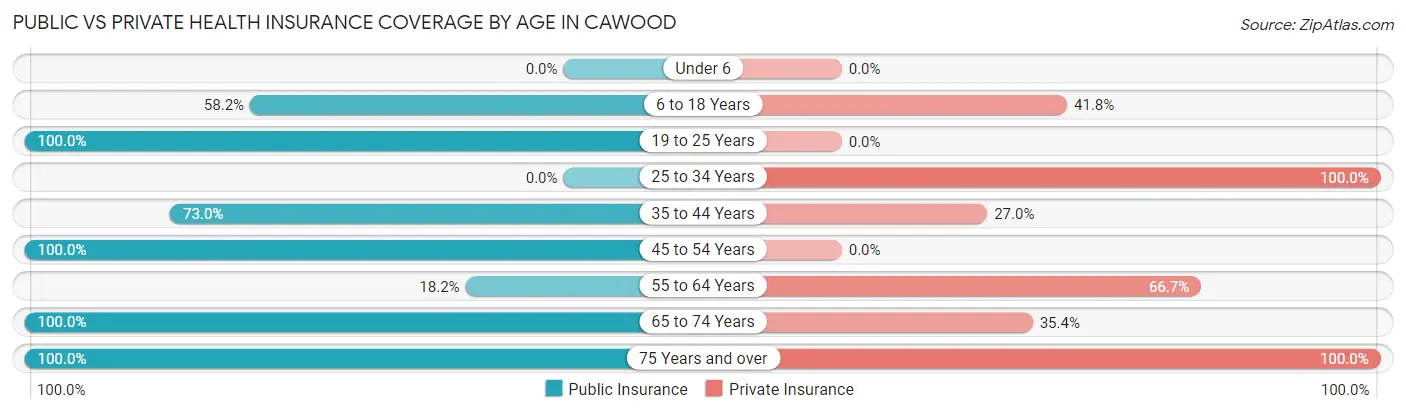
| Age Bracket | Public Insurance | Private Insurance |
| Under 6 | 0 (0.0%) | 0 (0.0%) |
| 6 to 18 Years | 64 (58.2%) | 46 (41.8%) |
| 19 to 25 Years | 49 (100.0%) | 0 (0.0%) |
| 25 to 34 Years | 0 (0.0%) | 49 (100.0%) |
| 35 to 44 Years | 73 (73.0%) | 27 (27.0%) |
| 45 to 54 Years | 81 (100.0%) | 0 (0.0%) |
| 55 to 64 Years | 6 (18.2%) | 22 (66.7%) |
| 65 to 74 Years | 79 (100.0%) | 28 (35.4%) |
| 75 Years and over | 25 (100.0%) | 25 (100.0%) |
| Total | 377 (71.7%) | 197 (37.4%) |
Disability Status by Sex by Age in Cawood
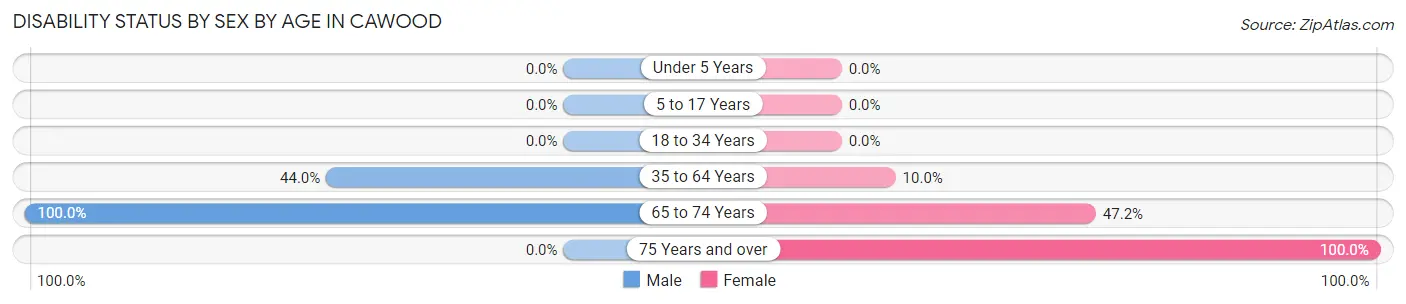
| Age Bracket | Male | Female |
| Under 5 Years | 0 (0.0%) | 0 (0.0%) |
| 5 to 17 Years | 0 (0.0%) | 0 (0.0%) |
| 18 to 34 Years | 0 (0.0%) | 0 (0.0%) |
| 35 to 64 Years | 59 (44.0%) | 8 (10.0%) |
| 65 to 74 Years | 26 (100.0%) | 25 (47.2%) |
| 75 Years and over | 0 (0.0%) | 25 (100.0%) |
Disability Class by Sex by Age in Cawood
Disability Class: Hearing Difficulty
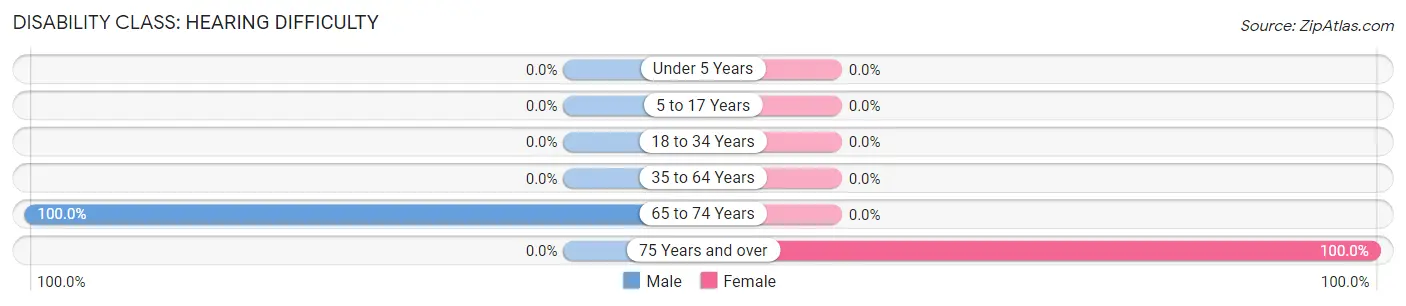
| Age Bracket | Male | Female |
| Under 5 Years | 0 (0.0%) | 0 (0.0%) |
| 5 to 17 Years | 0 (0.0%) | 0 (0.0%) |
| 18 to 34 Years | 0 (0.0%) | 0 (0.0%) |
| 35 to 64 Years | 0 (0.0%) | 0 (0.0%) |
| 65 to 74 Years | 26 (100.0%) | 0 (0.0%) |
| 75 Years and over | 0 (0.0%) | 25 (100.0%) |
Disability Class: Vision Difficulty
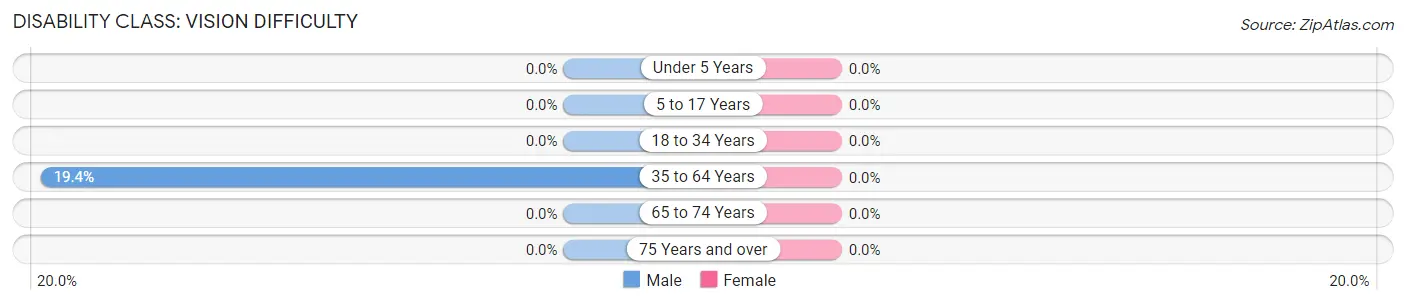
| Age Bracket | Male | Female |
| Under 5 Years | 0 (0.0%) | 0 (0.0%) |
| 5 to 17 Years | 0 (0.0%) | 0 (0.0%) |
| 18 to 34 Years | 0 (0.0%) | 0 (0.0%) |
| 35 to 64 Years | 26 (19.4%) | 0 (0.0%) |
| 65 to 74 Years | 0 (0.0%) | 0 (0.0%) |
| 75 Years and over | 0 (0.0%) | 0 (0.0%) |
Disability Class: Cognitive Difficulty
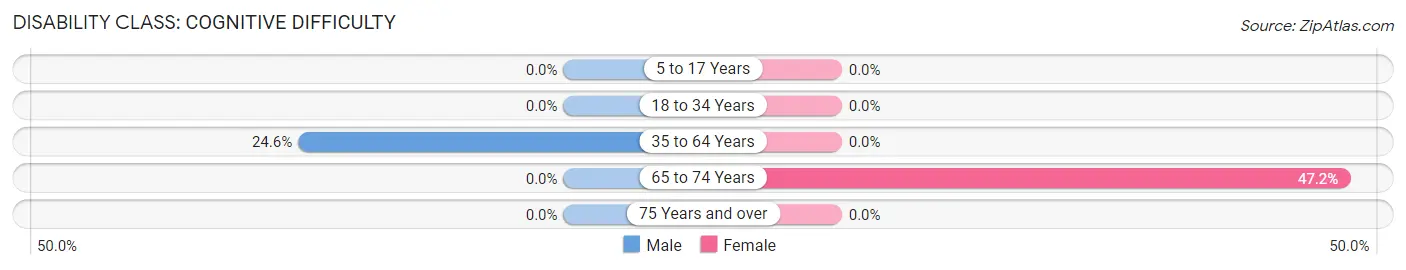
| Age Bracket | Male | Female |
| 5 to 17 Years | 0 (0.0%) | 0 (0.0%) |
| 18 to 34 Years | 0 (0.0%) | 0 (0.0%) |
| 35 to 64 Years | 33 (24.6%) | 0 (0.0%) |
| 65 to 74 Years | 0 (0.0%) | 25 (47.2%) |
| 75 Years and over | 0 (0.0%) | 0 (0.0%) |
Disability Class: Ambulatory Difficulty
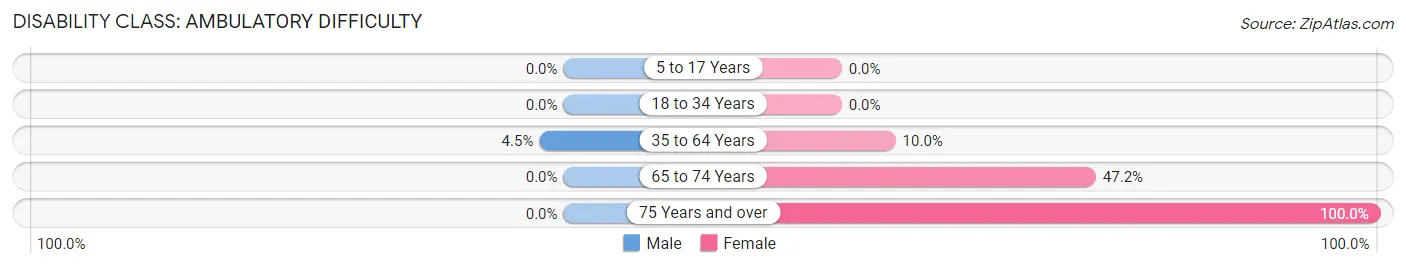
| Age Bracket | Male | Female |
| 5 to 17 Years | 0 (0.0%) | 0 (0.0%) |
| 18 to 34 Years | 0 (0.0%) | 0 (0.0%) |
| 35 to 64 Years | 6 (4.5%) | 8 (10.0%) |
| 65 to 74 Years | 0 (0.0%) | 25 (47.2%) |
| 75 Years and over | 0 (0.0%) | 25 (100.0%) |
Disability Class: Self-Care Difficulty
| Age Bracket | Male | Female |
| 5 to 17 Years | 0 (0.0%) | 0 (0.0%) |
| 18 to 34 Years | 0 (0.0%) | 0 (0.0%) |
| 35 to 64 Years | 0 (0.0%) | 0 (0.0%) |
| 65 to 74 Years | 0 (0.0%) | 0 (0.0%) |
| 75 Years and over | 0 (0.0%) | 0 (0.0%) |
Technology Access in Cawood
Computing Device Access in Cawood
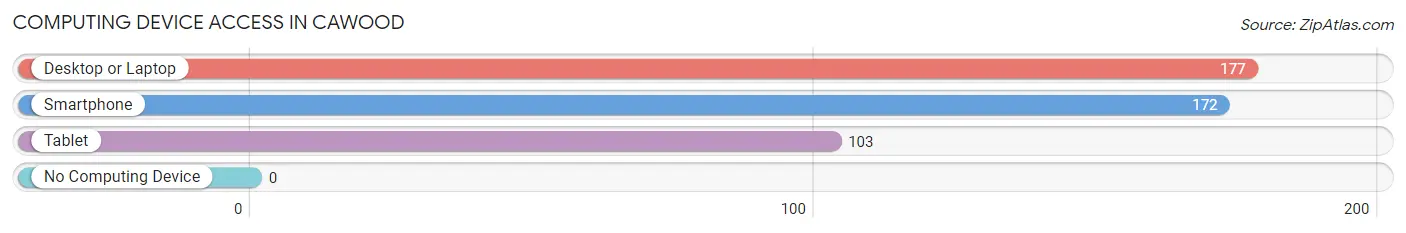
| Device Type | # Households | % Households |
| Desktop or Laptop | 177 | 78.3% |
| Smartphone | 172 | 76.1% |
| Tablet | 103 | 45.6% |
| No Computing Device | 0 | 0.0% |
| Total | 226 | 100.0% |
Internet Access in Cawood
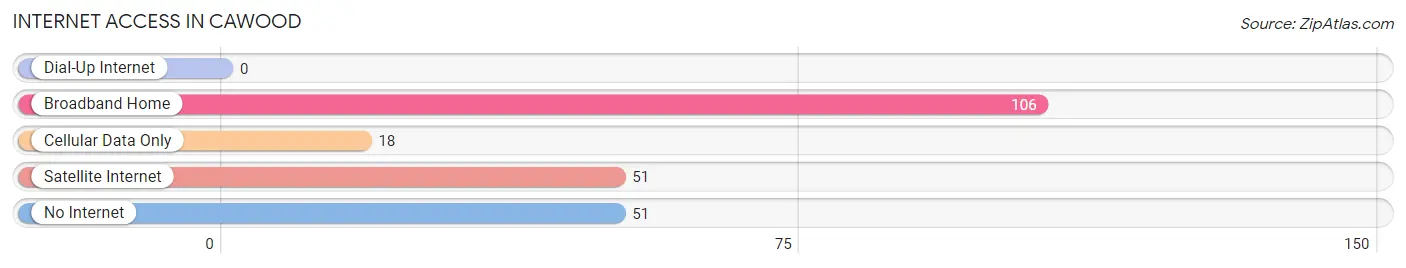
| Internet Type | # Households | % Households |
| Dial-Up Internet | 0 | 0.0% |
| Broadband Home | 106 | 46.9% |
| Cellular Data Only | 18 | 8.0% |
| Satellite Internet | 51 | 22.6% |
| No Internet | 51 | 22.6% |
| Total | 226 | 100.0% |
Cawood Summary
Cawood is a small unincorporated community located in Harlan County, Kentucky. It is situated in the southeastern corner of the state, near the Virginia border. The town is located along the Cumberland River, and is home to a population of approximately 500 people.
History
Cawood was first settled in the late 1700s by a group of settlers from Virginia. The town was named after a local family, the Cawoods, who were among the first settlers. The town was officially incorporated in 1883.
In the early 1900s, Cawood was a thriving coal mining town. The coal industry was the primary source of employment for the town’s residents. The town also had a number of stores, churches, and other businesses.
In the 1950s, the coal industry began to decline in the area, and many of the town’s residents moved away in search of better opportunities. The town’s population decreased significantly, and by the 1970s, the town was nearly abandoned.
In the 1980s, the town began to experience a resurgence. The coal industry began to rebound, and the town’s population began to grow again. Today, Cawood is a small, rural community with a population of approximately 500 people.
Geography
Cawood is located in the southeastern corner of Kentucky, near the Virginia border. The town is situated along the Cumberland River, and is surrounded by rolling hills and forests. The town is located approximately 30 miles from the city of Harlan, and is accessible by a number of state highways.
The climate in Cawood is humid subtropical, with hot, humid summers and mild winters. The average annual temperature is around 60 degrees Fahrenheit, and the average annual precipitation is around 45 inches.
Economy
The economy of Cawood is largely based on the coal industry. The town is home to a number of coal mines, and many of the town’s residents are employed in the industry. The town also has a number of small businesses, including restaurants, stores, and other services.
Demographics
As of the 2010 census, the population of Cawood was 498. The racial makeup of the town was 97.2% White, 0.6% African American, 0.2% Native American, 0.2% Asian, and 1.8% from other races. The median household income was $25,000, and the median family income was $30,000.
Cawood is a small, rural community with a rich history and a strong sense of community. The town is home to a diverse population, and is a great place to live and work.
Common Questions
What is Per Capita Income in Cawood?
Per Capita income in Cawood is $20,920.
What is the Median Family Income in Cawood?
Median Family Income in Cawood is $42,333.
What is the Median Household income in Cawood?
Median Household Income in Cawood is $41,556.
What is Inequality or Gini Index in Cawood?
Inequality or Gini Index in Cawood is 0.33.
What is the Total Population of Cawood?
Total Population of Cawood is 526.
What is the Total Male Population of Cawood?
Total Male Population of Cawood is 319.
What is the Total Female Population of Cawood?
Total Female Population of Cawood is 207.
What is the Ratio of Males per 100 Females in Cawood?
There are 154.11 Males per 100 Females in Cawood.
What is the Ratio of Females per 100 Males in Cawood?
There are 64.89 Females per 100 Males in Cawood.
What is the Median Population Age in Cawood?
Median Population Age in Cawood is 40.6 Years.
What is the Average Family Size in Cawood
Average Family Size in Cawood is 2.5 People.
What is the Average Household Size in Cawood
Average Household Size in Cawood is 2.3 People.
How Large is the Labor Force in Cawood?
There are 179 People in the Labor Forcein in Cawood.
What is the Percentage of People in the Labor Force in Cawood?
40.2% of People are in the Labor Force in Cawood.