Ashland, KY Map & Demographics
Ashland Map
Ashland Overview
$28,501
PER CAPITA INCOME
$65,909
AVG FAMILY INCOME
$51,250
AVG HOUSEHOLD INCOME
6.3%
WAGE / INCOME GAP [ % ]
93.7¢/ $1
WAGE / INCOME GAP [ $ ]
$12,318
FAMILY INCOME DEFICIT
0.46
INEQUALITY / GINI INDEX
21,542
TOTAL POPULATION
9,788
MALE POPULATION
11,754
FEMALE POPULATION
83.27
MALES / 100 FEMALES
120.09
FEMALES / 100 MALES
40.8
MEDIAN AGE
3.0
AVG FAMILY SIZE
2.4
AVG HOUSEHOLD SIZE
9,455
LABOR FORCE [ PEOPLE ]
54.9%
PERCENT IN LABOR FORCE
8.4%
UNEMPLOYMENT RATE
Ashland Area Codes
Income in Ashland
Income Overview in Ashland
Per Capita Income in Ashland is $28,501, while median incomes of families and households are $65,909 and $51,250 respectively.
| Characteristic | Number | Measure |
| Per Capita Income | 21,542 | $28,501 |
| Median Family Income | 5,452 | $65,909 |
| Mean Family Income | 5,452 | $80,893 |
| Median Household Income | 8,903 | $51,250 |
| Mean Household Income | 8,903 | $65,709 |
| Income Deficit | 5,452 | $12,318 |
| Wage / Income Gap (%) | 21,542 | 6.30% |
| Wage / Income Gap ($) | 21,542 | 93.70¢ per $1 |
| Gini / Inequality Index | 21,542 | 0.46 |
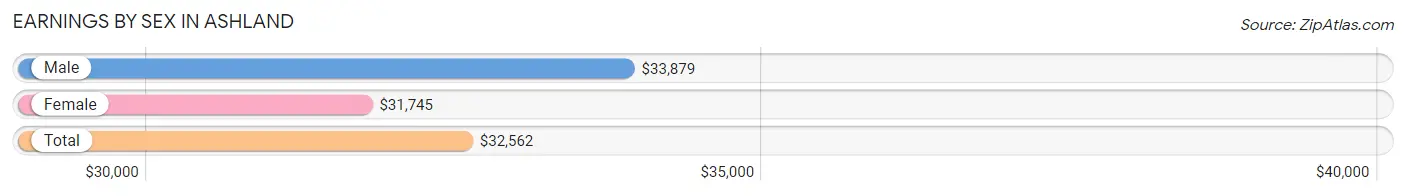
Earnings by Sex in Ashland
Average Earnings in Ashland are $32,562, $33,879 for men and $31,745 for women, a difference of 6.3%.
| Sex | Number | Average Earnings |
| Male | 4,544 (46.8%) | $33,879 |
| Female | 5,169 (53.2%) | $31,745 |
| Total | 9,713 (100.0%) | $32,562 |
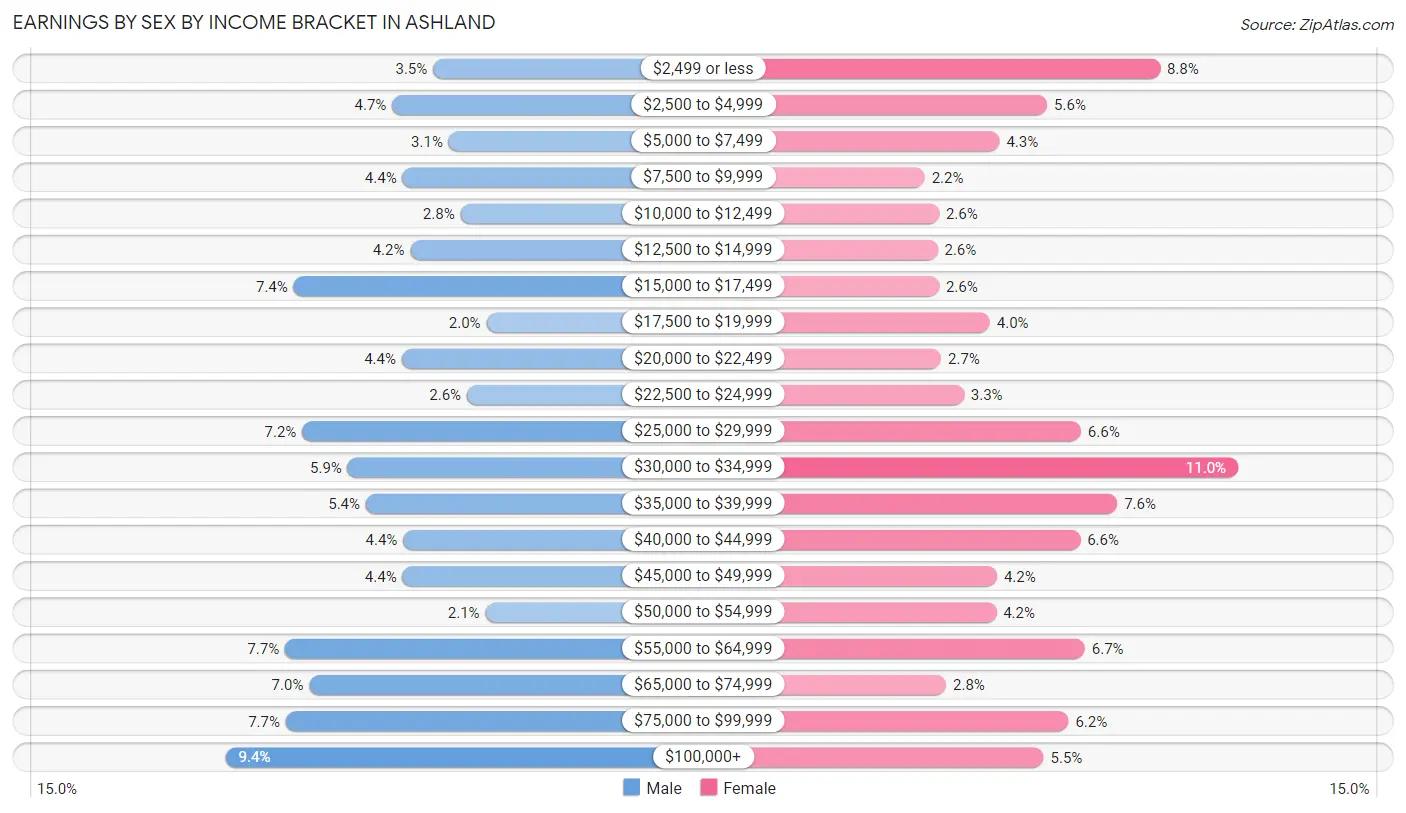
Earnings by Sex by Income Bracket in Ashland
The most common earnings brackets in Ashland are $100,000+ for men (425 | 9.3%) and $30,000 to $34,999 for women (568 | 11.0%).
| Income | Male | Female |
| $2,499 or less | 160 (3.5%) | 455 (8.8%) |
| $2,500 to $4,999 | 212 (4.7%) | 291 (5.6%) |
| $5,000 to $7,499 | 140 (3.1%) | 222 (4.3%) |
| $7,500 to $9,999 | 199 (4.4%) | 113 (2.2%) |
| $10,000 to $12,499 | 125 (2.8%) | 134 (2.6%) |
| $12,500 to $14,999 | 189 (4.2%) | 132 (2.5%) |
| $15,000 to $17,499 | 338 (7.4%) | 134 (2.6%) |
| $17,500 to $19,999 | 92 (2.0%) | 208 (4.0%) |
| $20,000 to $22,499 | 200 (4.4%) | 137 (2.6%) |
| $22,500 to $24,999 | 117 (2.6%) | 170 (3.3%) |
| $25,000 to $29,999 | 327 (7.2%) | 340 (6.6%) |
| $30,000 to $34,999 | 269 (5.9%) | 568 (11.0%) |
| $35,000 to $39,999 | 246 (5.4%) | 393 (7.6%) |
| $40,000 to $44,999 | 198 (4.4%) | 339 (6.6%) |
| $45,000 to $49,999 | 199 (4.4%) | 218 (4.2%) |
| $50,000 to $54,999 | 93 (2.1%) | 217 (4.2%) |
| $55,000 to $64,999 | 349 (7.7%) | 346 (6.7%) |
| $65,000 to $74,999 | 318 (7.0%) | 144 (2.8%) |
| $75,000 to $99,999 | 348 (7.7%) | 322 (6.2%) |
| $100,000+ | 425 (9.3%) | 286 (5.5%) |
| Total | 4,544 (100.0%) | 5,169 (100.0%) |
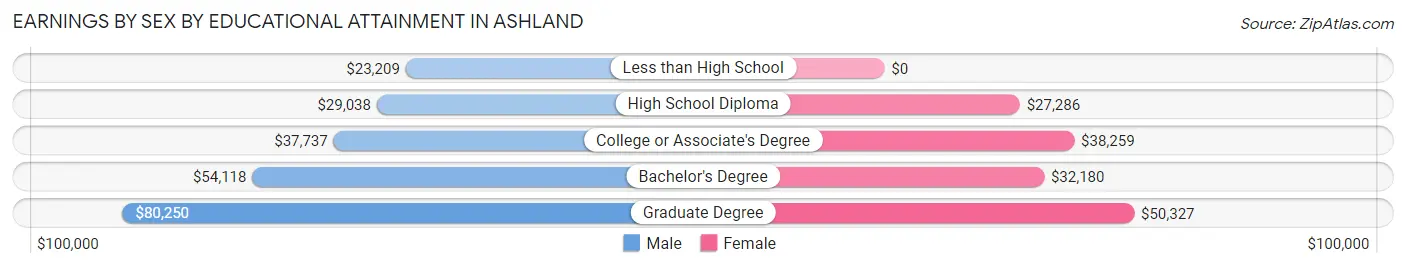
Earnings by Sex by Educational Attainment in Ashland
Average earnings in Ashland are $39,248 for men and $34,242 for women, a difference of 12.8%. Men with an educational attainment of graduate degree enjoy the highest average annual earnings of $80,250, while those with less than high school education earn the least with $23,209. Women with an educational attainment of graduate degree earn the most with the average annual earnings of $50,327, while those with high school diploma education have the smallest earnings of $27,286.
| Educational Attainment | Male Income | Female Income |
| Less than High School | $23,209 | $0 |
| High School Diploma | $29,038 | $27,286 |
| College or Associate's Degree | $37,737 | $38,259 |
| Bachelor's Degree | $54,118 | $32,180 |
| Graduate Degree | $80,250 | $50,327 |
| Total | $39,248 | $34,242 |
Family Income in Ashland
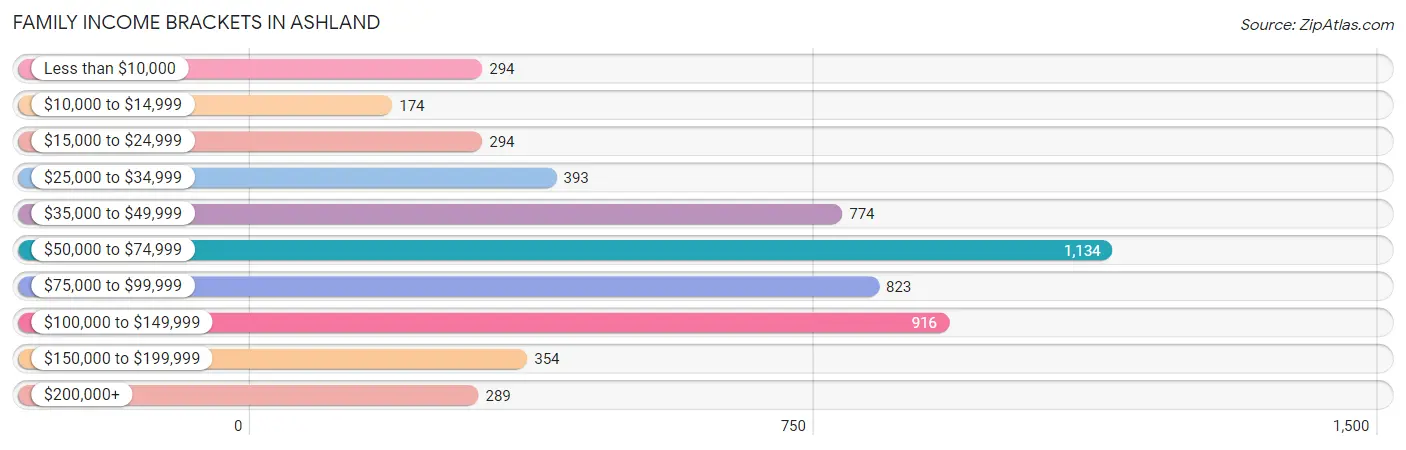
Family Income Brackets in Ashland
According to the Ashland family income data, there are 1,134 families falling into the $50,000 to $74,999 income range, which is the most common income bracket and makes up 20.8% of all families. Conversely, the $10,000 to $14,999 income bracket is the least frequent group with only 174 families (3.2%) belonging to this category.
| Income Bracket | # Families | % Families |
| Less than $10,000 | 294 | 5.4% |
| $10,000 to $14,999 | 174 | 3.2% |
| $15,000 to $24,999 | 294 | 5.4% |
| $25,000 to $34,999 | 393 | 7.2% |
| $35,000 to $49,999 | 774 | 14.2% |
| $50,000 to $74,999 | 1,134 | 20.8% |
| $75,000 to $99,999 | 823 | 15.1% |
| $100,000 to $149,999 | 916 | 16.8% |
| $150,000 to $199,999 | 354 | 6.5% |
| $200,000+ | 289 | 5.3% |
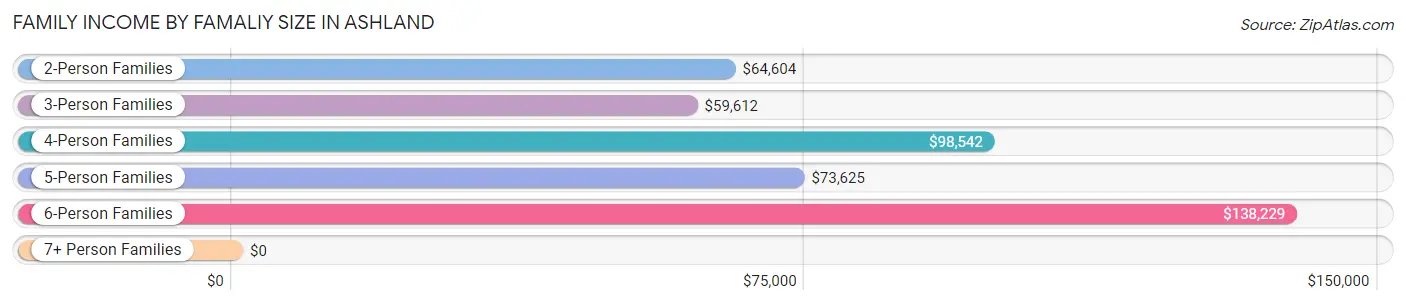
Family Income by Famaliy Size in Ashland
6-person families (89 | 1.6%) account for the highest median family income in Ashland with $138,229 per family, while 2-person families (2,881 | 52.8%) have the highest median income of $32,302 per family member.
| Income Bracket | # Families | Median Income |
| 2-Person Families | 2,881 (52.8%) | $64,604 |
| 3-Person Families | 1,372 (25.2%) | $59,612 |
| 4-Person Families | 802 (14.7%) | $98,542 |
| 5-Person Families | 288 (5.3%) | $73,625 |
| 6-Person Families | 89 (1.6%) | $138,229 |
| 7+ Person Families | 20 (0.4%) | $0 |
| Total | 5,452 (100.0%) | $65,909 |
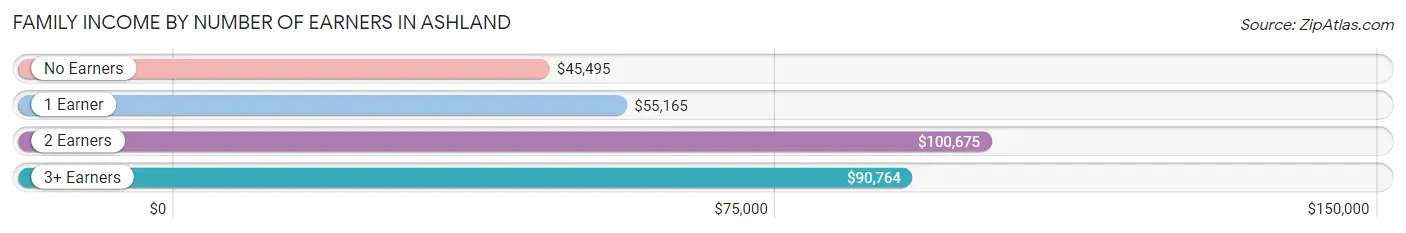
Family Income by Number of Earners in Ashland
The median family income in Ashland is $65,909, with families comprising 2 earners (1,787) having the highest median family income of $100,675, while families with no earners (1,025) have the lowest median family income of $45,495, accounting for 32.8% and 18.8% of families, respectively.
| Number of Earners | # Families | Median Income |
| No Earners | 1,025 (18.8%) | $45,495 |
| 1 Earner | 2,303 (42.2%) | $55,165 |
| 2 Earners | 1,787 (32.8%) | $100,675 |
| 3+ Earners | 337 (6.2%) | $90,764 |
| Total | 5,452 (100.0%) | $65,909 |
Household Income in Ashland
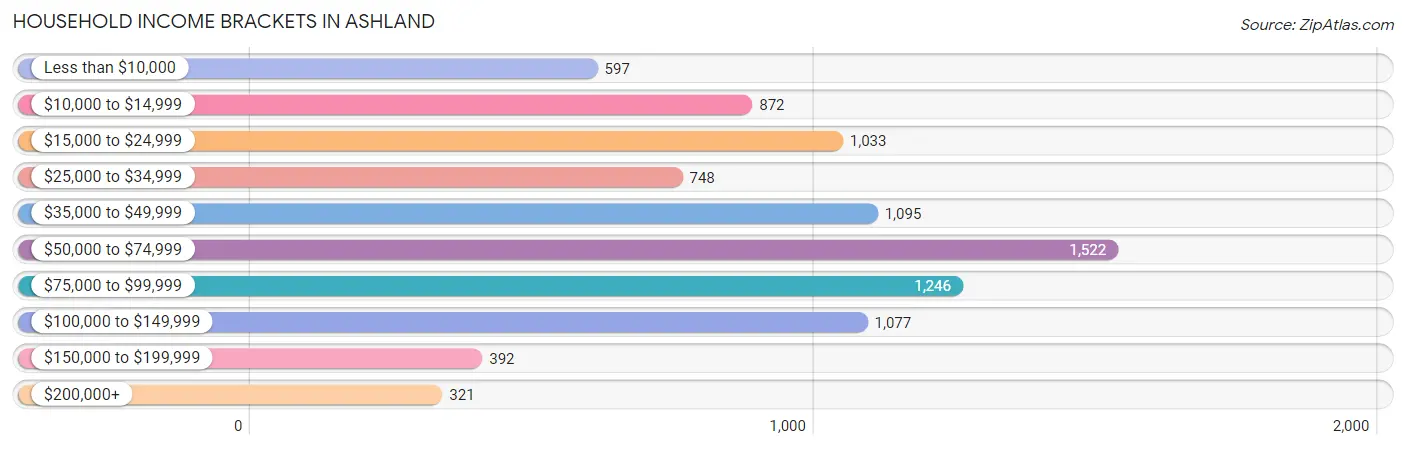
Household Income Brackets in Ashland
With 1,522 households falling in the category, the $50,000 to $74,999 income range is the most frequent in Ashland, accounting for 17.1% of all households. In contrast, only 321 households (3.6%) fall into the $200,000+ income bracket, making it the least populous group.
| Income Bracket | # Households | % Households |
| Less than $10,000 | 597 | 6.7% |
| $10,000 to $14,999 | 872 | 9.8% |
| $15,000 to $24,999 | 1,033 | 11.6% |
| $25,000 to $34,999 | 748 | 8.4% |
| $35,000 to $49,999 | 1,095 | 12.3% |
| $50,000 to $74,999 | 1,522 | 17.1% |
| $75,000 to $99,999 | 1,246 | 14.0% |
| $100,000 to $149,999 | 1,077 | 12.1% |
| $150,000 to $199,999 | 392 | 4.4% |
| $200,000+ | 321 | 3.6% |
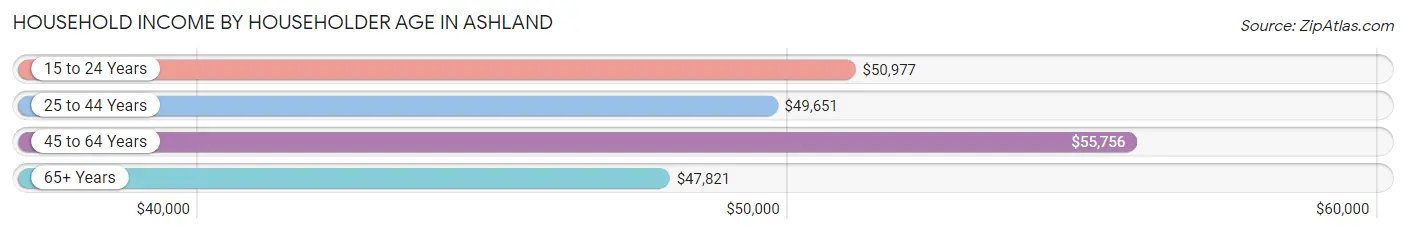
Household Income by Householder Age in Ashland
The median household income in Ashland is $51,250, with the highest median household income of $55,756 found in the 45 to 64 years age bracket for the primary householder. A total of 2,916 households (32.8%) fall into this category. Meanwhile, the 65+ years age bracket for the primary householder has the lowest median household income of $47,821, with 2,656 households (29.8%) in this group.
| Income Bracket | # Households | Median Income |
| 15 to 24 Years | 289 (3.3%) | $50,977 |
| 25 to 44 Years | 3,042 (34.2%) | $49,651 |
| 45 to 64 Years | 2,916 (32.8%) | $55,756 |
| 65+ Years | 2,656 (29.8%) | $47,821 |
| Total | 8,903 (100.0%) | $51,250 |
Poverty in Ashland
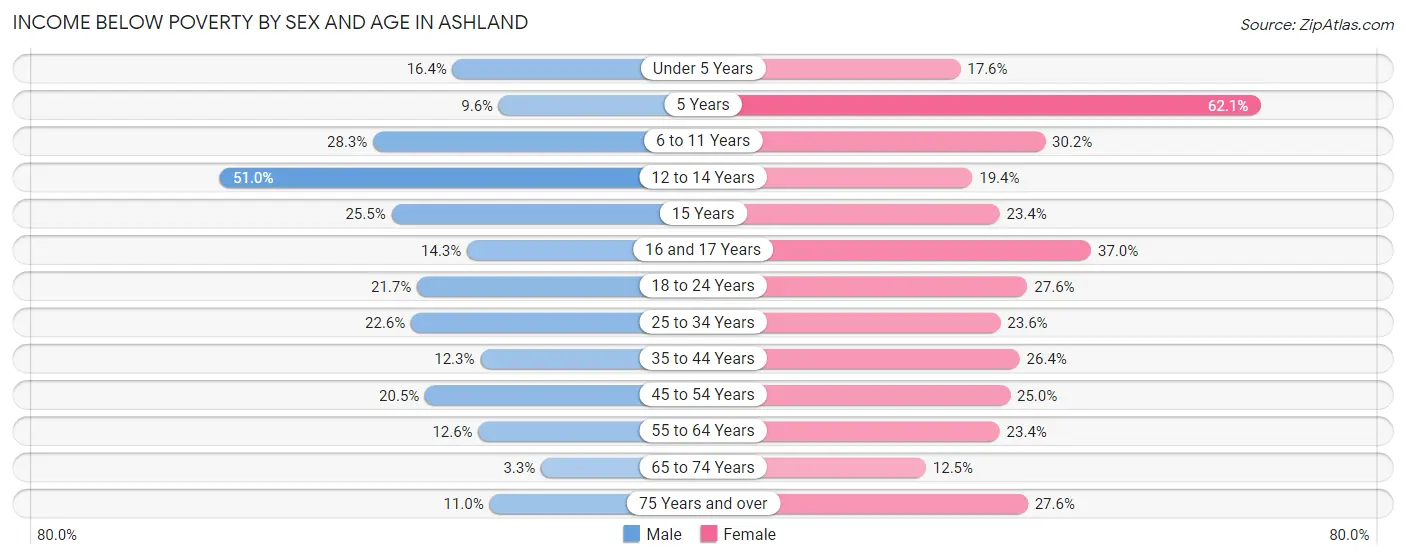
Income Below Poverty by Sex and Age in Ashland
With 17.1% poverty level for males and 24.4% for females among the residents of Ashland, 12 to 14 year old males and 5 year old females are the most vulnerable to poverty, with 159 males (51.0%) and 82 females (62.1%) in their respective age groups living below the poverty level.
| Age Bracket | Male | Female |
| Under 5 Years | 115 (16.4%) | 93 (17.6%) |
| 5 Years | 11 (9.6%) | 82 (62.1%) |
| 6 to 11 Years | 189 (28.2%) | 279 (30.2%) |
| 12 to 14 Years | 159 (51.0%) | 100 (19.4%) |
| 15 Years | 49 (25.5%) | 26 (23.4%) |
| 16 and 17 Years | 67 (14.3%) | 97 (37.0%) |
| 18 to 24 Years | 173 (21.7%) | 215 (27.6%) |
| 25 to 34 Years | 263 (22.6%) | 301 (23.5%) |
| 35 to 44 Years | 168 (12.3%) | 464 (26.4%) |
| 45 to 54 Years | 213 (20.5%) | 345 (25.0%) |
| 55 to 64 Years | 153 (12.6%) | 353 (23.4%) |
| 65 to 74 Years | 36 (3.3%) | 162 (12.5%) |
| 75 Years and over | 64 (11.0%) | 301 (27.6%) |
| Total | 1,660 (17.1%) | 2,818 (24.4%) |
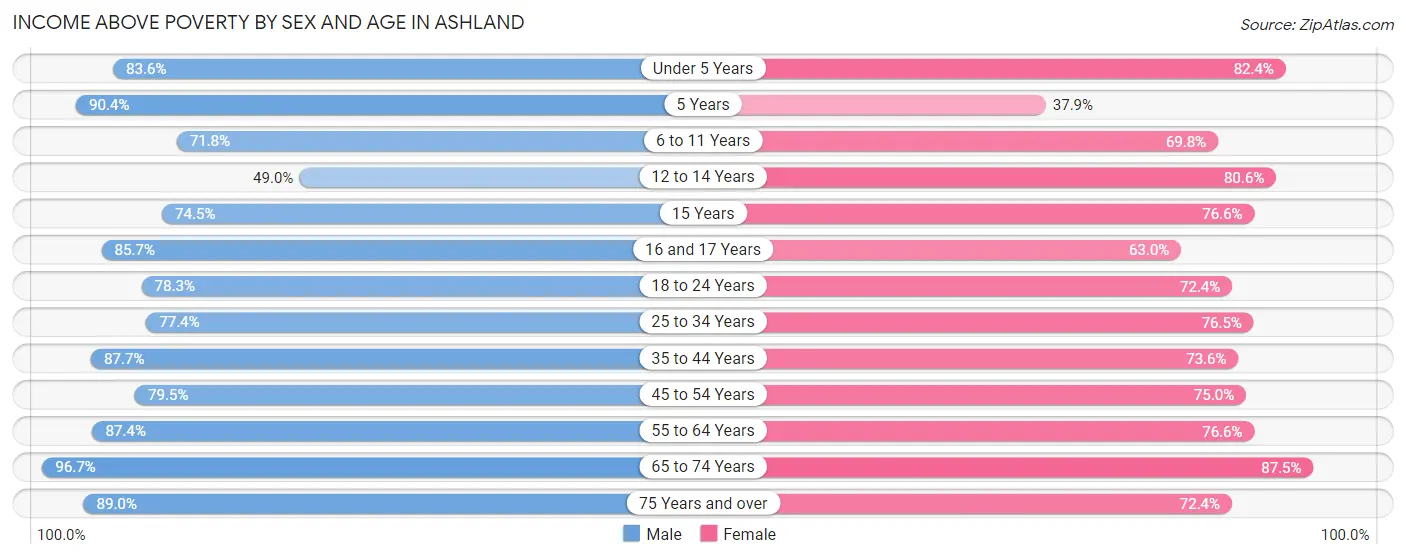
Income Above Poverty by Sex and Age in Ashland
According to the poverty statistics in Ashland, males aged 65 to 74 years and females aged 65 to 74 years are the age groups that are most secure financially, with 96.7% of males and 87.5% of females in these age groups living above the poverty line.
| Age Bracket | Male | Female |
| Under 5 Years | 585 (83.6%) | 435 (82.4%) |
| 5 Years | 104 (90.4%) | 50 (37.9%) |
| 6 to 11 Years | 480 (71.8%) | 645 (69.8%) |
| 12 to 14 Years | 153 (49.0%) | 416 (80.6%) |
| 15 Years | 143 (74.5%) | 85 (76.6%) |
| 16 and 17 Years | 402 (85.7%) | 165 (63.0%) |
| 18 to 24 Years | 623 (78.3%) | 565 (72.4%) |
| 25 to 34 Years | 900 (77.4%) | 977 (76.4%) |
| 35 to 44 Years | 1,195 (87.7%) | 1,293 (73.6%) |
| 45 to 54 Years | 825 (79.5%) | 1,036 (75.0%) |
| 55 to 64 Years | 1,060 (87.4%) | 1,153 (76.6%) |
| 65 to 74 Years | 1,050 (96.7%) | 1,136 (87.5%) |
| 75 Years and over | 520 (89.0%) | 789 (72.4%) |
| Total | 8,040 (82.9%) | 8,745 (75.6%) |
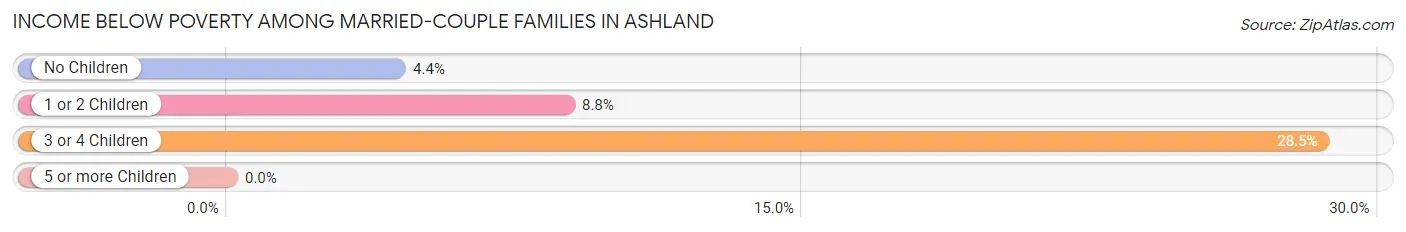
Income Below Poverty Among Married-Couple Families in Ashland
The poverty statistics for married-couple families in Ashland show that 7.3% or 247 of the total 3,359 families live below the poverty line. Families with 3 or 4 children have the highest poverty rate of 28.5%, comprising of 55 families. On the other hand, families with no children have the lowest poverty rate of 4.4%, which includes 86 families.
| Children | Above Poverty | Below Poverty |
| No Children | 1,875 (95.6%) | 86 (4.4%) |
| 1 or 2 Children | 1,099 (91.2%) | 106 (8.8%) |
| 3 or 4 Children | 138 (71.5%) | 55 (28.5%) |
| 5 or more Children | 0 (0.0%) | 0 (0.0%) |
| Total | 3,112 (92.6%) | 247 (7.3%) |
Income Below Poverty Among Single-Parent Households in Ashland
According to the poverty data in Ashland, 19.0% or 79 single-father households and 25.2% or 423 single-mother households are living below the poverty line. Among single-father households, those with 3 or 4 children have the highest poverty rate, with 37 households (80.4%) experiencing poverty. Likewise, among single-mother households, those with 3 or 4 children have the highest poverty rate, with 64 households (57.7%) falling below the poverty line.
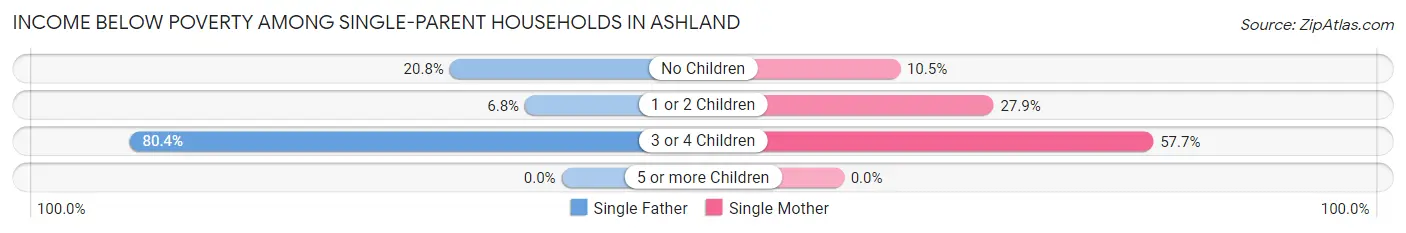
| Children | Single Father | Single Mother |
| No Children | 25 (20.8%) | 47 (10.5%) |
| 1 or 2 Children | 17 (6.8%) | 312 (27.9%) |
| 3 or 4 Children | 37 (80.4%) | 64 (57.7%) |
| 5 or more Children | 0 (0.0%) | 0 (0.0%) |
| Total | 79 (19.0%) | 423 (25.2%) |
Income Below Poverty Among Married-Couple vs Single-Parent Households in Ashland
The poverty data for Ashland shows that 247 of the married-couple family households (7.3%) and 502 of the single-parent households (24.0%) are living below the poverty level. Within the married-couple family households, those with 3 or 4 children have the highest poverty rate, with 55 households (28.5%) falling below the poverty line. Among the single-parent households, those with 3 or 4 children have the highest poverty rate, with 101 household (64.3%) living below poverty.
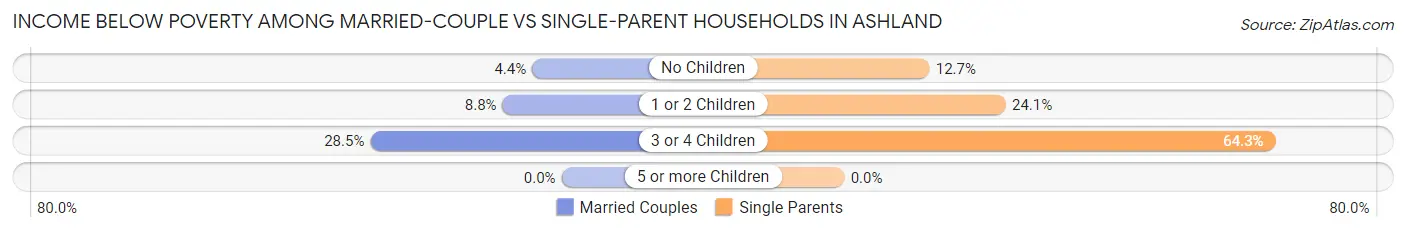
| Children | Married-Couple Families | Single-Parent Households |
| No Children | 86 (4.4%) | 72 (12.7%) |
| 1 or 2 Children | 106 (8.8%) | 329 (24.0%) |
| 3 or 4 Children | 55 (28.5%) | 101 (64.3%) |
| 5 or more Children | 0 (0.0%) | 0 (0.0%) |
| Total | 247 (7.3%) | 502 (24.0%) |
Race in Ashland
The most populous races in Ashland are White / Caucasian (19,788 | 91.9%), Two or more Races (863 | 4.0%), and Hispanic or Latino (649 | 3.0%).
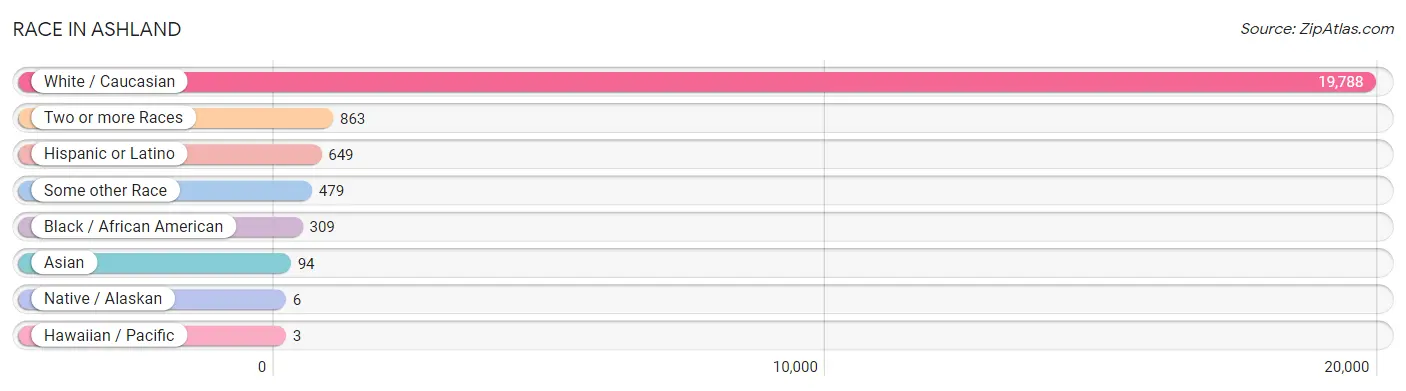
| Race | # Population | % Population |
| Asian | 94 | 0.4% |
| Black / African American | 309 | 1.4% |
| Hawaiian / Pacific | 3 | 0.0% |
| Hispanic or Latino | 649 | 3.0% |
| Native / Alaskan | 6 | 0.0% |
| White / Caucasian | 19,788 | 91.9% |
| Two or more Races | 863 | 4.0% |
| Some other Race | 479 | 2.2% |
| Total | 21,542 | 100.0% |
Ancestry in Ashland
The most populous ancestries reported in Ashland are American (3,699 | 17.2%), English (3,378 | 15.7%), German (2,183 | 10.1%), Irish (2,046 | 9.5%), and Scotch-Irish (1,088 | 5.1%), together accounting for 57.5% of all Ashland residents.
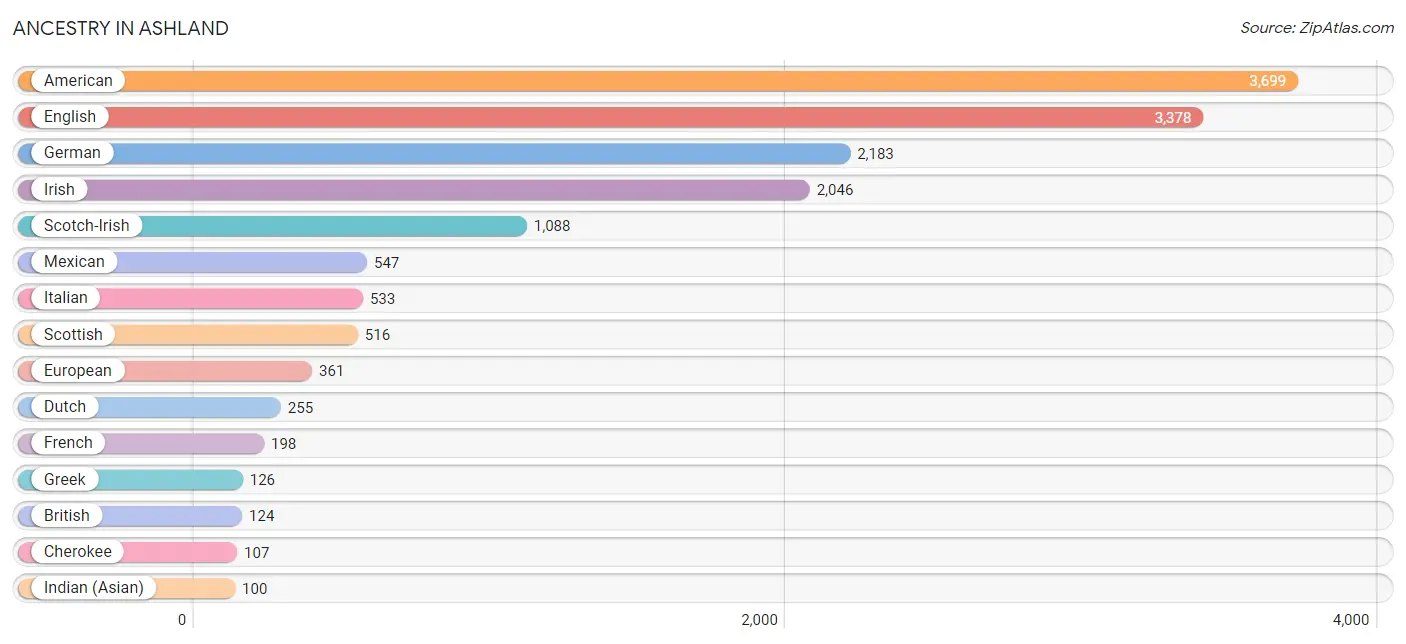
| Ancestry | # Population | % Population |
| African | 11 | 0.1% |
| American | 3,699 | 17.2% |
| Arab | 38 | 0.2% |
| Austrian | 6 | 0.0% |
| Belgian | 6 | 0.0% |
| Bhutanese | 14 | 0.1% |
| Blackfeet | 10 | 0.1% |
| British | 124 | 0.6% |
| Canadian | 24 | 0.1% |
| Celtic | 6 | 0.0% |
| Central American | 1 | 0.0% |
| Cherokee | 107 | 0.5% |
| Colombian | 76 | 0.4% |
| Cree | 32 | 0.2% |
| Cuban | 15 | 0.1% |
| Czech | 5 | 0.0% |
| Czechoslovakian | 6 | 0.0% |
| Danish | 13 | 0.1% |
| Dutch | 255 | 1.2% |
| Eastern European | 32 | 0.2% |
| English | 3,378 | 15.7% |
| European | 361 | 1.7% |
| French | 198 | 0.9% |
| German | 2,183 | 10.1% |
| Greek | 126 | 0.6% |
| Hungarian | 36 | 0.2% |
| Indian (Asian) | 100 | 0.5% |
| Indonesian | 62 | 0.3% |
| Irish | 2,046 | 9.5% |
| Italian | 533 | 2.5% |
| Jordanian | 38 | 0.2% |
| Korean | 6 | 0.0% |
| Mexican | 547 | 2.5% |
| Native Hawaiian | 3 | 0.0% |
| Northern European | 69 | 0.3% |
| Norwegian | 11 | 0.1% |
| Pakistani | 33 | 0.2% |
| Polish | 76 | 0.4% |
| Portuguese | 28 | 0.1% |
| Puerto Rican | 4 | 0.0% |
| Romanian | 27 | 0.1% |
| Russian | 33 | 0.2% |
| Salvadoran | 1 | 0.0% |
| Samoan | 11 | 0.1% |
| Scandinavian | 9 | 0.0% |
| Scotch-Irish | 1,088 | 5.1% |
| Scottish | 516 | 2.4% |
| Slavic | 23 | 0.1% |
| South American | 76 | 0.4% |
| Spaniard | 6 | 0.0% |
| Subsaharan African | 11 | 0.1% |
| Swedish | 10 | 0.1% |
| Swiss | 24 | 0.1% |
| Ukrainian | 9 | 0.0% |
| Welsh | 92 | 0.4% | View All 55 Rows |
Immigrants in Ashland
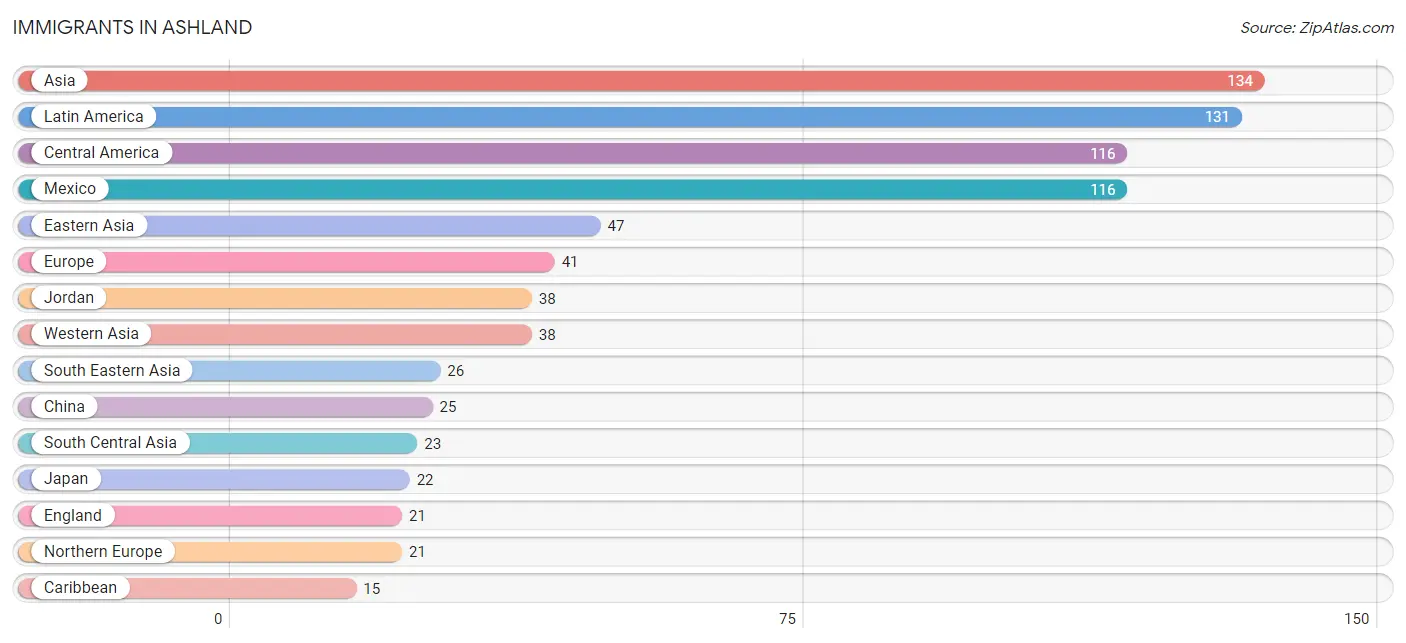
The most numerous immigrant groups reported in Ashland came from Asia (134 | 0.6%), Latin America (131 | 0.6%), Central America (116 | 0.5%), Mexico (116 | 0.5%), and Eastern Asia (47 | 0.2%), together accounting for 2.5% of all Ashland residents.
| Immigration Origin | # Population | % Population |
| Asia | 134 | 0.6% |
| Caribbean | 15 | 0.1% |
| Central America | 116 | 0.5% |
| China | 25 | 0.1% |
| Cuba | 15 | 0.1% |
| Eastern Asia | 47 | 0.2% |
| Eastern Europe | 9 | 0.0% |
| England | 21 | 0.1% |
| Europe | 41 | 0.2% |
| Germany | 5 | 0.0% |
| Japan | 22 | 0.1% |
| Jordan | 38 | 0.2% |
| Latin America | 131 | 0.6% |
| Mexico | 116 | 0.5% |
| Northern Europe | 21 | 0.1% |
| South Central Asia | 23 | 0.1% |
| South Eastern Asia | 26 | 0.1% |
| Southern Europe | 6 | 0.0% |
| Spain | 6 | 0.0% |
| Ukraine | 9 | 0.0% |
| Western Asia | 38 | 0.2% |
| Western Europe | 5 | 0.0% | View All 22 Rows |
Sex and Age in Ashland
Sex and Age in Ashland
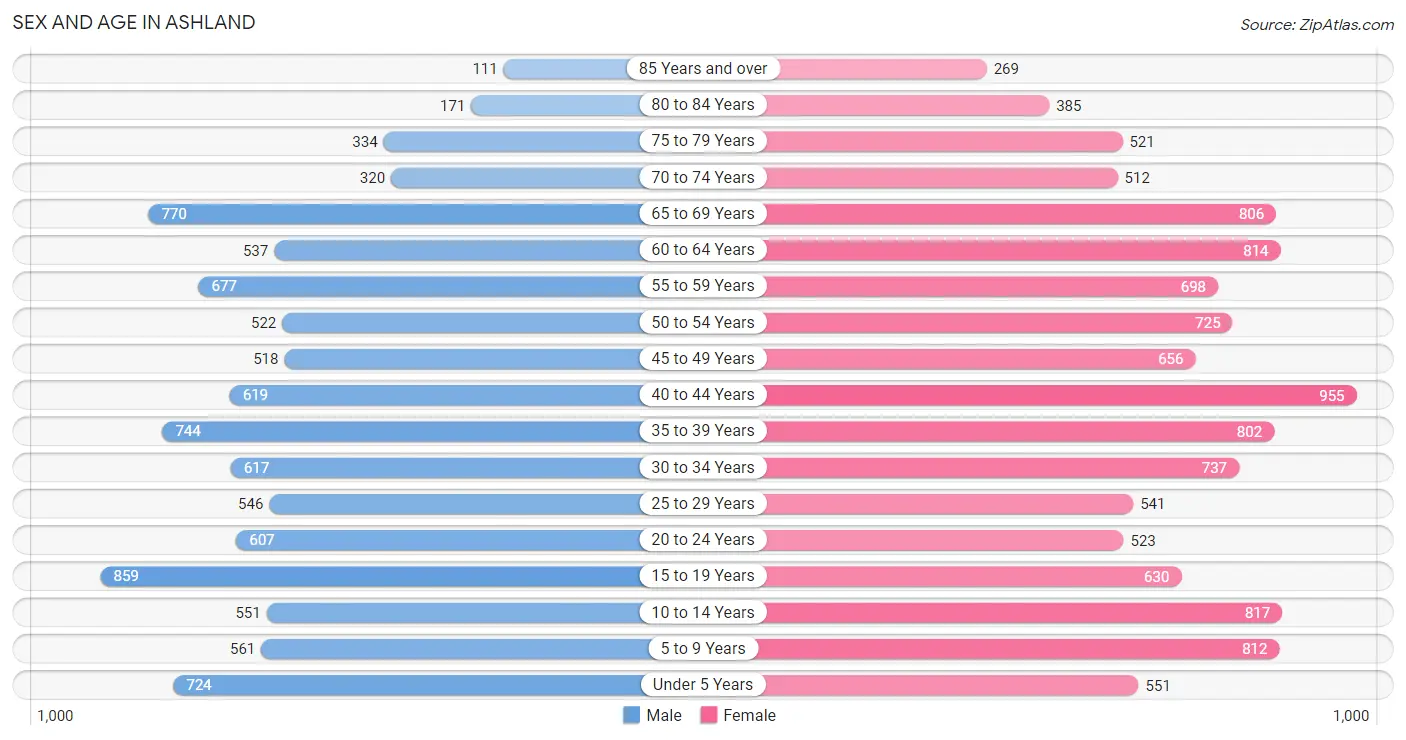
The most populous age groups in Ashland are 15 to 19 Years (859 | 8.8%) for men and 40 to 44 Years (955 | 8.1%) for women.
| Age Bracket | Male | Female |
| Under 5 Years | 724 (7.4%) | 551 (4.7%) |
| 5 to 9 Years | 561 (5.7%) | 812 (6.9%) |
| 10 to 14 Years | 551 (5.6%) | 817 (7.0%) |
| 15 to 19 Years | 859 (8.8%) | 630 (5.4%) |
| 20 to 24 Years | 607 (6.2%) | 523 (4.4%) |
| 25 to 29 Years | 546 (5.6%) | 541 (4.6%) |
| 30 to 34 Years | 617 (6.3%) | 737 (6.3%) |
| 35 to 39 Years | 744 (7.6%) | 802 (6.8%) |
| 40 to 44 Years | 619 (6.3%) | 955 (8.1%) |
| 45 to 49 Years | 518 (5.3%) | 656 (5.6%) |
| 50 to 54 Years | 522 (5.3%) | 725 (6.2%) |
| 55 to 59 Years | 677 (6.9%) | 698 (5.9%) |
| 60 to 64 Years | 537 (5.5%) | 814 (6.9%) |
| 65 to 69 Years | 770 (7.9%) | 806 (6.9%) |
| 70 to 74 Years | 320 (3.3%) | 512 (4.4%) |
| 75 to 79 Years | 334 (3.4%) | 521 (4.4%) |
| 80 to 84 Years | 171 (1.8%) | 385 (3.3%) |
| 85 Years and over | 111 (1.1%) | 269 (2.3%) |
| Total | 9,788 (100.0%) | 11,754 (100.0%) |
Families and Households in Ashland
Median Family Size in Ashland
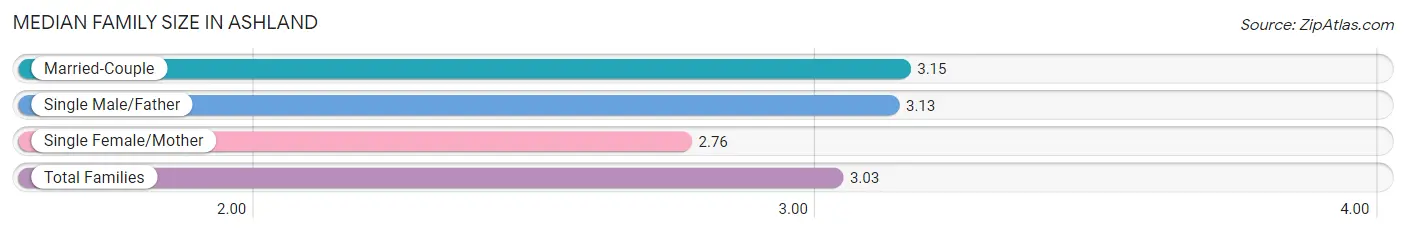
The median family size in Ashland is 3.03 persons per family, with married-couple families (3,359 | 61.6%) accounting for the largest median family size of 3.15 persons per family. On the other hand, single female/mother families (1,677 | 30.8%) represent the smallest median family size with 2.76 persons per family.
| Family Type | # Families | Family Size |
| Married-Couple | 3,359 (61.6%) | 3.15 |
| Single Male/Father | 416 (7.6%) | 3.13 |
| Single Female/Mother | 1,677 (30.8%) | 2.76 |
| Total Families | 5,452 (100.0%) | 3.03 |
Median Household Size in Ashland
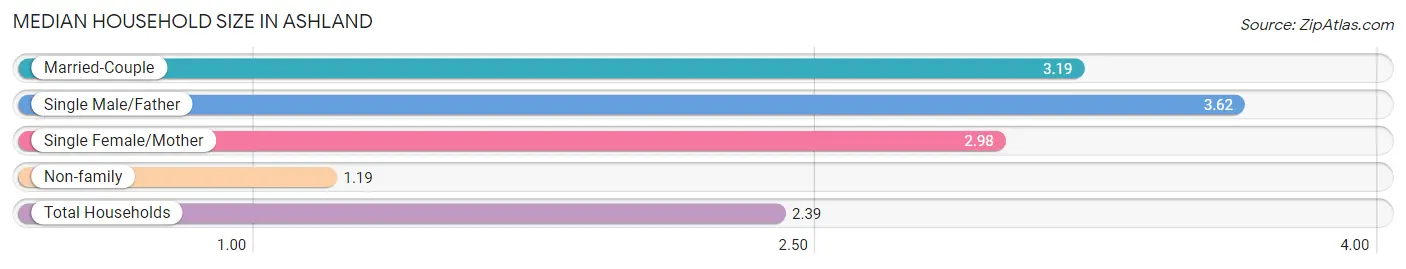
The median household size in Ashland is 2.39 persons per household, with single male/father households (416 | 4.7%) accounting for the largest median household size of 3.62 persons per household. non-family households (3,451 | 38.8%) represent the smallest median household size with 1.19 persons per household.
| Household Type | # Households | Household Size |
| Married-Couple | 3,359 (37.7%) | 3.19 |
| Single Male/Father | 416 (4.7%) | 3.62 |
| Single Female/Mother | 1,677 (18.8%) | 2.98 |
| Non-family | 3,451 (38.8%) | 1.19 |
| Total Households | 8,903 (100.0%) | 2.39 |
Household Size by Marriage Status in Ashland
Out of a total of 8,903 households in Ashland, 5,452 (61.2%) are family households, while 3,451 (38.8%) are nonfamily households. The most numerous type of family households are 2-person households, comprising 2,674, and the most common type of nonfamily households are 1-person households, comprising 2,979.
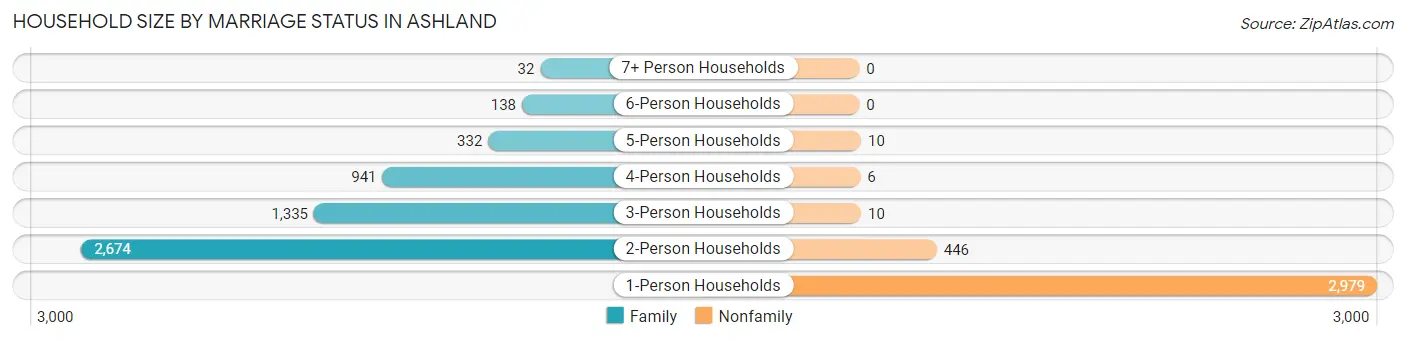
| Household Size | Family Households | Nonfamily Households |
| 1-Person Households | - | 2,979 (33.5%) |
| 2-Person Households | 2,674 (30.0%) | 446 (5.0%) |
| 3-Person Households | 1,335 (15.0%) | 10 (0.1%) |
| 4-Person Households | 941 (10.6%) | 6 (0.1%) |
| 5-Person Households | 332 (3.7%) | 10 (0.1%) |
| 6-Person Households | 138 (1.5%) | 0 (0.0%) |
| 7+ Person Households | 32 (0.4%) | 0 (0.0%) |
| Total | 5,452 (61.2%) | 3,451 (38.8%) |
Female Fertility in Ashland
Fertility by Age in Ashland
Average fertility rate in Ashland is 35.0 births per 1,000 women. Women in the age bracket of 20 to 34 years have the highest fertility rate with 68.0 births per 1,000 women. Women in the age bracket of 20 to 34 years acount for 69.9% of all women with births.
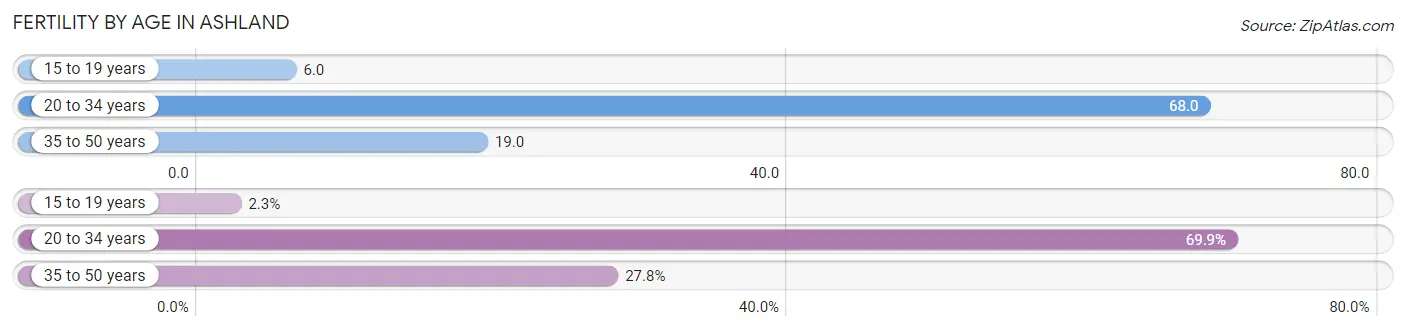
| Age Bracket | Women with Births | Births / 1,000 Women |
| 15 to 19 years | 4 (2.3%) | 6.0 |
| 20 to 34 years | 123 (69.9%) | 68.0 |
| 35 to 50 years | 49 (27.8%) | 19.0 |
| Total | 176 (100.0%) | 35.0 |
Fertility by Age by Marriage Status in Ashland
38.6% of women with births (176) in Ashland are married. The highest percentage of unmarried women with births falls into 15 to 19 years age bracket with 100.0% of them unmarried at the time of birth, while the lowest percentage of unmarried women with births belong to 20 to 34 years age bracket with 56.1% of them unmarried.
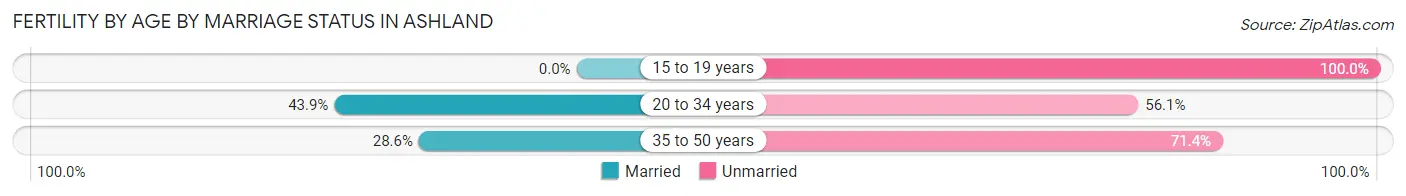
| Age Bracket | Married | Unmarried |
| 15 to 19 years | 0 (0.0%) | 4 (100.0%) |
| 20 to 34 years | 54 (43.9%) | 69 (56.1%) |
| 35 to 50 years | 14 (28.6%) | 35 (71.4%) |
| Total | 68 (38.6%) | 108 (61.4%) |
Fertility by Education in Ashland
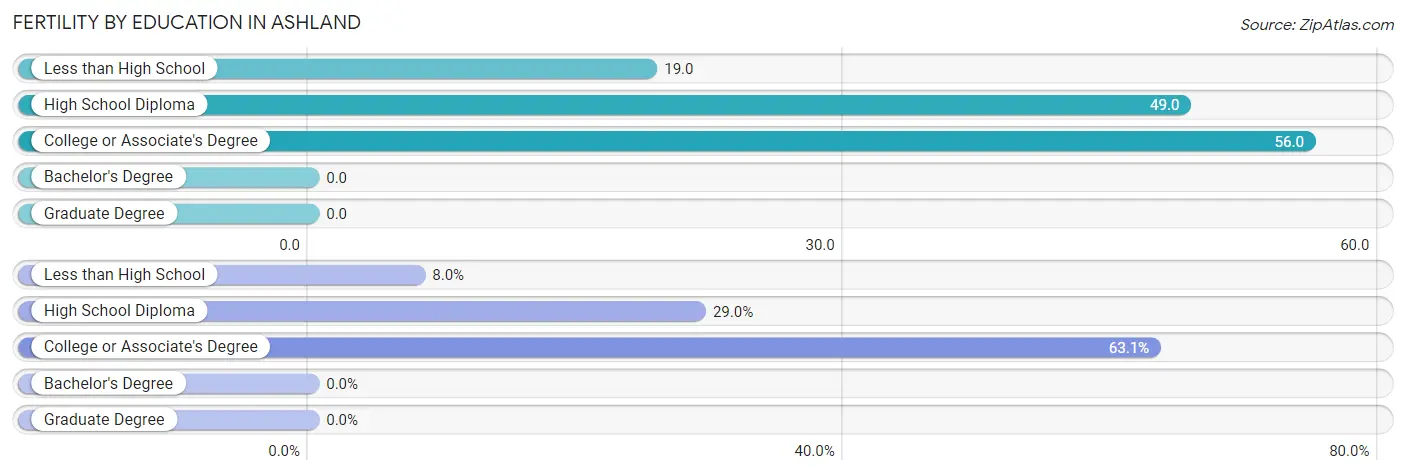
| Educational Attainment | Women with Births | Births / 1,000 Women |
| Less than High School | 14 (8.0%) | 19.0 |
| High School Diploma | 51 (29.0%) | 49.0 |
| College or Associate's Degree | 111 (63.1%) | 56.0 |
| Bachelor's Degree | 0 (0.0%) | 0.0 |
| Graduate Degree | 0 (0.0%) | 0.0 |
| Total | 176 (100.0%) | 35.0 |
Fertility by Education by Marriage Status in Ashland
61.4% of women with births in Ashland are unmarried. Women with the educational attainment of less than high school are most likely to be married with 100.0% of them married at childbirth, while women with the educational attainment of high school diploma are least likely to be married with 100.0% of them unmarried at childbirth.
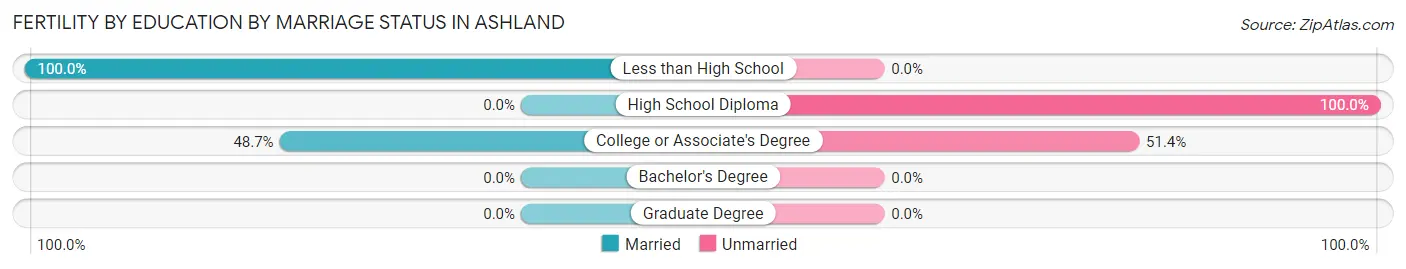
| Educational Attainment | Married | Unmarried |
| Less than High School | 14 (100.0%) | 0 (0.0%) |
| High School Diploma | 0 (0.0%) | 51 (100.0%) |
| College or Associate's Degree | 54 (48.6%) | 57 (51.3%) |
| Bachelor's Degree | 0 (0.0%) | 0 (0.0%) |
| Graduate Degree | 0 (0.0%) | 0 (0.0%) |
| Total | 68 (38.6%) | 108 (61.4%) |
Employment Characteristics in Ashland
Employment by Class of Employer in Ashland
Among the 8,492 employed individuals in Ashland, private company employees (5,625 | 66.2%), not-for-profit organizations (1,144 | 13.5%), and local government employees (453 | 5.3%) make up the most common classes of employment.
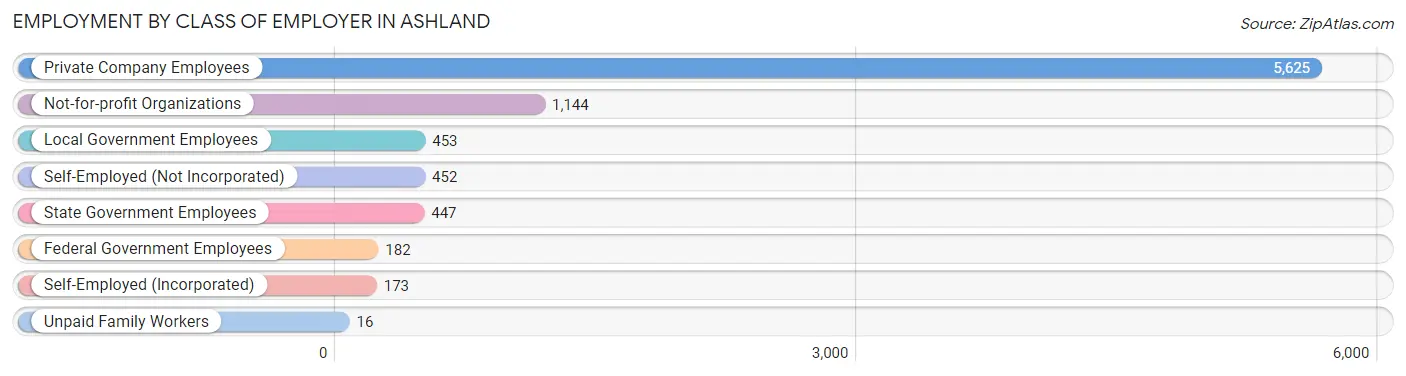
| Employer Class | # Employees | % Employees |
| Private Company Employees | 5,625 | 66.2% |
| Self-Employed (Incorporated) | 173 | 2.0% |
| Self-Employed (Not Incorporated) | 452 | 5.3% |
| Not-for-profit Organizations | 1,144 | 13.5% |
| Local Government Employees | 453 | 5.3% |
| State Government Employees | 447 | 5.3% |
| Federal Government Employees | 182 | 2.1% |
| Unpaid Family Workers | 16 | 0.2% |
| Total | 8,492 | 100.0% |
Employment Status by Age in Ashland
According to the labor force statistics for Ashland, out of the total population over 16 years of age (17,223), 54.9% or 9,455 individuals are in the labor force, with 8.4% or 794 of them unemployed. The age group with the highest labor force participation rate is 30 to 34 years, with 84.2% or 1,140 individuals in the labor force. Within the labor force, the 35 to 44 years age range has the highest percentage of unemployed individuals, with 16.3% or 388 of them being unemployed.
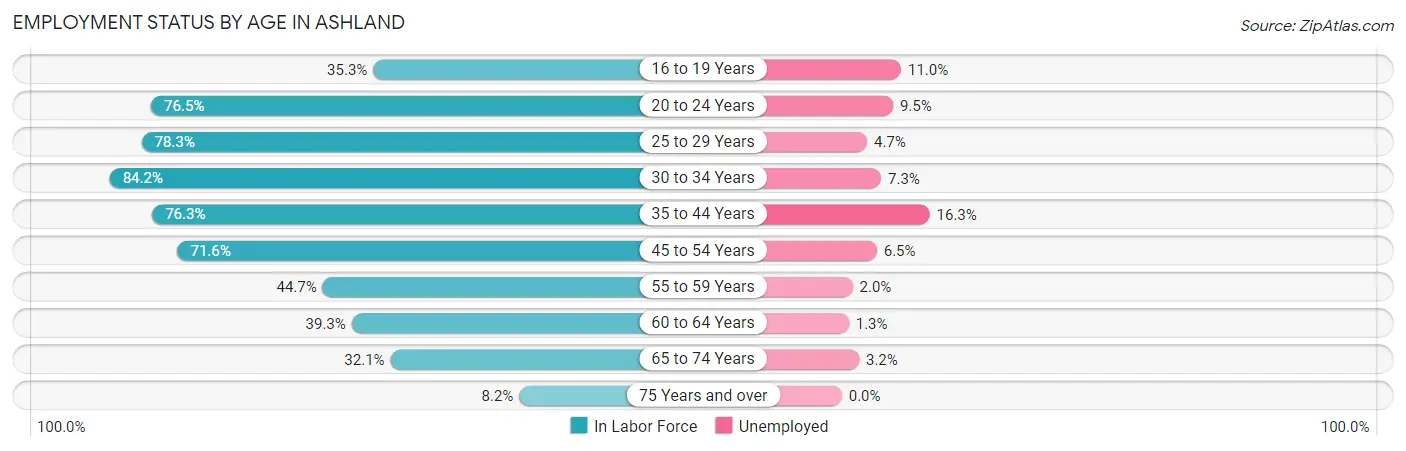
| Age Bracket | In Labor Force | Unemployed |
| 16 to 19 Years | 419 (35.3%) | 46 (11.0%) |
| 20 to 24 Years | 864 (76.5%) | 82 (9.5%) |
| 25 to 29 Years | 851 (78.3%) | 40 (4.7%) |
| 30 to 34 Years | 1,140 (84.2%) | 83 (7.3%) |
| 35 to 44 Years | 2,381 (76.3%) | 388 (16.3%) |
| 45 to 54 Years | 1,733 (71.6%) | 113 (6.5%) |
| 55 to 59 Years | 615 (44.7%) | 12 (2.0%) |
| 60 to 64 Years | 531 (39.3%) | 7 (1.3%) |
| 65 to 74 Years | 773 (32.1%) | 25 (3.2%) |
| 75 Years and over | 147 (8.2%) | 0 (0.0%) |
| Total | 9,455 (54.9%) | 794 (8.4%) |
Employment Status by Educational Attainment in Ashland
According to labor force statistics for Ashland, 67.7% of individuals (7,249) out of the total population between 25 and 64 years of age (10,708) are in the labor force, with 8.9% or 645 of them being unemployed. The group with the highest labor force participation rate are those with the educational attainment of bachelor's degree or higher, with 84.4% or 2,155 individuals in the labor force. Within the labor force, individuals with less than high school education have the highest percentage of unemployment, with 15.6% or 73 of them being unemployed.
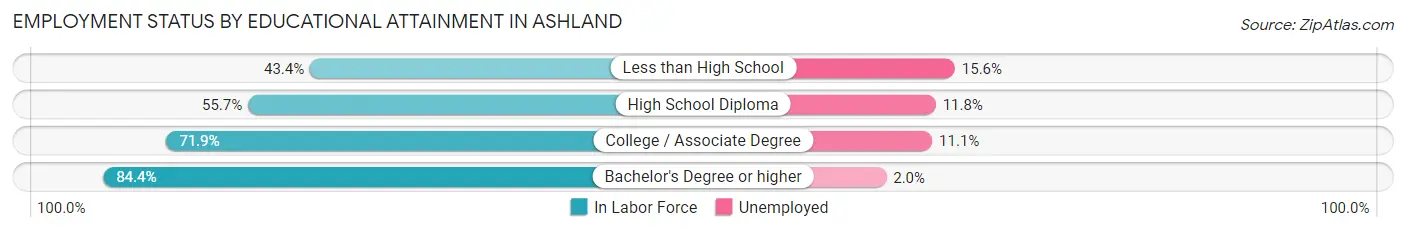
| Educational Attainment | In Labor Force | Unemployed |
| Less than High School | 467 (43.4%) | 168 (15.6%) |
| High School Diploma | 1,573 (55.7%) | 333 (11.8%) |
| College / Associate Degree | 3,059 (71.9%) | 472 (11.1%) |
| Bachelor's Degree or higher | 2,155 (84.4%) | 51 (2.0%) |
| Total | 7,249 (67.7%) | 953 (8.9%) |
Employment Occupations by Sex in Ashland
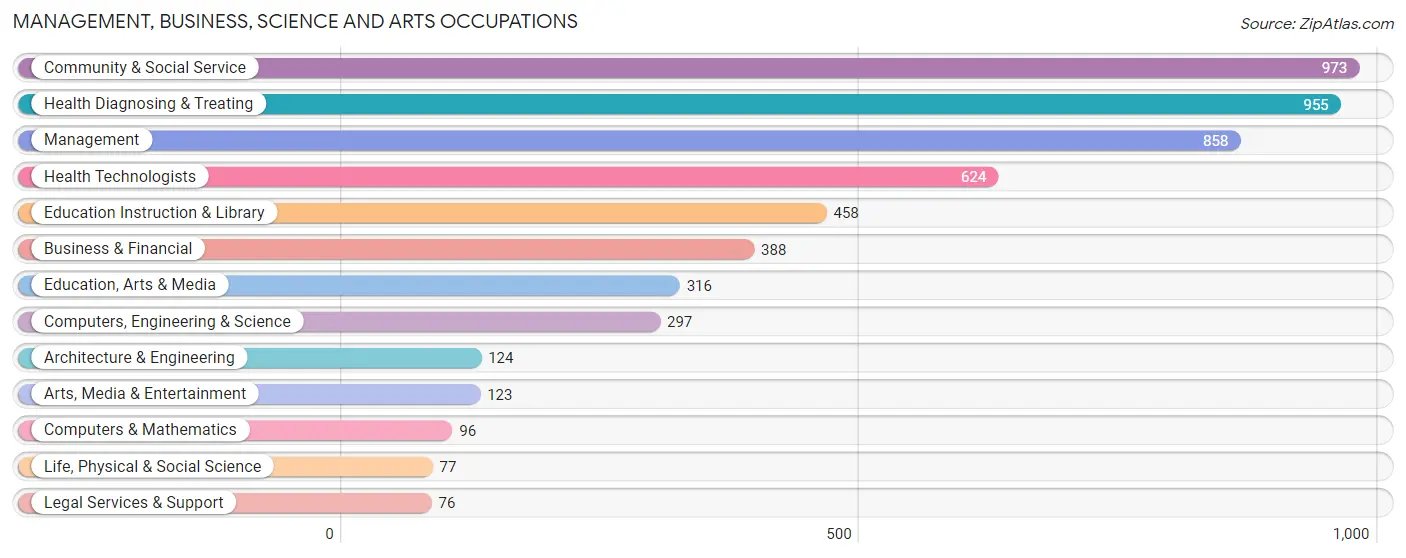
Management, Business, Science and Arts Occupations
The most common Management, Business, Science and Arts occupations in Ashland are Community & Social Service (973 | 11.2%), Health Diagnosing & Treating (955 | 11.0%), Management (858 | 9.9%), Health Technologists (624 | 7.2%), and Education Instruction & Library (458 | 5.3%).
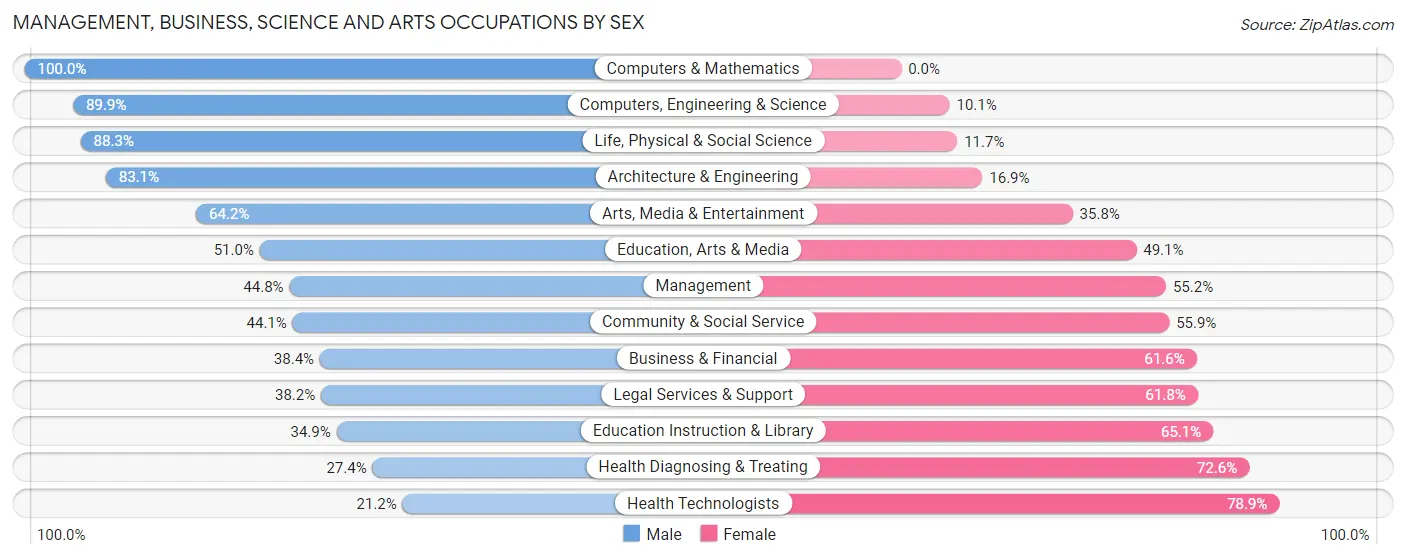
Management, Business, Science and Arts Occupations by Sex
Within the Management, Business, Science and Arts occupations in Ashland, the most male-oriented occupations are Computers & Mathematics (100.0%), Computers, Engineering & Science (89.9%), and Life, Physical & Social Science (88.3%), while the most female-oriented occupations are Health Technologists (78.8%), Health Diagnosing & Treating (72.6%), and Education Instruction & Library (65.1%).
| Occupation | Male | Female |
| Management | 384 (44.8%) | 474 (55.2%) |
| Business & Financial | 149 (38.4%) | 239 (61.6%) |
| Computers, Engineering & Science | 267 (89.9%) | 30 (10.1%) |
| Computers & Mathematics | 96 (100.0%) | 0 (0.0%) |
| Architecture & Engineering | 103 (83.1%) | 21 (16.9%) |
| Life, Physical & Social Science | 68 (88.3%) | 9 (11.7%) |
| Community & Social Service | 429 (44.1%) | 544 (55.9%) |
| Education, Arts & Media | 161 (50.9%) | 155 (49.0%) |
| Legal Services & Support | 29 (38.2%) | 47 (61.8%) |
| Education Instruction & Library | 160 (34.9%) | 298 (65.1%) |
| Arts, Media & Entertainment | 79 (64.2%) | 44 (35.8%) |
| Health Diagnosing & Treating | 262 (27.4%) | 693 (72.6%) |
| Health Technologists | 132 (21.1%) | 492 (78.8%) |
| Total (Category) | 1,491 (43.0%) | 1,980 (57.0%) |
| Total (Overall) | 3,948 (45.6%) | 4,711 (54.4%) |
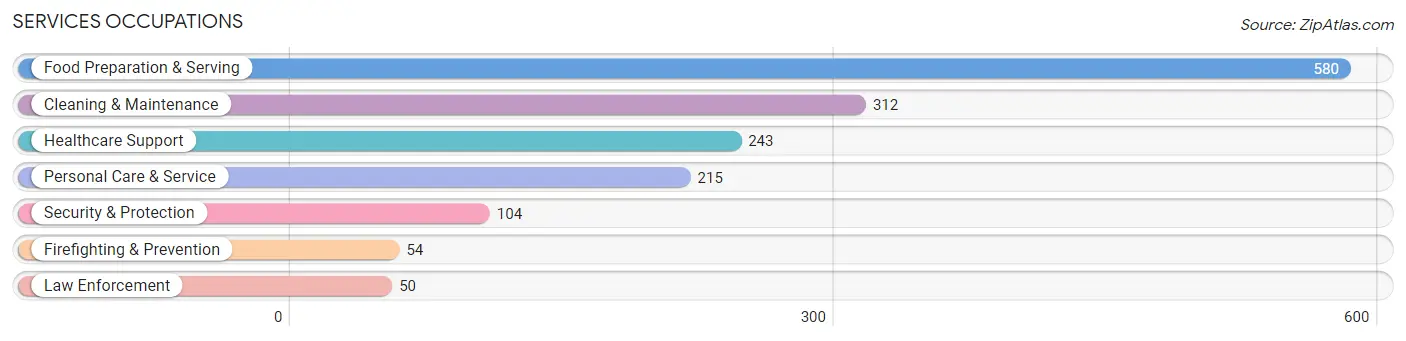
Services Occupations
The most common Services occupations in Ashland are Food Preparation & Serving (580 | 6.7%), Cleaning & Maintenance (312 | 3.6%), Healthcare Support (243 | 2.8%), Personal Care & Service (215 | 2.5%), and Security & Protection (104 | 1.2%).
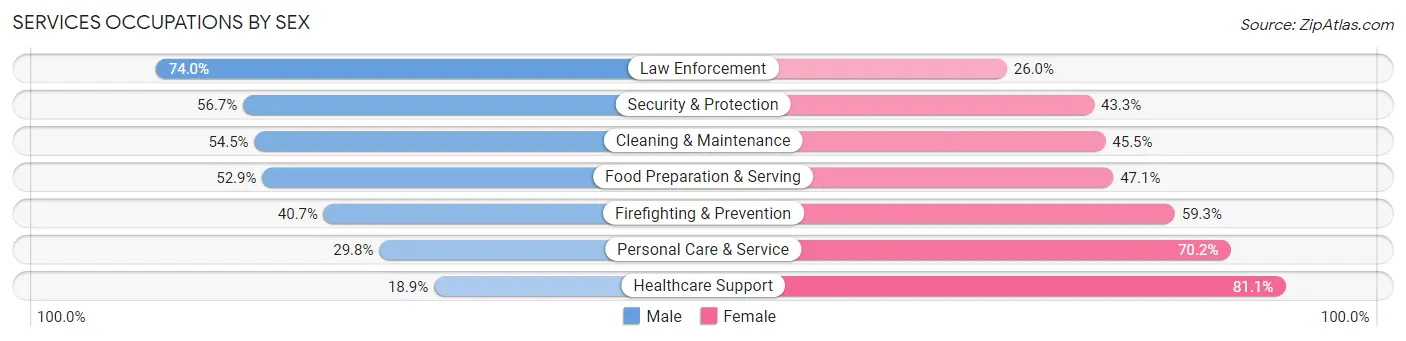
Services Occupations by Sex
Within the Services occupations in Ashland, the most male-oriented occupations are Law Enforcement (74.0%), Security & Protection (56.7%), and Cleaning & Maintenance (54.5%), while the most female-oriented occupations are Healthcare Support (81.1%), Personal Care & Service (70.2%), and Firefighting & Prevention (59.3%).
| Occupation | Male | Female |
| Healthcare Support | 46 (18.9%) | 197 (81.1%) |
| Security & Protection | 59 (56.7%) | 45 (43.3%) |
| Firefighting & Prevention | 22 (40.7%) | 32 (59.3%) |
| Law Enforcement | 37 (74.0%) | 13 (26.0%) |
| Food Preparation & Serving | 307 (52.9%) | 273 (47.1%) |
| Cleaning & Maintenance | 170 (54.5%) | 142 (45.5%) |
| Personal Care & Service | 64 (29.8%) | 151 (70.2%) |
| Total (Category) | 646 (44.4%) | 808 (55.6%) |
| Total (Overall) | 3,948 (45.6%) | 4,711 (54.4%) |
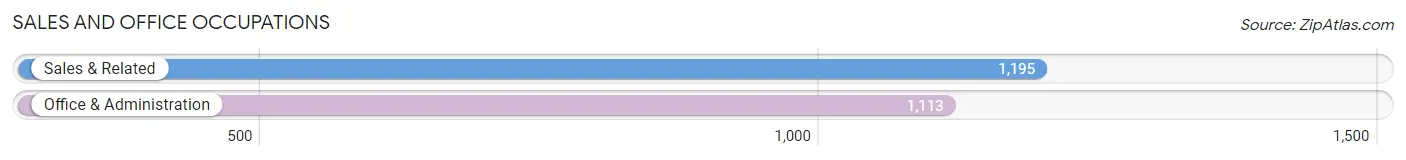
Sales and Office Occupations
The most common Sales and Office occupations in Ashland are Sales & Related (1,195 | 13.8%), and Office & Administration (1,113 | 12.9%).
Sales and Office Occupations by Sex

| Occupation | Male | Female |
| Sales & Related | 548 (45.9%) | 647 (54.1%) |
| Office & Administration | 192 (17.2%) | 921 (82.8%) |
| Total (Category) | 740 (32.1%) | 1,568 (67.9%) |
| Total (Overall) | 3,948 (45.6%) | 4,711 (54.4%) |
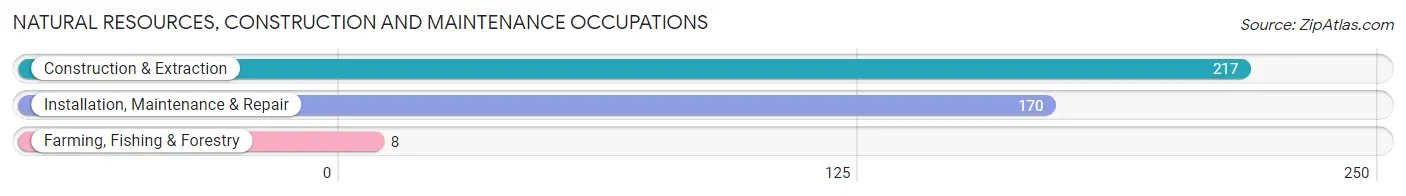
Natural Resources, Construction and Maintenance Occupations
The most common Natural Resources, Construction and Maintenance occupations in Ashland are Construction & Extraction (217 | 2.5%), Installation, Maintenance & Repair (170 | 2.0%), and Farming, Fishing & Forestry (8 | 0.1%).
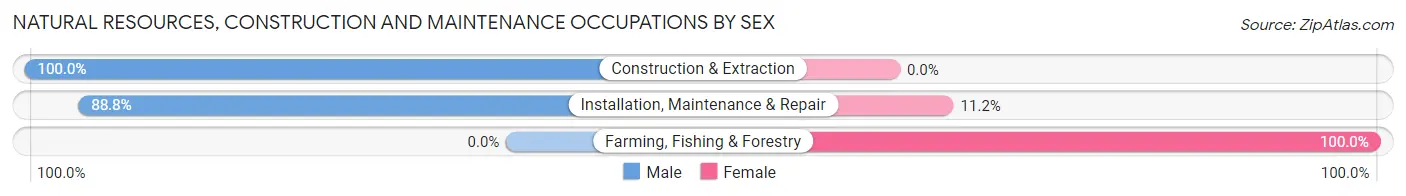
Natural Resources, Construction and Maintenance Occupations by Sex
| Occupation | Male | Female |
| Farming, Fishing & Forestry | 0 (0.0%) | 8 (100.0%) |
| Construction & Extraction | 217 (100.0%) | 0 (0.0%) |
| Installation, Maintenance & Repair | 151 (88.8%) | 19 (11.2%) |
| Total (Category) | 368 (93.2%) | 27 (6.8%) |
| Total (Overall) | 3,948 (45.6%) | 4,711 (54.4%) |
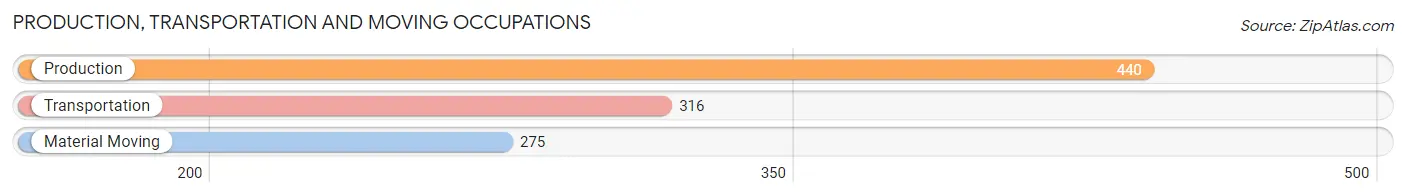
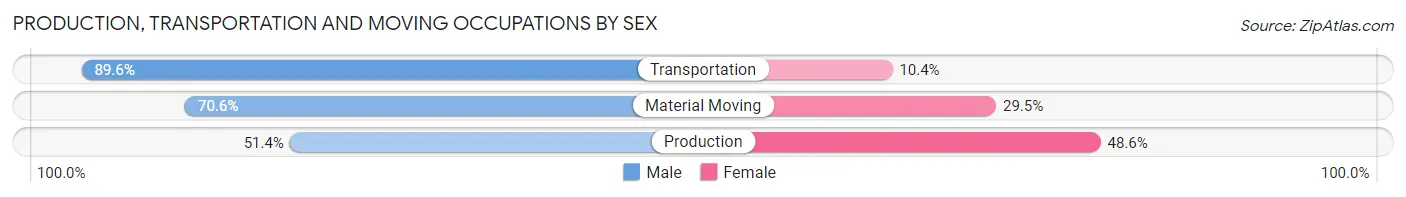
Production, Transportation and Moving Occupations
The most common Production, Transportation and Moving occupations in Ashland are Production (440 | 5.1%), Transportation (316 | 3.6%), and Material Moving (275 | 3.2%).
Production, Transportation and Moving Occupations by Sex
| Occupation | Male | Female |
| Production | 226 (51.4%) | 214 (48.6%) |
| Transportation | 283 (89.6%) | 33 (10.4%) |
| Material Moving | 194 (70.6%) | 81 (29.4%) |
| Total (Category) | 703 (68.2%) | 328 (31.8%) |
| Total (Overall) | 3,948 (45.6%) | 4,711 (54.4%) |
Employment Industries by Sex in Ashland
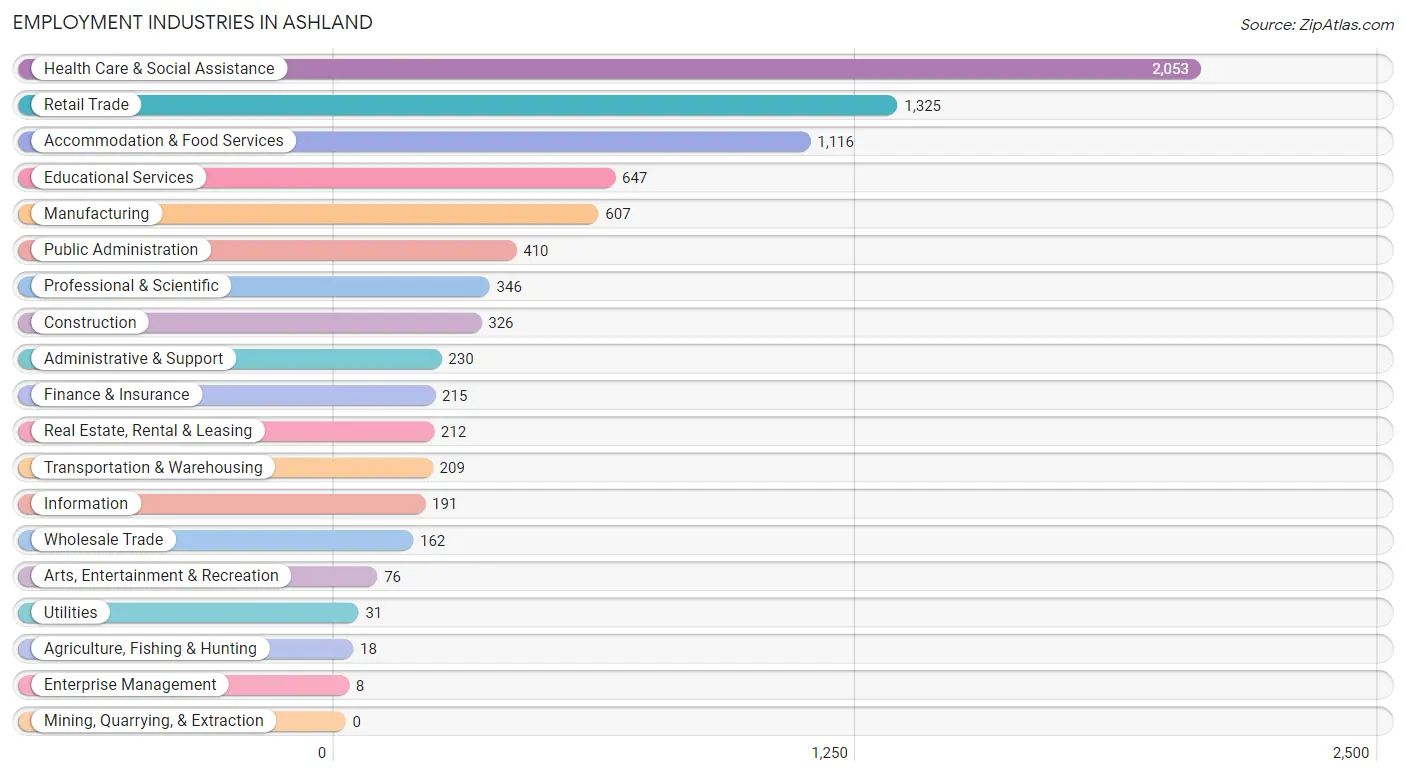
Employment Industries in Ashland
The major employment industries in Ashland include Health Care & Social Assistance (2,053 | 23.7%), Retail Trade (1,325 | 15.3%), Accommodation & Food Services (1,116 | 12.9%), Educational Services (647 | 7.5%), and Manufacturing (607 | 7.0%).
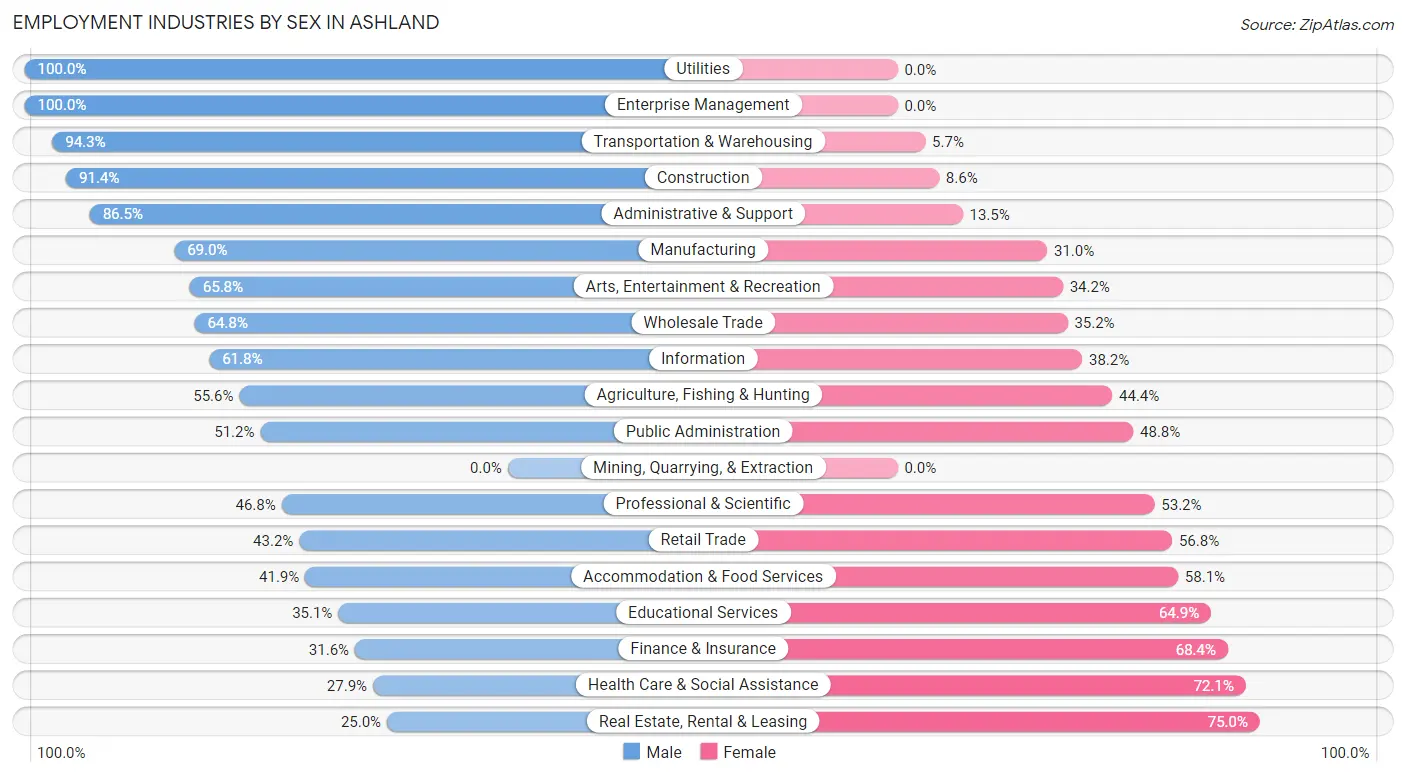
Employment Industries by Sex in Ashland
The Ashland industries that see more men than women are Utilities (100.0%), Enterprise Management (100.0%), and Transportation & Warehousing (94.3%), whereas the industries that tend to have a higher number of women are Real Estate, Rental & Leasing (75.0%), Health Care & Social Assistance (72.1%), and Finance & Insurance (68.4%).
| Industry | Male | Female |
| Agriculture, Fishing & Hunting | 10 (55.6%) | 8 (44.4%) |
| Mining, Quarrying, & Extraction | 0 (0.0%) | 0 (0.0%) |
| Construction | 298 (91.4%) | 28 (8.6%) |
| Manufacturing | 419 (69.0%) | 188 (31.0%) |
| Wholesale Trade | 105 (64.8%) | 57 (35.2%) |
| Retail Trade | 572 (43.2%) | 753 (56.8%) |
| Transportation & Warehousing | 197 (94.3%) | 12 (5.7%) |
| Utilities | 31 (100.0%) | 0 (0.0%) |
| Information | 118 (61.8%) | 73 (38.2%) |
| Finance & Insurance | 68 (31.6%) | 147 (68.4%) |
| Real Estate, Rental & Leasing | 53 (25.0%) | 159 (75.0%) |
| Professional & Scientific | 162 (46.8%) | 184 (53.2%) |
| Enterprise Management | 8 (100.0%) | 0 (0.0%) |
| Administrative & Support | 199 (86.5%) | 31 (13.5%) |
| Educational Services | 227 (35.1%) | 420 (64.9%) |
| Health Care & Social Assistance | 573 (27.9%) | 1,480 (72.1%) |
| Arts, Entertainment & Recreation | 50 (65.8%) | 26 (34.2%) |
| Accommodation & Food Services | 468 (41.9%) | 648 (58.1%) |
| Public Administration | 210 (51.2%) | 200 (48.8%) |
| Total | 3,948 (45.6%) | 4,711 (54.4%) |
Education in Ashland
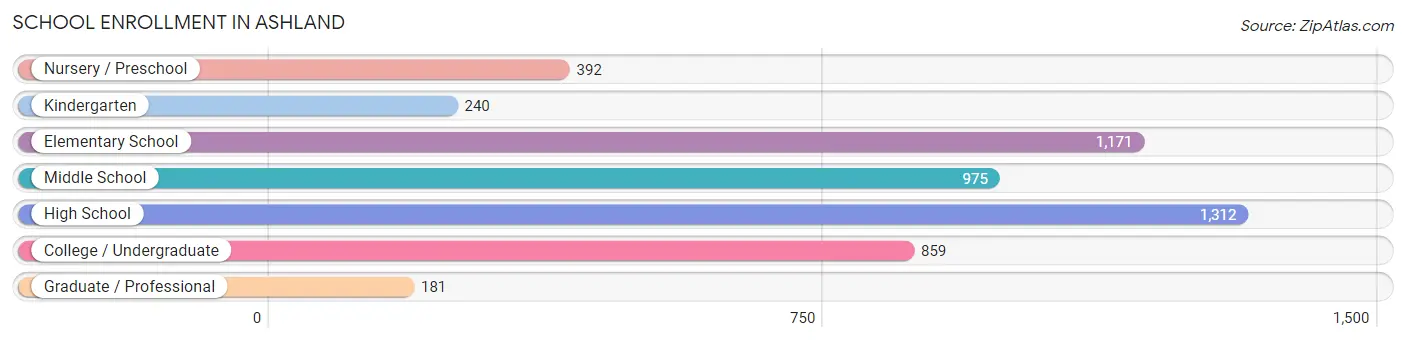
School Enrollment in Ashland
The most common levels of schooling among the 5,130 students in Ashland are high school (1,312 | 25.6%), elementary school (1,171 | 22.8%), and middle school (975 | 19.0%).
| School Level | # Students | % Students |
| Nursery / Preschool | 392 | 7.6% |
| Kindergarten | 240 | 4.7% |
| Elementary School | 1,171 | 22.8% |
| Middle School | 975 | 19.0% |
| High School | 1,312 | 25.6% |
| College / Undergraduate | 859 | 16.7% |
| Graduate / Professional | 181 | 3.5% |
| Total | 5,130 | 100.0% |
School Enrollment by Age by Funding Source in Ashland
Out of a total of 5,130 students who are enrolled in schools in Ashland, 528 (10.3%) attend a private institution, while the remaining 4,602 (89.7%) are enrolled in public schools. The age group of 25 to 34 year olds has the highest likelihood of being enrolled in private schools, with 84 (29.7% in the age bracket) enrolled. Conversely, the age group of 18 to 19 year olds has the lowest likelihood of being enrolled in a private school, with 284 (100.0% in the age bracket) attending a public institution.
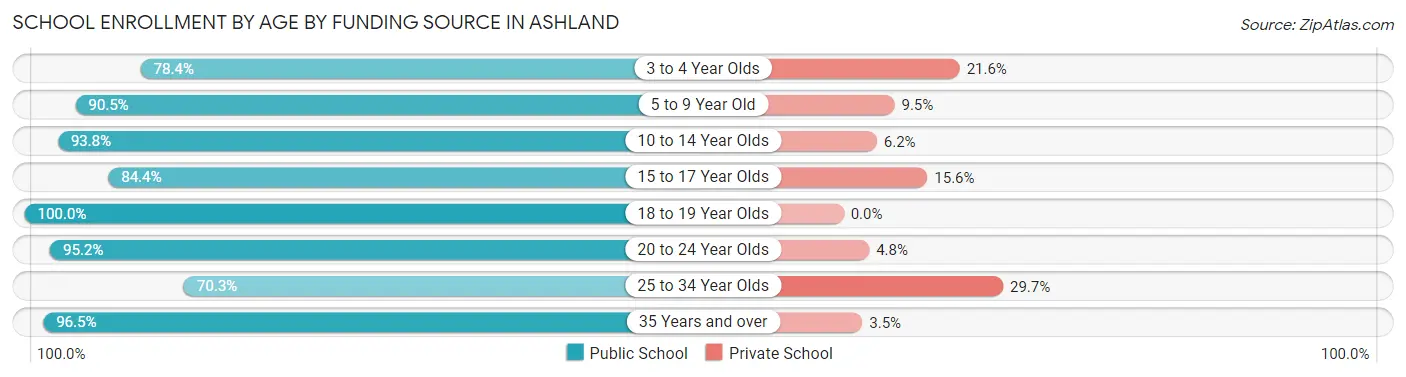
| Age Bracket | Public School | Private School |
| 3 to 4 Year Olds | 214 (78.4%) | 59 (21.6%) |
| 5 to 9 Year Old | 1,195 (90.5%) | 125 (9.5%) |
| 10 to 14 Year Olds | 1,275 (93.8%) | 84 (6.2%) |
| 15 to 17 Year Olds | 796 (84.4%) | 147 (15.6%) |
| 18 to 19 Year Olds | 284 (100.0%) | 0 (0.0%) |
| 20 to 24 Year Olds | 280 (95.2%) | 14 (4.8%) |
| 25 to 34 Year Olds | 199 (70.3%) | 84 (29.7%) |
| 35 Years and over | 361 (96.5%) | 13 (3.5%) |
| Total | 4,602 (89.7%) | 528 (10.3%) |
Educational Attainment by Field of Study in Ashland
Education (994 | 24.5%), business (530 | 13.0%), science & technology (505 | 12.4%), liberal arts & history (332 | 8.2%), and arts & humanities (286 | 7.0%) are the most common fields of study among 4,064 individuals in Ashland who have obtained a bachelor's degree or higher.
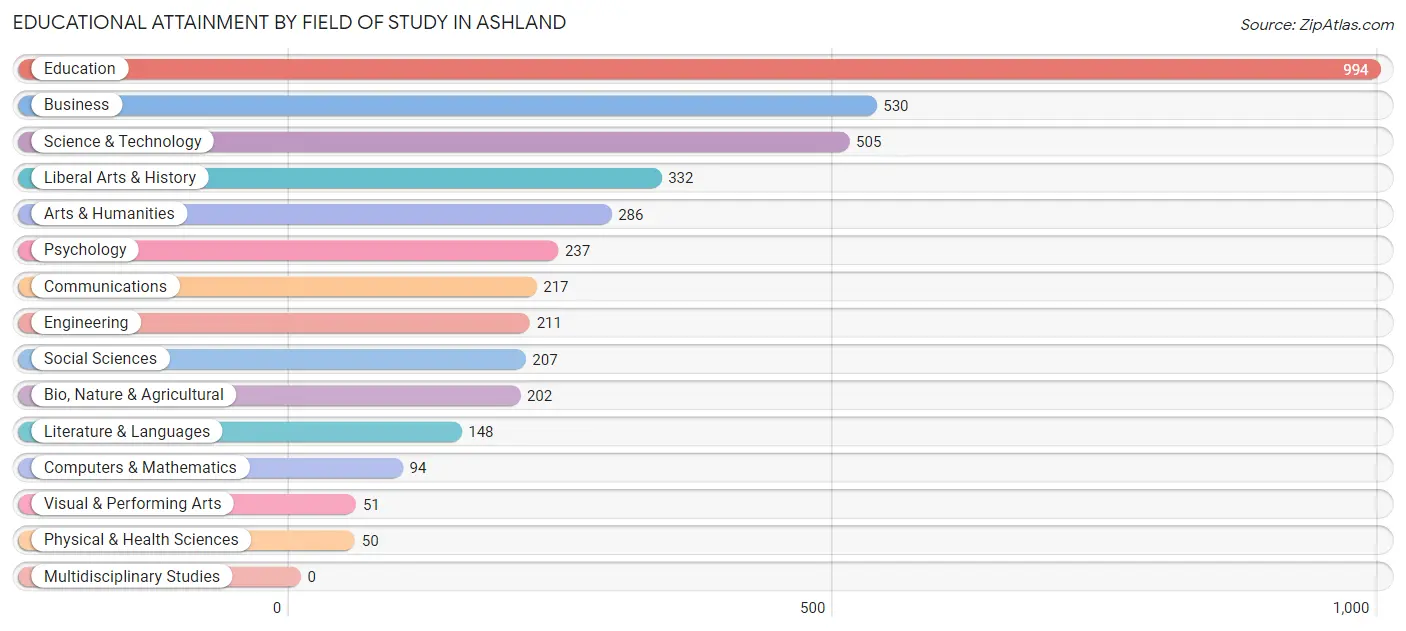
| Field of Study | # Graduates | % Graduates |
| Computers & Mathematics | 94 | 2.3% |
| Bio, Nature & Agricultural | 202 | 5.0% |
| Physical & Health Sciences | 50 | 1.2% |
| Psychology | 237 | 5.8% |
| Social Sciences | 207 | 5.1% |
| Engineering | 211 | 5.2% |
| Multidisciplinary Studies | 0 | 0.0% |
| Science & Technology | 505 | 12.4% |
| Business | 530 | 13.0% |
| Education | 994 | 24.5% |
| Literature & Languages | 148 | 3.6% |
| Liberal Arts & History | 332 | 8.2% |
| Visual & Performing Arts | 51 | 1.3% |
| Communications | 217 | 5.3% |
| Arts & Humanities | 286 | 7.0% |
| Total | 4,064 | 100.0% |
Transportation & Commute in Ashland
Vehicle Availability by Sex in Ashland
The most prevalent vehicle ownership categories in Ashland are males with 2 vehicles (1,746, accounting for 44.9%) and females with 2 vehicles (1,983, making up 38.0%).
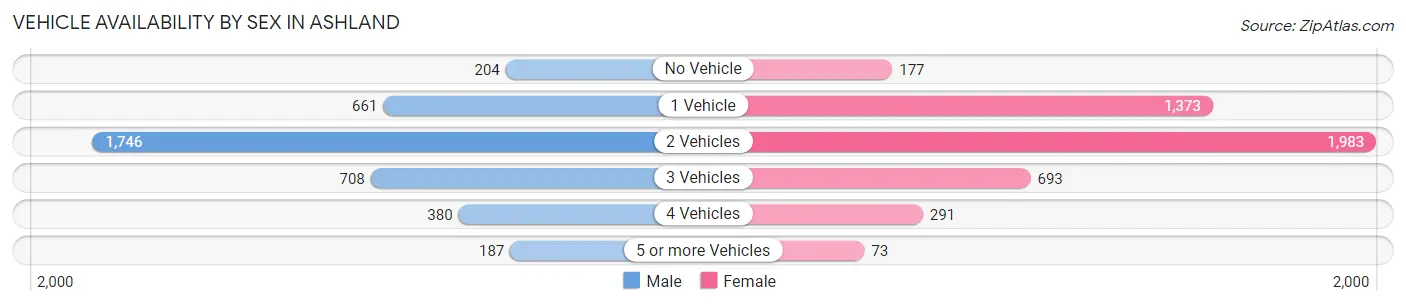
| Vehicles Available | Male | Female |
| No Vehicle | 204 (5.2%) | 177 (3.9%) |
| 1 Vehicle | 661 (17.0%) | 1,373 (29.9%) |
| 2 Vehicles | 1,746 (44.9%) | 1,983 (43.2%) |
| 3 Vehicles | 708 (18.2%) | 693 (15.1%) |
| 4 Vehicles | 380 (9.8%) | 291 (6.3%) |
| 5 or more Vehicles | 187 (4.8%) | 73 (1.6%) |
| Total | 3,886 (100.0%) | 4,590 (100.0%) |
Commute Time in Ashland
The most frequently occuring commute durations in Ashland are 10 to 14 minutes (1,755 commuters, 22.0%), 15 to 19 minutes (1,543 commuters, 19.3%), and 5 to 9 minutes (1,491 commuters, 18.7%).
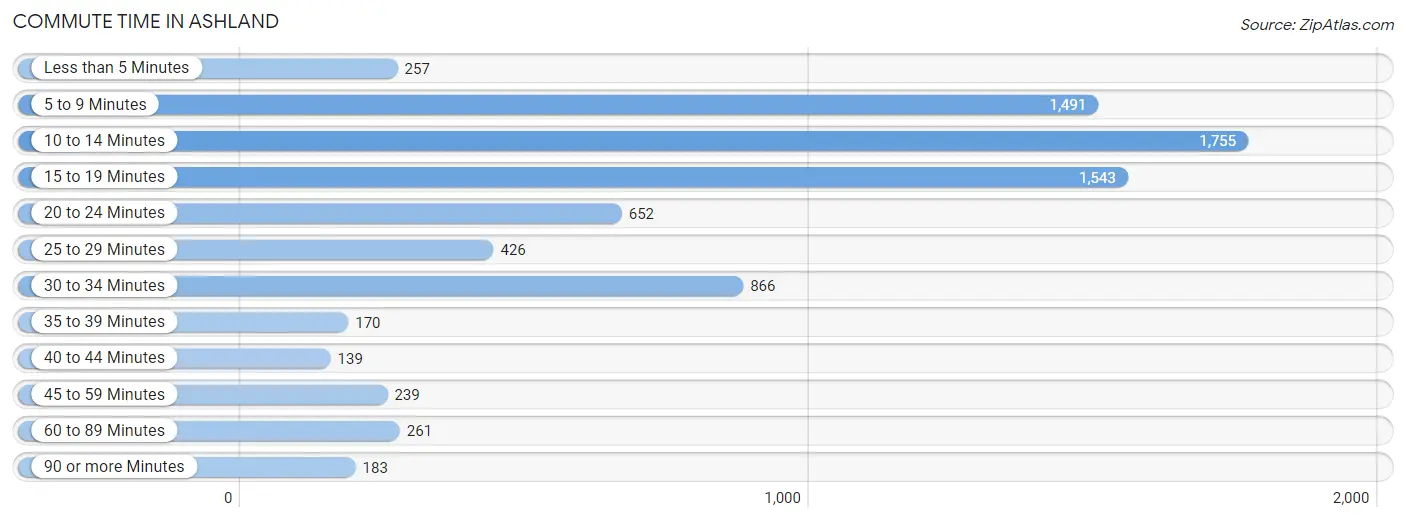
| Commute Time | # Commuters | % Commuters |
| Less than 5 Minutes | 257 | 3.2% |
| 5 to 9 Minutes | 1,491 | 18.7% |
| 10 to 14 Minutes | 1,755 | 22.0% |
| 15 to 19 Minutes | 1,543 | 19.3% |
| 20 to 24 Minutes | 652 | 8.2% |
| 25 to 29 Minutes | 426 | 5.3% |
| 30 to 34 Minutes | 866 | 10.8% |
| 35 to 39 Minutes | 170 | 2.1% |
| 40 to 44 Minutes | 139 | 1.7% |
| 45 to 59 Minutes | 239 | 3.0% |
| 60 to 89 Minutes | 261 | 3.3% |
| 90 or more Minutes | 183 | 2.3% |
Commute Time by Sex in Ashland
The most common commute times in Ashland are 10 to 14 minutes (739 commuters, 20.0%) for males and 10 to 14 minutes (1,016 commuters, 23.7%) for females.
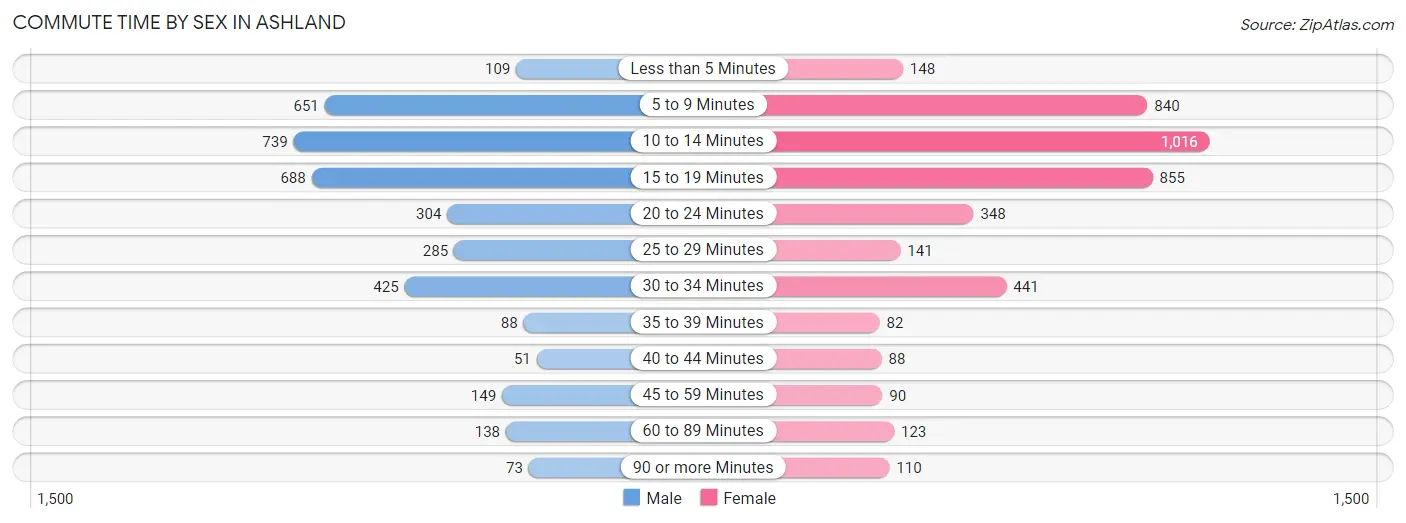
| Commute Time | Male | Female |
| Less than 5 Minutes | 109 (2.9%) | 148 (3.5%) |
| 5 to 9 Minutes | 651 (17.6%) | 840 (19.6%) |
| 10 to 14 Minutes | 739 (20.0%) | 1,016 (23.7%) |
| 15 to 19 Minutes | 688 (18.6%) | 855 (20.0%) |
| 20 to 24 Minutes | 304 (8.2%) | 348 (8.1%) |
| 25 to 29 Minutes | 285 (7.7%) | 141 (3.3%) |
| 30 to 34 Minutes | 425 (11.5%) | 441 (10.3%) |
| 35 to 39 Minutes | 88 (2.4%) | 82 (1.9%) |
| 40 to 44 Minutes | 51 (1.4%) | 88 (2.1%) |
| 45 to 59 Minutes | 149 (4.0%) | 90 (2.1%) |
| 60 to 89 Minutes | 138 (3.7%) | 123 (2.9%) |
| 90 or more Minutes | 73 (2.0%) | 110 (2.6%) |
Time of Departure to Work by Sex in Ashland
The most frequent times of departure to work in Ashland are 6:30 AM to 6:59 AM (485, 13.1%) for males and 7:30 AM to 7:59 AM (725, 16.9%) for females.
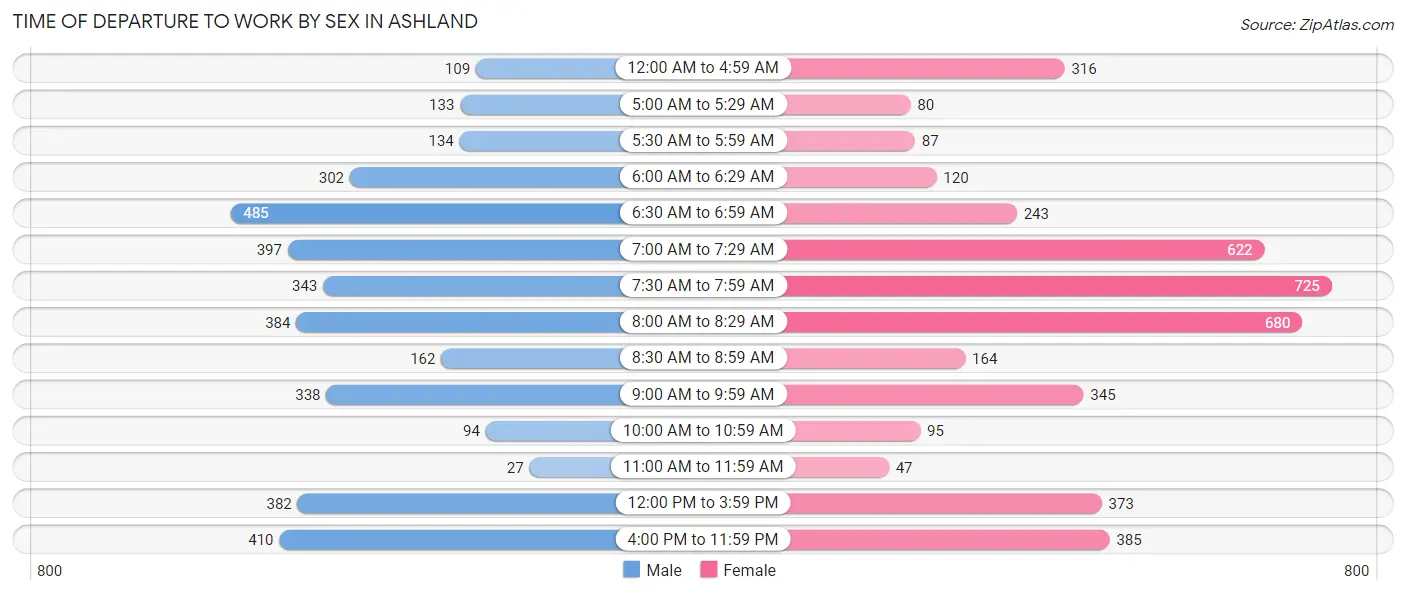
| Time of Departure | Male | Female |
| 12:00 AM to 4:59 AM | 109 (2.9%) | 316 (7.4%) |
| 5:00 AM to 5:29 AM | 133 (3.6%) | 80 (1.9%) |
| 5:30 AM to 5:59 AM | 134 (3.6%) | 87 (2.0%) |
| 6:00 AM to 6:29 AM | 302 (8.2%) | 120 (2.8%) |
| 6:30 AM to 6:59 AM | 485 (13.1%) | 243 (5.7%) |
| 7:00 AM to 7:29 AM | 397 (10.7%) | 622 (14.5%) |
| 7:30 AM to 7:59 AM | 343 (9.3%) | 725 (16.9%) |
| 8:00 AM to 8:29 AM | 384 (10.4%) | 680 (15.9%) |
| 8:30 AM to 8:59 AM | 162 (4.4%) | 164 (3.8%) |
| 9:00 AM to 9:59 AM | 338 (9.1%) | 345 (8.1%) |
| 10:00 AM to 10:59 AM | 94 (2.5%) | 95 (2.2%) |
| 11:00 AM to 11:59 AM | 27 (0.7%) | 47 (1.1%) |
| 12:00 PM to 3:59 PM | 382 (10.3%) | 373 (8.7%) |
| 4:00 PM to 11:59 PM | 410 (11.1%) | 385 (9.0%) |
| Total | 3,700 (100.0%) | 4,282 (100.0%) |
Housing Occupancy in Ashland
Occupancy by Ownership in Ashland
Of the total 8,903 dwellings in Ashland, owner-occupied units account for 5,279 (59.3%), while renter-occupied units make up 3,624 (40.7%).
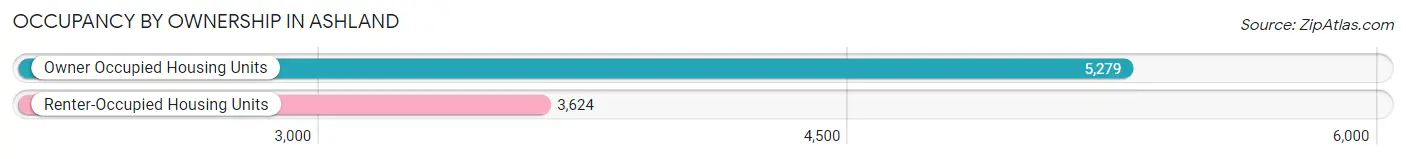
| Occupancy | # Housing Units | % Housing Units |
| Owner Occupied Housing Units | 5,279 | 59.3% |
| Renter-Occupied Housing Units | 3,624 | 40.7% |
| Total Occupied Housing Units | 8,903 | 100.0% |
Occupancy by Household Size in Ashland
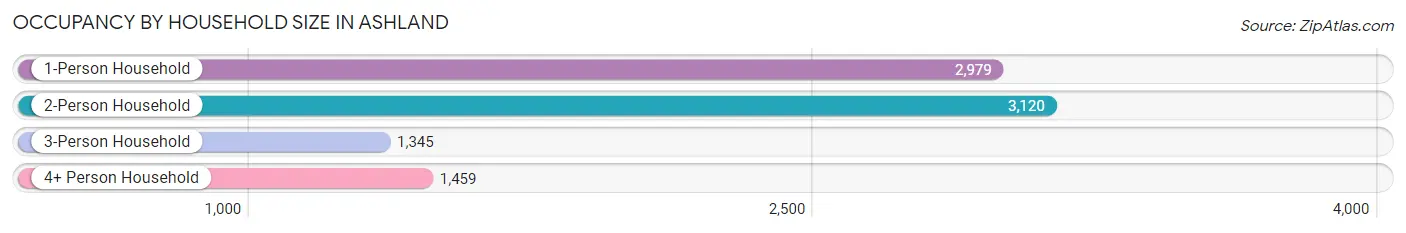
| Household Size | # Housing Units | % Housing Units |
| 1-Person Household | 2,979 | 33.5% |
| 2-Person Household | 3,120 | 35.0% |
| 3-Person Household | 1,345 | 15.1% |
| 4+ Person Household | 1,459 | 16.4% |
| Total Housing Units | 8,903 | 100.0% |
Occupancy by Ownership by Household Size in Ashland
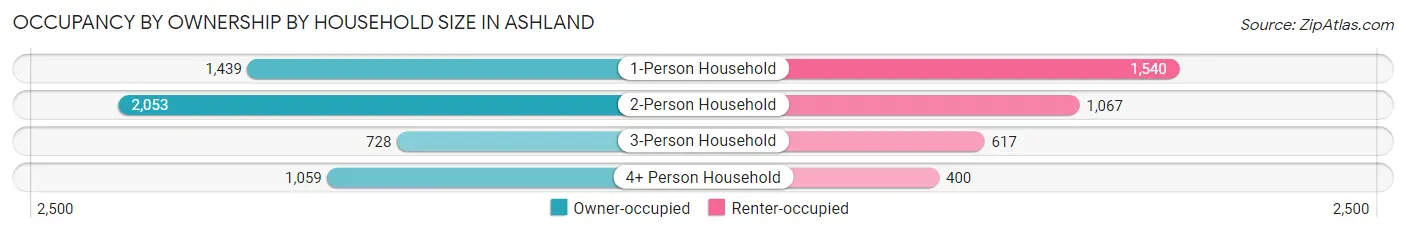
| Household Size | Owner-occupied | Renter-occupied |
| 1-Person Household | 1,439 (48.3%) | 1,540 (51.7%) |
| 2-Person Household | 2,053 (65.8%) | 1,067 (34.2%) |
| 3-Person Household | 728 (54.1%) | 617 (45.9%) |
| 4+ Person Household | 1,059 (72.6%) | 400 (27.4%) |
| Total Housing Units | 5,279 (59.3%) | 3,624 (40.7%) |
Occupancy by Educational Attainment in Ashland
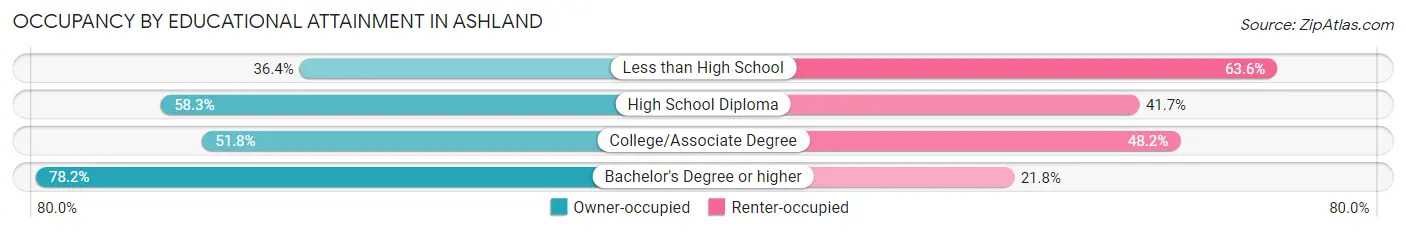
| Household Size | Owner-occupied | Renter-occupied |
| Less than High School | 305 (36.4%) | 533 (63.6%) |
| High School Diploma | 1,304 (58.3%) | 932 (41.7%) |
| College/Associate Degree | 1,742 (51.8%) | 1,621 (48.2%) |
| Bachelor's Degree or higher | 1,928 (78.2%) | 538 (21.8%) |
Occupancy by Age of Householder in Ashland
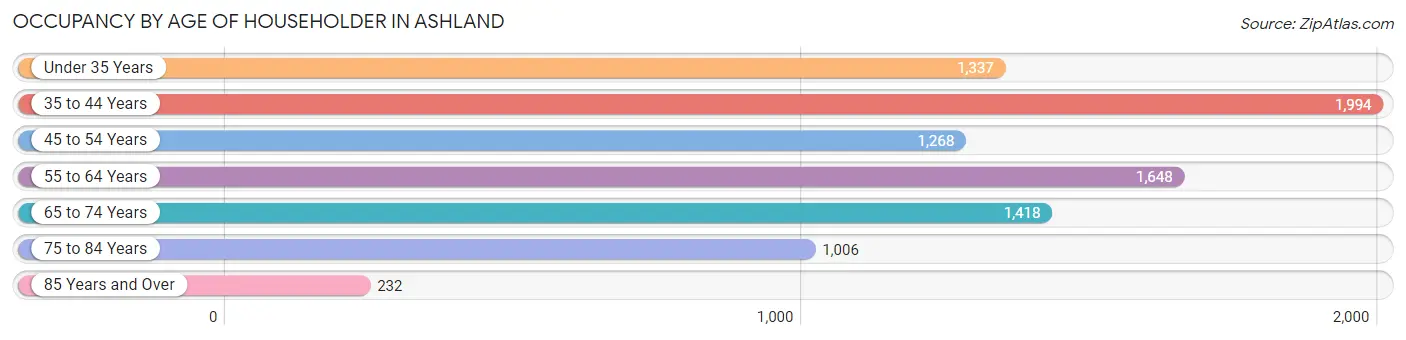
| Age Bracket | # Households | % Households |
| Under 35 Years | 1,337 | 15.0% |
| 35 to 44 Years | 1,994 | 22.4% |
| 45 to 54 Years | 1,268 | 14.2% |
| 55 to 64 Years | 1,648 | 18.5% |
| 65 to 74 Years | 1,418 | 15.9% |
| 75 to 84 Years | 1,006 | 11.3% |
| 85 Years and Over | 232 | 2.6% |
| Total | 8,903 | 100.0% |
Housing Finances in Ashland
Median Income by Occupancy in Ashland
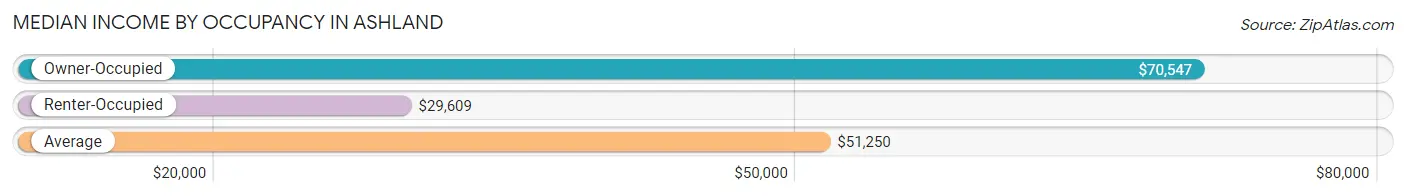
| Occupancy Type | # Households | Median Income |
| Owner-Occupied | 5,279 (59.3%) | $70,547 |
| Renter-Occupied | 3,624 (40.7%) | $29,609 |
| Average | 8,903 (100.0%) | $51,250 |
Occupancy by Householder Income Bracket in Ashland
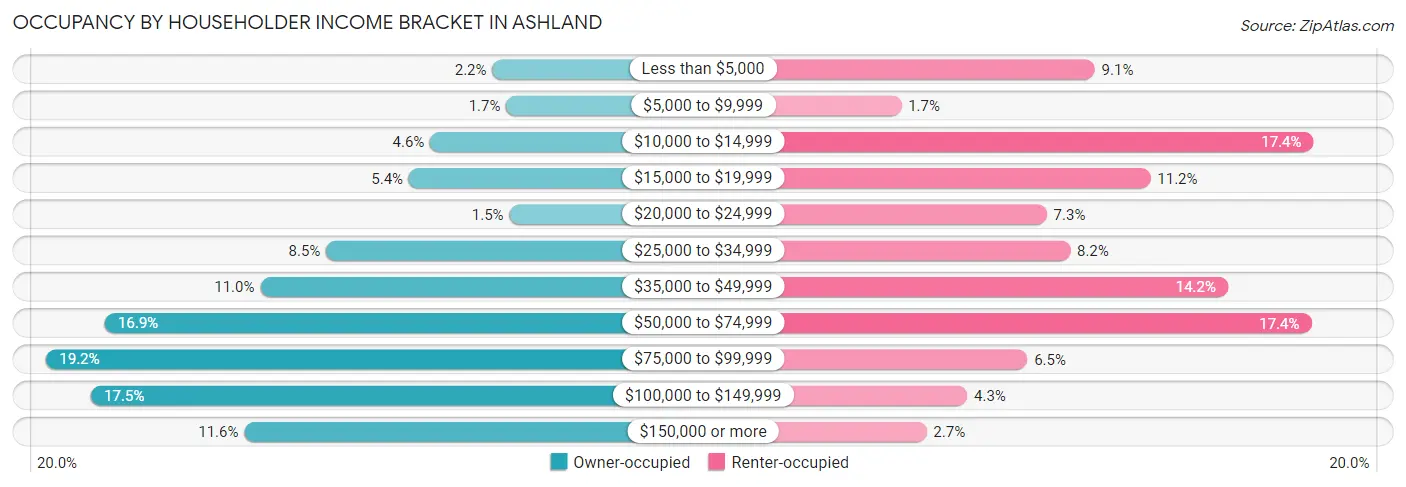
| Income Bracket | Owner-occupied | Renter-occupied |
| Less than $5,000 | 115 (2.2%) | 330 (9.1%) |
| $5,000 to $9,999 | 87 (1.7%) | 63 (1.7%) |
| $10,000 to $14,999 | 240 (4.5%) | 632 (17.4%) |
| $15,000 to $19,999 | 283 (5.4%) | 407 (11.2%) |
| $20,000 to $24,999 | 81 (1.5%) | 264 (7.3%) |
| $25,000 to $34,999 | 449 (8.5%) | 296 (8.2%) |
| $35,000 to $49,999 | 582 (11.0%) | 514 (14.2%) |
| $50,000 to $74,999 | 894 (16.9%) | 629 (17.4%) |
| $75,000 to $99,999 | 1,012 (19.2%) | 237 (6.5%) |
| $100,000 to $149,999 | 922 (17.5%) | 154 (4.3%) |
| $150,000 or more | 614 (11.6%) | 98 (2.7%) |
| Total | 5,279 (100.0%) | 3,624 (100.0%) |
Monthly Housing Cost Tiers in Ashland
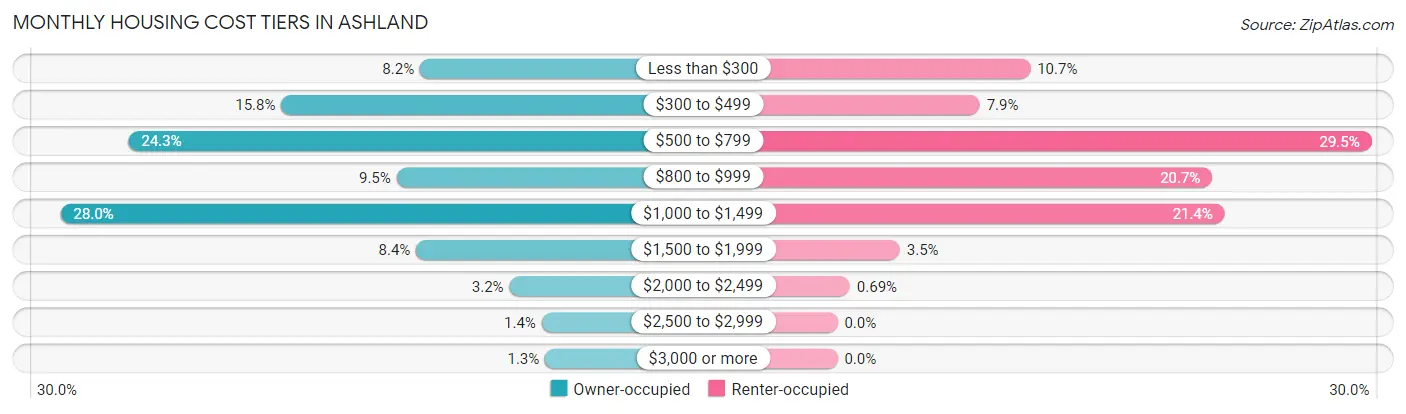
| Monthly Cost | Owner-occupied | Renter-occupied |
| Less than $300 | 431 (8.2%) | 386 (10.6%) |
| $300 to $499 | 835 (15.8%) | 285 (7.9%) |
| $500 to $799 | 1,281 (24.3%) | 1,069 (29.5%) |
| $800 to $999 | 499 (9.5%) | 750 (20.7%) |
| $1,000 to $1,499 | 1,479 (28.0%) | 775 (21.4%) |
| $1,500 to $1,999 | 442 (8.4%) | 125 (3.5%) |
| $2,000 to $2,499 | 170 (3.2%) | 25 (0.7%) |
| $2,500 to $2,999 | 76 (1.4%) | 0 (0.0%) |
| $3,000 or more | 66 (1.3%) | 0 (0.0%) |
| Total | 5,279 (100.0%) | 3,624 (100.0%) |
Physical Housing Characteristics in Ashland
Housing Structures in Ashland
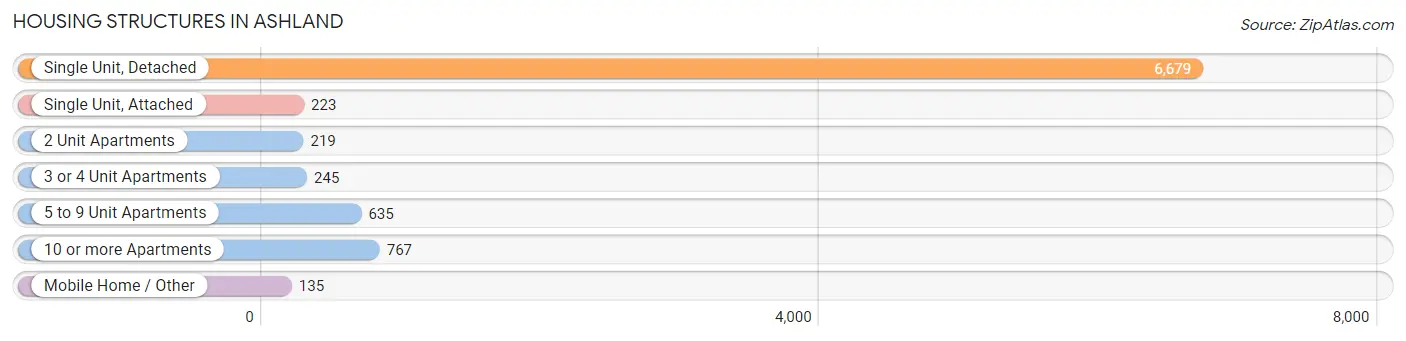
| Structure Type | # Housing Units | % Housing Units |
| Single Unit, Detached | 6,679 | 75.0% |
| Single Unit, Attached | 223 | 2.5% |
| 2 Unit Apartments | 219 | 2.5% |
| 3 or 4 Unit Apartments | 245 | 2.8% |
| 5 to 9 Unit Apartments | 635 | 7.1% |
| 10 or more Apartments | 767 | 8.6% |
| Mobile Home / Other | 135 | 1.5% |
| Total | 8,903 | 100.0% |
Housing Structures by Occupancy in Ashland
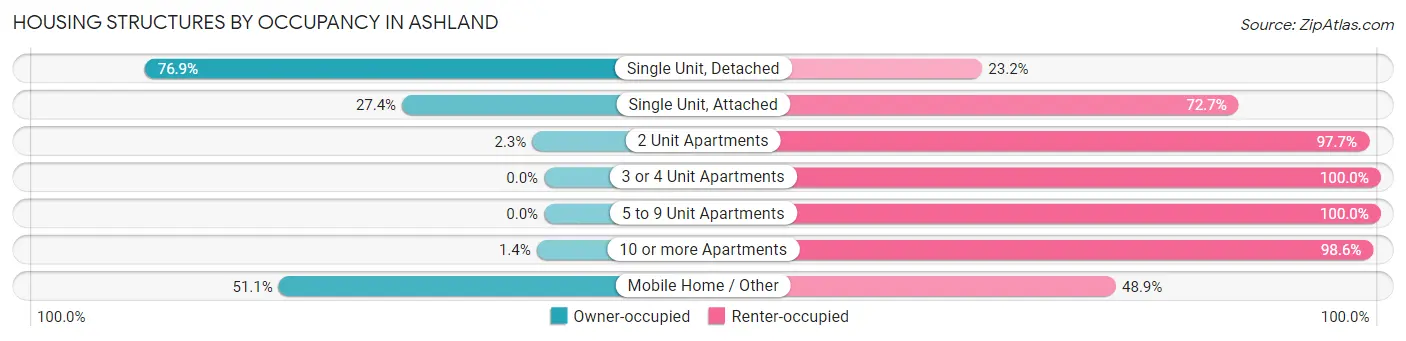
| Structure Type | Owner-occupied | Renter-occupied |
| Single Unit, Detached | 5,133 (76.8%) | 1,546 (23.2%) |
| Single Unit, Attached | 61 (27.4%) | 162 (72.7%) |
| 2 Unit Apartments | 5 (2.3%) | 214 (97.7%) |
| 3 or 4 Unit Apartments | 0 (0.0%) | 245 (100.0%) |
| 5 to 9 Unit Apartments | 0 (0.0%) | 635 (100.0%) |
| 10 or more Apartments | 11 (1.4%) | 756 (98.6%) |
| Mobile Home / Other | 69 (51.1%) | 66 (48.9%) |
| Total | 5,279 (59.3%) | 3,624 (40.7%) |
Housing Structures by Number of Rooms in Ashland
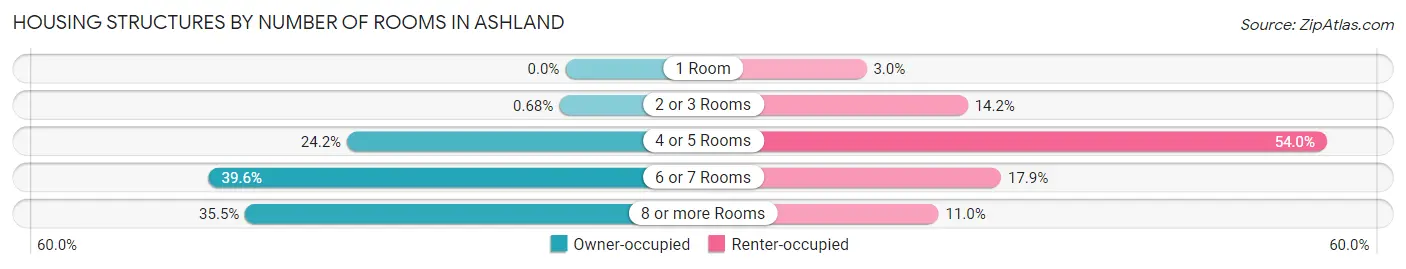
| Number of Rooms | Owner-occupied | Renter-occupied |
| 1 Room | 0 (0.0%) | 107 (2.9%) |
| 2 or 3 Rooms | 36 (0.7%) | 514 (14.2%) |
| 4 or 5 Rooms | 1,279 (24.2%) | 1,958 (54.0%) |
| 6 or 7 Rooms | 2,089 (39.6%) | 648 (17.9%) |
| 8 or more Rooms | 1,875 (35.5%) | 397 (11.0%) |
| Total | 5,279 (100.0%) | 3,624 (100.0%) |
Housing Structure by Heating Type in Ashland
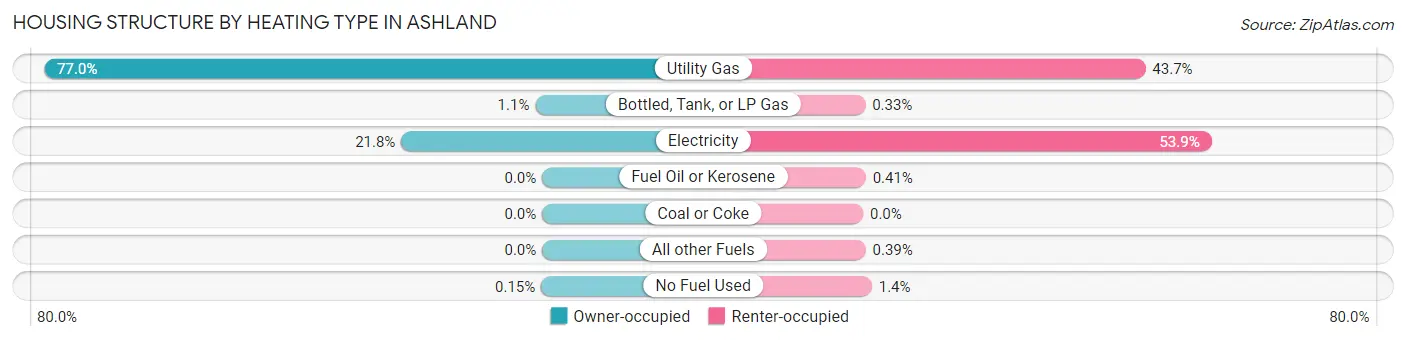
| Heating Type | Owner-occupied | Renter-occupied |
| Utility Gas | 4,065 (77.0%) | 1,582 (43.6%) |
| Bottled, Tank, or LP Gas | 56 (1.1%) | 12 (0.3%) |
| Electricity | 1,150 (21.8%) | 1,952 (53.9%) |
| Fuel Oil or Kerosene | 0 (0.0%) | 15 (0.4%) |
| Coal or Coke | 0 (0.0%) | 0 (0.0%) |
| All other Fuels | 0 (0.0%) | 14 (0.4%) |
| No Fuel Used | 8 (0.2%) | 49 (1.3%) |
| Total | 5,279 (100.0%) | 3,624 (100.0%) |
Household Vehicle Usage in Ashland
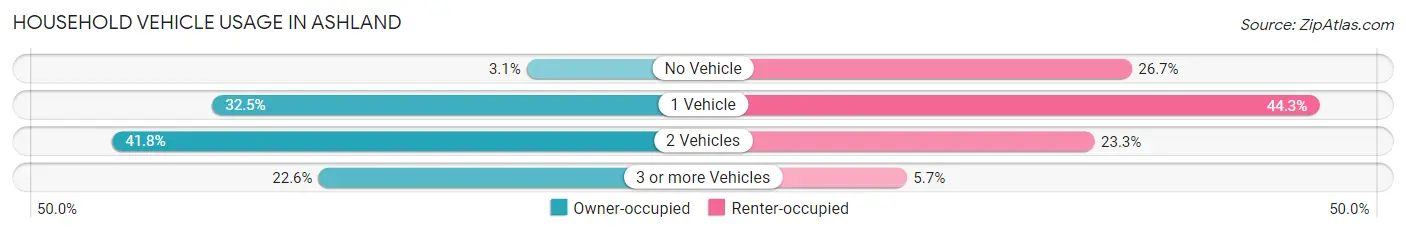
| Vehicles per Household | Owner-occupied | Renter-occupied |
| No Vehicle | 166 (3.1%) | 969 (26.7%) |
| 1 Vehicle | 1,714 (32.5%) | 1,604 (44.3%) |
| 2 Vehicles | 2,207 (41.8%) | 843 (23.3%) |
| 3 or more Vehicles | 1,192 (22.6%) | 208 (5.7%) |
| Total | 5,279 (100.0%) | 3,624 (100.0%) |
Real Estate & Mortgages in Ashland
Real Estate and Mortgage Overview in Ashland
| Characteristic | Without Mortgage | With Mortgage |
| Housing Units | 2,054 | 3,225 |
| Median Property Value | $100,100 | $133,900 |
| Median Household Income | $51,509 | $404 |
| Monthly Housing Costs | $454 | $66 |
| Real Estate Taxes | $992 | $128 |
Property Value by Mortgage Status in Ashland
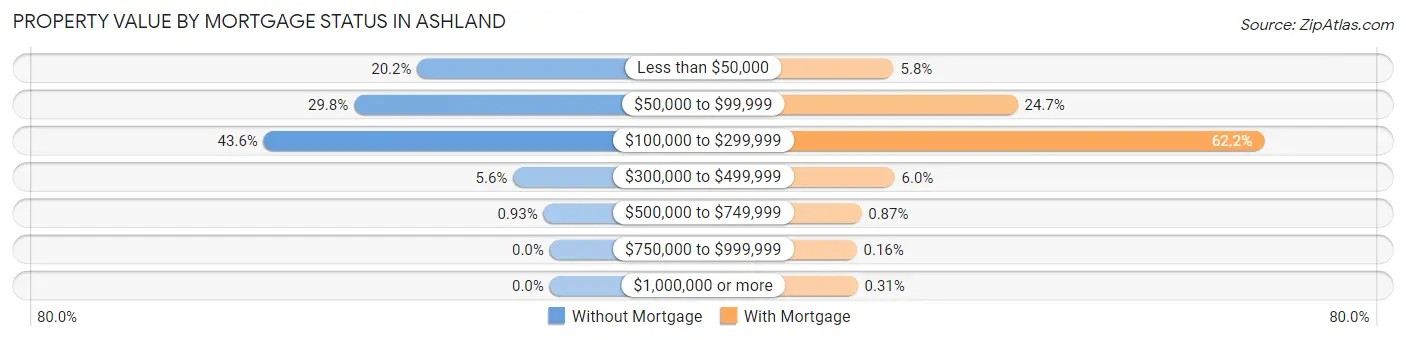
| Property Value | Without Mortgage | With Mortgage |
| Less than $50,000 | 414 (20.2%) | 187 (5.8%) |
| $50,000 to $99,999 | 612 (29.8%) | 796 (24.7%) |
| $100,000 to $299,999 | 895 (43.6%) | 2,007 (62.2%) |
| $300,000 to $499,999 | 114 (5.6%) | 192 (5.9%) |
| $500,000 to $749,999 | 19 (0.9%) | 28 (0.9%) |
| $750,000 to $999,999 | 0 (0.0%) | 5 (0.2%) |
| $1,000,000 or more | 0 (0.0%) | 10 (0.3%) |
| Total | 2,054 (100.0%) | 3,225 (100.0%) |
Household Income by Mortgage Status in Ashland
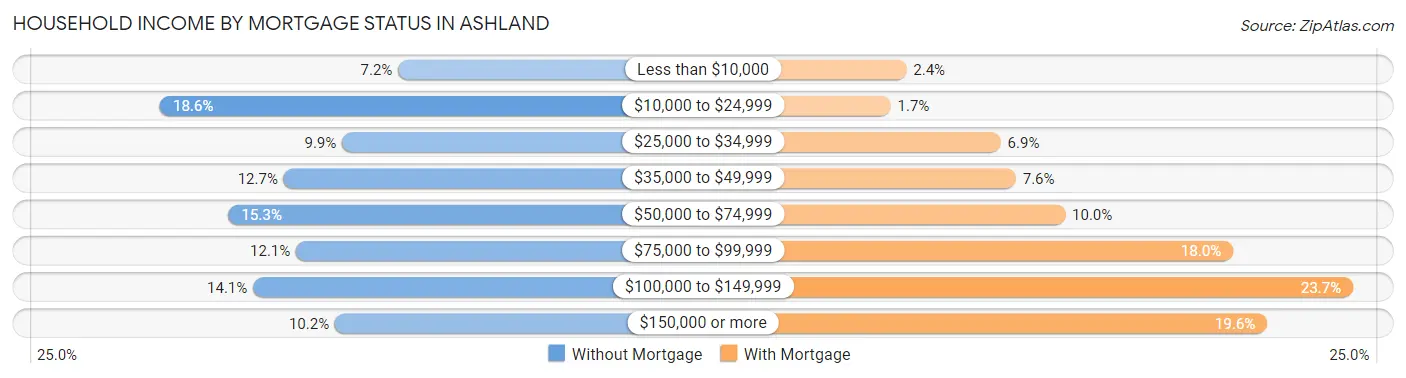
| Household Income | Without Mortgage | With Mortgage |
| Less than $10,000 | 148 (7.2%) | 78 (2.4%) |
| $10,000 to $24,999 | 381 (18.5%) | 54 (1.7%) |
| $25,000 to $34,999 | 203 (9.9%) | 223 (6.9%) |
| $35,000 to $49,999 | 260 (12.7%) | 246 (7.6%) |
| $50,000 to $74,999 | 314 (15.3%) | 322 (10.0%) |
| $75,000 to $99,999 | 248 (12.1%) | 580 (18.0%) |
| $100,000 to $149,999 | 290 (14.1%) | 764 (23.7%) |
| $150,000 or more | 210 (10.2%) | 632 (19.6%) |
| Total | 2,054 (100.0%) | 3,225 (100.0%) |
Property Value to Household Income Ratio in Ashland
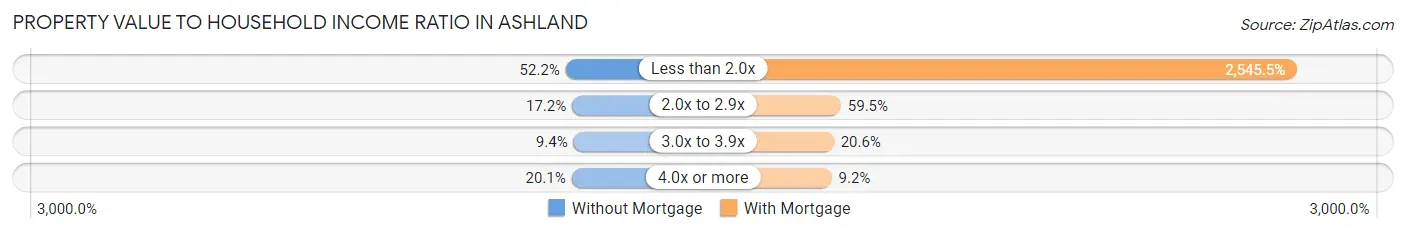
| Value-to-Income Ratio | Without Mortgage | With Mortgage |
| Less than 2.0x | 1,072 (52.2%) | 82,092 (2,545.5%) |
| 2.0x to 2.9x | 354 (17.2%) | 1,919 (59.5%) |
| 3.0x to 3.9x | 194 (9.4%) | 665 (20.6%) |
| 4.0x or more | 413 (20.1%) | 298 (9.2%) |
| Total | 2,054 (100.0%) | 3,225 (100.0%) |
Real Estate Taxes by Mortgage Status in Ashland
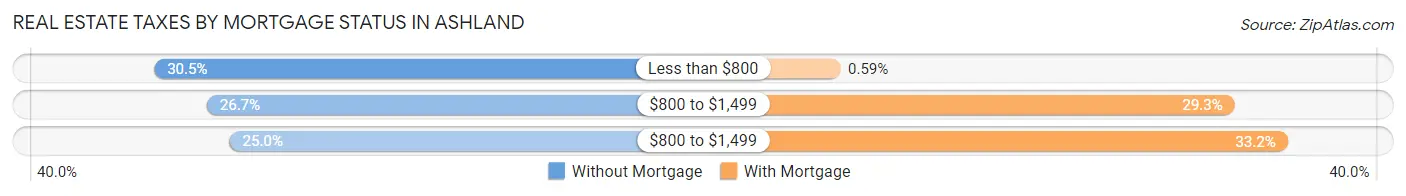
| Property Taxes | Without Mortgage | With Mortgage |
| Less than $800 | 627 (30.5%) | 19 (0.6%) |
| $800 to $1,499 | 548 (26.7%) | 946 (29.3%) |
| $800 to $1,499 | 514 (25.0%) | 1,071 (33.2%) |
| Total | 2,054 (100.0%) | 3,225 (100.0%) |
Health & Disability in Ashland
Health Insurance Coverage by Age in Ashland
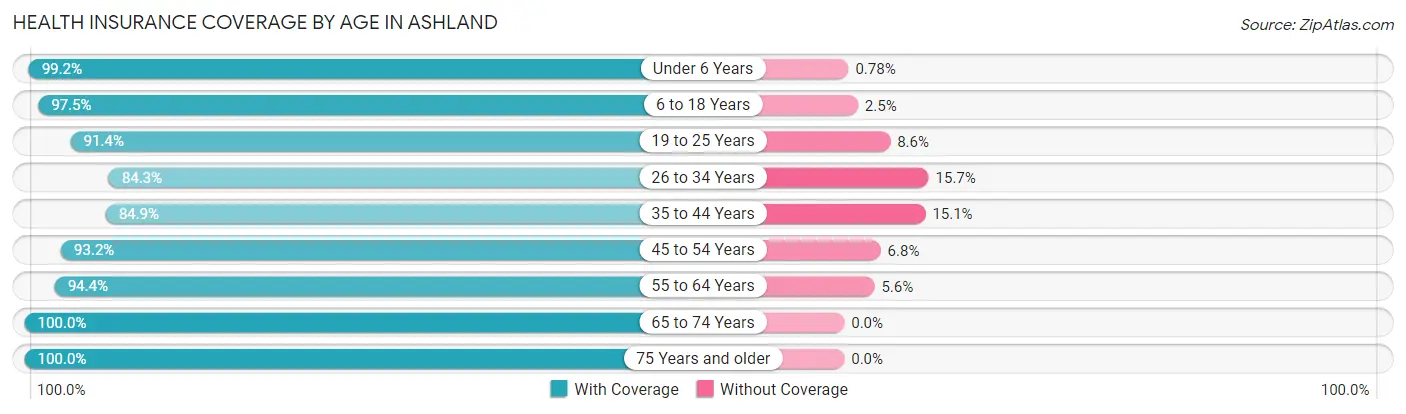
| Age Bracket | With Coverage | Without Coverage |
| Under 6 Years | 1,517 (99.2%) | 12 (0.8%) |
| 6 to 18 Years | 3,646 (97.5%) | 95 (2.5%) |
| 19 to 25 Years | 1,355 (91.4%) | 127 (8.6%) |
| 26 to 34 Years | 1,951 (84.3%) | 364 (15.7%) |
| 35 to 44 Years | 2,648 (84.9%) | 472 (15.1%) |
| 45 to 54 Years | 2,255 (93.2%) | 164 (6.8%) |
| 55 to 64 Years | 2,566 (94.4%) | 153 (5.6%) |
| 65 to 74 Years | 2,384 (100.0%) | 0 (0.0%) |
| 75 Years and older | 1,674 (100.0%) | 0 (0.0%) |
| Total | 19,996 (93.5%) | 1,387 (6.5%) |
Health Insurance Coverage by Citizenship Status in Ashland
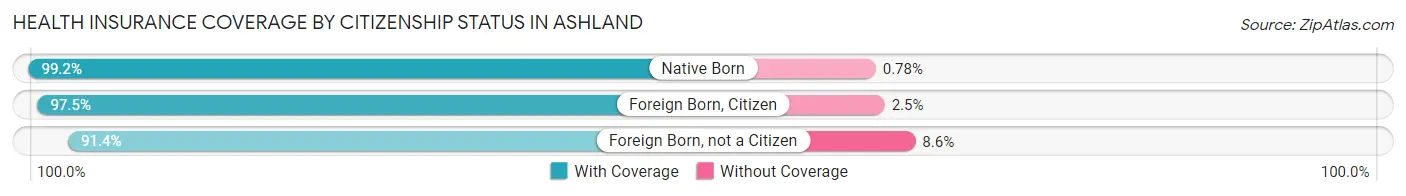
| Citizenship Status | With Coverage | Without Coverage |
| Native Born | 1,517 (99.2%) | 12 (0.8%) |
| Foreign Born, Citizen | 3,646 (97.5%) | 95 (2.5%) |
| Foreign Born, not a Citizen | 1,355 (91.4%) | 127 (8.6%) |
Health Insurance Coverage by Household Income in Ashland
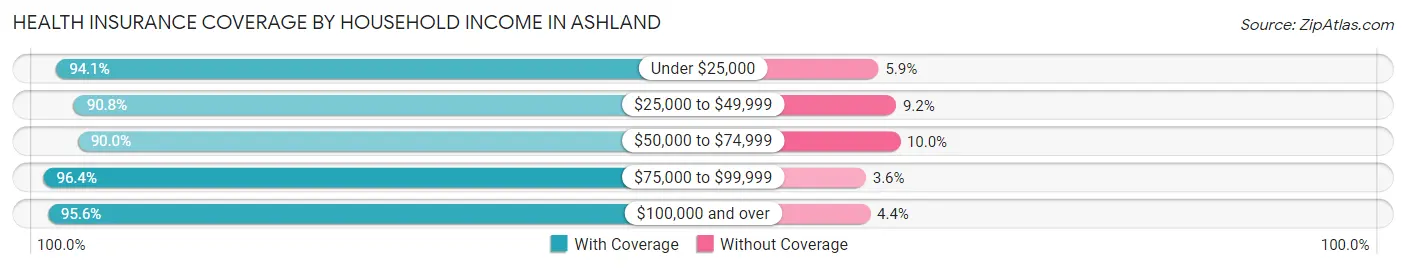
| Household Income | With Coverage | Without Coverage |
| Under $25,000 | 4,272 (94.1%) | 270 (5.9%) |
| $25,000 to $49,999 | 3,593 (90.8%) | 365 (9.2%) |
| $50,000 to $74,999 | 3,435 (90.0%) | 380 (10.0%) |
| $75,000 to $99,999 | 2,899 (96.4%) | 107 (3.6%) |
| $100,000 and over | 5,717 (95.6%) | 261 (4.4%) |
Public vs Private Health Insurance Coverage by Age in Ashland
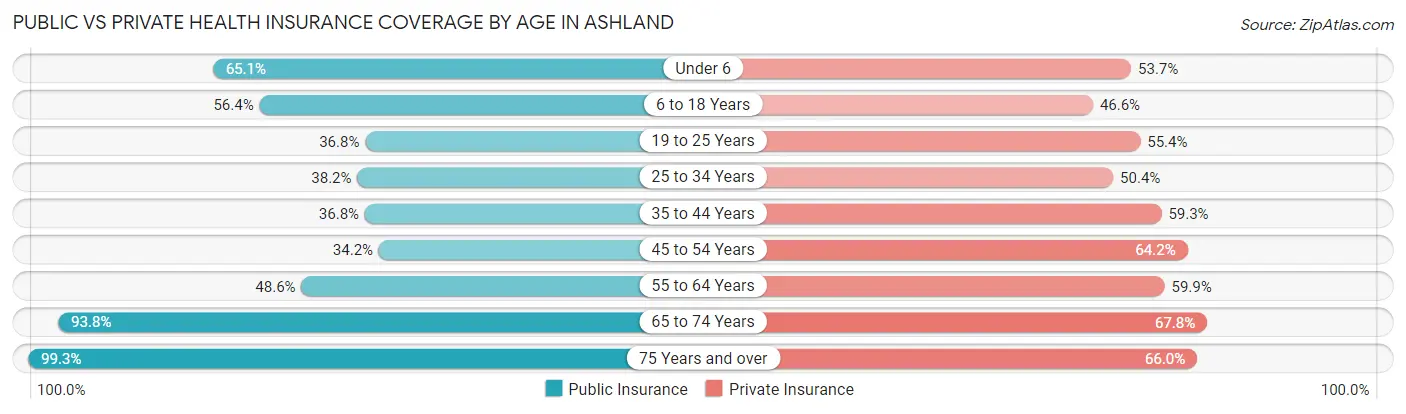
| Age Bracket | Public Insurance | Private Insurance |
| Under 6 | 995 (65.1%) | 821 (53.7%) |
| 6 to 18 Years | 2,110 (56.4%) | 1,744 (46.6%) |
| 19 to 25 Years | 545 (36.8%) | 821 (55.4%) |
| 25 to 34 Years | 885 (38.2%) | 1,166 (50.4%) |
| 35 to 44 Years | 1,149 (36.8%) | 1,851 (59.3%) |
| 45 to 54 Years | 828 (34.2%) | 1,552 (64.2%) |
| 55 to 64 Years | 1,322 (48.6%) | 1,629 (59.9%) |
| 65 to 74 Years | 2,236 (93.8%) | 1,616 (67.8%) |
| 75 Years and over | 1,663 (99.3%) | 1,104 (65.9%) |
| Total | 11,733 (54.9%) | 12,304 (57.5%) |
Disability Status by Sex by Age in Ashland
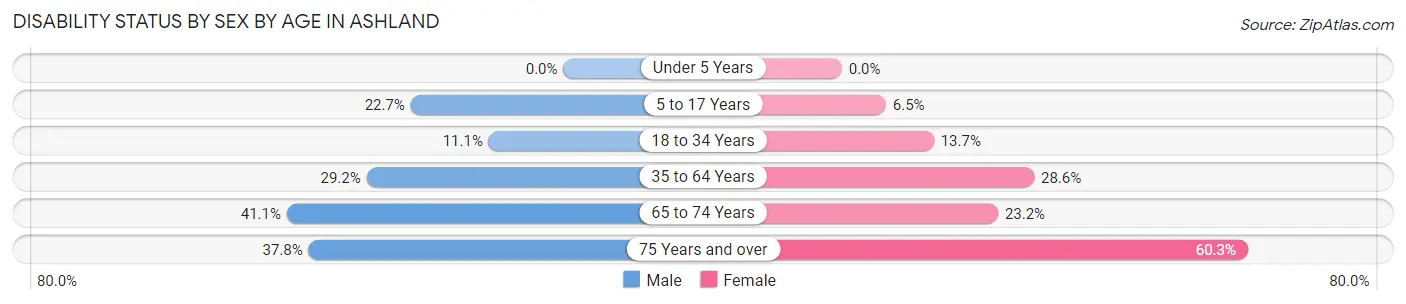
| Age Bracket | Male | Female |
| Under 5 Years | 0 (0.0%) | 0 (0.0%) |
| 5 to 17 Years | 402 (22.7%) | 131 (6.5%) |
| 18 to 34 Years | 217 (11.1%) | 281 (13.7%) |
| 35 to 64 Years | 1,056 (29.2%) | 1,326 (28.5%) |
| 65 to 74 Years | 446 (41.1%) | 301 (23.2%) |
| 75 Years and over | 221 (37.8%) | 657 (60.3%) |
Disability Class by Sex by Age in Ashland
Disability Class: Hearing Difficulty
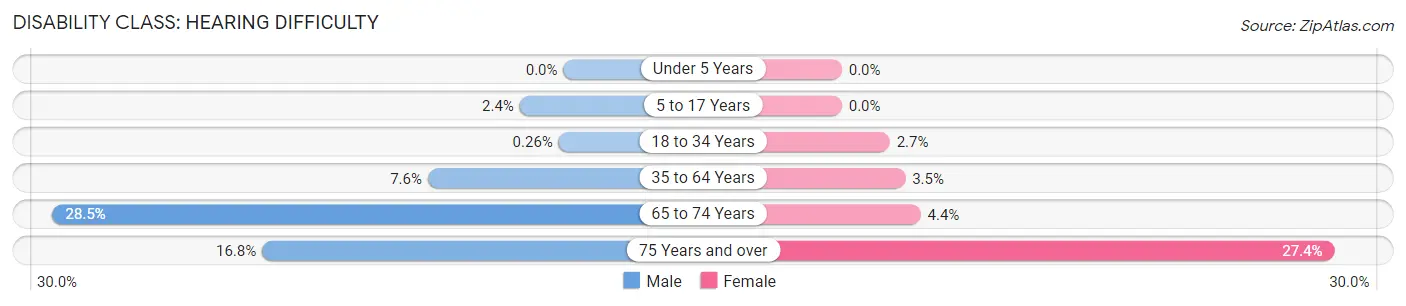
| Age Bracket | Male | Female |
| Under 5 Years | 0 (0.0%) | 0 (0.0%) |
| 5 to 17 Years | 43 (2.4%) | 0 (0.0%) |
| 18 to 34 Years | 5 (0.3%) | 55 (2.7%) |
| 35 to 64 Years | 273 (7.5%) | 164 (3.5%) |
| 65 to 74 Years | 309 (28.4%) | 57 (4.4%) |
| 75 Years and over | 98 (16.8%) | 299 (27.4%) |
Disability Class: Vision Difficulty
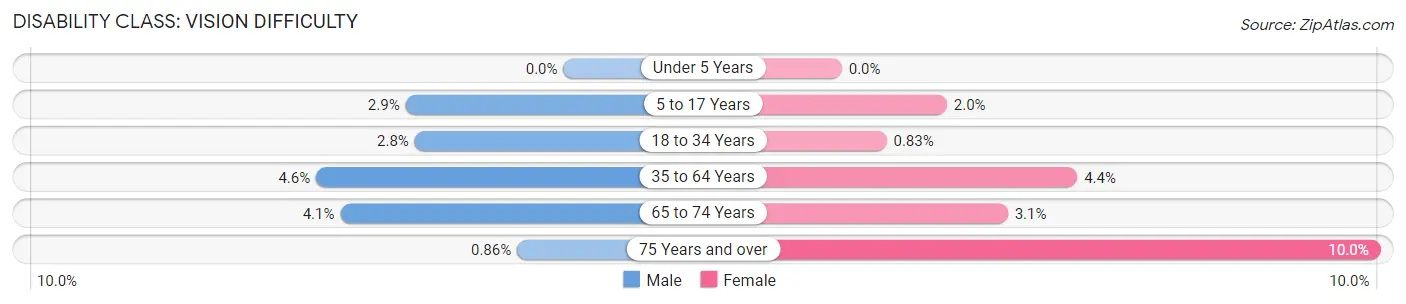
| Age Bracket | Male | Female |
| Under 5 Years | 0 (0.0%) | 0 (0.0%) |
| 5 to 17 Years | 52 (2.9%) | 39 (1.9%) |
| 18 to 34 Years | 54 (2.8%) | 17 (0.8%) |
| 35 to 64 Years | 166 (4.6%) | 203 (4.4%) |
| 65 to 74 Years | 45 (4.1%) | 40 (3.1%) |
| 75 Years and over | 5 (0.9%) | 109 (10.0%) |
Disability Class: Cognitive Difficulty
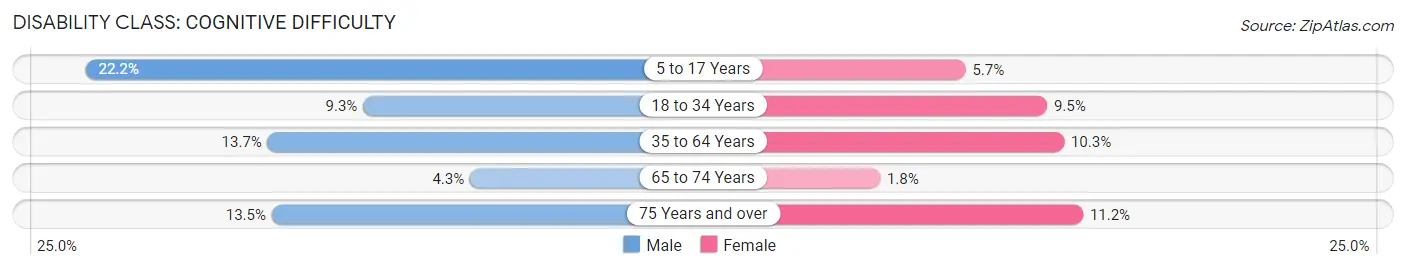
| Age Bracket | Male | Female |
| 5 to 17 Years | 393 (22.2%) | 115 (5.7%) |
| 18 to 34 Years | 182 (9.3%) | 196 (9.5%) |
| 35 to 64 Years | 496 (13.7%) | 479 (10.3%) |
| 65 to 74 Years | 47 (4.3%) | 23 (1.8%) |
| 75 Years and over | 79 (13.5%) | 122 (11.2%) |
Disability Class: Ambulatory Difficulty
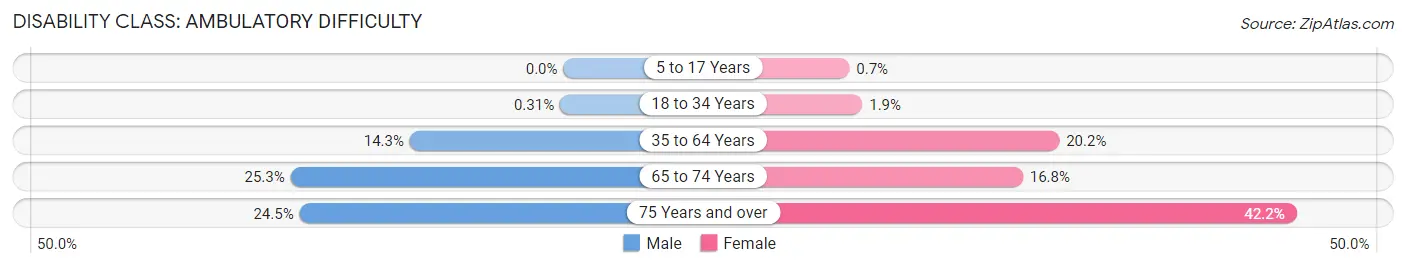
| Age Bracket | Male | Female |
| 5 to 17 Years | 0 (0.0%) | 14 (0.7%) |
| 18 to 34 Years | 6 (0.3%) | 39 (1.9%) |
| 35 to 64 Years | 515 (14.2%) | 937 (20.2%) |
| 65 to 74 Years | 275 (25.3%) | 218 (16.8%) |
| 75 Years and over | 143 (24.5%) | 460 (42.2%) |
Disability Class: Self-Care Difficulty
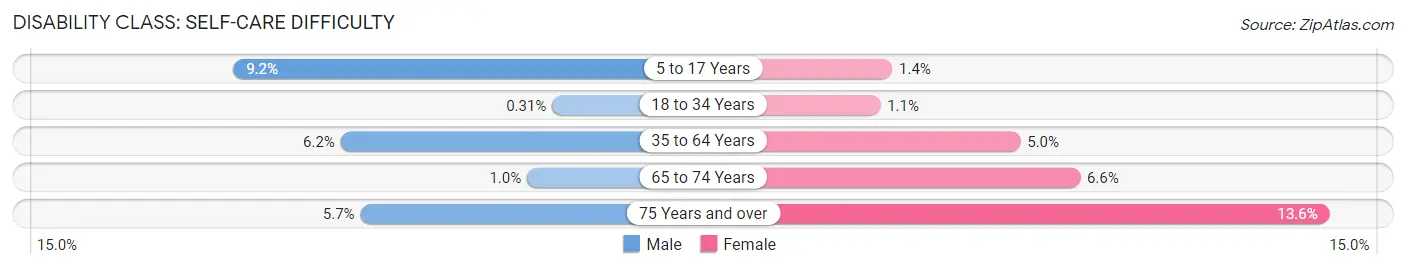
| Age Bracket | Male | Female |
| 5 to 17 Years | 163 (9.2%) | 28 (1.4%) |
| 18 to 34 Years | 6 (0.3%) | 22 (1.1%) |
| 35 to 64 Years | 224 (6.2%) | 231 (5.0%) |
| 65 to 74 Years | 11 (1.0%) | 86 (6.6%) |
| 75 Years and over | 33 (5.7%) | 148 (13.6%) |
Technology Access in Ashland
Computing Device Access in Ashland
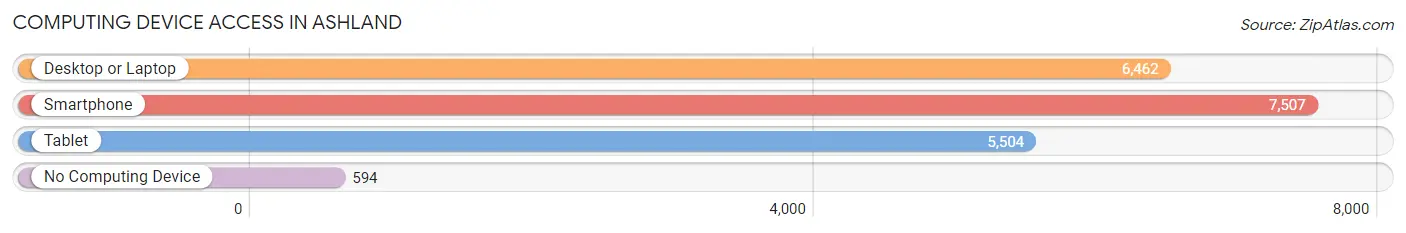
| Device Type | # Households | % Households |
| Desktop or Laptop | 6,462 | 72.6% |
| Smartphone | 7,507 | 84.3% |
| Tablet | 5,504 | 61.8% |
| No Computing Device | 594 | 6.7% |
| Total | 8,903 | 100.0% |
Internet Access in Ashland
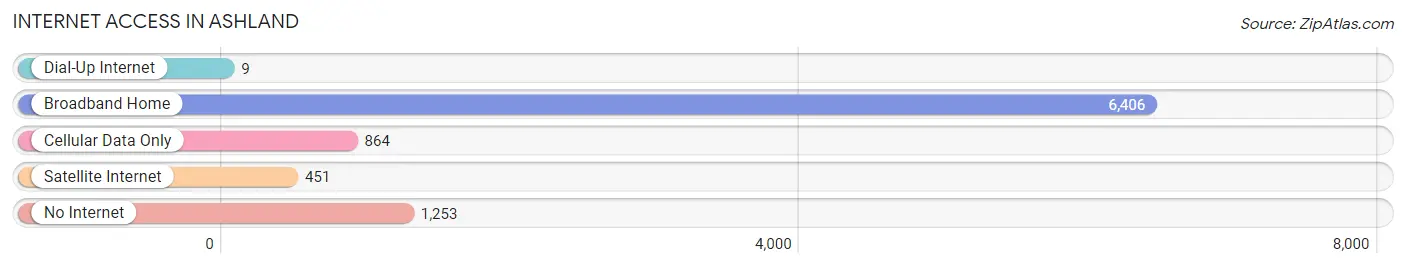
| Internet Type | # Households | % Households |
| Dial-Up Internet | 9 | 0.1% |
| Broadband Home | 6,406 | 72.0% |
| Cellular Data Only | 864 | 9.7% |
| Satellite Internet | 451 | 5.1% |
| No Internet | 1,253 | 14.1% |
| Total | 8,903 | 100.0% |
Ashland Summary
Ashland, Kentucky is a city located in the northeastern corner of the state, in Boyd County. It is situated along the Ohio River, and is the county seat of Boyd County. The city has a population of approximately 21,000 people, and is the largest city in the Tri-State area, which includes parts of Kentucky, Ohio, and West Virginia.
History
The area that is now Ashland was first settled in the early 1800s by pioneers from the east coast. The city was originally known as Poage’s Landing, after the family that owned the land. In 1854, the city was renamed Ashland, after the estate of Henry Clay, a prominent statesman from Kentucky.
The city was incorporated in 1856, and quickly became an important port on the Ohio River. The city was a major hub for the coal and iron industries, and was home to several large steel mills. The city was also a major stop on the Chesapeake and Ohio Railway, which connected the city to the rest of the country.
In the late 19th century, the city experienced a period of rapid growth, and by the early 20th century, it was one of the largest cities in the state. The city was also home to several large manufacturing plants, including the Ashland Oil and Refining Company, which was founded in 1924.
Geography
Ashland is located in the northeastern corner of the state, in Boyd County. It is situated along the Ohio River, and is the county seat of Boyd County. The city has a total area of 8.3 square miles, of which 8.2 square miles is land and 0.1 square miles is water.
The city is located in the Appalachian Mountains, and is surrounded by rolling hills and forests. The city is also located near several large lakes, including Cave Run Lake and Greenbo Lake.
Economy
The economy of Ashland is largely based on manufacturing and services. The city is home to several large manufacturing plants, including the Ashland Oil and Refining Company, which produces petroleum products. The city is also home to several large steel mills, and is a major hub for the coal and iron industries.
The city is also home to several large retail stores, including Walmart, Target, and Kmart. The city is also home to several large hospitals, including King’s Daughters Medical Center and Our Lady of Bellefonte Hospital.
Demographics
As of the 2010 census, the population of Ashland was 21,684. The racial makeup of the city was 90.2% White, 6.2% African American, 0.3% Native American, 0.7% Asian, 0.1% Pacific Islander, and 2.5% from other races. Hispanic or Latino of any race were 2.2% of the population.
The median income for a household in the city was $30,945, and the median income for a family was $37,945. The per capita income for the city was $17,845. About 17.2% of families and 20.3% of the population were below the poverty line, including 28.2% of those under age 18 and 11.2% of those age 65 or over.
Common Questions
What is Per Capita Income in Ashland?
Per Capita income in Ashland is $28,501.
What is the Median Family Income in Ashland?
Median Family Income in Ashland is $65,909.
What is the Median Household income in Ashland?
Median Household Income in Ashland is $51,250.
What is Income or Wage Gap in Ashland?
Income or Wage Gap in Ashland is 6.3%.
Women in Ashland earn 93.7 cents for every dollar earned by a man.
What is Family Income Deficit in Ashland?
Family Income Deficit in Ashland is $12,318.
Families that are below poverty line in Ashland earn $12,318 less on average than the poverty threshold level.
What is Inequality or Gini Index in Ashland?
Inequality or Gini Index in Ashland is 0.46.
What is the Total Population of Ashland?
Total Population of Ashland is 21,542.
What is the Total Male Population of Ashland?
Total Male Population of Ashland is 9,788.
What is the Total Female Population of Ashland?
Total Female Population of Ashland is 11,754.
What is the Ratio of Males per 100 Females in Ashland?
There are 83.27 Males per 100 Females in Ashland.
What is the Ratio of Females per 100 Males in Ashland?
There are 120.09 Females per 100 Males in Ashland.
What is the Median Population Age in Ashland?
Median Population Age in Ashland is 40.8 Years.
What is the Average Family Size in Ashland
Average Family Size in Ashland is 3.0 People.
What is the Average Household Size in Ashland
Average Household Size in Ashland is 2.4 People.
How Large is the Labor Force in Ashland?
There are 9,455 People in the Labor Forcein in Ashland.
What is the Percentage of People in the Labor Force in Ashland?
54.9% of People are in the Labor Force in Ashland.
What is the Unemployment Rate in Ashland?
Unemployment Rate in Ashland is 8.4%.