Zip Codes with the Highest Percentage of Population Employed in Accommodation & Food Services in Owensboro, KY
RELATED REPORTS & OPTIONS
Accommodation & Food Services
Owensboro
Compare Zip Codes
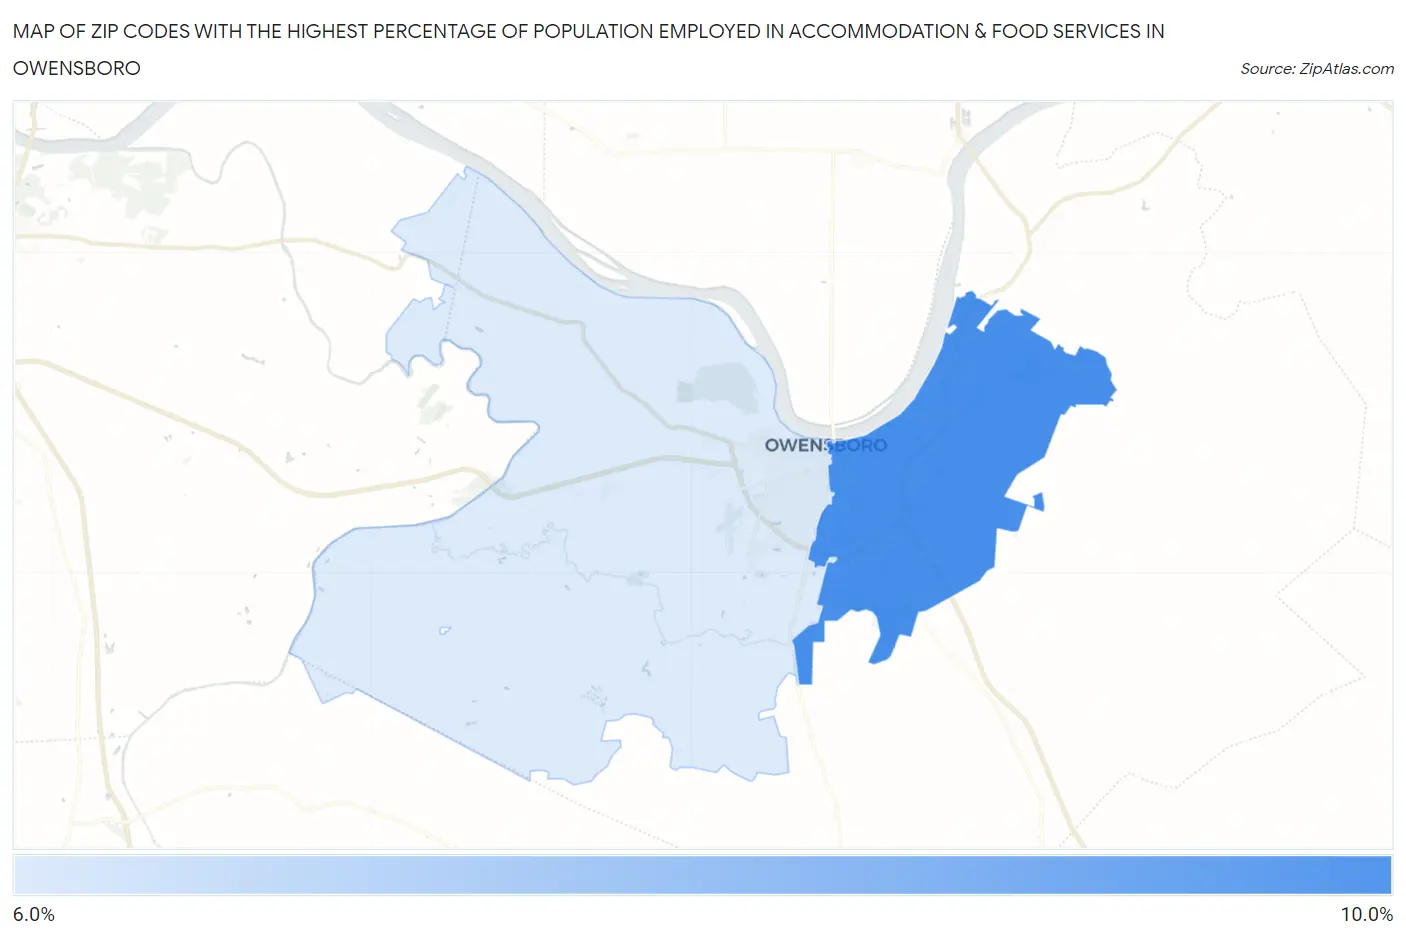
Map of Zip Codes with the Highest Percentage of Population Employed in Accommodation & Food Services in Owensboro
6.9%
8.1%
Zip Codes with the Highest Percentage of Population Employed in Accommodation & Food Services in Owensboro, KY
| Zip Code | % Employed | vs State | vs National | |
| 1. | 42303 | 8.1% | 6.7%(+1.47)#170 | 6.9%(+1.26)#7,566 |
| 2. | 42301 | 6.9% | 6.7%(+0.217)#216 | 6.9%(+0.005)#10,625 |
1
Common Questions
What are the Top Zip Codes with the Highest Percentage of Population Employed in Accommodation & Food Services in Owensboro, KY?
Top Zip Codes with the Highest Percentage of Population Employed in Accommodation & Food Services in Owensboro, KY are:
What zip code has the Highest Percentage of Population Employed in Accommodation & Food Services in Owensboro, KY?
42303 has the Highest Percentage of Population Employed in Accommodation & Food Services in Owensboro, KY with 8.1%.
What is the Percentage of Population Employed in Accommodation & Food Services in Owensboro, KY?
Percentage of Population Employed in Accommodation & Food Services in Owensboro is 8.0%.
What is the Percentage of Population Employed in Accommodation & Food Services in Kentucky?
Percentage of Population Employed in Accommodation & Food Services in Kentucky is 6.7%.
What is the Percentage of Population Employed in Accommodation & Food Services in the United States?
Percentage of Population Employed in Accommodation & Food Services in the United States is 6.9%.