Zip Codes with the Highest Percentage of Population Employed in Accommodation & Food Services in Louisville, KY

RELATED REPORTS & OPTIONS

Accommodation & Food Services
Population
Families and Households
Female Fertility
Female Fertility (Unmarried)
Race (Community Size)
Race (Percentage)
Ancestry (Community Size)
AfghanAfricanAlaska NativeAlbanianAlsatianAmericanApacheArabArgentineanArmenianAssyrian / Chaldean / SyriacAustralianAustrianBahamianBangladeshiBarbadianBelgianBelizeanBhutaneseBlackfeetBolivianBrazilianBritishBritish West IndianBulgarianBurmeseCajunCambodianCanadianCape VerdeanCelticCentral AmericanCentral American IndianCherokeeChickasawChileanChippewaChoctawColombianComancheCosta RicanCreekCroatianCrowCubanCzechCzechoslovakianDanishDominicanDutchEastern EuropeanEcuadorianEgyptianEnglishEstonianEthiopianEuropeanFilipinoFinnishFrenchFrench American IndianFrench CanadianGermanGhanaianGreekGuamanian / ChamorroGuatemalanHaitianHonduranHungarianIcelanderIndian (Asian)IndonesianInupiatIranianIraqiIrishIroquoisIsraeliItalianJamaicanJapaneseJordanianKenyanKoreanLaotianLatvianLebaneseLiberianLithuanianLumbeeLuxembourgerMalaysianMexicanMexican American IndianMongolianMoroccanNative HawaiianNew ZealanderNicaraguanNigerianNorthern EuropeanNorwegianOsagePakistaniPalestinianPanamanianParaguayanPennsylvania GermanPeruvianPolishPortuguesePotawatomiPuebloPuerto RicanRomanianRussianSalvadoranSamoanScandinavianScotch-IrishScottishSeminoleSerbianSiouxSlavicSlovakSloveneSomaliSouth AfricanSouth AmericanSpaniardSpanishSri LankanSubsaharan AfricanSudaneseSwedishSwissSyrianThaiTohono O'OdhamTrinidadian and TobagonianTurkishU.S. Virgin IslanderUgandanUkrainianVenezuelanWelshWest IndianYugoslavian
Ancestry (Percentage)
AfghanAfricanAlaska NativeAlbanianAlsatianAmericanApacheArabArgentineanArmenianAssyrian / Chaldean / SyriacAustralianAustrianBahamianBangladeshiBarbadianBelgianBelizeanBhutaneseBlackfeetBolivianBrazilianBritishBritish West IndianBulgarianBurmeseCajunCambodianCanadianCape VerdeanCelticCentral AmericanCentral American IndianCherokeeChickasawChileanChippewaChoctawColombianComancheCosta RicanCreekCroatianCrowCubanCzechCzechoslovakianDanishDominicanDutchEastern EuropeanEcuadorianEgyptianEnglishEstonianEthiopianEuropeanFilipinoFinnishFrenchFrench American IndianFrench CanadianGermanGhanaianGreekGuamanian / ChamorroGuatemalanHaitianHonduranHungarianIcelanderIndian (Asian)IndonesianInupiatIranianIraqiIrishIroquoisIsraeliItalianJamaicanJapaneseJordanianKenyanKoreanLaotianLatvianLebaneseLiberianLithuanianLumbeeLuxembourgerMalaysianMexicanMexican American IndianMongolianMoroccanNative HawaiianNew ZealanderNicaraguanNigerianNorthern EuropeanNorwegianOsagePakistaniPalestinianPanamanianParaguayanPennsylvania GermanPeruvianPolishPortuguesePotawatomiPuebloPuerto RicanRomanianRussianSalvadoranSamoanScandinavianScotch-IrishScottishSeminoleSerbianSiouxSlavicSlovakSloveneSomaliSouth AfricanSouth AmericanSpaniardSpanishSri LankanSubsaharan AfricanSudaneseSwedishSwissSyrianThaiTohono O'OdhamTrinidadian and TobagonianTurkishU.S. Virgin IslanderUgandanUkrainianVenezuelanWelshWest IndianYugoslavian
Immigrant Origin (Total)
AfghanistanAfricaAlbaniaArgentinaAsiaAustraliaAustriaBangladeshBarbadosBelarusBelgiumBelizeBoliviaBosnia and HerzegovinaBrazilBulgariaBurma / MyanmarCambodiaCameroonCanadaCaribbeanCentral AmericaChileChinaColombiaCongoCosta RicaCroatiaCubaCzechoslovakiaDenmarkDominican RepublicEastern AfricaEastern AsiaEastern EuropeEcuadorEgyptEl SalvadorEnglandEritreaEthiopiaEuropeFranceGermanyGhanaGuatemalaGuyanaHaitiHondurasHong KongHungaryIndiaIndonesiaIranIraqIrelandIsraelItalyJamaicaJapanJordanKazakhstanKenyaKoreaKuwaitLaosLatin AmericaLebanonLiberiaLithuaniaMalaysiaMexicoMicronesiaMiddle AfricaMoldovaMoroccoNepalNetherlandsNicaraguaNigeriaNorthern AfricaNorthern EuropeNorwayOceaniaPakistanPanamaPeruPhilippinesPolandPortugalRomaniaRussiaSaudi ArabiaScotlandSenegalSerbiaSingaporeSomaliaSouth AfricaSouth AmericaSouth Central AsiaSouth Eastern AsiaSouthern EuropeSpainSri LankaSudanSwedenSyriaTaiwanThailandTrinidad and TobagoTurkeyUgandaUkraineUzbekistanVenezuelaVietnamWestern AfricaWestern AsiaWestern EuropeZaire
Immigrant Origin (Percentage)
AfghanistanAfricaAlbaniaArgentinaAsiaAustraliaAustriaBangladeshBarbadosBelarusBelgiumBelizeBoliviaBosnia and HerzegovinaBrazilBulgariaBurma / MyanmarCambodiaCameroonCanadaCaribbeanCentral AmericaChileChinaColombiaCongoCosta RicaCroatiaCubaCzechoslovakiaDenmarkDominican RepublicEastern AfricaEastern AsiaEastern EuropeEcuadorEgyptEl SalvadorEnglandEritreaEthiopiaEuropeFranceGermanyGhanaGuatemalaGuyanaHaitiHondurasHong KongHungaryIndiaIndonesiaIranIraqIrelandIsraelItalyJamaicaJapanJordanKazakhstanKenyaKoreaKuwaitLaosLatin AmericaLebanonLiberiaLithuaniaMalaysiaMexicoMicronesiaMiddle AfricaMoldovaMoroccoNepalNetherlandsNicaraguaNigeriaNorthern AfricaNorthern EuropeNorwayOceaniaPakistanPanamaPeruPhilippinesPolandPortugalRomaniaRussiaSaudi ArabiaScotlandSenegalSerbiaSingaporeSomaliaSouth AfricaSouth AmericaSouth Central AsiaSouth Eastern AsiaSouthern EuropeSpainSri LankaSudanSwedenSyriaTaiwanThailandTrinidad and TobagoTurkeyUgandaUkraineUzbekistanVenezuelaVietnamWestern AfricaWestern AsiaWestern EuropeZaire
Income
Income (Families)
Income (Households)
Poverty
Poverty (Families)
Unemployment
Employment Occupations
Employment Industries
Employer Class
Commute Time
Commute Means
School Enrollment
Education by Degree Field
Occupancy
Finances
Physical Characteristics
Louisville
Compare Zip Codes
Comparison Subject

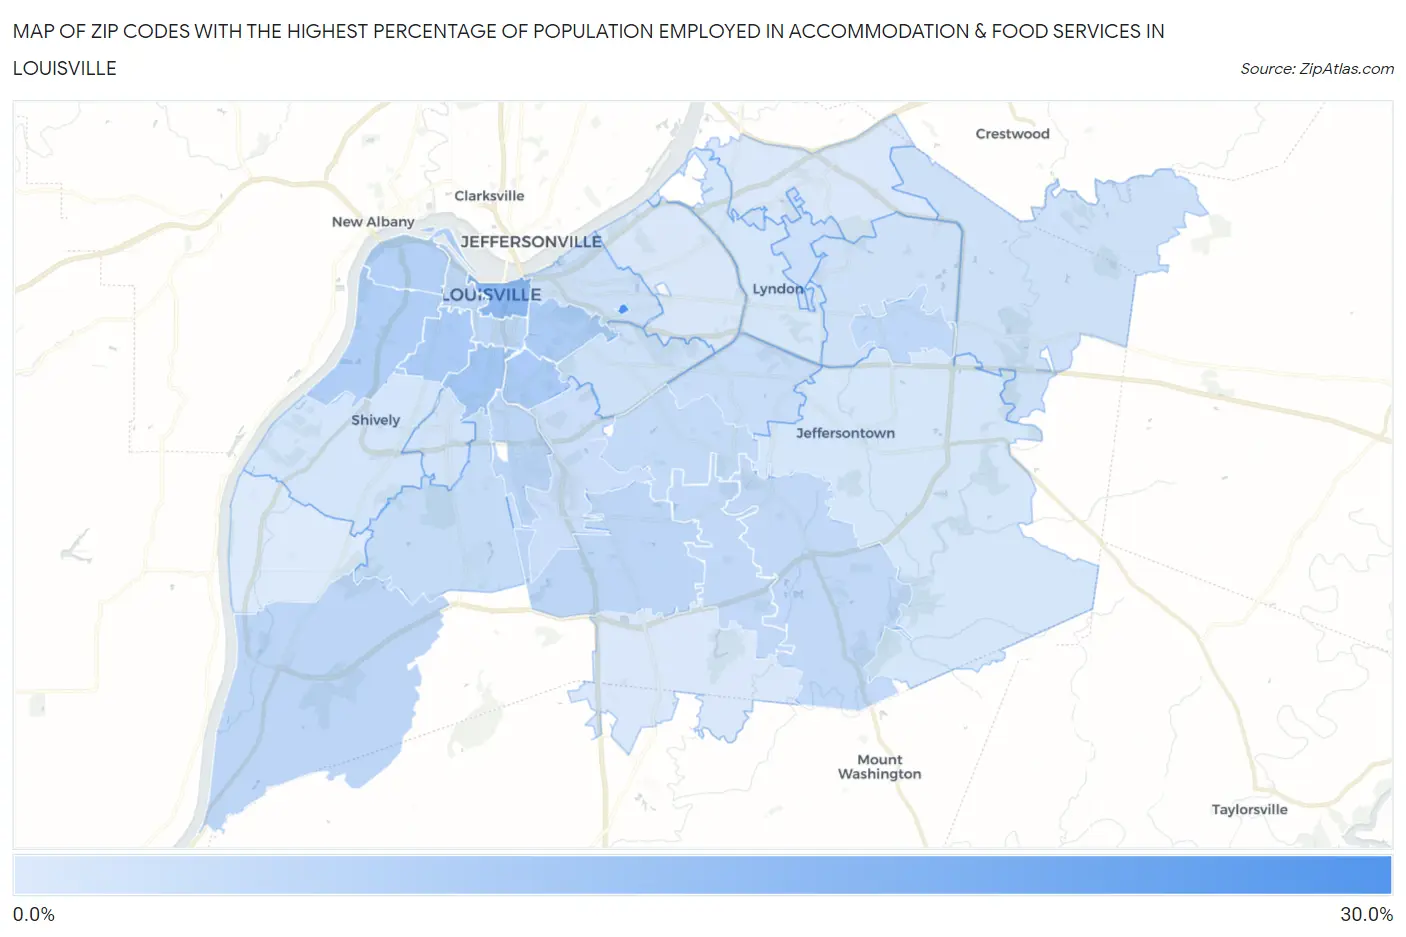
Map of Zip Codes with the Highest Percentage of Population Employed in Accommodation & Food Services in Louisville

0.0%
30.0%
Zip Codes with the Highest Percentage of Population Employed in Accommodation & Food Services in Louisville Map

Zip Codes with the Highest Percentage of Population Employed in Accommodation & Food Services in Louisville, KY

Zip Code % Employed vs State vs National
1.4028025.9%6.7%(+19.3)#186.9%(+19.1)#465
2.4020215.4%6.7%(+8.72)#506.9%(+8.50)#1,580
3.4020812.1%6.7%(+5.42)#776.9%(+5.21)#2,780
4.4021011.1%6.7%(+4.38)#956.9%(+4.17)#3,509
5.4021711.0%6.7%(+4.29)#966.9%(+4.08)#3,580
6.4020410.9%6.7%(+4.19)#996.9%(+3.98)#3,668
7.4021110.1%6.7%(+3.41)#1106.9%(+3.20)#4,431
8.402129.8%6.7%(+3.15)#1156.9%(+2.94)#4,763
9.402038.5%6.7%(+1.84)#1526.9%(+1.63)#6,805
10.402098.5%6.7%(+1.84)#1536.9%(+1.63)#6,806
11.402198.5%6.7%(+1.82)#1546.9%(+1.61)#6,843
12.402728.4%6.7%(+1.72)#1596.9%(+1.51)#7,018
13.402438.2%6.7%(+1.58)#1666.9%(+1.36)#7,330
14.402287.9%6.7%(+1.27)#1766.9%(+1.06)#7,948
15.402917.9%6.7%(+1.22)#1796.9%(+1.01)#8,056
16.402187.6%6.7%(+0.942)#1856.9%(+0.731)#8,727
17.402147.2%6.7%(+0.546)#2016.9%(+0.335)#9,766
18.402206.9%6.7%(+0.247)#2146.9%(+0.036)#10,555
19.402136.5%6.7%(-0.210)#2336.9%(-0.421)#11,972
20.402066.3%6.7%(-0.381)#2466.9%(-0.593)#12,519
21.402426.2%6.7%(-0.454)#2526.9%(-0.665)#12,745
22.402055.9%6.7%(-0.736)#2626.9%(-0.947)#13,663
23.402455.9%6.7%(-0.742)#2636.9%(-0.954)#13,686
24.402235.9%6.7%(-0.758)#2646.9%(-0.969)#13,739
25.402155.6%6.7%(-1.04)#2826.9%(-1.25)#14,604
26.402165.3%6.7%(-1.33)#2976.9%(-1.54)#15,616
27.402995.2%6.7%(-1.48)#3066.9%(-1.70)#16,164
28.402225.2%6.7%(-1.51)#3076.9%(-1.72)#16,241
29.402074.6%6.7%(-2.03)#3376.9%(-2.25)#18,039
30.402294.5%6.7%(-2.17)#3486.9%(-2.38)#18,521
31.402414.5%6.7%(-2.22)#3496.9%(-2.43)#18,664
32.402584.1%6.7%(-2.52)#3686.9%(-2.73)#19,666

Common Questions

What are the Top 10 Zip Codes with the Highest Percentage of Population Employed in Accommodation & Food Services in Louisville, KY?
Top 10 Zip Codes with the Highest Percentage of Population Employed in Accommodation & Food Services in Louisville, KY are:
#1
25.9%
#2
15.4%
#3
12.1%
#4
11.1%
#5
11.0%
#6
10.9%
#7
10.1%
#8
9.8%
#9
8.5%
#10
8.5%
What zip code has the Highest Percentage of Population Employed in Accommodation & Food Services in Louisville, KY?
40280 has the Highest Percentage of Population Employed in Accommodation & Food Services in Louisville, KY with 25.9%.
What is the Percentage of Population Employed in Accommodation & Food Services in Louisville, KY?
Percentage of Population Employed in Accommodation & Food Services in Louisville is 7.1%.
What is the Percentage of Population Employed in Accommodation & Food Services in Kentucky?
Percentage of Population Employed in Accommodation & Food Services in Kentucky is 6.7%.
What is the Percentage of Population Employed in Accommodation & Food Services in the United States?
Percentage of Population Employed in Accommodation & Food Services in the United States is 6.9%.