Zip Codes with the Highest Percentage of Population Employed in Accommodation & Food Services in Covington, KY
RELATED REPORTS & OPTIONS
Accommodation & Food Services
Covington
Compare Zip Codes
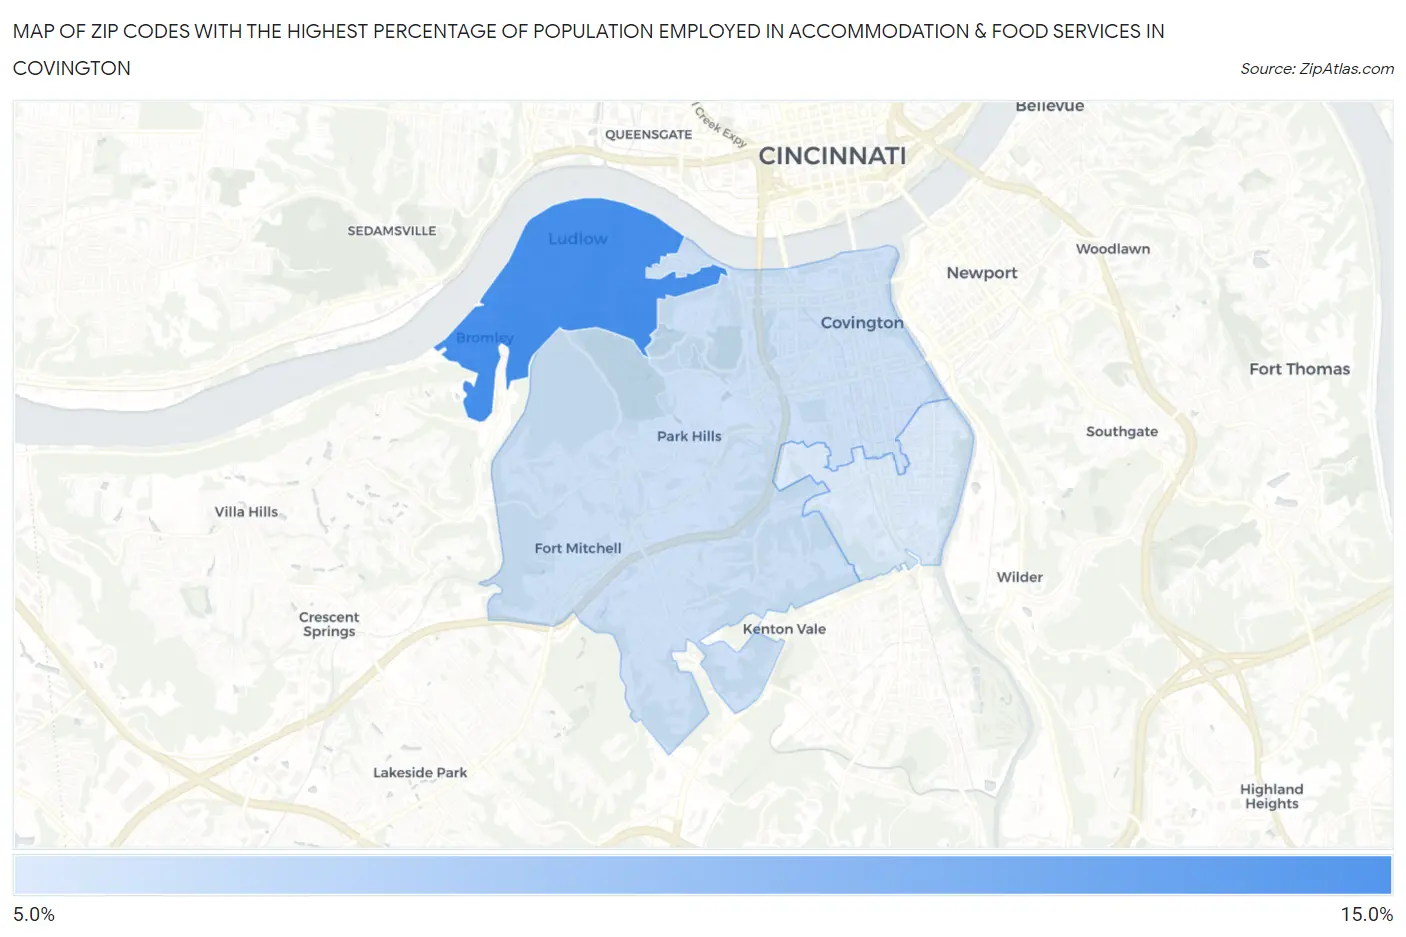
Map of Zip Codes with the Highest Percentage of Population Employed in Accommodation & Food Services in Covington
7.2%
14.2%
Zip Codes with the Highest Percentage of Population Employed in Accommodation & Food Services in Covington, KY
| Zip Code | % Employed | vs State | vs National | |
| 1. | 41016 | 14.2% | 6.7%(+7.53)#59 | 6.9%(+7.32)#1,902 |
| 2. | 41011 | 7.8% | 6.7%(+1.11)#181 | 6.9%(+0.896)#8,318 |
| 3. | 41014 | 7.2% | 6.7%(+0.494)#203 | 6.9%(+0.282)#9,893 |
1
Common Questions
What are the Top Zip Codes with the Highest Percentage of Population Employed in Accommodation & Food Services in Covington, KY?
Top Zip Codes with the Highest Percentage of Population Employed in Accommodation & Food Services in Covington, KY are:
What zip code has the Highest Percentage of Population Employed in Accommodation & Food Services in Covington, KY?
41016 has the Highest Percentage of Population Employed in Accommodation & Food Services in Covington, KY with 14.2%.
What is the Percentage of Population Employed in Accommodation & Food Services in Covington, KY?
Percentage of Population Employed in Accommodation & Food Services in Covington is 8.9%.
What is the Percentage of Population Employed in Accommodation & Food Services in Kentucky?
Percentage of Population Employed in Accommodation & Food Services in Kentucky is 6.7%.
What is the Percentage of Population Employed in Accommodation & Food Services in the United States?
Percentage of Population Employed in Accommodation & Food Services in the United States is 6.9%.