Zip Codes with the Highest Percentage of Population Employed in Accommodation & Food Services in Paducah, KY
RELATED REPORTS & OPTIONS
Accommodation & Food Services
Paducah
Compare Zip Codes
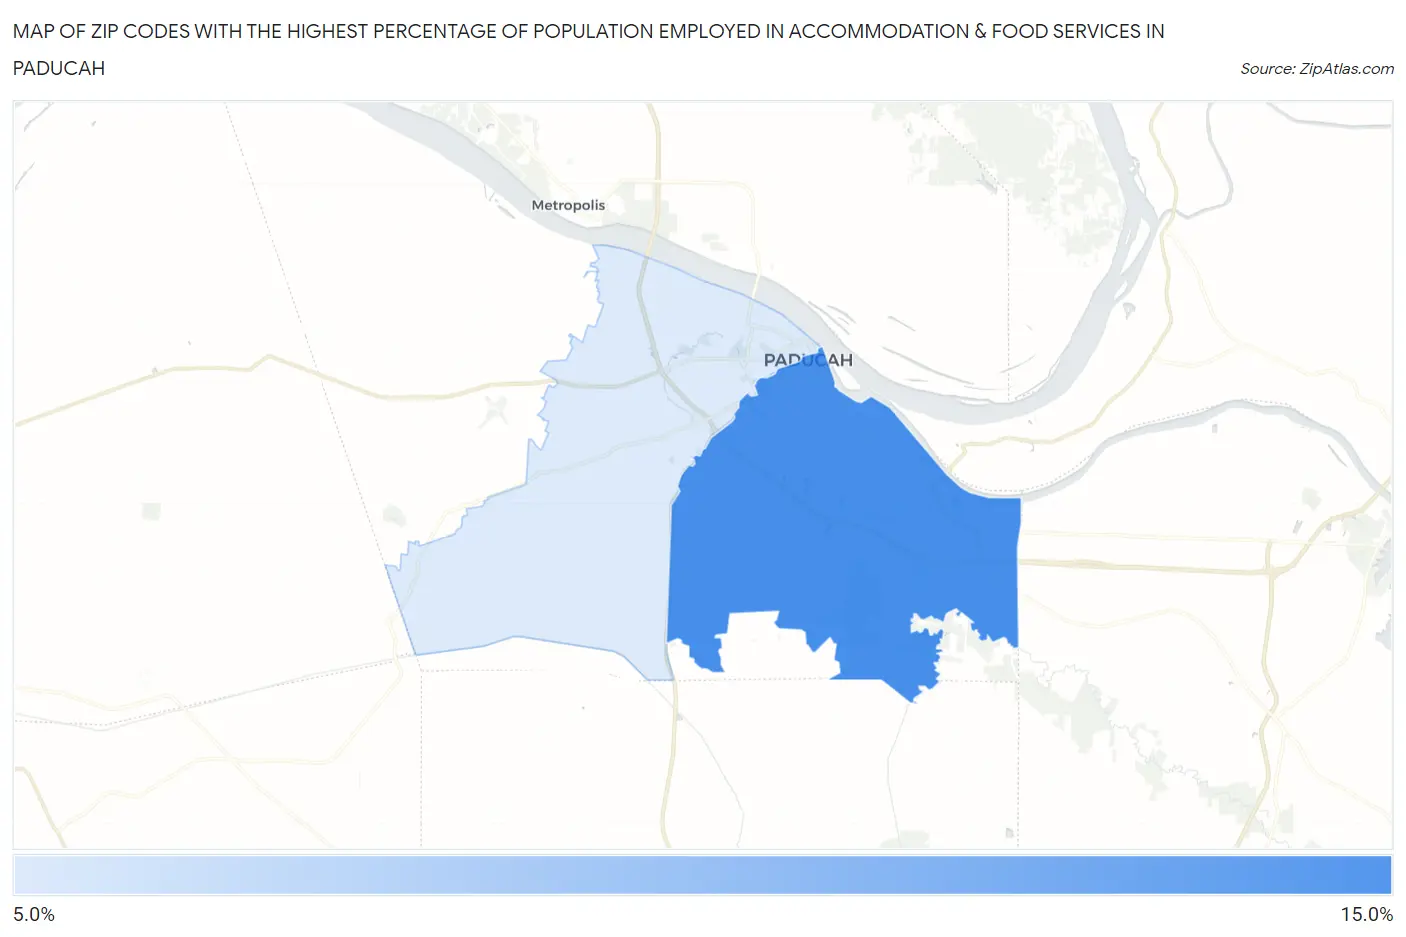
Map of Zip Codes with the Highest Percentage of Population Employed in Accommodation & Food Services in Paducah
8.7%
11.2%
Zip Codes with the Highest Percentage of Population Employed in Accommodation & Food Services in Paducah, KY
| Zip Code | % Employed | vs State | vs National | |
| 1. | 42003 | 11.2% | 6.7%(+4.50)#90 | 6.9%(+4.29)#3,417 |
| 2. | 42001 | 8.7% | 6.7%(+2.07)#149 | 6.9%(+1.86)#6,404 |
1
Common Questions
What are the Top Zip Codes with the Highest Percentage of Population Employed in Accommodation & Food Services in Paducah, KY?
Top Zip Codes with the Highest Percentage of Population Employed in Accommodation & Food Services in Paducah, KY are:
What zip code has the Highest Percentage of Population Employed in Accommodation & Food Services in Paducah, KY?
42003 has the Highest Percentage of Population Employed in Accommodation & Food Services in Paducah, KY with 11.2%.
What is the Percentage of Population Employed in Accommodation & Food Services in Paducah, KY?
Percentage of Population Employed in Accommodation & Food Services in Paducah is 11.3%.
What is the Percentage of Population Employed in Accommodation & Food Services in Kentucky?
Percentage of Population Employed in Accommodation & Food Services in Kentucky is 6.7%.
What is the Percentage of Population Employed in Accommodation & Food Services in the United States?
Percentage of Population Employed in Accommodation & Food Services in the United States is 6.9%.