Water Valley, KY Map & Demographics
Water Valley Map
Water Valley Overview
$50,434
PER CAPITA INCOME
$56,518
AVG FAMILY INCOME
$80,385
AVG HOUSEHOLD INCOME
0.21
INEQUALITY / GINI INDEX
88
TOTAL POPULATION
55
MALE POPULATION
33
FEMALE POPULATION
166.67
MALES / 100 FEMALES
60.00
FEMALES / 100 MALES
73.2
MEDIAN AGE
2.0
AVG FAMILY SIZE
1.7
AVG HOUSEHOLD SIZE
54
LABOR FORCE [ PEOPLE ]
61.4%
PERCENT IN LABOR FORCE
Water Valley Zip Codes
Water Valley Area Codes
Income in Water Valley
Income Overview in Water Valley
Per Capita Income in Water Valley is $50,434, while median incomes of families and households are $56,518 and $80,385 respectively.
| Characteristic | Number | Measure |
| Per Capita Income | 88 | $50,434 |
| Median Family Income | 37 | $56,518 |
| Mean Family Income | 37 | $63,030 |
| Median Household Income | 52 | $80,385 |
| Mean Household Income | 52 | $80,377 |
| Income Deficit | 37 | $0 |
| Wage / Income Gap (%) | 88 | 0.00% |
| Wage / Income Gap ($) | 88 | 100.00¢ per $1 |
| Gini / Inequality Index | 88 | 0.21 |
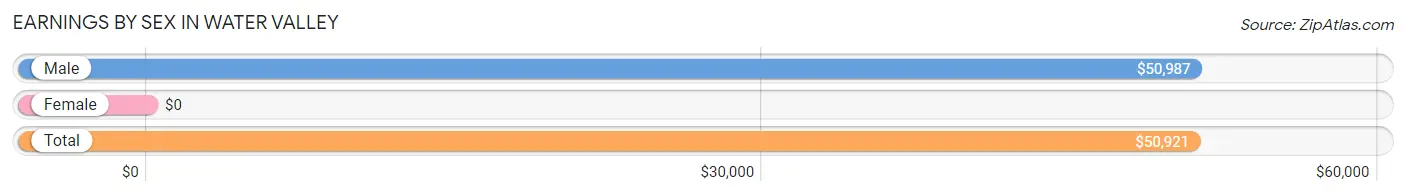
Earnings by Sex in Water Valley
| Sex | Number | Average Earnings |
| Male | 41 (75.9%) | $50,987 |
| Female | 13 (24.1%) | $0 |
| Total | 54 (100.0%) | $50,921 |
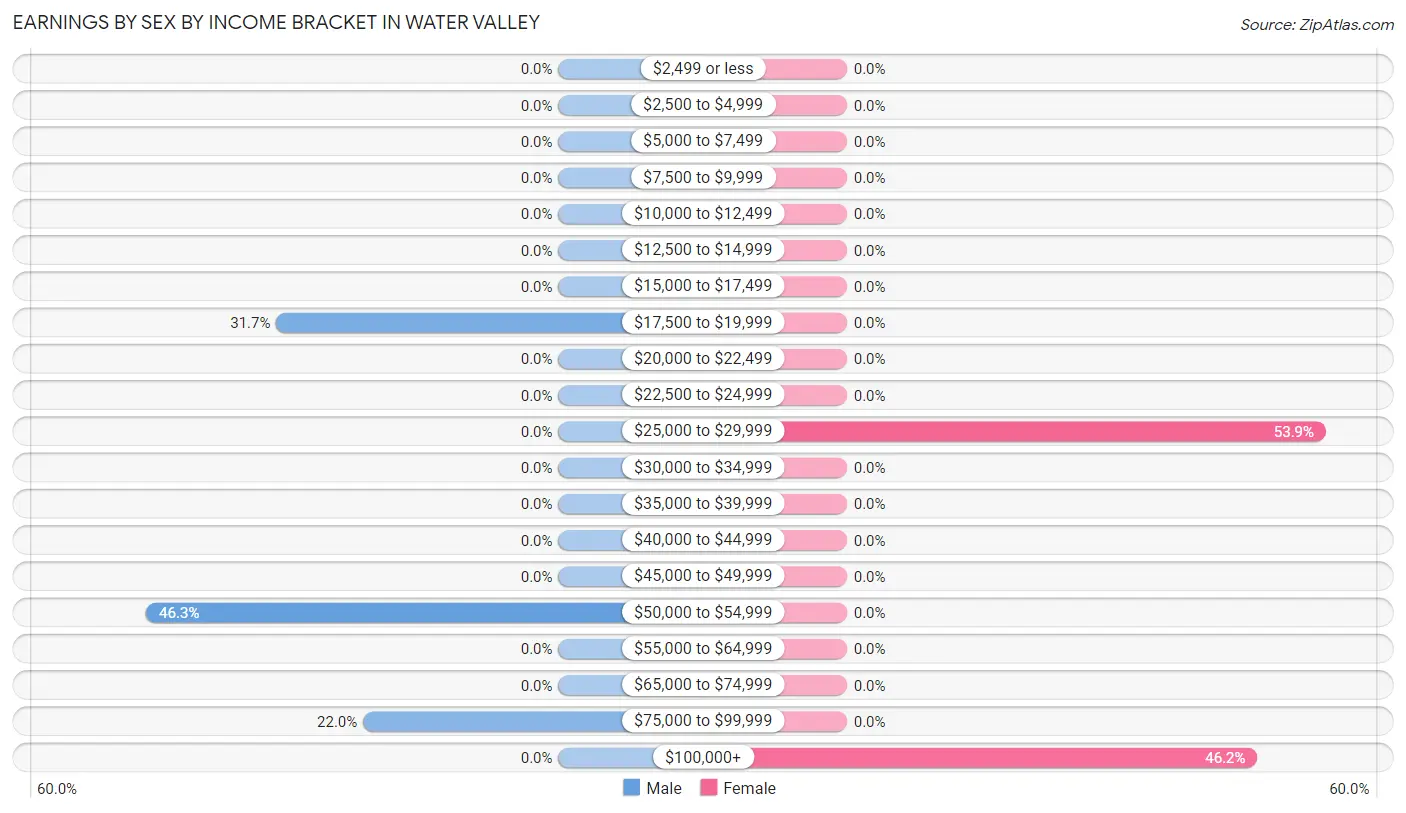
Earnings by Sex by Income Bracket in Water Valley
The most common earnings brackets in Water Valley are $50,000 to $54,999 for men (19 | 46.3%) and $25,000 to $29,999 for women (7 | 53.8%).
| Income | Male | Female |
| $2,499 or less | 0 (0.0%) | 0 (0.0%) |
| $2,500 to $4,999 | 0 (0.0%) | 0 (0.0%) |
| $5,000 to $7,499 | 0 (0.0%) | 0 (0.0%) |
| $7,500 to $9,999 | 0 (0.0%) | 0 (0.0%) |
| $10,000 to $12,499 | 0 (0.0%) | 0 (0.0%) |
| $12,500 to $14,999 | 0 (0.0%) | 0 (0.0%) |
| $15,000 to $17,499 | 0 (0.0%) | 0 (0.0%) |
| $17,500 to $19,999 | 13 (31.7%) | 0 (0.0%) |
| $20,000 to $22,499 | 0 (0.0%) | 0 (0.0%) |
| $22,500 to $24,999 | 0 (0.0%) | 0 (0.0%) |
| $25,000 to $29,999 | 0 (0.0%) | 7 (53.8%) |
| $30,000 to $34,999 | 0 (0.0%) | 0 (0.0%) |
| $35,000 to $39,999 | 0 (0.0%) | 0 (0.0%) |
| $40,000 to $44,999 | 0 (0.0%) | 0 (0.0%) |
| $45,000 to $49,999 | 0 (0.0%) | 0 (0.0%) |
| $50,000 to $54,999 | 19 (46.3%) | 0 (0.0%) |
| $55,000 to $64,999 | 0 (0.0%) | 0 (0.0%) |
| $65,000 to $74,999 | 0 (0.0%) | 0 (0.0%) |
| $75,000 to $99,999 | 9 (22.0%) | 0 (0.0%) |
| $100,000+ | 0 (0.0%) | 6 (46.2%) |
| Total | 41 (100.0%) | 13 (100.0%) |
Earnings by Sex by Educational Attainment in Water Valley
| Educational Attainment | Male Income | Female Income |
| Less than High School | - | - |
| High School Diploma | - | - |
| College or Associate's Degree | - | - |
| Bachelor's Degree | - | - |
| Graduate Degree | - | - |
| Total | $50,987 | $0 |
Family Income in Water Valley
Family Income Brackets in Water Valley
According to the Water Valley family income data, there are 24 families falling into the $50,000 to $74,999 income range, which is the most common income bracket and makes up 64.9% of all families.
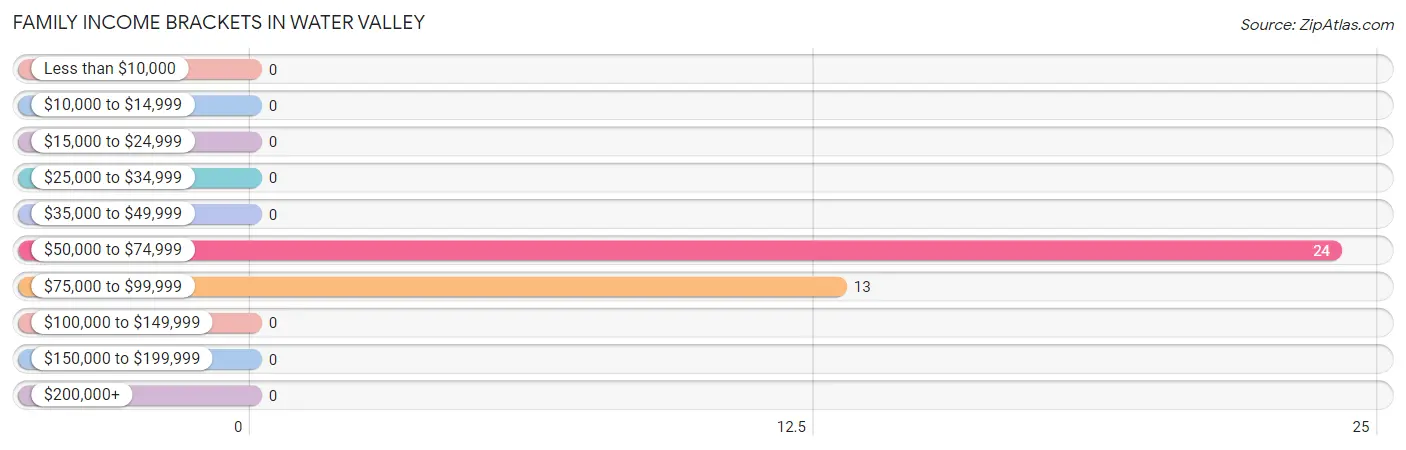
| Income Bracket | # Families | % Families |
| Less than $10,000 | 0 | 0.0% |
| $10,000 to $14,999 | 0 | 0.0% |
| $15,000 to $24,999 | 0 | 0.0% |
| $25,000 to $34,999 | 0 | 0.0% |
| $35,000 to $49,999 | 0 | 0.0% |
| $50,000 to $74,999 | 24 | 64.9% |
| $75,000 to $99,999 | 13 | 35.1% |
| $100,000 to $149,999 | 0 | 0.0% |
| $150,000 to $199,999 | 0 | 0.0% |
| $200,000+ | 0 | 0.0% |
Family Income by Famaliy Size in Water Valley
2-person families (37 | 100.0%) account for the highest median family income in Water Valley with $56,518 per family, while 2-person families (37 | 100.0%) have the highest median income of $28,259 per family member.
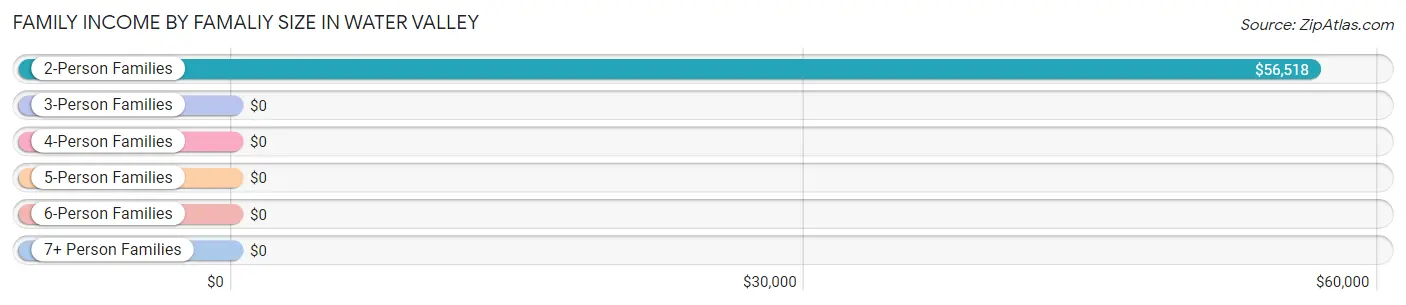
| Income Bracket | # Families | Median Income |
| 2-Person Families | 37 (100.0%) | $56,518 |
| 3-Person Families | 0 (0.0%) | $0 |
| 4-Person Families | 0 (0.0%) | $0 |
| 5-Person Families | 0 (0.0%) | $0 |
| 6-Person Families | 0 (0.0%) | $0 |
| 7+ Person Families | 0 (0.0%) | $0 |
| Total | 37 (100.0%) | $56,518 |
Family Income by Number of Earners in Water Valley
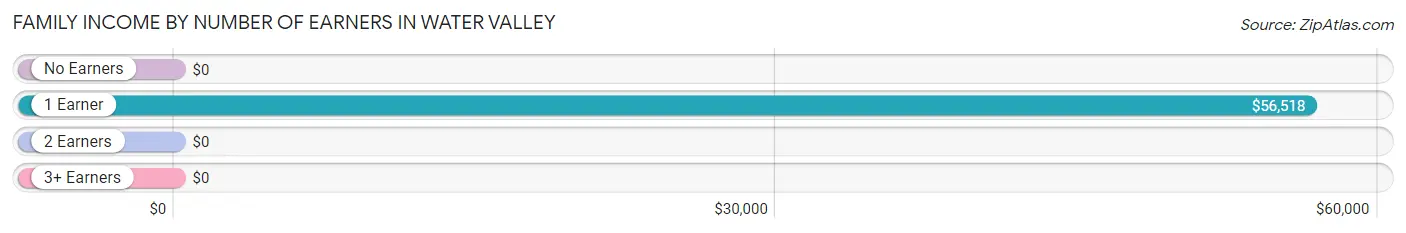
| Number of Earners | # Families | Median Income |
| No Earners | 0 (0.0%) | $0 |
| 1 Earner | 37 (100.0%) | $56,518 |
| 2 Earners | 0 (0.0%) | $0 |
| 3+ Earners | 0 (0.0%) | $0 |
| Total | 37 (100.0%) | $56,518 |
Household Income in Water Valley
Household Income Brackets in Water Valley
With 24 households falling in the category, the $50,000 to $74,999 income range is the most frequent in Water Valley, accounting for 46.2% of all households.
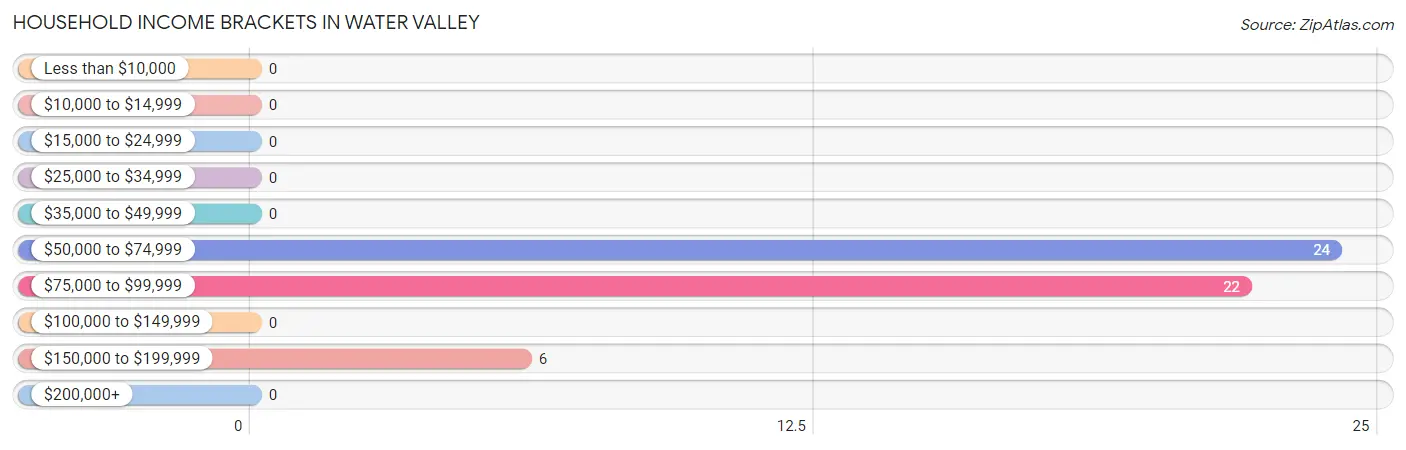
| Income Bracket | # Households | % Households |
| Less than $10,000 | 0 | 0.0% |
| $10,000 to $14,999 | 0 | 0.0% |
| $15,000 to $24,999 | 0 | 0.0% |
| $25,000 to $34,999 | 0 | 0.0% |
| $35,000 to $49,999 | 0 | 0.0% |
| $50,000 to $74,999 | 24 | 46.2% |
| $75,000 to $99,999 | 22 | 42.3% |
| $100,000 to $149,999 | 0 | 0.0% |
| $150,000 to $199,999 | 6 | 11.5% |
| $200,000+ | 0 | 0.0% |
Household Income by Householder Age in Water Valley
The median household income in Water Valley is $80,385, with the highest median household income of $56,518 found in the 65+ years age bracket for the primary householder. A total of 37 households (71.2%) fall into this category.
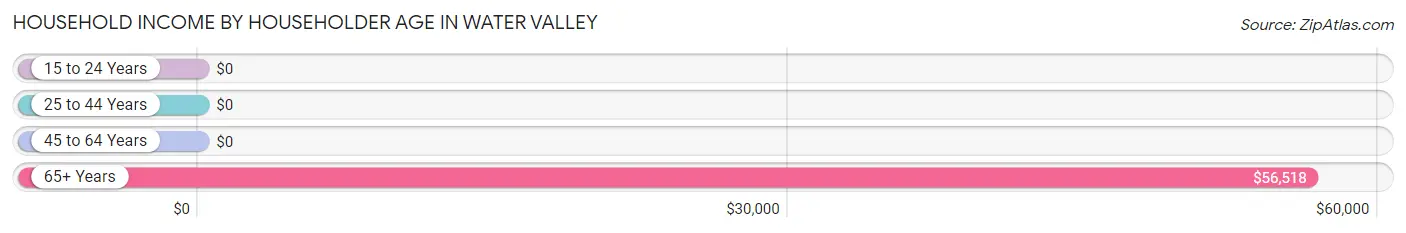
| Income Bracket | # Households | Median Income |
| 15 to 24 Years | 0 (0.0%) | $0 |
| 25 to 44 Years | 0 (0.0%) | $0 |
| 45 to 64 Years | 15 (28.8%) | $0 |
| 65+ Years | 37 (71.2%) | $56,518 |
| Total | 52 (100.0%) | $80,385 |
Poverty in Water Valley
Income Below Poverty by Sex and Age in Water Valley
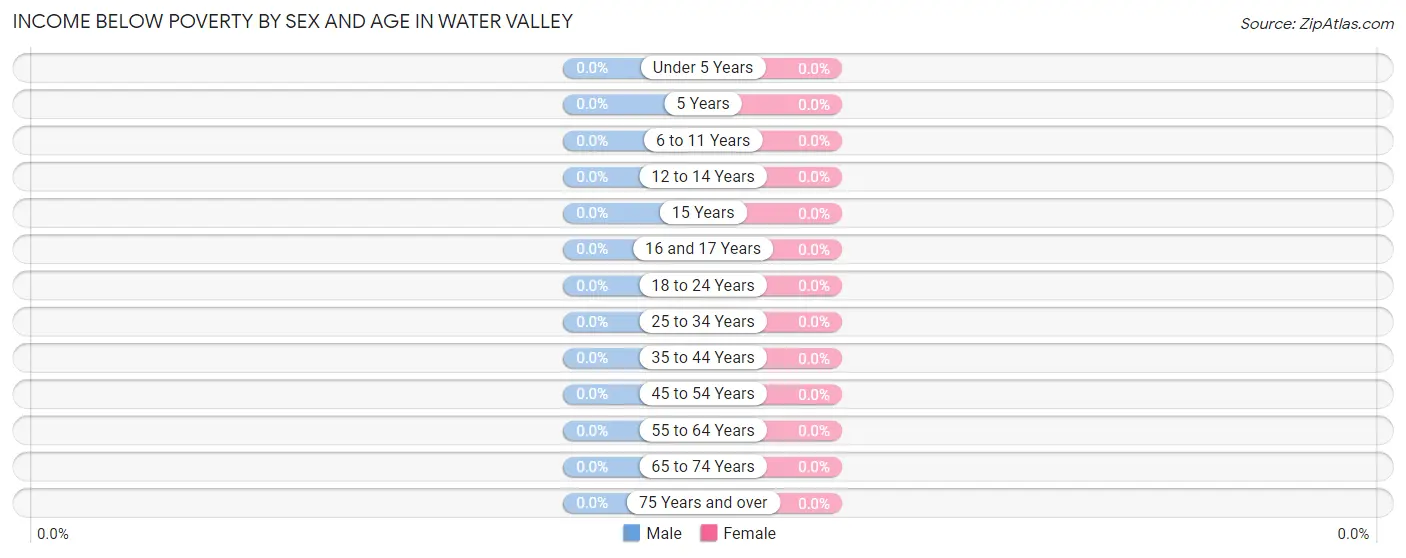
| Age Bracket | Male | Female |
| Under 5 Years | 0 (0.0%) | 0 (0.0%) |
| 5 Years | 0 (0.0%) | 0 (0.0%) |
| 6 to 11 Years | 0 (0.0%) | 0 (0.0%) |
| 12 to 14 Years | 0 (0.0%) | 0 (0.0%) |
| 15 Years | 0 (0.0%) | 0 (0.0%) |
| 16 and 17 Years | 0 (0.0%) | 0 (0.0%) |
| 18 to 24 Years | 0 (0.0%) | 0 (0.0%) |
| 25 to 34 Years | 0 (0.0%) | 0 (0.0%) |
| 35 to 44 Years | 0 (0.0%) | 0 (0.0%) |
| 45 to 54 Years | 0 (0.0%) | 0 (0.0%) |
| 55 to 64 Years | 0 (0.0%) | 0 (0.0%) |
| 65 to 74 Years | 0 (0.0%) | 0 (0.0%) |
| 75 Years and over | 0 (0.0%) | 0 (0.0%) |
| Total | 0 (0.0%) | 0 (0.0%) |
Income Above Poverty by Sex and Age in Water Valley
According to the poverty statistics in Water Valley, males aged 55 to 64 years and females aged 25 to 34 years are the age groups that are most secure financially, with 100.0% of males and 100.0% of females in these age groups living above the poverty line.
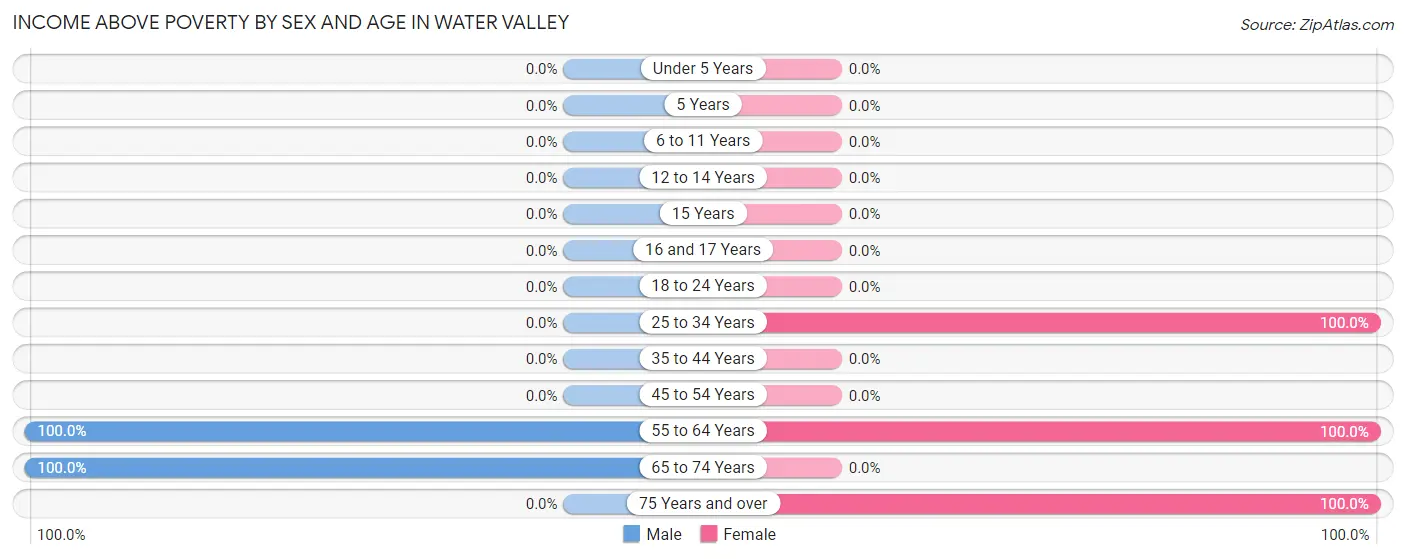
| Age Bracket | Male | Female |
| Under 5 Years | 0 (0.0%) | 0 (0.0%) |
| 5 Years | 0 (0.0%) | 0 (0.0%) |
| 6 to 11 Years | 0 (0.0%) | 0 (0.0%) |
| 12 to 14 Years | 0 (0.0%) | 0 (0.0%) |
| 15 Years | 0 (0.0%) | 0 (0.0%) |
| 16 and 17 Years | 0 (0.0%) | 0 (0.0%) |
| 18 to 24 Years | 0 (0.0%) | 0 (0.0%) |
| 25 to 34 Years | 0 (0.0%) | 7 (100.0%) |
| 35 to 44 Years | 0 (0.0%) | 0 (0.0%) |
| 45 to 54 Years | 0 (0.0%) | 0 (0.0%) |
| 55 to 64 Years | 28 (100.0%) | 6 (100.0%) |
| 65 to 74 Years | 27 (100.0%) | 0 (0.0%) |
| 75 Years and over | 0 (0.0%) | 20 (100.0%) |
| Total | 55 (100.0%) | 33 (100.0%) |
Income Below Poverty Among Married-Couple Families in Water Valley
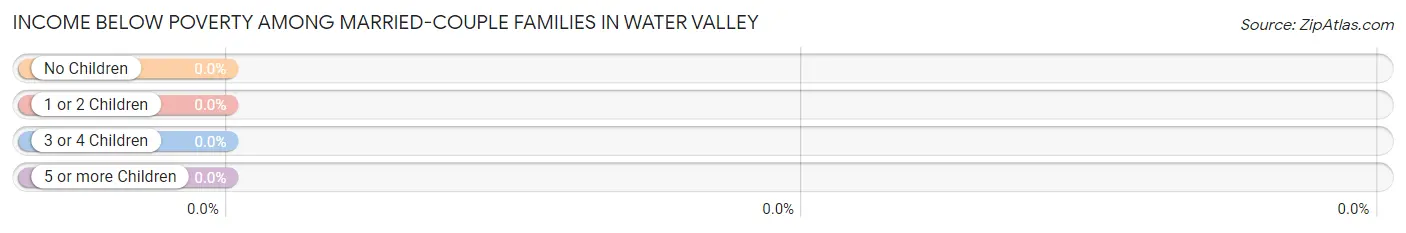
| Children | Above Poverty | Below Poverty |
| No Children | 27 (100.0%) | 0 (0.0%) |
| 1 or 2 Children | 0 (0.0%) | 0 (0.0%) |
| 3 or 4 Children | 0 (0.0%) | 0 (0.0%) |
| 5 or more Children | 0 (0.0%) | 0 (0.0%) |
| Total | 27 (100.0%) | 0 (0.0%) |
Income Below Poverty Among Single-Parent Households in Water Valley
| Children | Single Father | Single Mother |
| No Children | 0 (0.0%) | 0 (0.0%) |
| 1 or 2 Children | 0 (0.0%) | 0 (0.0%) |
| 3 or 4 Children | 0 (0.0%) | 0 (0.0%) |
| 5 or more Children | 0 (0.0%) | 0 (0.0%) |
| Total | 0 (0.0%) | 0 (0.0%) |
Income Below Poverty Among Married-Couple vs Single-Parent Households in Water Valley
| Children | Married-Couple Families | Single-Parent Households |
| No Children | 0 (0.0%) | 0 (0.0%) |
| 1 or 2 Children | 0 (0.0%) | 0 (0.0%) |
| 3 or 4 Children | 0 (0.0%) | 0 (0.0%) |
| 5 or more Children | 0 (0.0%) | 0 (0.0%) |
| Total | 0 (0.0%) | 0 (0.0%) |
Race in Water Valley
The most populous races in Water Valley are White / Caucasian (81 | 92.0%), and Asian (7 | 8.0%).
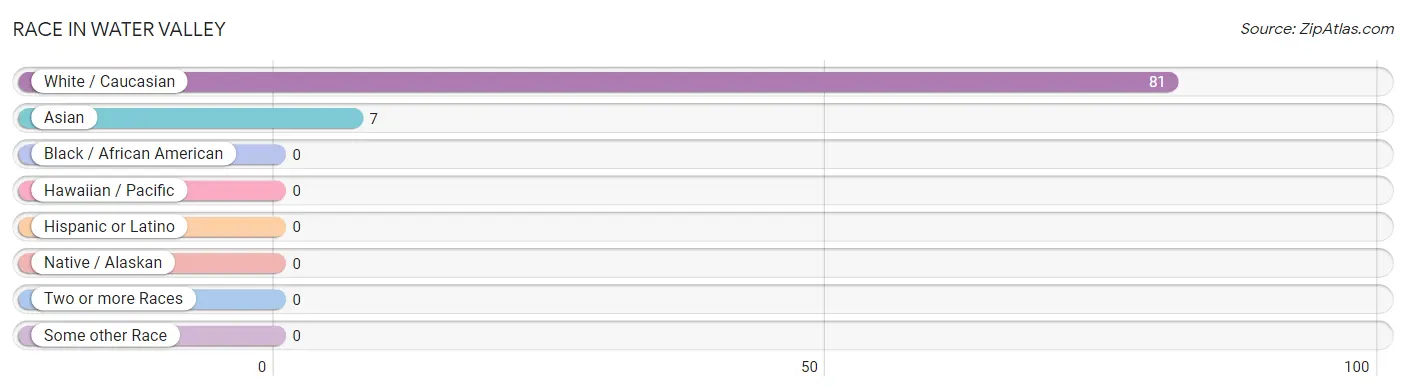
| Race | # Population | % Population |
| Asian | 7 | 8.0% |
| Black / African American | 0 | 0.0% |
| Hawaiian / Pacific | 0 | 0.0% |
| Hispanic or Latino | 0 | 0.0% |
| Native / Alaskan | 0 | 0.0% |
| White / Caucasian | 81 | 92.0% |
| Two or more Races | 0 | 0.0% |
| Some other Race | 0 | 0.0% |
| Total | 88 | 100.0% |
Ancestry in Water Valley
The most populous ancestries reported in Water Valley are American (33 | 37.5%), Irish (14 | 15.9%), English (9 | 10.2%), and Korean (7 | 8.0%), together accounting for 71.6% of all Water Valley residents.
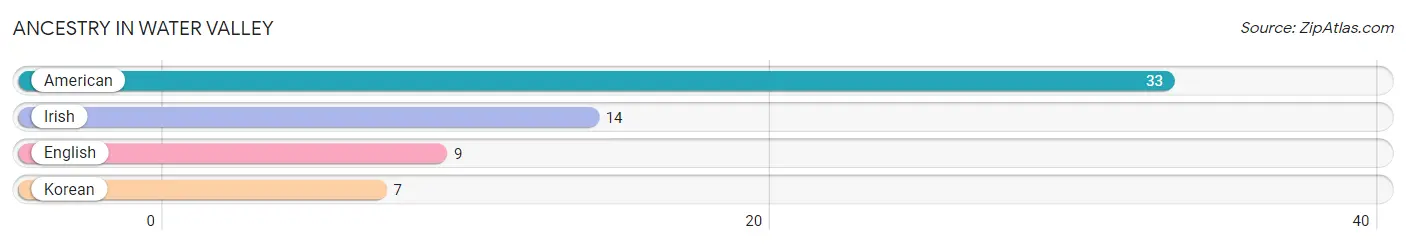
| Ancestry | # Population | % Population |
| American | 33 | 37.5% |
| English | 9 | 10.2% |
| Irish | 14 | 15.9% |
| Korean | 7 | 8.0% | View All 4 Rows |
Immigrants in Water Valley
The most numerous immigrant groups reported in Water Valley came from Asia (7 | 8.0%), Philippines (7 | 8.0%), and South Eastern Asia (7 | 8.0%), together accounting for 23.8% of all Water Valley residents.
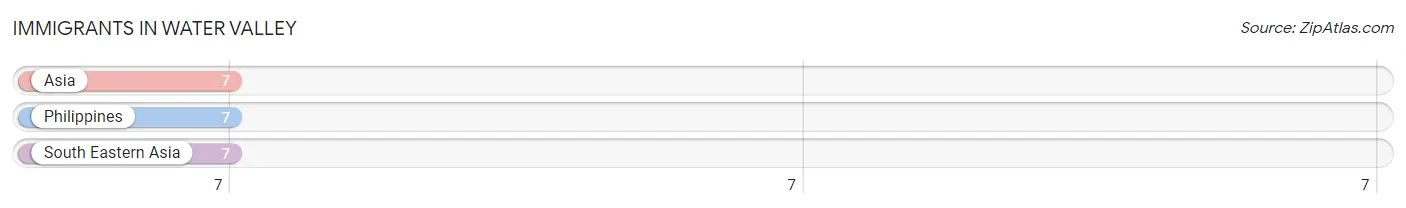
| Immigration Origin | # Population | % Population |
| Asia | 7 | 8.0% |
| Philippines | 7 | 8.0% |
| South Eastern Asia | 7 | 8.0% | View All 3 Rows |
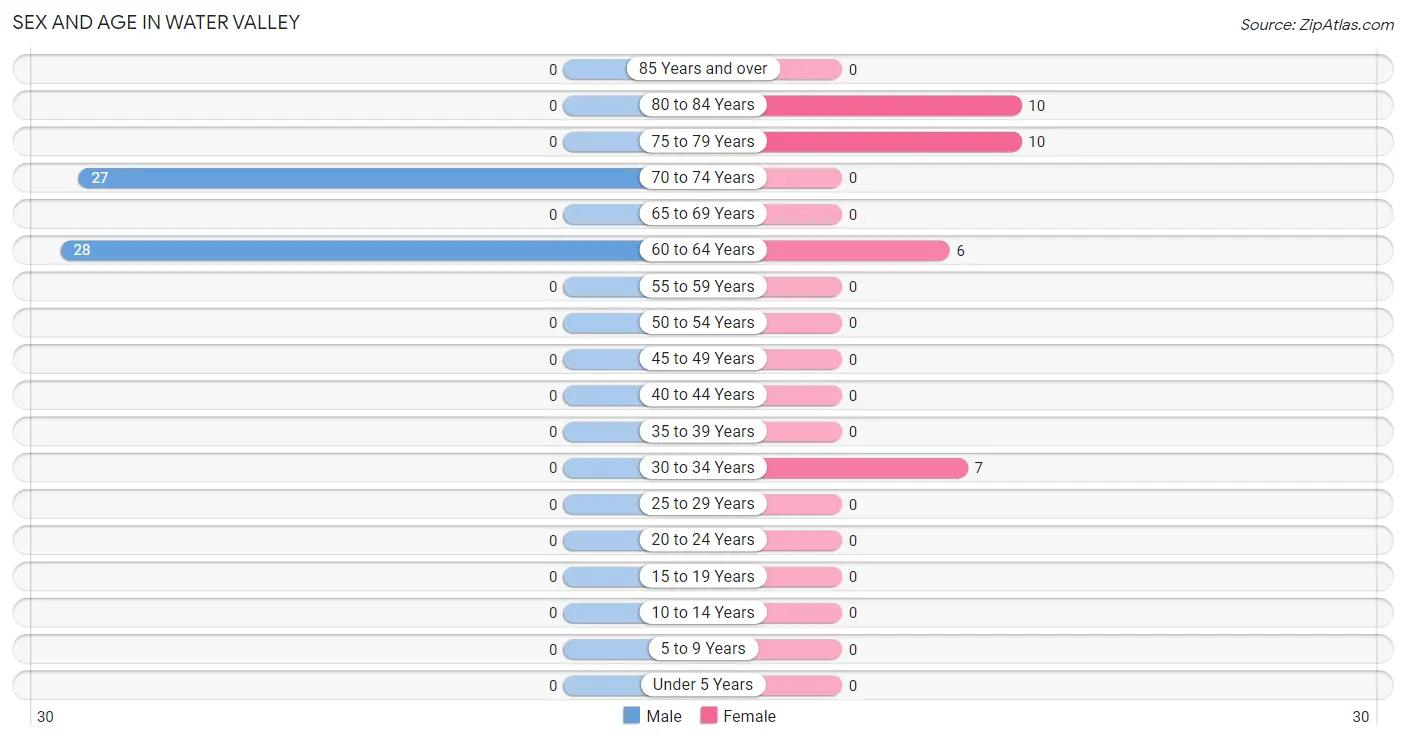
Sex and Age in Water Valley
Sex and Age in Water Valley
The most populous age groups in Water Valley are 60 to 64 Years (28 | 50.9%) for men and 75 to 79 Years (10 | 30.3%) for women.
| Age Bracket | Male | Female |
| Under 5 Years | 0 (0.0%) | 0 (0.0%) |
| 5 to 9 Years | 0 (0.0%) | 0 (0.0%) |
| 10 to 14 Years | 0 (0.0%) | 0 (0.0%) |
| 15 to 19 Years | 0 (0.0%) | 0 (0.0%) |
| 20 to 24 Years | 0 (0.0%) | 0 (0.0%) |
| 25 to 29 Years | 0 (0.0%) | 0 (0.0%) |
| 30 to 34 Years | 0 (0.0%) | 7 (21.2%) |
| 35 to 39 Years | 0 (0.0%) | 0 (0.0%) |
| 40 to 44 Years | 0 (0.0%) | 0 (0.0%) |
| 45 to 49 Years | 0 (0.0%) | 0 (0.0%) |
| 50 to 54 Years | 0 (0.0%) | 0 (0.0%) |
| 55 to 59 Years | 0 (0.0%) | 0 (0.0%) |
| 60 to 64 Years | 28 (50.9%) | 6 (18.2%) |
| 65 to 69 Years | 0 (0.0%) | 0 (0.0%) |
| 70 to 74 Years | 27 (49.1%) | 0 (0.0%) |
| 75 to 79 Years | 0 (0.0%) | 10 (30.3%) |
| 80 to 84 Years | 0 (0.0%) | 10 (30.3%) |
| 85 Years and over | 0 (0.0%) | 0 (0.0%) |
| Total | 55 (100.0%) | 33 (100.0%) |
Families and Households in Water Valley
Median Family Size in Water Valley
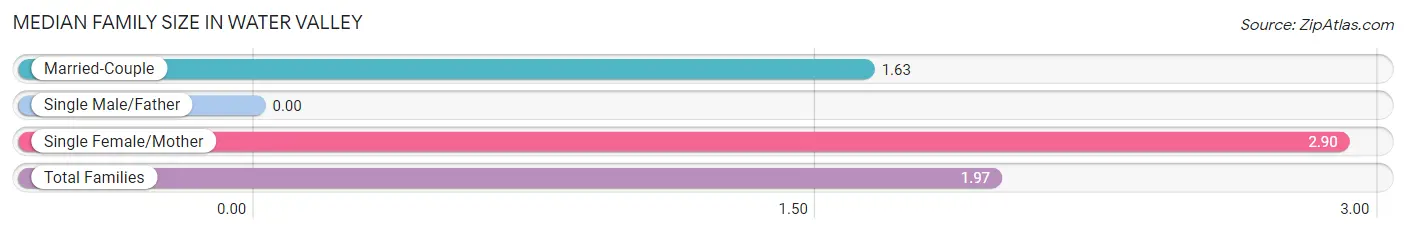
| Family Type | # Families | Family Size |
| Married-Couple | 27 (73.0%) | 1.63 |
| Single Male/Father | 0 (0.0%) | - |
| Single Female/Mother | 10 (27.0%) | 2.90 |
| Total Families | 37 (100.0%) | 1.97 |
Median Household Size in Water Valley
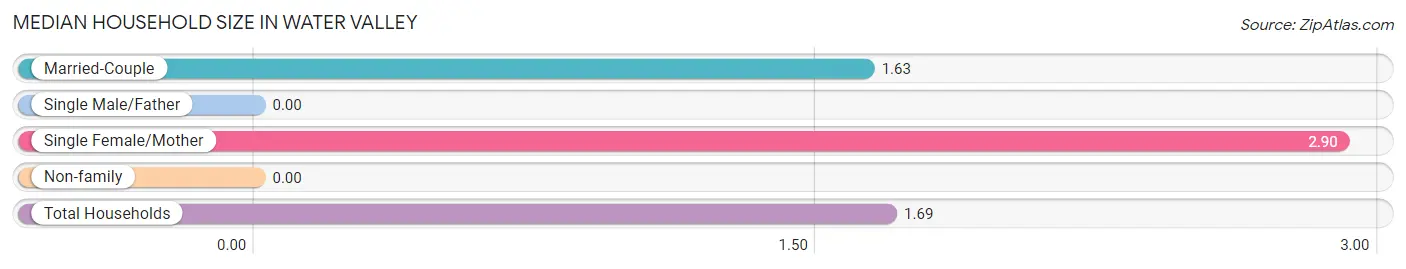
| Household Type | # Households | Household Size |
| Married-Couple | 27 (51.9%) | 1.63 |
| Single Male/Father | 0 (0.0%) | - |
| Single Female/Mother | 10 (19.2%) | 2.90 |
| Non-family | 15 (28.8%) | - |
| Total Households | 52 (100.0%) | 1.69 |
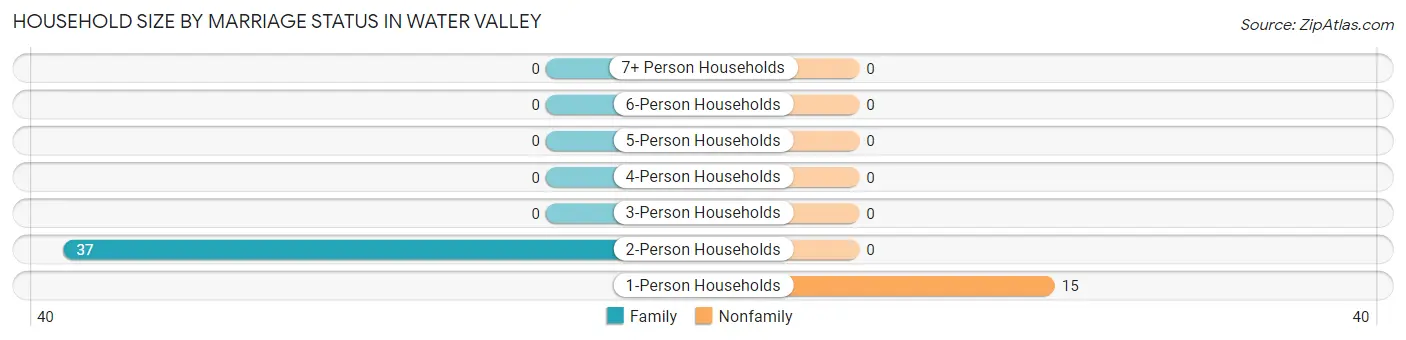
Household Size by Marriage Status in Water Valley
Out of a total of 52 households in Water Valley, 37 (71.2%) are family households, while 15 (28.8%) are nonfamily households. The most numerous type of family households are 2-person households, comprising 37, and the most common type of nonfamily households are 1-person households, comprising 15.
| Household Size | Family Households | Nonfamily Households |
| 1-Person Households | - | 15 (28.8%) |
| 2-Person Households | 37 (71.2%) | 0 (0.0%) |
| 3-Person Households | 0 (0.0%) | 0 (0.0%) |
| 4-Person Households | 0 (0.0%) | 0 (0.0%) |
| 5-Person Households | 0 (0.0%) | 0 (0.0%) |
| 6-Person Households | 0 (0.0%) | 0 (0.0%) |
| 7+ Person Households | 0 (0.0%) | 0 (0.0%) |
| Total | 37 (71.2%) | 15 (28.8%) |
Female Fertility in Water Valley
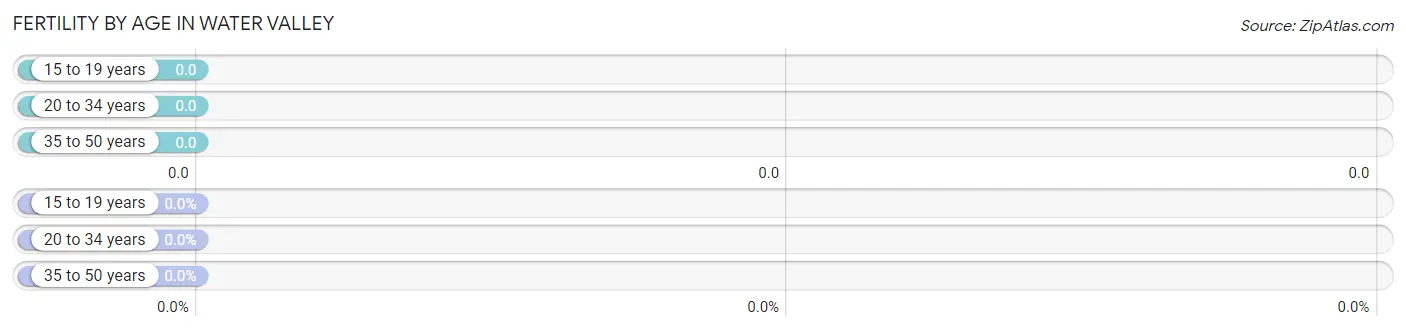
Fertility by Age in Water Valley
| Age Bracket | Women with Births | Births / 1,000 Women |
| 15 to 19 years | 0 (0.0%) | 0.0 |
| 20 to 34 years | 0 (0.0%) | 0.0 |
| 35 to 50 years | 0 (0.0%) | 0.0 |
| Total | 0 (0.0%) | 0.0 |
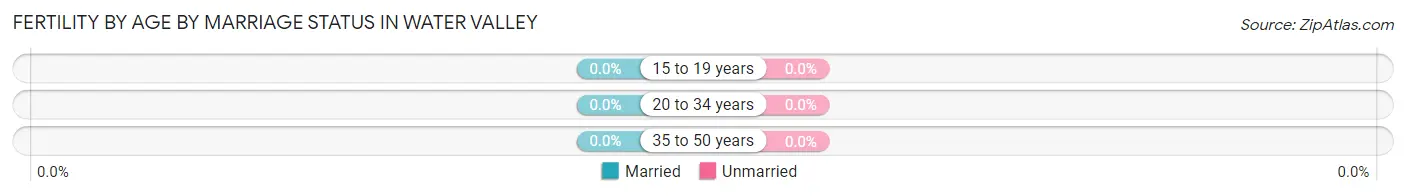
Fertility by Age by Marriage Status in Water Valley
| Age Bracket | Married | Unmarried |
| 15 to 19 years | 0 (0.0%) | 0 (0.0%) |
| 20 to 34 years | 0 (0.0%) | 0 (0.0%) |
| 35 to 50 years | 0 (0.0%) | 0 (0.0%) |
| Total | 0 (0.0%) | 0 (0.0%) |
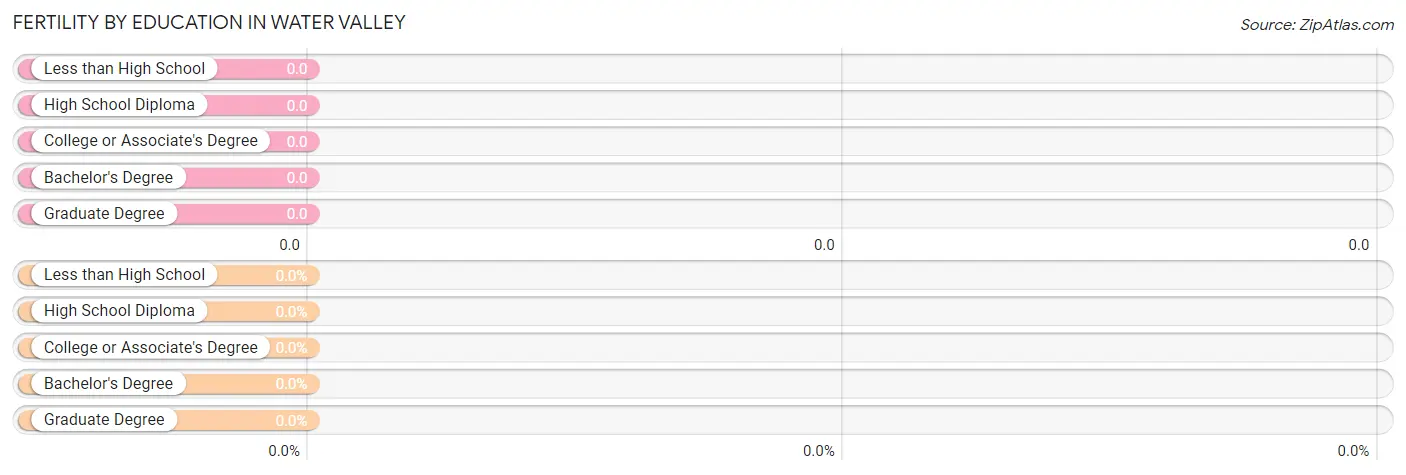
Fertility by Education in Water Valley
| Educational Attainment | Women with Births | Births / 1,000 Women |
| Less than High School | 0 (0.0%) | 0.0 |
| High School Diploma | 0 (0.0%) | 0.0 |
| College or Associate's Degree | 0 (0.0%) | 0.0 |
| Bachelor's Degree | 0 (0.0%) | 0.0 |
| Graduate Degree | 0 (0.0%) | 0.0 |
| Total | 0 (0.0%) | 0.0 |
Fertility by Education by Marriage Status in Water Valley
| Educational Attainment | Married | Unmarried |
| Less than High School | 0 (0.0%) | 0 (0.0%) |
| High School Diploma | 0 (0.0%) | 0 (0.0%) |
| College or Associate's Degree | 0 (0.0%) | 0 (0.0%) |
| Bachelor's Degree | 0 (0.0%) | 0 (0.0%) |
| Graduate Degree | 0 (0.0%) | 0 (0.0%) |
| Total | 0 (0.0%) | 0 (0.0%) |
Employment Characteristics in Water Valley
Employment by Class of Employer in Water Valley
Among the 54 employed individuals in Water Valley, private company employees (41 | 75.9%), and not-for-profit organizations (13 | 24.1%) make up the most common classes of employment.
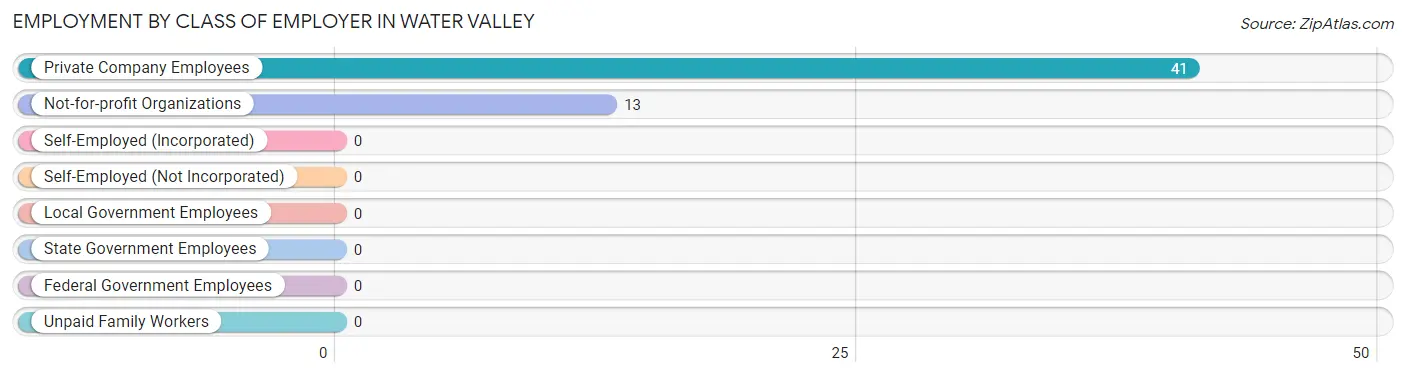
| Employer Class | # Employees | % Employees |
| Private Company Employees | 41 | 75.9% |
| Self-Employed (Incorporated) | 0 | 0.0% |
| Self-Employed (Not Incorporated) | 0 | 0.0% |
| Not-for-profit Organizations | 13 | 24.1% |
| Local Government Employees | 0 | 0.0% |
| State Government Employees | 0 | 0.0% |
| Federal Government Employees | 0 | 0.0% |
| Unpaid Family Workers | 0 | 0.0% |
| Total | 54 | 100.0% |
Employment Status by Age in Water Valley
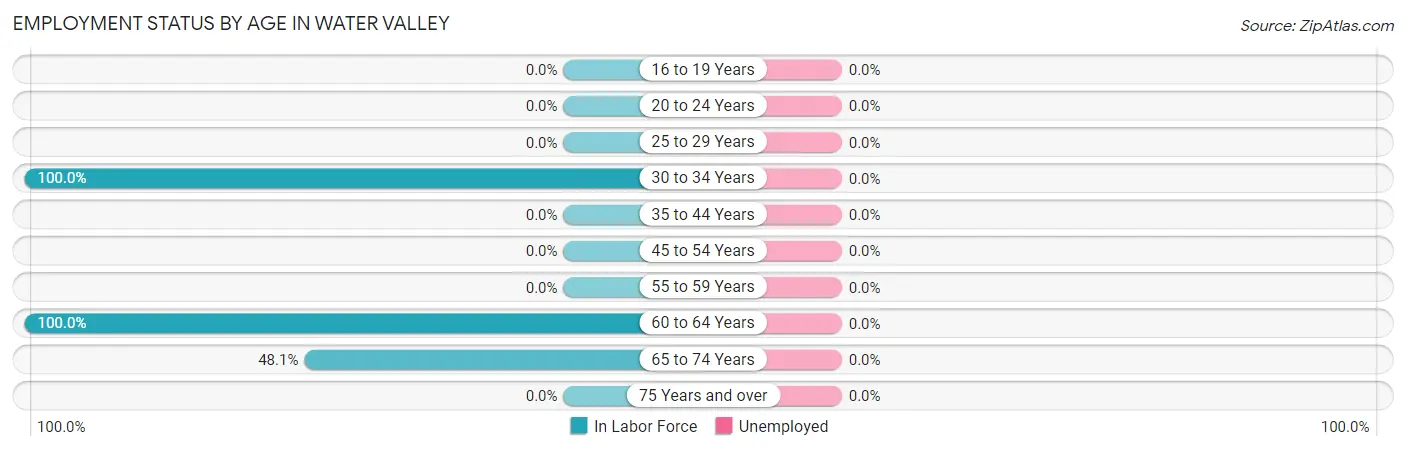
| Age Bracket | In Labor Force | Unemployed |
| 16 to 19 Years | 0 (0.0%) | 0 (0.0%) |
| 20 to 24 Years | 0 (0.0%) | 0 (0.0%) |
| 25 to 29 Years | 0 (0.0%) | 0 (0.0%) |
| 30 to 34 Years | 7 (100.0%) | 0 (0.0%) |
| 35 to 44 Years | 0 (0.0%) | 0 (0.0%) |
| 45 to 54 Years | 0 (0.0%) | 0 (0.0%) |
| 55 to 59 Years | 0 (0.0%) | 0 (0.0%) |
| 60 to 64 Years | 34 (100.0%) | 0 (0.0%) |
| 65 to 74 Years | 13 (48.1%) | 0 (0.0%) |
| 75 Years and over | 0 (0.0%) | 0 (0.0%) |
| Total | 54 (61.4%) | 0 (0.0%) |
Employment Status by Educational Attainment in Water Valley
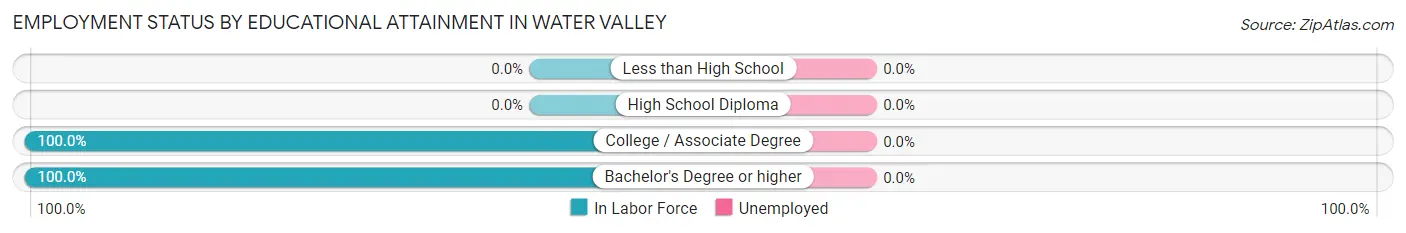
| Educational Attainment | In Labor Force | Unemployed |
| Less than High School | 0 (0.0%) | 0 (0.0%) |
| High School Diploma | 0 (0.0%) | 0 (0.0%) |
| College / Associate Degree | 35 (100.0%) | 0 (0.0%) |
| Bachelor's Degree or higher | 6 (100.0%) | 0 (0.0%) |
| Total | 41 (100.0%) | 0 (0.0%) |
Employment Occupations by Sex in Water Valley
Management, Business, Science and Arts Occupations
Management, Business, Science and Arts Occupations by Sex
| Occupation | Male | Female |
| Management | 0 (0.0%) | 0 (0.0%) |
| Business & Financial | 0 (0.0%) | 0 (0.0%) |
| Computers, Engineering & Science | 0 (0.0%) | 0 (0.0%) |
| Computers & Mathematics | 0 (0.0%) | 0 (0.0%) |
| Architecture & Engineering | 0 (0.0%) | 0 (0.0%) |
| Life, Physical & Social Science | 0 (0.0%) | 0 (0.0%) |
| Community & Social Service | 0 (0.0%) | 0 (0.0%) |
| Education, Arts & Media | 0 (0.0%) | 0 (0.0%) |
| Legal Services & Support | 0 (0.0%) | 0 (0.0%) |
| Education Instruction & Library | 0 (0.0%) | 0 (0.0%) |
| Arts, Media & Entertainment | 0 (0.0%) | 0 (0.0%) |
| Health Diagnosing & Treating | 0 (0.0%) | 0 (0.0%) |
| Health Technologists | 0 (0.0%) | 0 (0.0%) |
| Total (Category) | 0 (0.0%) | 0 (0.0%) |
| Total (Overall) | 41 (75.9%) | 13 (24.1%) |
Services Occupations
The most common Services occupations in Water Valley are , and Cleaning & Maintenance (16 | 29.6%).
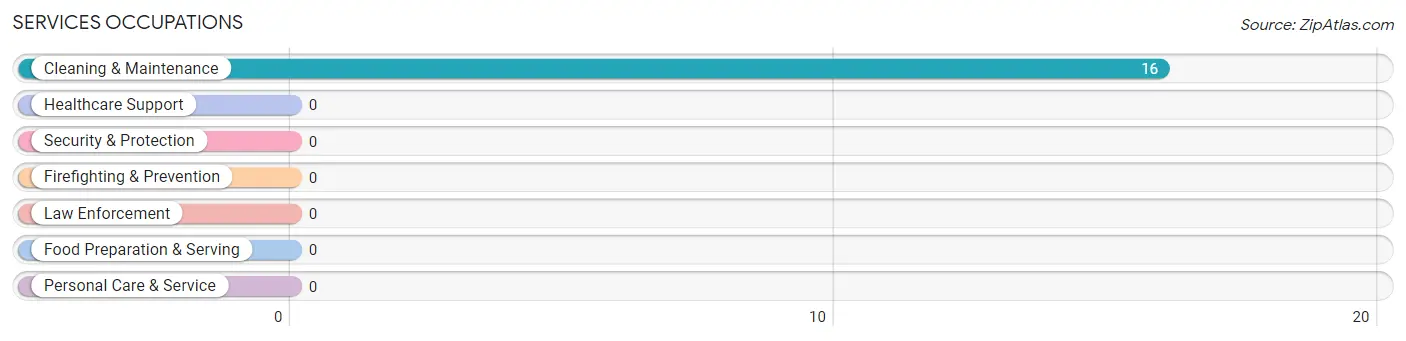
Services Occupations by Sex
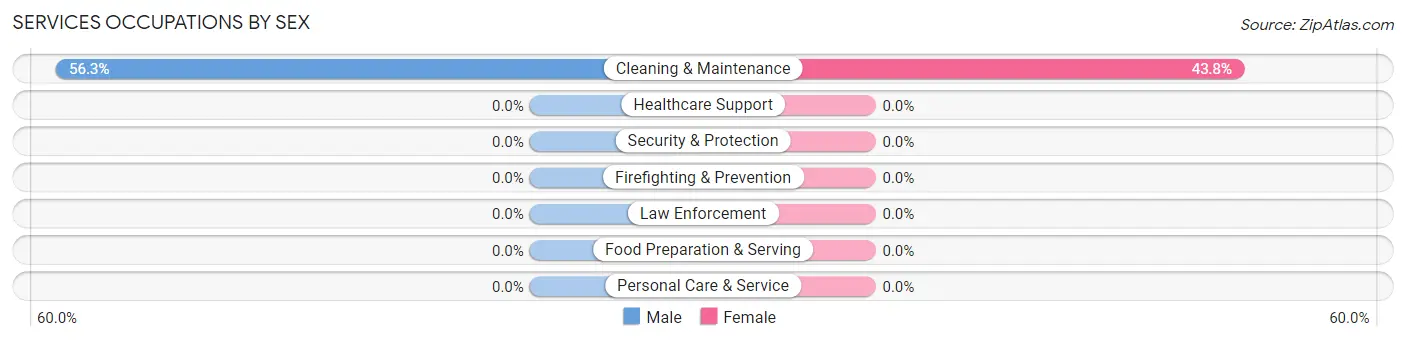
| Occupation | Male | Female |
| Healthcare Support | 0 (0.0%) | 0 (0.0%) |
| Security & Protection | 0 (0.0%) | 0 (0.0%) |
| Firefighting & Prevention | 0 (0.0%) | 0 (0.0%) |
| Law Enforcement | 0 (0.0%) | 0 (0.0%) |
| Food Preparation & Serving | 0 (0.0%) | 0 (0.0%) |
| Cleaning & Maintenance | 9 (56.2%) | 7 (43.8%) |
| Personal Care & Service | 0 (0.0%) | 0 (0.0%) |
| Total (Category) | 9 (56.2%) | 7 (43.8%) |
| Total (Overall) | 41 (75.9%) | 13 (24.1%) |
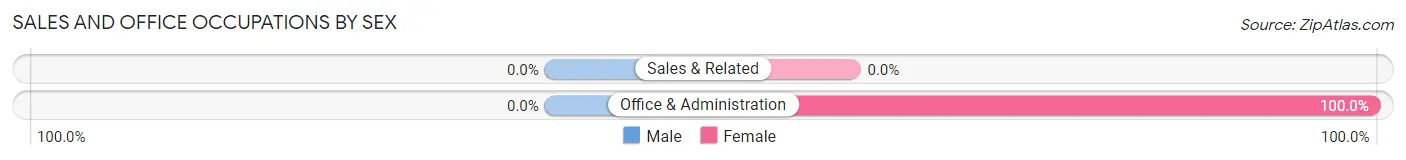
Sales and Office Occupations
The most common Sales and Office occupations in Water Valley are , and Office & Administration (6 | 11.1%).
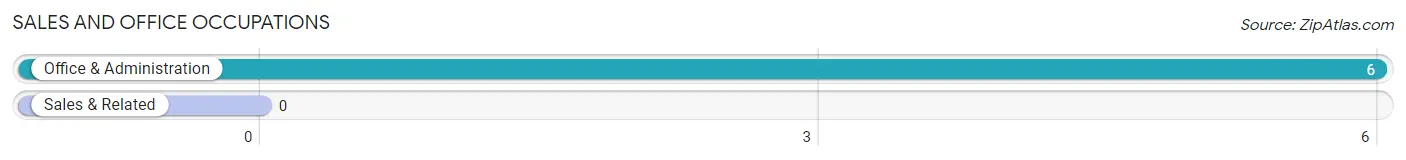
Sales and Office Occupations by Sex
| Occupation | Male | Female |
| Sales & Related | 0 (0.0%) | 0 (0.0%) |
| Office & Administration | 0 (0.0%) | 6 (100.0%) |
| Total (Category) | 0 (0.0%) | 6 (100.0%) |
| Total (Overall) | 41 (75.9%) | 13 (24.1%) |
Natural Resources, Construction and Maintenance Occupations
The most common Natural Resources, Construction and Maintenance occupations in Water Valley are , and Construction & Extraction (13 | 24.1%).
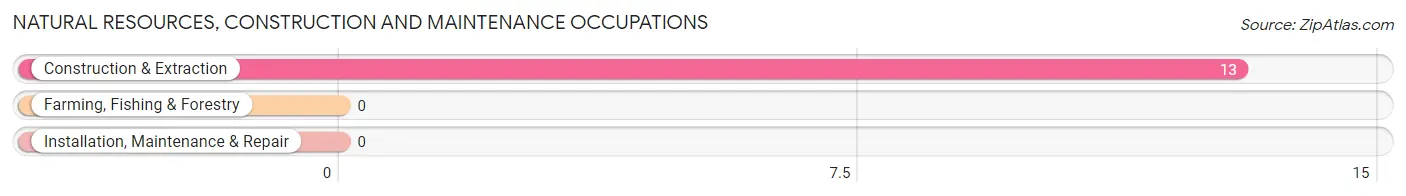
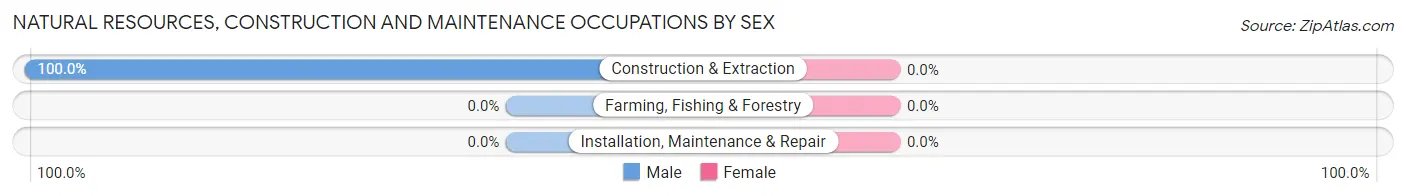
Natural Resources, Construction and Maintenance Occupations by Sex
| Occupation | Male | Female |
| Farming, Fishing & Forestry | 0 (0.0%) | 0 (0.0%) |
| Construction & Extraction | 13 (100.0%) | 0 (0.0%) |
| Installation, Maintenance & Repair | 0 (0.0%) | 0 (0.0%) |
| Total (Category) | 13 (100.0%) | 0 (0.0%) |
| Total (Overall) | 41 (75.9%) | 13 (24.1%) |
Production, Transportation and Moving Occupations
The most common Production, Transportation and Moving occupations in Water Valley are , and Production (19 | 35.2%).
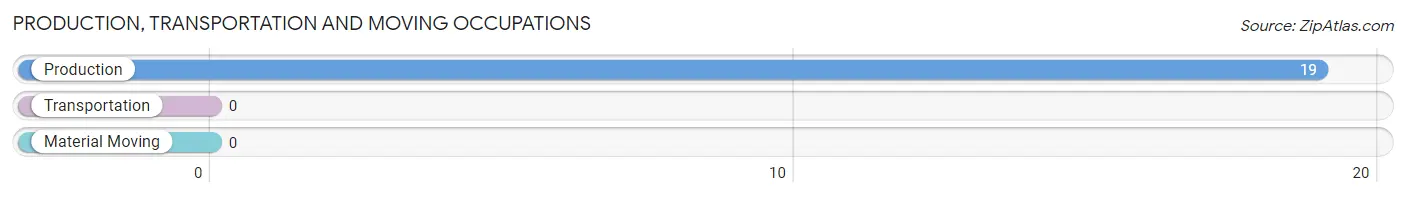
Production, Transportation and Moving Occupations by Sex
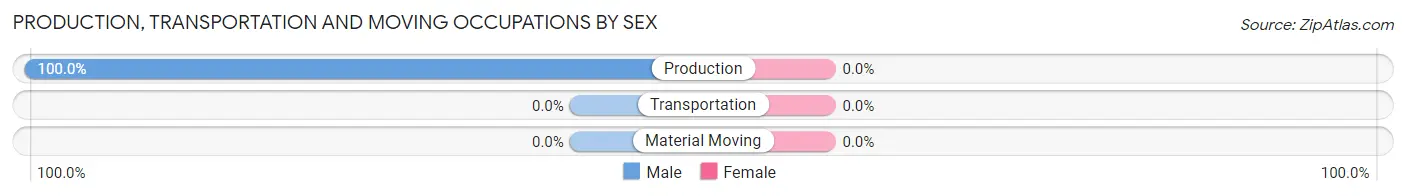
| Occupation | Male | Female |
| Production | 19 (100.0%) | 0 (0.0%) |
| Transportation | 0 (0.0%) | 0 (0.0%) |
| Material Moving | 0 (0.0%) | 0 (0.0%) |
| Total (Category) | 19 (100.0%) | 0 (0.0%) |
| Total (Overall) | 41 (75.9%) | 13 (24.1%) |
Employment Industries by Sex in Water Valley
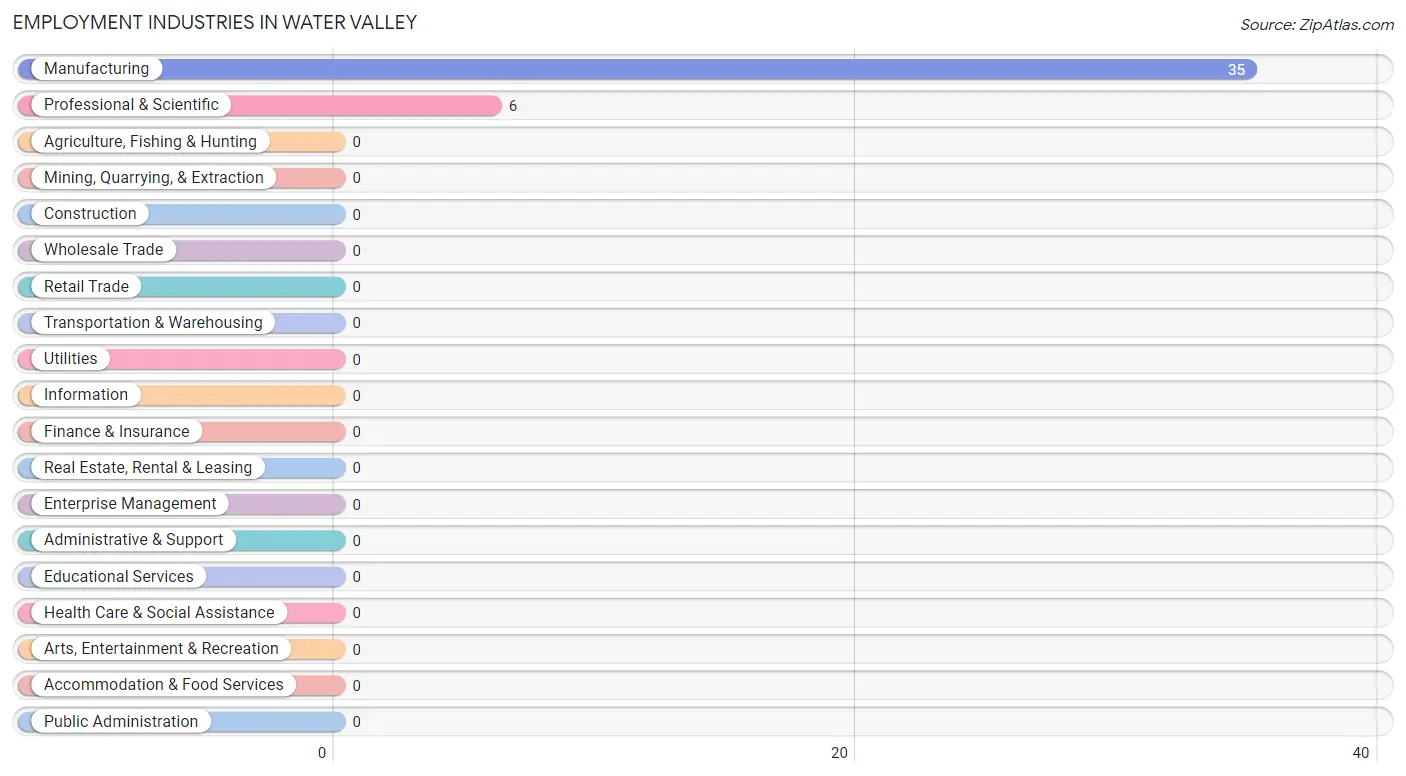
Employment Industries in Water Valley
The major employment industries in Water Valley include Manufacturing (35 | 64.8%), and Professional & Scientific (6 | 11.1%).
Employment Industries by Sex in Water Valley
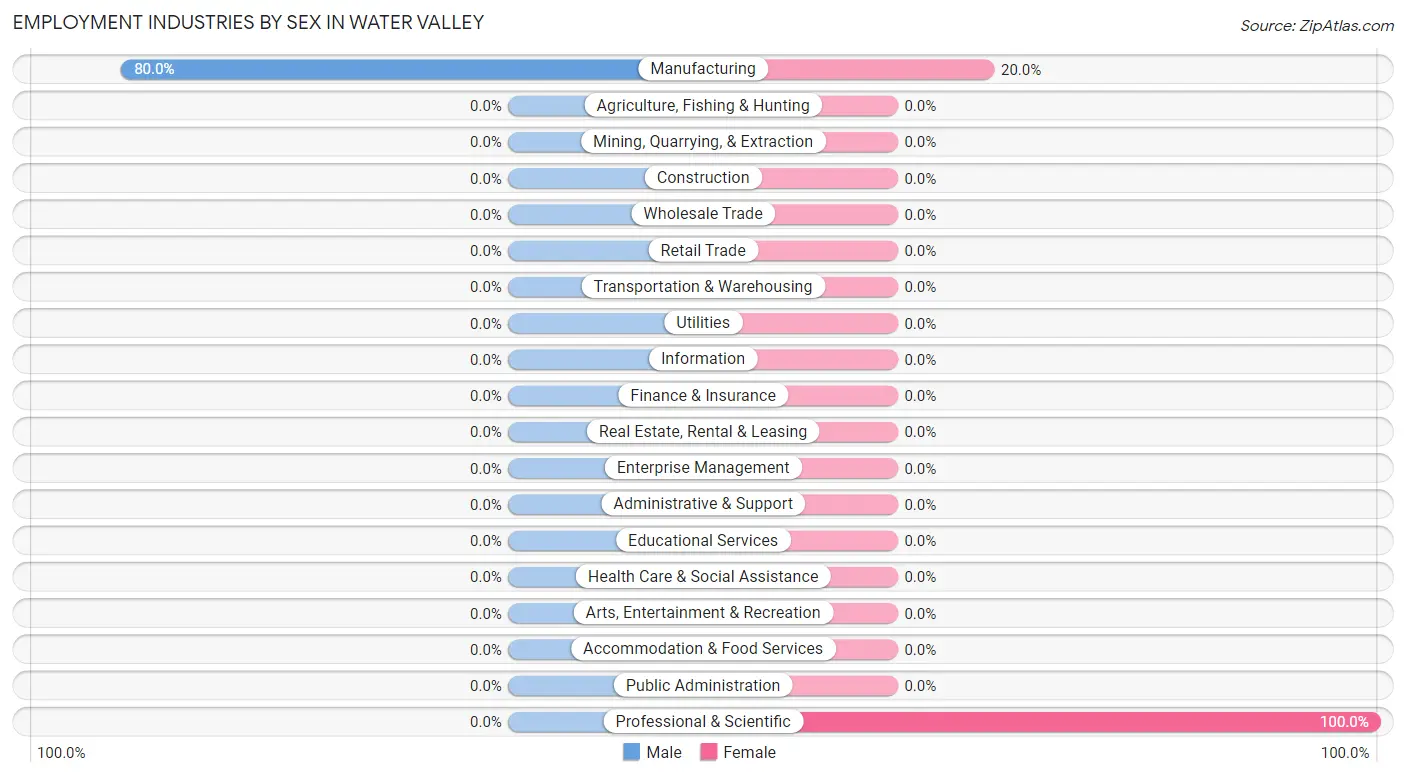
| Industry | Male | Female |
| Agriculture, Fishing & Hunting | 0 (0.0%) | 0 (0.0%) |
| Mining, Quarrying, & Extraction | 0 (0.0%) | 0 (0.0%) |
| Construction | 0 (0.0%) | 0 (0.0%) |
| Manufacturing | 28 (80.0%) | 7 (20.0%) |
| Wholesale Trade | 0 (0.0%) | 0 (0.0%) |
| Retail Trade | 0 (0.0%) | 0 (0.0%) |
| Transportation & Warehousing | 0 (0.0%) | 0 (0.0%) |
| Utilities | 0 (0.0%) | 0 (0.0%) |
| Information | 0 (0.0%) | 0 (0.0%) |
| Finance & Insurance | 0 (0.0%) | 0 (0.0%) |
| Real Estate, Rental & Leasing | 0 (0.0%) | 0 (0.0%) |
| Professional & Scientific | 0 (0.0%) | 6 (100.0%) |
| Enterprise Management | 0 (0.0%) | 0 (0.0%) |
| Administrative & Support | 0 (0.0%) | 0 (0.0%) |
| Educational Services | 0 (0.0%) | 0 (0.0%) |
| Health Care & Social Assistance | 0 (0.0%) | 0 (0.0%) |
| Arts, Entertainment & Recreation | 0 (0.0%) | 0 (0.0%) |
| Accommodation & Food Services | 0 (0.0%) | 0 (0.0%) |
| Public Administration | 0 (0.0%) | 0 (0.0%) |
| Total | 41 (75.9%) | 13 (24.1%) |
Education in Water Valley
School Enrollment in Water Valley
| School Level | # Students | % Students |
| Nursery / Preschool | 0 | 0.0% |
| Kindergarten | 0 | 0.0% |
| Elementary School | 0 | 0.0% |
| Middle School | 0 | 0.0% |
| High School | 0 | 0.0% |
| College / Undergraduate | 0 | 0.0% |
| Graduate / Professional | 0 | 0.0% |
| Total | 0 | 0.0% |
School Enrollment by Age by Funding Source in Water Valley
| Age Bracket | Public School | Private School |
| 3 to 4 Year Olds | 0 (0.0%) | 0 (0.0%) |
| 5 to 9 Year Old | 0 (0.0%) | 0 (0.0%) |
| 10 to 14 Year Olds | 0 (0.0%) | 0 (0.0%) |
| 15 to 17 Year Olds | 0 (0.0%) | 0 (0.0%) |
| 18 to 19 Year Olds | 0 (0.0%) | 0 (0.0%) |
| 20 to 24 Year Olds | 0 (0.0%) | 0 (0.0%) |
| 25 to 34 Year Olds | 0 (0.0%) | 0 (0.0%) |
| 35 Years and over | 0 (0.0%) | 0 (0.0%) |
| Total | 0 (0.0%) | 0 (0.0%) |
Educational Attainment by Field of Study in Water Valley
, and arts & humanities (6 | 100.0%) are the most common fields of study among 6 individuals in Water Valley who have obtained a bachelor's degree or higher.
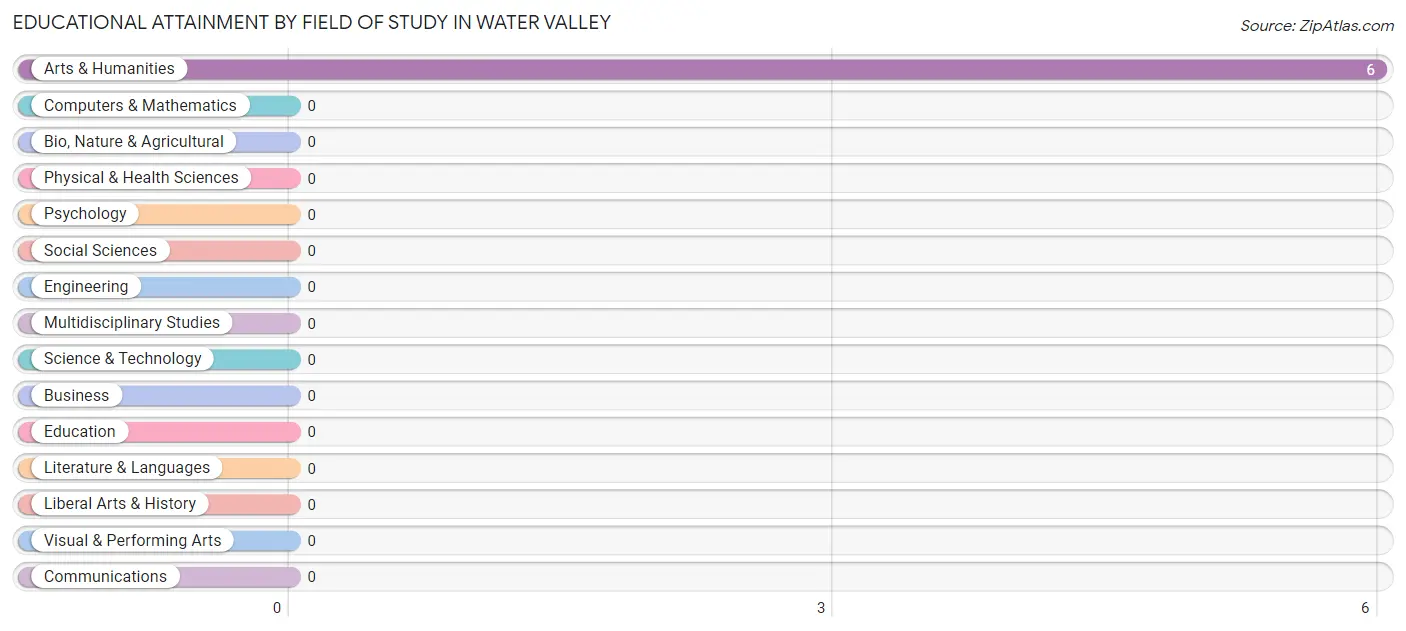
| Field of Study | # Graduates | % Graduates |
| Computers & Mathematics | 0 | 0.0% |
| Bio, Nature & Agricultural | 0 | 0.0% |
| Physical & Health Sciences | 0 | 0.0% |
| Psychology | 0 | 0.0% |
| Social Sciences | 0 | 0.0% |
| Engineering | 0 | 0.0% |
| Multidisciplinary Studies | 0 | 0.0% |
| Science & Technology | 0 | 0.0% |
| Business | 0 | 0.0% |
| Education | 0 | 0.0% |
| Literature & Languages | 0 | 0.0% |
| Liberal Arts & History | 0 | 0.0% |
| Visual & Performing Arts | 0 | 0.0% |
| Communications | 0 | 0.0% |
| Arts & Humanities | 6 | 100.0% |
| Total | 6 | 100.0% |
Transportation & Commute in Water Valley
Vehicle Availability by Sex in Water Valley
The most prevalent vehicle ownership categories in Water Valley are males with 2 vehicles (22, accounting for 53.7%) and females with 2 vehicles (13, making up 169.2%).
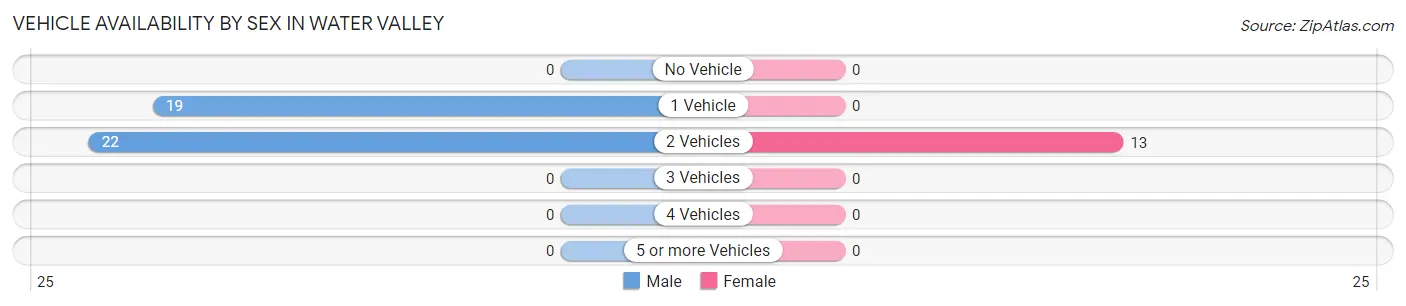
| Vehicles Available | Male | Female |
| No Vehicle | 0 (0.0%) | 0 (0.0%) |
| 1 Vehicle | 19 (46.3%) | 0 (0.0%) |
| 2 Vehicles | 22 (53.7%) | 13 (100.0%) |
| 3 Vehicles | 0 (0.0%) | 0 (0.0%) |
| 4 Vehicles | 0 (0.0%) | 0 (0.0%) |
| 5 or more Vehicles | 0 (0.0%) | 0 (0.0%) |
| Total | 41 (100.0%) | 13 (100.0%) |
Commute Time in Water Valley
The most frequently occuring commute durations in Water Valley are 35 to 39 minutes (19 commuters, 35.2%), less than 5 minutes (13 commuters, 24.1%), and 20 to 24 minutes (9 commuters, 16.7%).
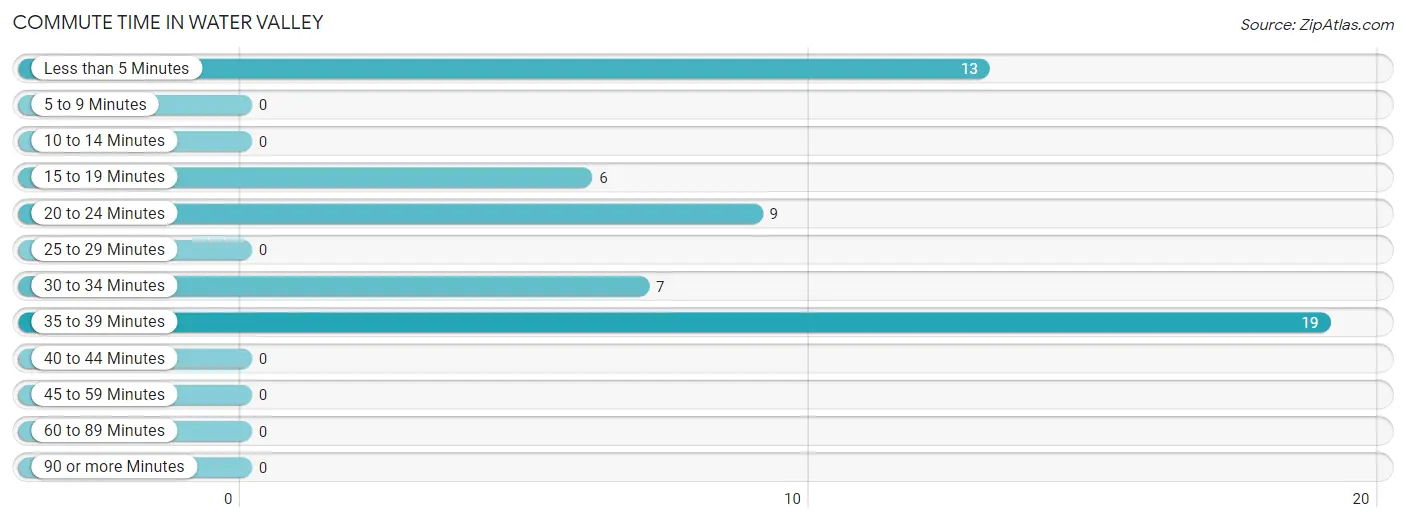
| Commute Time | # Commuters | % Commuters |
| Less than 5 Minutes | 13 | 24.1% |
| 5 to 9 Minutes | 0 | 0.0% |
| 10 to 14 Minutes | 0 | 0.0% |
| 15 to 19 Minutes | 6 | 11.1% |
| 20 to 24 Minutes | 9 | 16.7% |
| 25 to 29 Minutes | 0 | 0.0% |
| 30 to 34 Minutes | 7 | 13.0% |
| 35 to 39 Minutes | 19 | 35.2% |
| 40 to 44 Minutes | 0 | 0.0% |
| 45 to 59 Minutes | 0 | 0.0% |
| 60 to 89 Minutes | 0 | 0.0% |
| 90 or more Minutes | 0 | 0.0% |
Commute Time by Sex in Water Valley
The most common commute times in Water Valley are 35 to 39 minutes (19 commuters, 46.3%) for males and 30 to 34 minutes (7 commuters, 53.8%) for females.
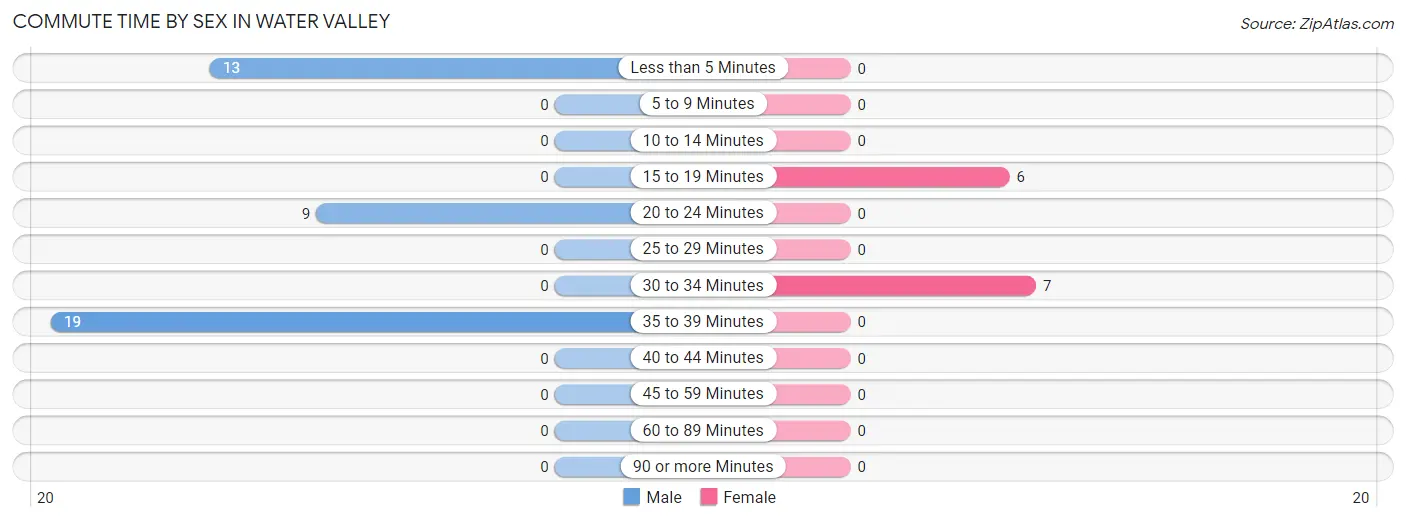
| Commute Time | Male | Female |
| Less than 5 Minutes | 13 (31.7%) | 0 (0.0%) |
| 5 to 9 Minutes | 0 (0.0%) | 0 (0.0%) |
| 10 to 14 Minutes | 0 (0.0%) | 0 (0.0%) |
| 15 to 19 Minutes | 0 (0.0%) | 6 (46.2%) |
| 20 to 24 Minutes | 9 (22.0%) | 0 (0.0%) |
| 25 to 29 Minutes | 0 (0.0%) | 0 (0.0%) |
| 30 to 34 Minutes | 0 (0.0%) | 7 (53.8%) |
| 35 to 39 Minutes | 19 (46.3%) | 0 (0.0%) |
| 40 to 44 Minutes | 0 (0.0%) | 0 (0.0%) |
| 45 to 59 Minutes | 0 (0.0%) | 0 (0.0%) |
| 60 to 89 Minutes | 0 (0.0%) | 0 (0.0%) |
| 90 or more Minutes | 0 (0.0%) | 0 (0.0%) |
Time of Departure to Work by Sex in Water Valley
The most frequent times of departure to work in Water Valley are 4:00 PM to 11:59 PM (19, 46.3%) for males and 12:00 PM to 3:59 PM (7, 53.8%) for females.
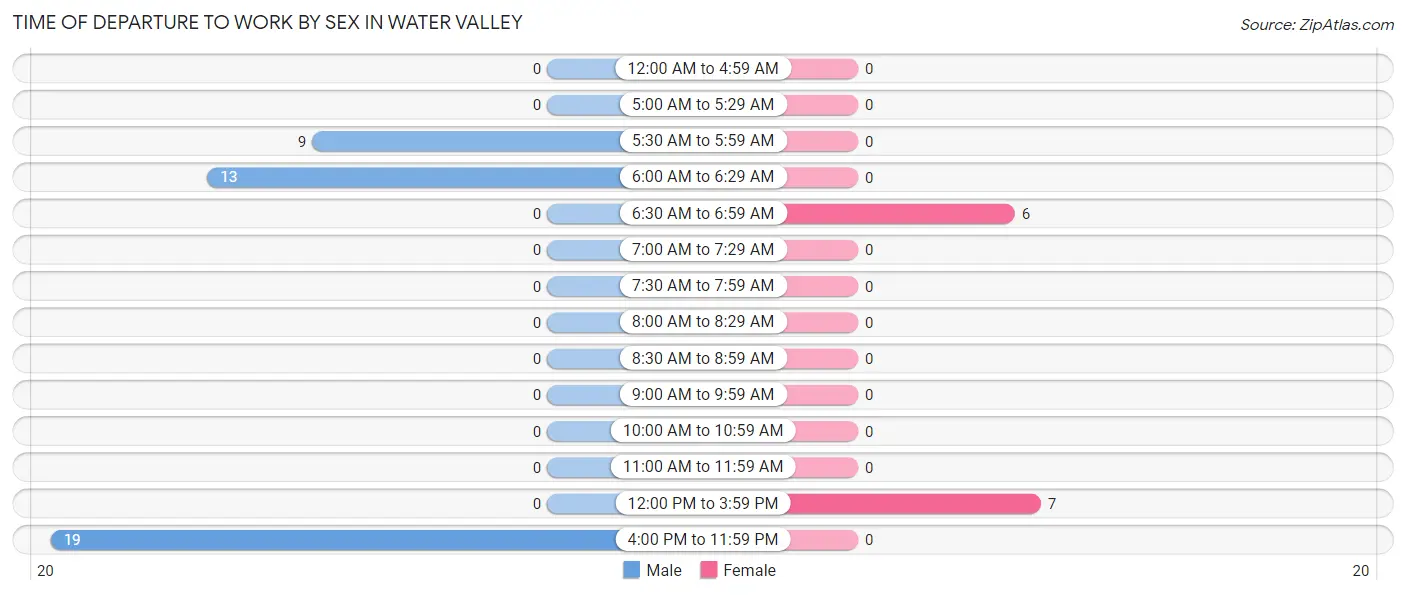
| Time of Departure | Male | Female |
| 12:00 AM to 4:59 AM | 0 (0.0%) | 0 (0.0%) |
| 5:00 AM to 5:29 AM | 0 (0.0%) | 0 (0.0%) |
| 5:30 AM to 5:59 AM | 9 (22.0%) | 0 (0.0%) |
| 6:00 AM to 6:29 AM | 13 (31.7%) | 0 (0.0%) |
| 6:30 AM to 6:59 AM | 0 (0.0%) | 6 (46.2%) |
| 7:00 AM to 7:29 AM | 0 (0.0%) | 0 (0.0%) |
| 7:30 AM to 7:59 AM | 0 (0.0%) | 0 (0.0%) |
| 8:00 AM to 8:29 AM | 0 (0.0%) | 0 (0.0%) |
| 8:30 AM to 8:59 AM | 0 (0.0%) | 0 (0.0%) |
| 9:00 AM to 9:59 AM | 0 (0.0%) | 0 (0.0%) |
| 10:00 AM to 10:59 AM | 0 (0.0%) | 0 (0.0%) |
| 11:00 AM to 11:59 AM | 0 (0.0%) | 0 (0.0%) |
| 12:00 PM to 3:59 PM | 0 (0.0%) | 7 (53.8%) |
| 4:00 PM to 11:59 PM | 19 (46.3%) | 0 (0.0%) |
| Total | 41 (100.0%) | 13 (100.0%) |
Housing Occupancy in Water Valley
Occupancy by Ownership in Water Valley
Of the total 52 dwellings in Water Valley, owner-occupied units account for 52 (100.0%), while renter-occupied units make up 0 (0.0%).
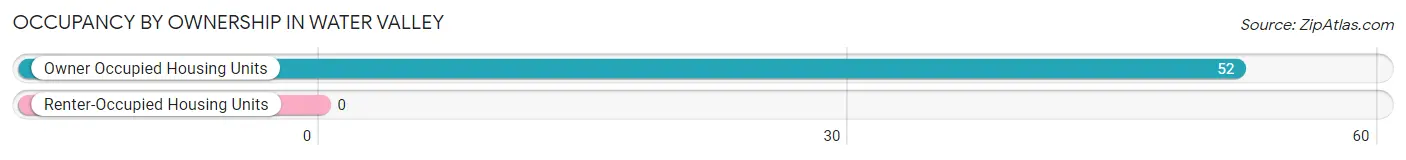
| Occupancy | # Housing Units | % Housing Units |
| Owner Occupied Housing Units | 52 | 100.0% |
| Renter-Occupied Housing Units | 0 | 0.0% |
| Total Occupied Housing Units | 52 | 100.0% |
Occupancy by Household Size in Water Valley
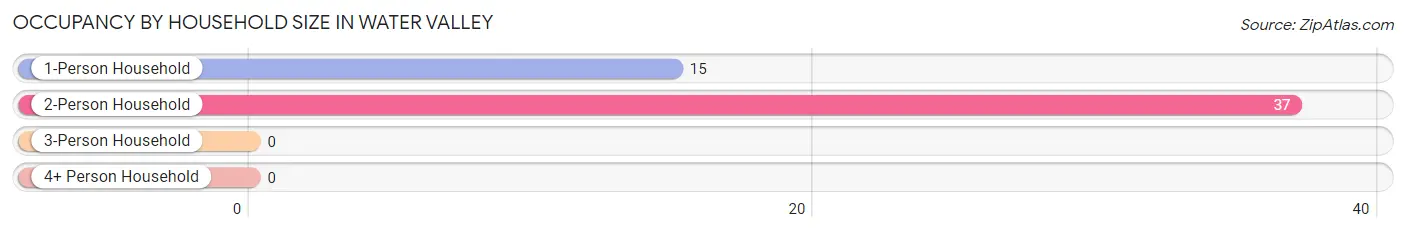
| Household Size | # Housing Units | % Housing Units |
| 1-Person Household | 15 | 28.8% |
| 2-Person Household | 37 | 71.2% |
| 3-Person Household | 0 | 0.0% |
| 4+ Person Household | 0 | 0.0% |
| Total Housing Units | 52 | 100.0% |
Occupancy by Ownership by Household Size in Water Valley
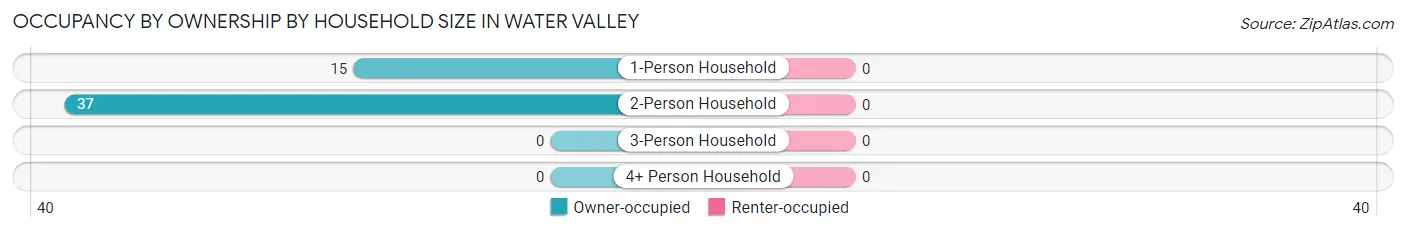
| Household Size | Owner-occupied | Renter-occupied |
| 1-Person Household | 15 (100.0%) | 0 (0.0%) |
| 2-Person Household | 37 (100.0%) | 0 (0.0%) |
| 3-Person Household | 0 (0.0%) | 0 (0.0%) |
| 4+ Person Household | 0 (0.0%) | 0 (0.0%) |
| Total Housing Units | 52 (100.0%) | 0 (0.0%) |
Occupancy by Educational Attainment in Water Valley
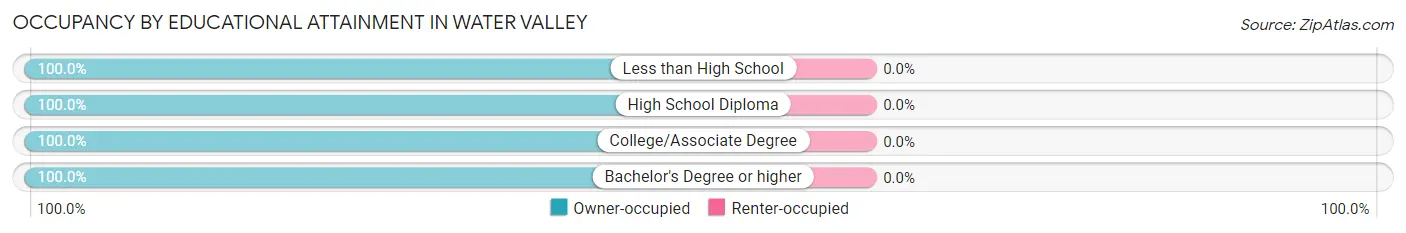
| Household Size | Owner-occupied | Renter-occupied |
| Less than High School | 10 (100.0%) | 0 (0.0%) |
| High School Diploma | 27 (100.0%) | 0 (0.0%) |
| College/Associate Degree | 9 (100.0%) | 0 (0.0%) |
| Bachelor's Degree or higher | 6 (100.0%) | 0 (0.0%) |
Occupancy by Age of Householder in Water Valley
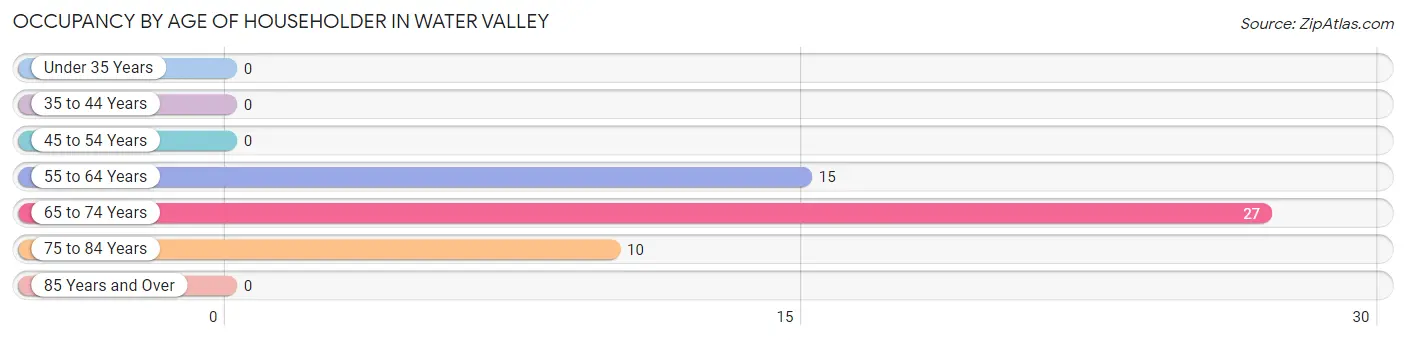
| Age Bracket | # Households | % Households |
| Under 35 Years | 0 | 0.0% |
| 35 to 44 Years | 0 | 0.0% |
| 45 to 54 Years | 0 | 0.0% |
| 55 to 64 Years | 15 | 28.8% |
| 65 to 74 Years | 27 | 51.9% |
| 75 to 84 Years | 10 | 19.2% |
| 85 Years and Over | 0 | 0.0% |
| Total | 52 | 100.0% |
Housing Finances in Water Valley
Median Income by Occupancy in Water Valley
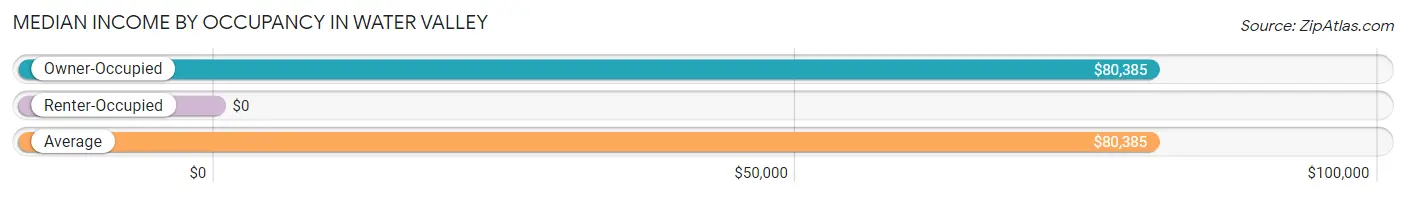
| Occupancy Type | # Households | Median Income |
| Owner-Occupied | 52 (100.0%) | $80,385 |
| Renter-Occupied | 0 (0.0%) | $0 |
| Average | 52 (100.0%) | $80,385 |
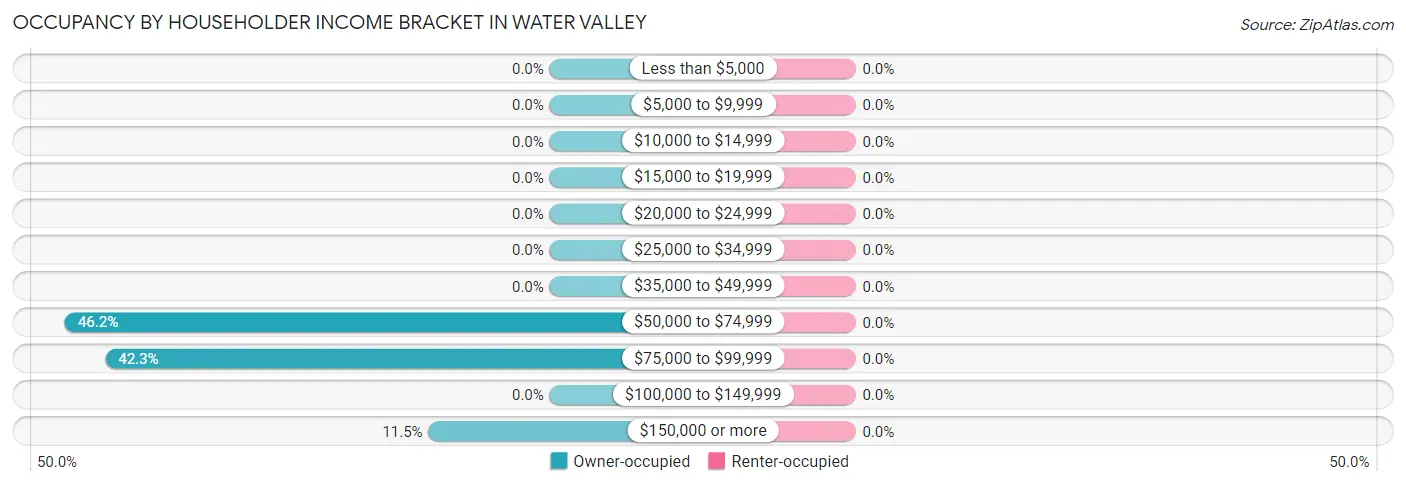
Occupancy by Householder Income Bracket in Water Valley
| Income Bracket | Owner-occupied | Renter-occupied |
| Less than $5,000 | 0 (0.0%) | 0 (0.0%) |
| $5,000 to $9,999 | 0 (0.0%) | 0 (0.0%) |
| $10,000 to $14,999 | 0 (0.0%) | 0 (0.0%) |
| $15,000 to $19,999 | 0 (0.0%) | 0 (0.0%) |
| $20,000 to $24,999 | 0 (0.0%) | 0 (0.0%) |
| $25,000 to $34,999 | 0 (0.0%) | 0 (0.0%) |
| $35,000 to $49,999 | 0 (0.0%) | 0 (0.0%) |
| $50,000 to $74,999 | 24 (46.2%) | 0 (0.0%) |
| $75,000 to $99,999 | 22 (42.3%) | 0 (0.0%) |
| $100,000 to $149,999 | 0 (0.0%) | 0 (0.0%) |
| $150,000 or more | 6 (11.5%) | 0 (0.0%) |
| Total | 52 (100.0%) | 0 (0.0%) |
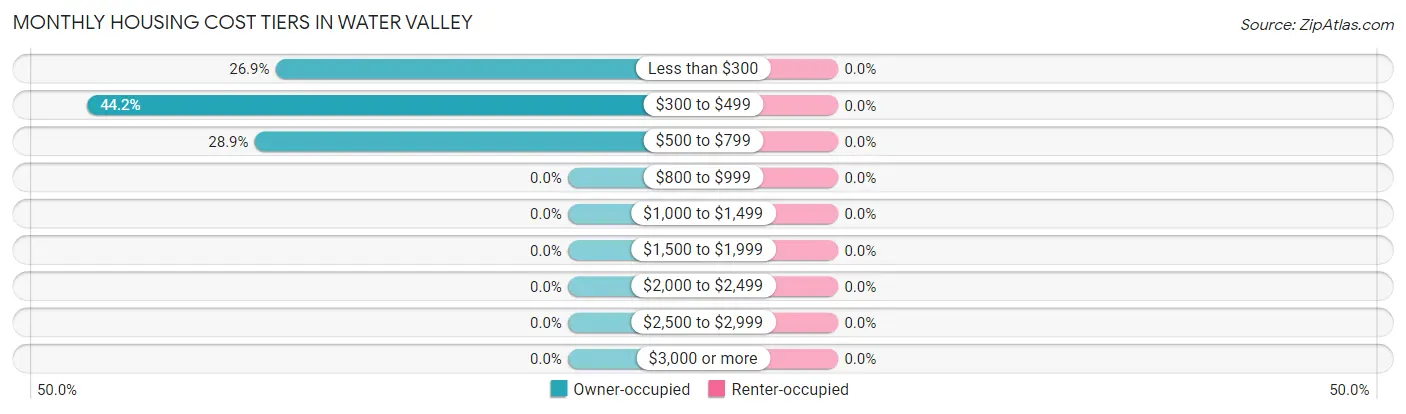
Monthly Housing Cost Tiers in Water Valley
| Monthly Cost | Owner-occupied | Renter-occupied |
| Less than $300 | 14 (26.9%) | 0 (0.0%) |
| $300 to $499 | 23 (44.2%) | 0 (0.0%) |
| $500 to $799 | 15 (28.8%) | 0 (0.0%) |
| $800 to $999 | 0 (0.0%) | 0 (0.0%) |
| $1,000 to $1,499 | 0 (0.0%) | 0 (0.0%) |
| $1,500 to $1,999 | 0 (0.0%) | 0 (0.0%) |
| $2,000 to $2,499 | 0 (0.0%) | 0 (0.0%) |
| $2,500 to $2,999 | 0 (0.0%) | 0 (0.0%) |
| $3,000 or more | 0 (0.0%) | 0 (0.0%) |
| Total | 52 (100.0%) | 0 (0.0%) |
Physical Housing Characteristics in Water Valley
Housing Structures in Water Valley
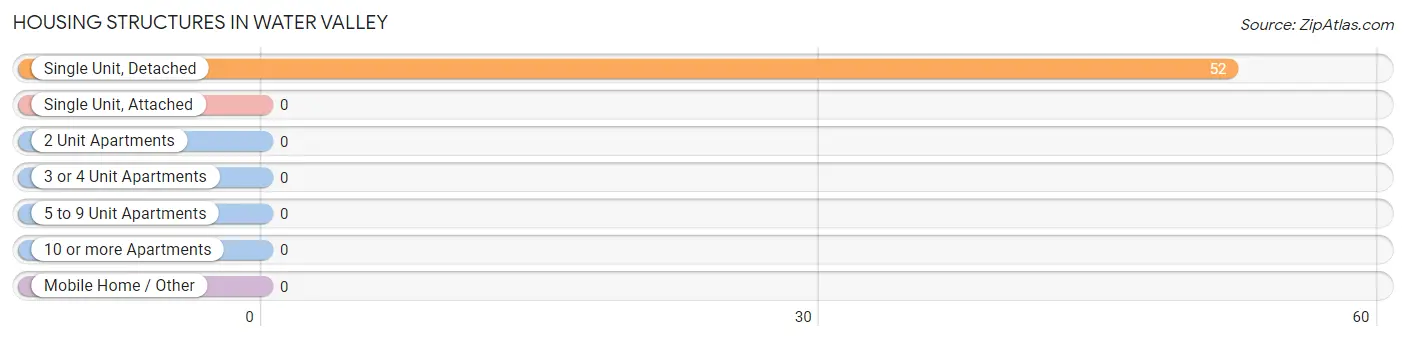
| Structure Type | # Housing Units | % Housing Units |
| Single Unit, Detached | 52 | 100.0% |
| Single Unit, Attached | 0 | 0.0% |
| 2 Unit Apartments | 0 | 0.0% |
| 3 or 4 Unit Apartments | 0 | 0.0% |
| 5 to 9 Unit Apartments | 0 | 0.0% |
| 10 or more Apartments | 0 | 0.0% |
| Mobile Home / Other | 0 | 0.0% |
| Total | 52 | 100.0% |
Housing Structures by Occupancy in Water Valley
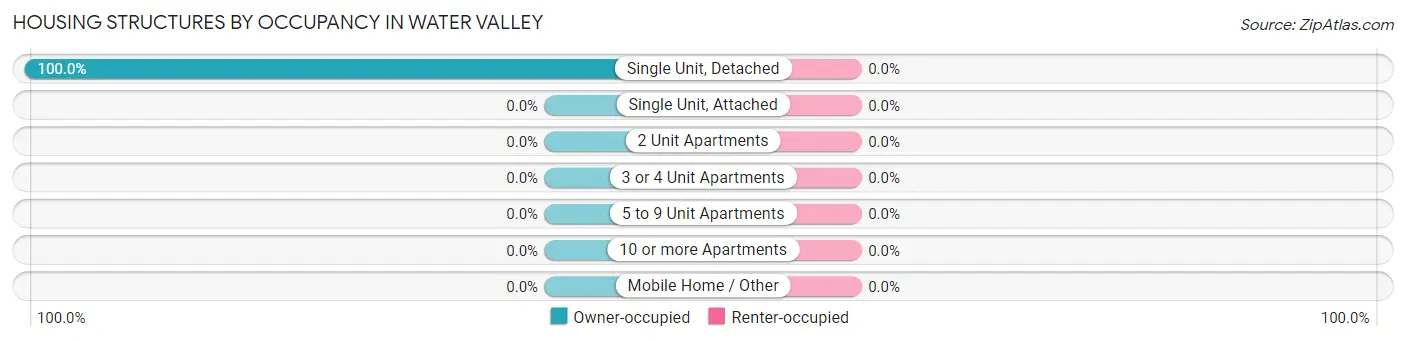
| Structure Type | Owner-occupied | Renter-occupied |
| Single Unit, Detached | 52 (100.0%) | 0 (0.0%) |
| Single Unit, Attached | 0 (0.0%) | 0 (0.0%) |
| 2 Unit Apartments | 0 (0.0%) | 0 (0.0%) |
| 3 or 4 Unit Apartments | 0 (0.0%) | 0 (0.0%) |
| 5 to 9 Unit Apartments | 0 (0.0%) | 0 (0.0%) |
| 10 or more Apartments | 0 (0.0%) | 0 (0.0%) |
| Mobile Home / Other | 0 (0.0%) | 0 (0.0%) |
| Total | 52 (100.0%) | 0 (0.0%) |
Housing Structures by Number of Rooms in Water Valley
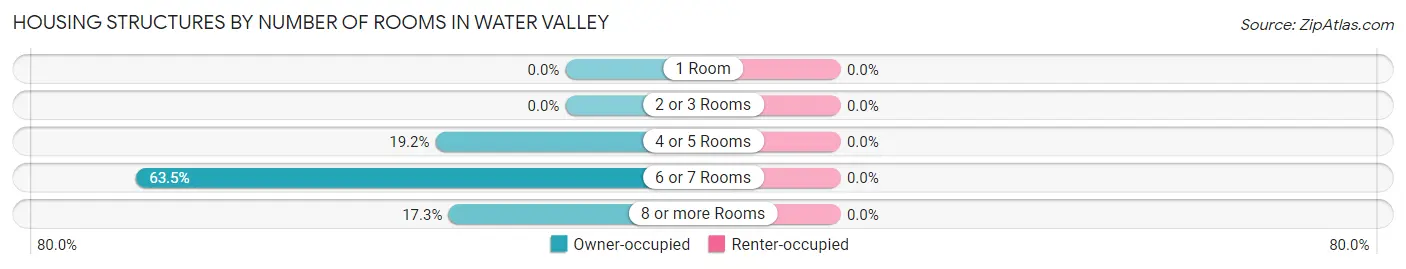
| Number of Rooms | Owner-occupied | Renter-occupied |
| 1 Room | 0 (0.0%) | 0 (0.0%) |
| 2 or 3 Rooms | 0 (0.0%) | 0 (0.0%) |
| 4 or 5 Rooms | 10 (19.2%) | 0 (0.0%) |
| 6 or 7 Rooms | 33 (63.5%) | 0 (0.0%) |
| 8 or more Rooms | 9 (17.3%) | 0 (0.0%) |
| Total | 52 (100.0%) | 0 (0.0%) |
Housing Structure by Heating Type in Water Valley
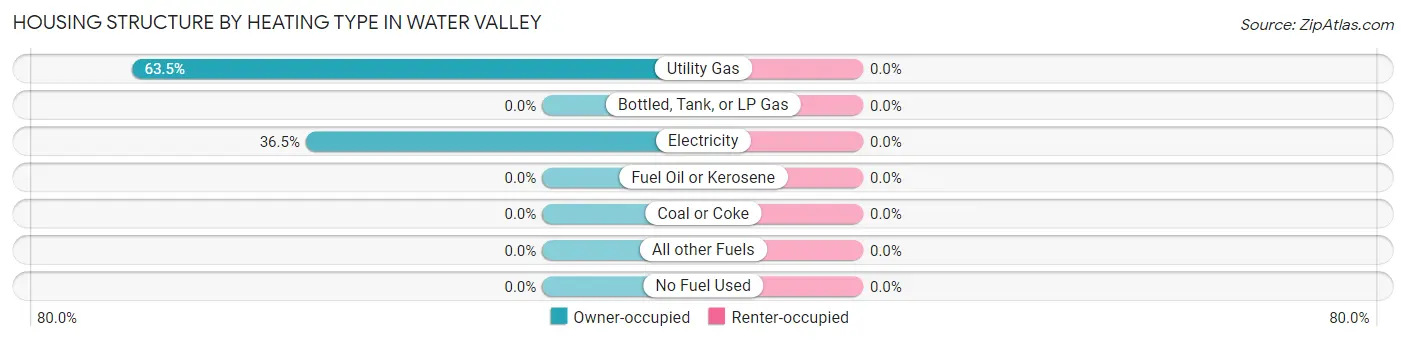
| Heating Type | Owner-occupied | Renter-occupied |
| Utility Gas | 33 (63.5%) | 0 (0.0%) |
| Bottled, Tank, or LP Gas | 0 (0.0%) | 0 (0.0%) |
| Electricity | 19 (36.5%) | 0 (0.0%) |
| Fuel Oil or Kerosene | 0 (0.0%) | 0 (0.0%) |
| Coal or Coke | 0 (0.0%) | 0 (0.0%) |
| All other Fuels | 0 (0.0%) | 0 (0.0%) |
| No Fuel Used | 0 (0.0%) | 0 (0.0%) |
| Total | 52 (100.0%) | 0 (0.0%) |
Household Vehicle Usage in Water Valley
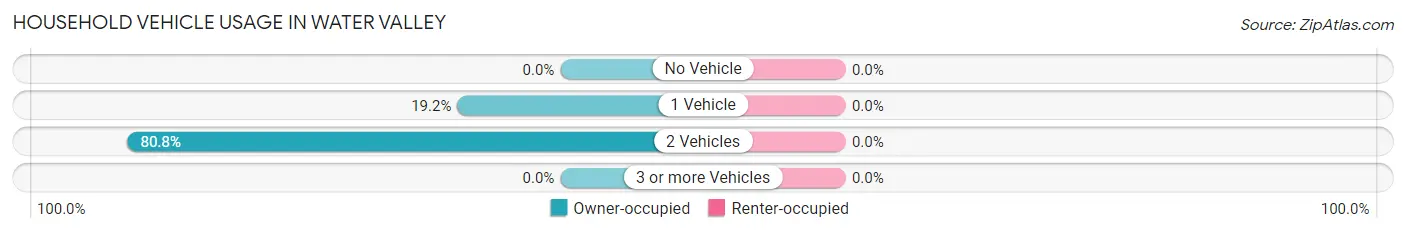
| Vehicles per Household | Owner-occupied | Renter-occupied |
| No Vehicle | 0 (0.0%) | 0 (0.0%) |
| 1 Vehicle | 10 (19.2%) | 0 (0.0%) |
| 2 Vehicles | 42 (80.8%) | 0 (0.0%) |
| 3 or more Vehicles | 0 (0.0%) | 0 (0.0%) |
| Total | 52 (100.0%) | 0 (0.0%) |
Real Estate & Mortgages in Water Valley
Real Estate and Mortgage Overview in Water Valley
| Characteristic | Without Mortgage | With Mortgage |
| Housing Units | 52 | 0 |
| Median Property Value | $128,800 | $0 |
| Median Household Income | $80,385 | $0 |
| Monthly Housing Costs | $452 | $0 |
| Real Estate Taxes | $660 | $0 |
Property Value by Mortgage Status in Water Valley
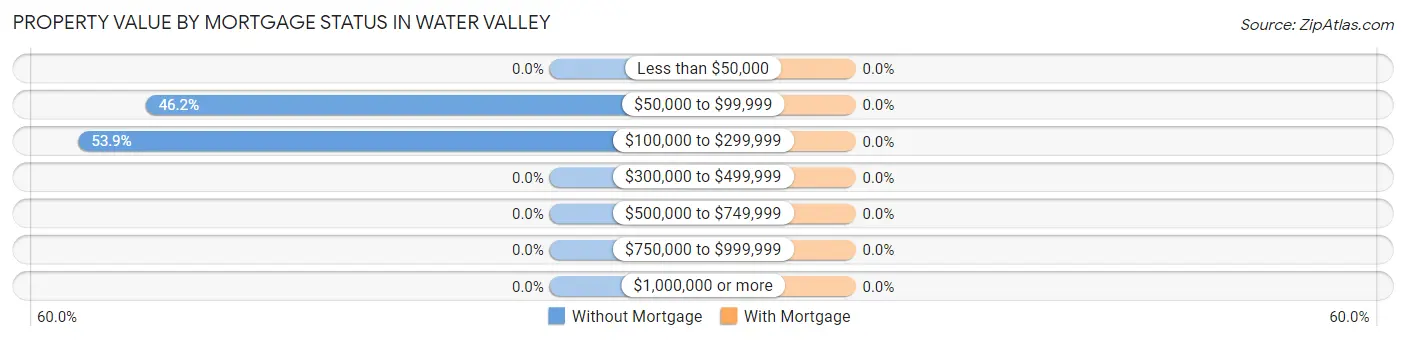
| Property Value | Without Mortgage | With Mortgage |
| Less than $50,000 | 0 (0.0%) | 0 (0.0%) |
| $50,000 to $99,999 | 24 (46.2%) | 0 (0.0%) |
| $100,000 to $299,999 | 28 (53.8%) | 0 (0.0%) |
| $300,000 to $499,999 | 0 (0.0%) | 0 (0.0%) |
| $500,000 to $749,999 | 0 (0.0%) | 0 (0.0%) |
| $750,000 to $999,999 | 0 (0.0%) | 0 (0.0%) |
| $1,000,000 or more | 0 (0.0%) | 0 (0.0%) |
| Total | 52 (100.0%) | 0 (0.0%) |
Household Income by Mortgage Status in Water Valley
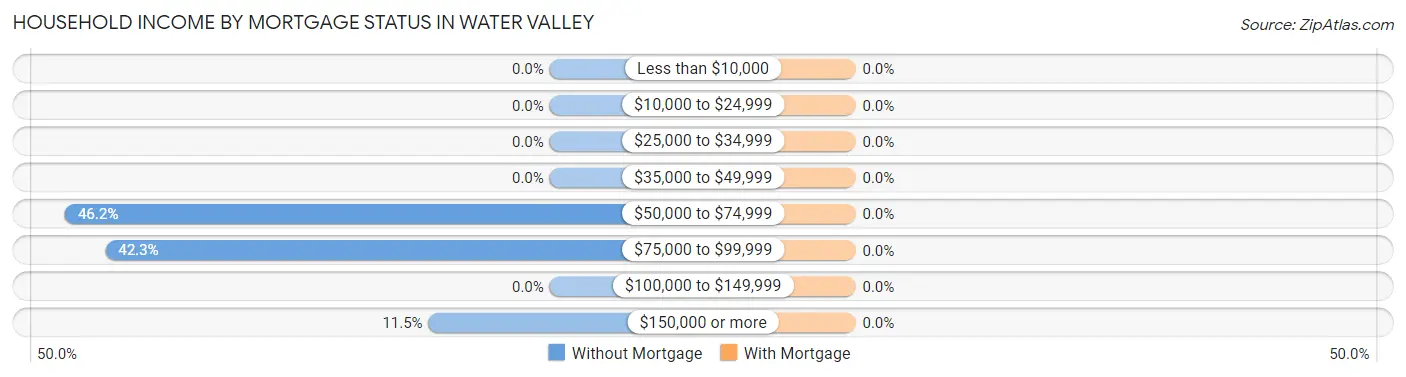
| Household Income | Without Mortgage | With Mortgage |
| Less than $10,000 | 0 (0.0%) | 0 (0.0%) |
| $10,000 to $24,999 | 0 (0.0%) | 0 (0.0%) |
| $25,000 to $34,999 | 0 (0.0%) | 0 (0.0%) |
| $35,000 to $49,999 | 0 (0.0%) | 0 (0.0%) |
| $50,000 to $74,999 | 24 (46.2%) | 0 (0.0%) |
| $75,000 to $99,999 | 22 (42.3%) | 0 (0.0%) |
| $100,000 to $149,999 | 0 (0.0%) | 0 (0.0%) |
| $150,000 or more | 6 (11.5%) | 0 (0.0%) |
| Total | 52 (100.0%) | 0 (0.0%) |
Property Value to Household Income Ratio in Water Valley
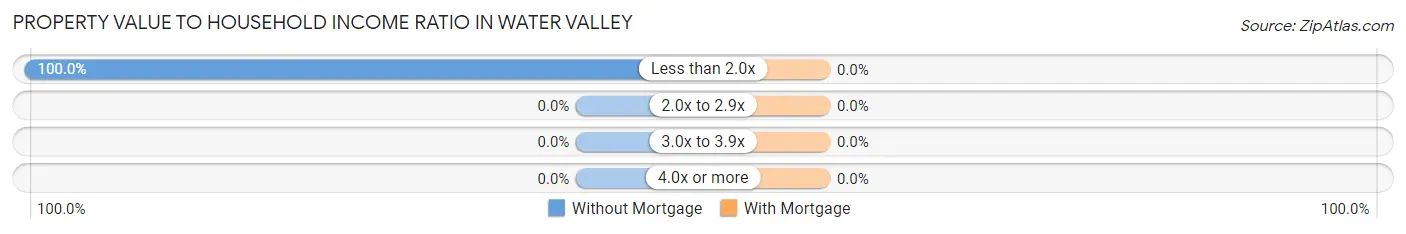
| Value-to-Income Ratio | Without Mortgage | With Mortgage |
| Less than 2.0x | 52 (100.0%) | 0 (0.0%) |
| 2.0x to 2.9x | 0 (0.0%) | 0 (0.0%) |
| 3.0x to 3.9x | 0 (0.0%) | 0 (0.0%) |
| 4.0x or more | 0 (0.0%) | 0 (0.0%) |
| Total | 52 (100.0%) | 0 (0.0%) |
Real Estate Taxes by Mortgage Status in Water Valley
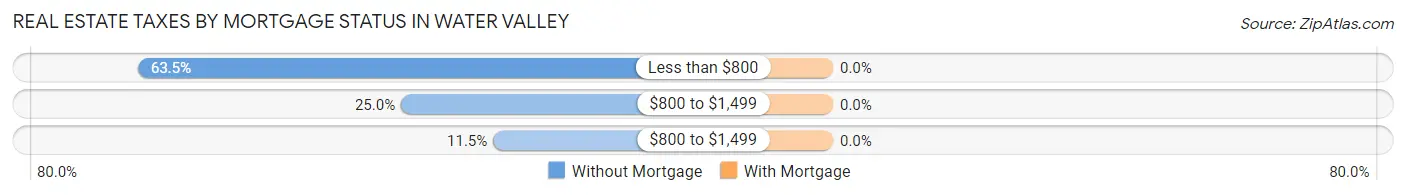
| Property Taxes | Without Mortgage | With Mortgage |
| Less than $800 | 33 (63.5%) | 0 (0.0%) |
| $800 to $1,499 | 13 (25.0%) | 0 (0.0%) |
| $800 to $1,499 | 6 (11.5%) | 0 (0.0%) |
| Total | 52 (100.0%) | 0 (0.0%) |
Health & Disability in Water Valley
Health Insurance Coverage by Age in Water Valley
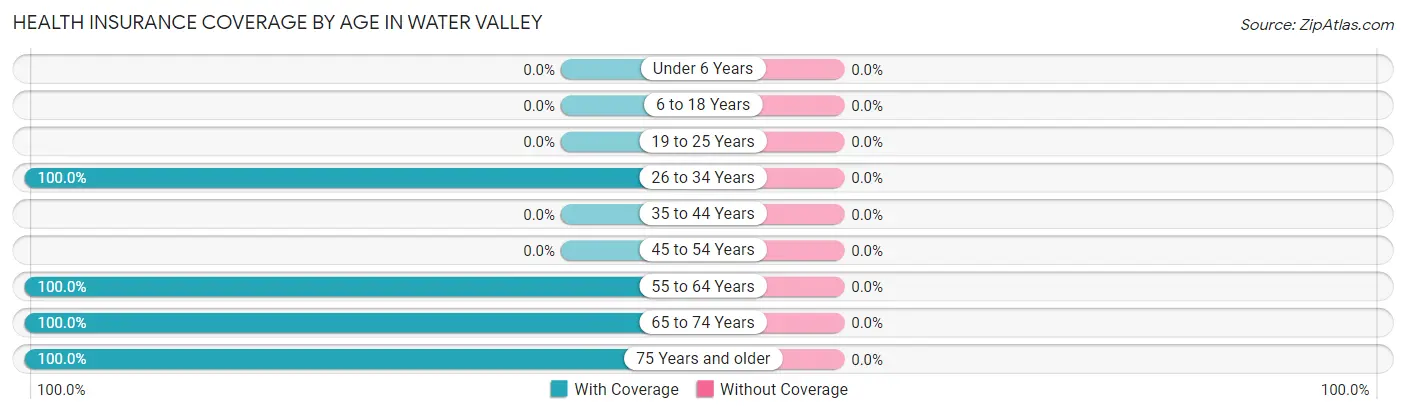
| Age Bracket | With Coverage | Without Coverage |
| Under 6 Years | 0 (0.0%) | 0 (0.0%) |
| 6 to 18 Years | 0 (0.0%) | 0 (0.0%) |
| 19 to 25 Years | 0 (0.0%) | 0 (0.0%) |
| 26 to 34 Years | 7 (100.0%) | 0 (0.0%) |
| 35 to 44 Years | 0 (0.0%) | 0 (0.0%) |
| 45 to 54 Years | 0 (0.0%) | 0 (0.0%) |
| 55 to 64 Years | 34 (100.0%) | 0 (0.0%) |
| 65 to 74 Years | 27 (100.0%) | 0 (0.0%) |
| 75 Years and older | 20 (100.0%) | 0 (0.0%) |
| Total | 88 (100.0%) | 0 (0.0%) |
Health Insurance Coverage by Citizenship Status in Water Valley
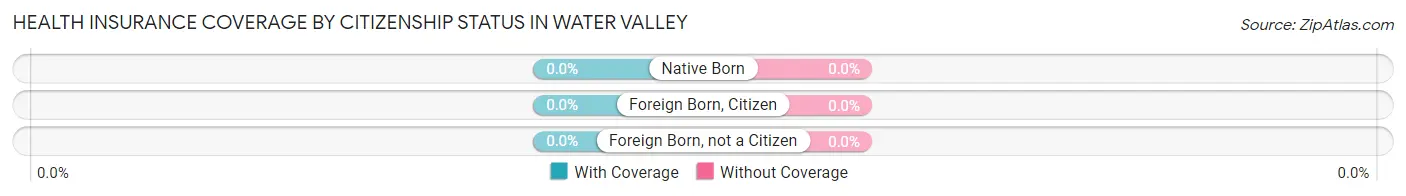
| Citizenship Status | With Coverage | Without Coverage |
| Native Born | 0 (0.0%) | 0 (0.0%) |
| Foreign Born, Citizen | 0 (0.0%) | 0 (0.0%) |
| Foreign Born, not a Citizen | 0 (0.0%) | 0 (0.0%) |
Health Insurance Coverage by Household Income in Water Valley
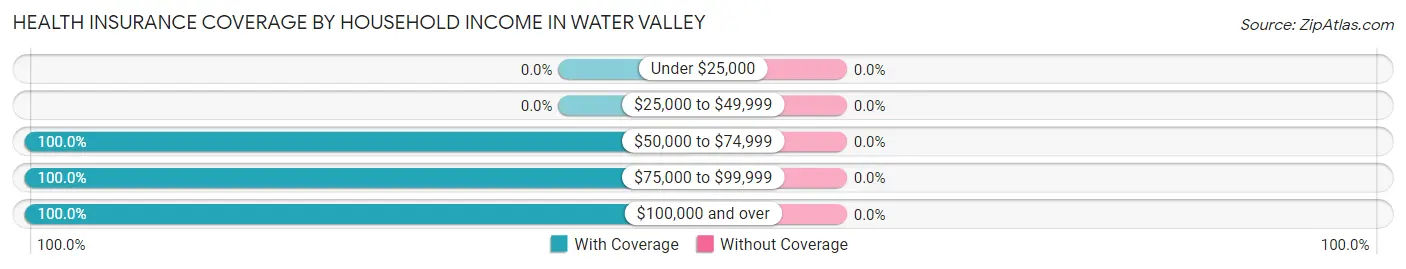
| Household Income | With Coverage | Without Coverage |
| Under $25,000 | 0 (0.0%) | 0 (0.0%) |
| $25,000 to $49,999 | 0 (0.0%) | 0 (0.0%) |
| $50,000 to $74,999 | 50 (100.0%) | 0 (0.0%) |
| $75,000 to $99,999 | 32 (100.0%) | 0 (0.0%) |
| $100,000 and over | 6 (100.0%) | 0 (0.0%) |
Public vs Private Health Insurance Coverage by Age in Water Valley
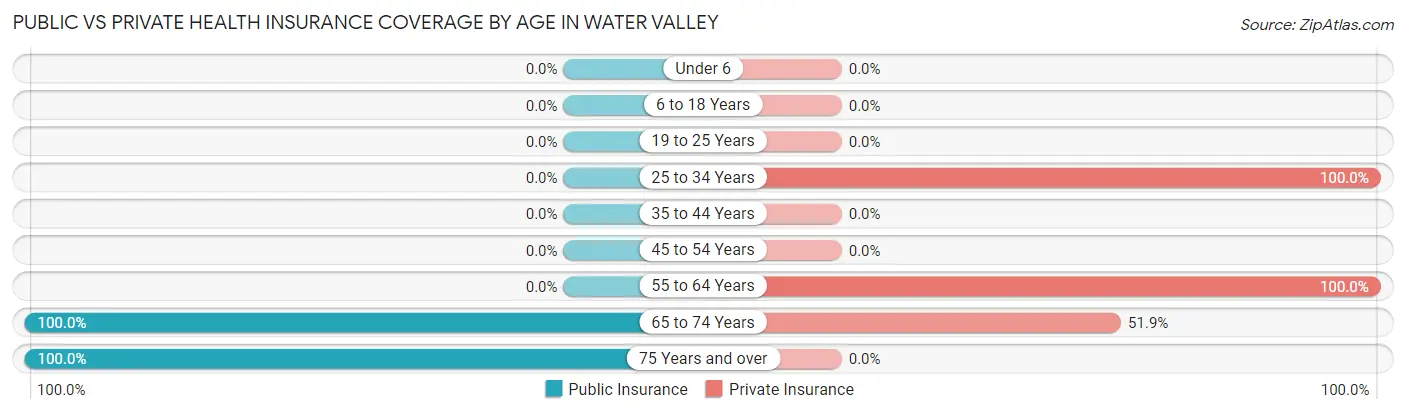
| Age Bracket | Public Insurance | Private Insurance |
| Under 6 | 0 (0.0%) | 0 (0.0%) |
| 6 to 18 Years | 0 (0.0%) | 0 (0.0%) |
| 19 to 25 Years | 0 (0.0%) | 0 (0.0%) |
| 25 to 34 Years | 0 (0.0%) | 7 (100.0%) |
| 35 to 44 Years | 0 (0.0%) | 0 (0.0%) |
| 45 to 54 Years | 0 (0.0%) | 0 (0.0%) |
| 55 to 64 Years | 0 (0.0%) | 34 (100.0%) |
| 65 to 74 Years | 27 (100.0%) | 14 (51.8%) |
| 75 Years and over | 20 (100.0%) | 0 (0.0%) |
| Total | 47 (53.4%) | 55 (62.5%) |
Disability Status by Sex by Age in Water Valley
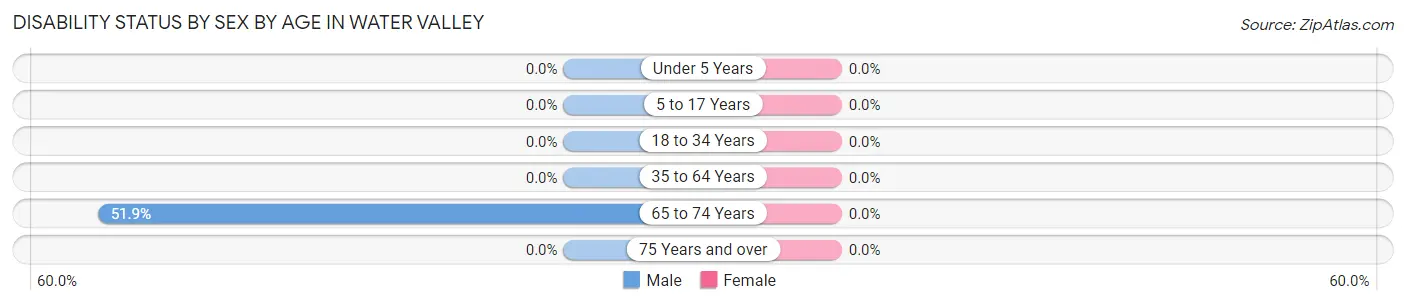
| Age Bracket | Male | Female |
| Under 5 Years | 0 (0.0%) | 0 (0.0%) |
| 5 to 17 Years | 0 (0.0%) | 0 (0.0%) |
| 18 to 34 Years | 0 (0.0%) | 0 (0.0%) |
| 35 to 64 Years | 0 (0.0%) | 0 (0.0%) |
| 65 to 74 Years | 14 (51.8%) | 0 (0.0%) |
| 75 Years and over | 0 (0.0%) | 0 (0.0%) |
Disability Class by Sex by Age in Water Valley
Disability Class: Hearing Difficulty
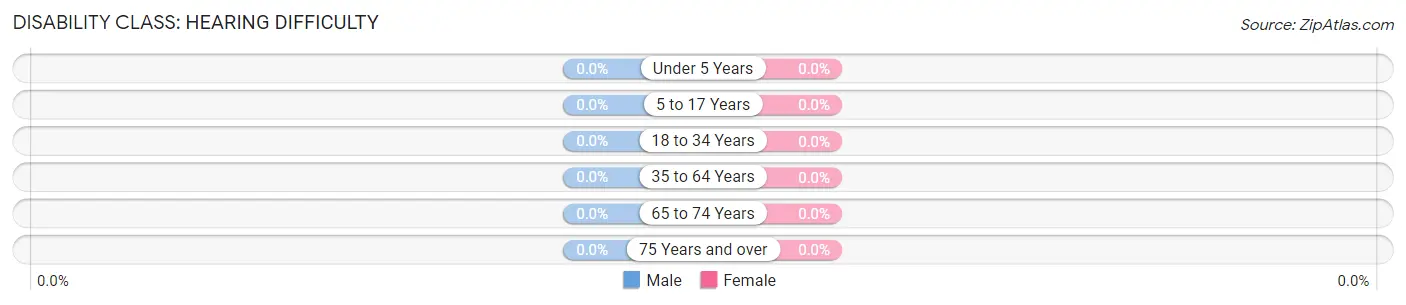
| Age Bracket | Male | Female |
| Under 5 Years | 0 (0.0%) | 0 (0.0%) |
| 5 to 17 Years | 0 (0.0%) | 0 (0.0%) |
| 18 to 34 Years | 0 (0.0%) | 0 (0.0%) |
| 35 to 64 Years | 0 (0.0%) | 0 (0.0%) |
| 65 to 74 Years | 0 (0.0%) | 0 (0.0%) |
| 75 Years and over | 0 (0.0%) | 0 (0.0%) |
Disability Class: Vision Difficulty
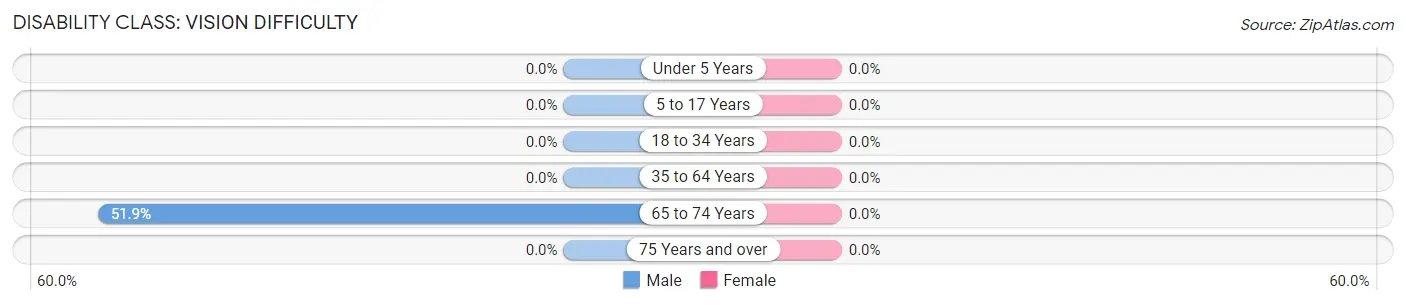
| Age Bracket | Male | Female |
| Under 5 Years | 0 (0.0%) | 0 (0.0%) |
| 5 to 17 Years | 0 (0.0%) | 0 (0.0%) |
| 18 to 34 Years | 0 (0.0%) | 0 (0.0%) |
| 35 to 64 Years | 0 (0.0%) | 0 (0.0%) |
| 65 to 74 Years | 14 (51.8%) | 0 (0.0%) |
| 75 Years and over | 0 (0.0%) | 0 (0.0%) |
Disability Class: Cognitive Difficulty

| Age Bracket | Male | Female |
| 5 to 17 Years | 0 (0.0%) | 0 (0.0%) |
| 18 to 34 Years | 0 (0.0%) | 0 (0.0%) |
| 35 to 64 Years | 0 (0.0%) | 0 (0.0%) |
| 65 to 74 Years | 0 (0.0%) | 0 (0.0%) |
| 75 Years and over | 0 (0.0%) | 0 (0.0%) |
Disability Class: Ambulatory Difficulty
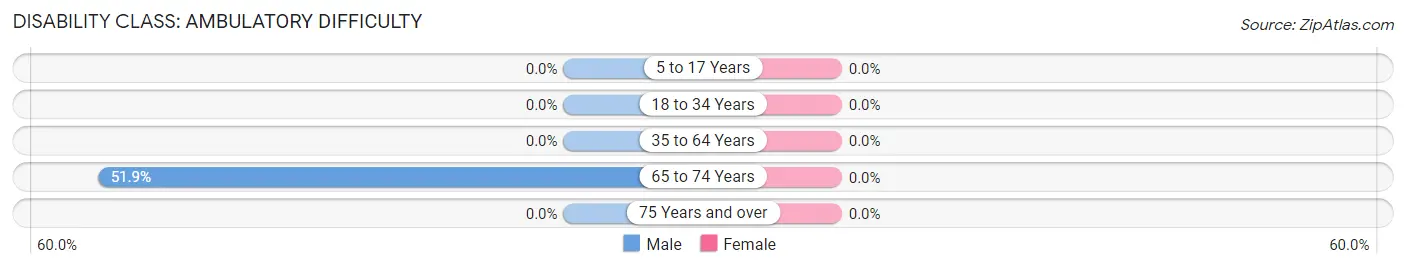
| Age Bracket | Male | Female |
| 5 to 17 Years | 0 (0.0%) | 0 (0.0%) |
| 18 to 34 Years | 0 (0.0%) | 0 (0.0%) |
| 35 to 64 Years | 0 (0.0%) | 0 (0.0%) |
| 65 to 74 Years | 14 (51.8%) | 0 (0.0%) |
| 75 Years and over | 0 (0.0%) | 0 (0.0%) |
Disability Class: Self-Care Difficulty
| Age Bracket | Male | Female |
| 5 to 17 Years | 0 (0.0%) | 0 (0.0%) |
| 18 to 34 Years | 0 (0.0%) | 0 (0.0%) |
| 35 to 64 Years | 0 (0.0%) | 0 (0.0%) |
| 65 to 74 Years | 0 (0.0%) | 0 (0.0%) |
| 75 Years and over | 0 (0.0%) | 0 (0.0%) |
Technology Access in Water Valley
Computing Device Access in Water Valley
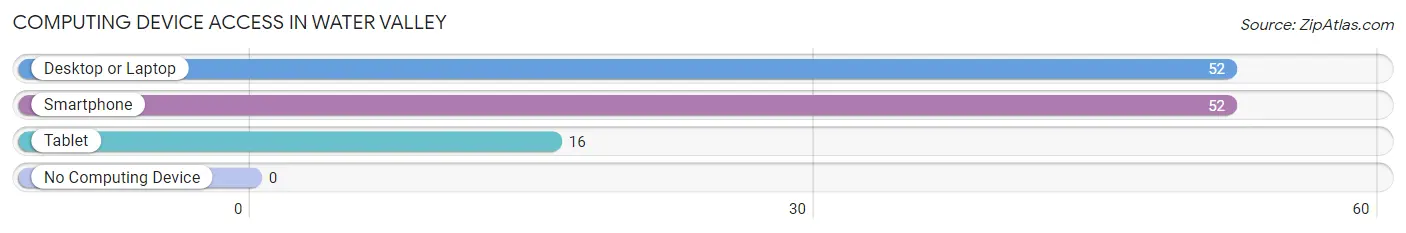
| Device Type | # Households | % Households |
| Desktop or Laptop | 52 | 100.0% |
| Smartphone | 52 | 100.0% |
| Tablet | 16 | 30.8% |
| No Computing Device | 0 | 0.0% |
| Total | 52 | 100.0% |
Internet Access in Water Valley

| Internet Type | # Households | % Households |
| Dial-Up Internet | 0 | 0.0% |
| Broadband Home | 25 | 48.1% |
| Cellular Data Only | 14 | 26.9% |
| Satellite Internet | 13 | 25.0% |
| No Internet | 0 | 0.0% |
| Total | 52 | 100.0% |
Water Valley Summary
History
Water Valley is a small unincorporated community located in the western part of Marshall County, Kentucky. It is situated on the banks of the Kentucky River, and is home to a population of just over 200 people. The area was first settled in the early 1800s by a group of settlers from Virginia, who were drawn to the area by its abundant natural resources. The town was originally known as “Waterford”, but was later changed to “Water Valley” in 1845.
The town was an important stop on the Louisville and Nashville Railroad, which ran through the area in the late 19th century. This allowed the town to become a hub for the local agricultural industry, as well as a popular destination for tourists. The town was also home to a number of businesses, including a general store, a blacksmith shop, and a hotel.
In the early 20th century, the town began to decline as the railroad was replaced by the automobile. The town’s population dwindled, and many of the businesses closed. However, the town was able to survive due to its proximity to the Kentucky River, which provided a steady source of income for the town’s residents.
Today, Water Valley is a small, rural community that is home to a diverse population. The town is home to a number of small businesses, including a grocery store, a gas station, and a post office. The town is also home to a number of churches, including the Water Valley Baptist Church, which was founded in 1845.
Geography
Water Valley is located in the western part of Marshall County, Kentucky. It is situated on the banks of the Kentucky River, and is surrounded by rolling hills and farmland. The town is located approximately 25 miles from the state capital of Frankfort, and is approximately 50 miles from the city of Louisville.
The town is located in a humid subtropical climate zone, and experiences hot, humid summers and mild winters. The average annual temperature is around 60 degrees Fahrenheit, and the average annual precipitation is around 45 inches.
Economy
The economy of Water Valley is largely based on agriculture. The town is home to a number of small farms, which produce a variety of crops, including corn, soybeans, and hay. The town is also home to a number of small businesses, including a grocery store, a gas station, and a post office.
The town is also home to a number of churches, which provide a source of income for the town’s residents. The town is also home to a number of recreational activities, including fishing, hunting, and camping.
Demographics
As of the 2010 census, the population of Water Valley was 203. The racial makeup of the town was 97.5% White, 0.5% African American, 0.5% Native American, 0.5% Asian, and 1% from other races. The median household income was $31,250, and the median family income was $37,500. The per capita income was $17,500.
Conclusion
Water Valley is a small, rural community located in the western part of Marshall County, Kentucky. It is situated on the banks of the Kentucky River, and is home to a population of just over 200 people. The town is largely supported by its agricultural industry, as well as a number of small businesses and churches. The town is also home to a number of recreational activities, including fishing, hunting, and camping. The town is a diverse community, with a population that is 97.5% White, 0.5% African American, 0.5% Native American, 0.5% Asian, and 1% from other races. The median household income was $31,250, and the median family income was $37,500.
Common Questions
What is Per Capita Income in Water Valley?
Per Capita income in Water Valley is $50,434.
What is the Median Family Income in Water Valley?
Median Family Income in Water Valley is $56,518.
What is the Median Household income in Water Valley?
Median Household Income in Water Valley is $80,385.
What is Inequality or Gini Index in Water Valley?
Inequality or Gini Index in Water Valley is 0.21.
What is the Total Population of Water Valley?
Total Population of Water Valley is 88.
What is the Total Male Population of Water Valley?
Total Male Population of Water Valley is 55.
What is the Total Female Population of Water Valley?
Total Female Population of Water Valley is 33.
What is the Ratio of Males per 100 Females in Water Valley?
There are 166.67 Males per 100 Females in Water Valley.
What is the Ratio of Females per 100 Males in Water Valley?
There are 60.00 Females per 100 Males in Water Valley.
What is the Median Population Age in Water Valley?
Median Population Age in Water Valley is 73.2 Years.
What is the Average Family Size in Water Valley
Average Family Size in Water Valley is 2.0 People.
What is the Average Household Size in Water Valley
Average Household Size in Water Valley is 1.7 People.
How Large is the Labor Force in Water Valley?
There are 54 People in the Labor Forcein in Water Valley.
What is the Percentage of People in the Labor Force in Water Valley?
61.4% of People are in the Labor Force in Water Valley.