Booneville, KY Map & Demographics
Booneville Map
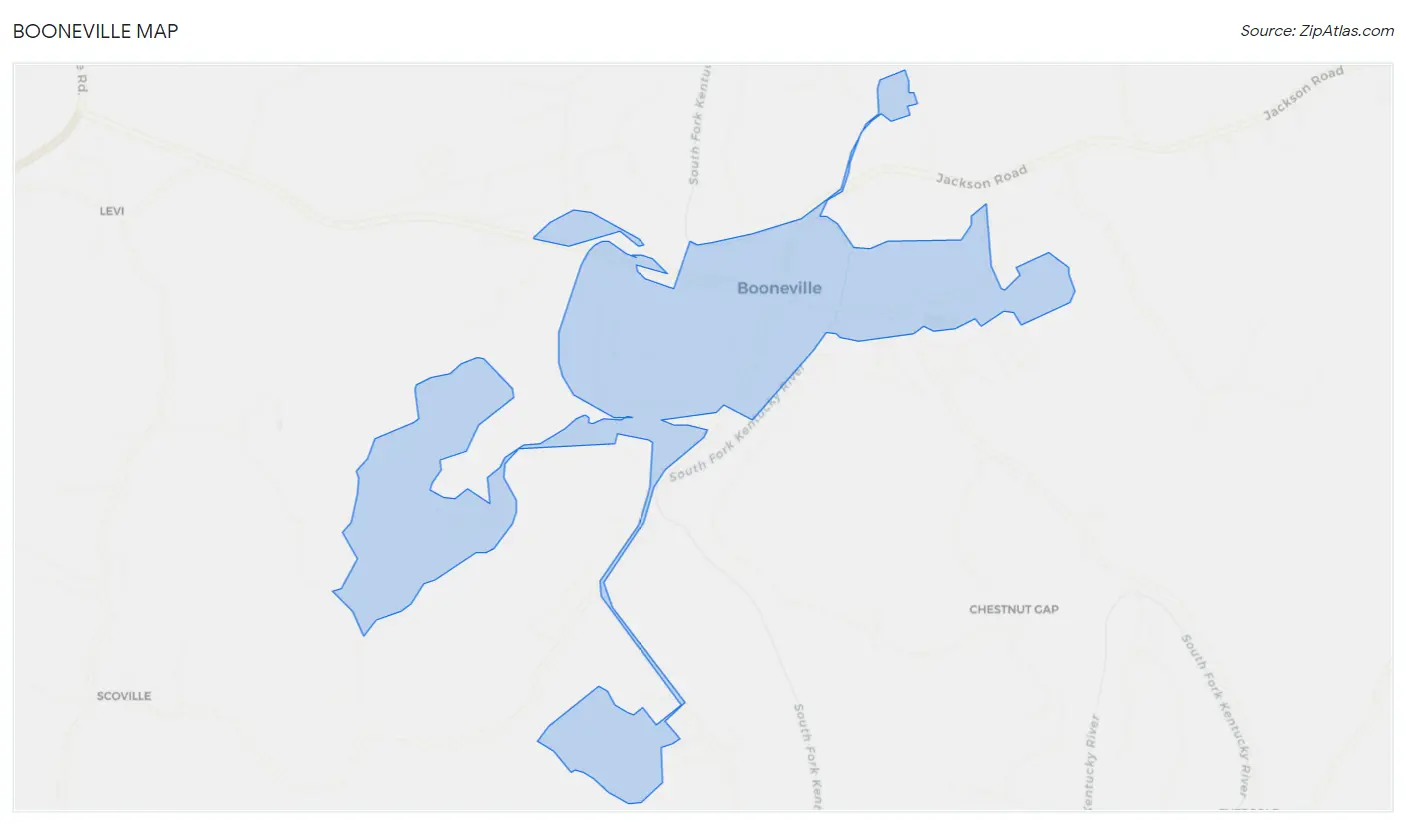
Booneville Overview
$30,403
PER CAPITA INCOME
$59,375
AVG FAMILY INCOME
$55,000
AVG HOUSEHOLD INCOME
26.0%
WAGE / INCOME GAP [ % ]
74.0¢/ $1
WAGE / INCOME GAP [ $ ]
0.32
INEQUALITY / GINI INDEX
139
TOTAL POPULATION
69
MALE POPULATION
70
FEMALE POPULATION
98.57
MALES / 100 FEMALES
101.45
FEMALES / 100 MALES
36.8
MEDIAN AGE
5.0
AVG FAMILY SIZE
4.6
AVG HOUSEHOLD SIZE
83
LABOR FORCE [ PEOPLE ]
72.8%
PERCENT IN LABOR FORCE
Booneville Zip Codes
Booneville Area Codes
Income in Booneville
Income Overview in Booneville
Per Capita Income in Booneville is $30,403, while median incomes of families and households are $59,375 and $55,000 respectively.
| Characteristic | Number | Measure |
| Per Capita Income | 139 | $30,403 |
| Median Family Income | 27 | $59,375 |
| Mean Family Income | 27 | $70,793 |
| Median Household Income | 30 | $55,000 |
| Mean Household Income | 30 | $65,873 |
| Income Deficit | 27 | $0 |
| Wage / Income Gap (%) | 139 | 26.02% |
| Wage / Income Gap ($) | 139 | 73.98¢ per $1 |
| Gini / Inequality Index | 139 | 0.32 |
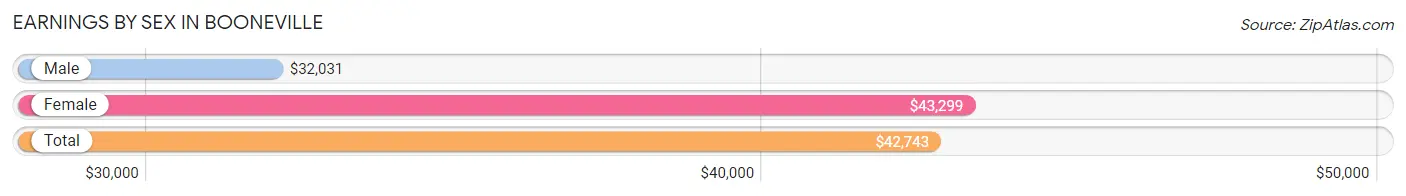
Earnings by Sex in Booneville
Average Earnings in Booneville are $42,743, $32,031 for men and $43,299 for women, a difference of 26.0%.
| Sex | Number | Average Earnings |
| Male | 34 (41.0%) | $32,031 |
| Female | 49 (59.0%) | $43,299 |
| Total | 83 (100.0%) | $42,743 |
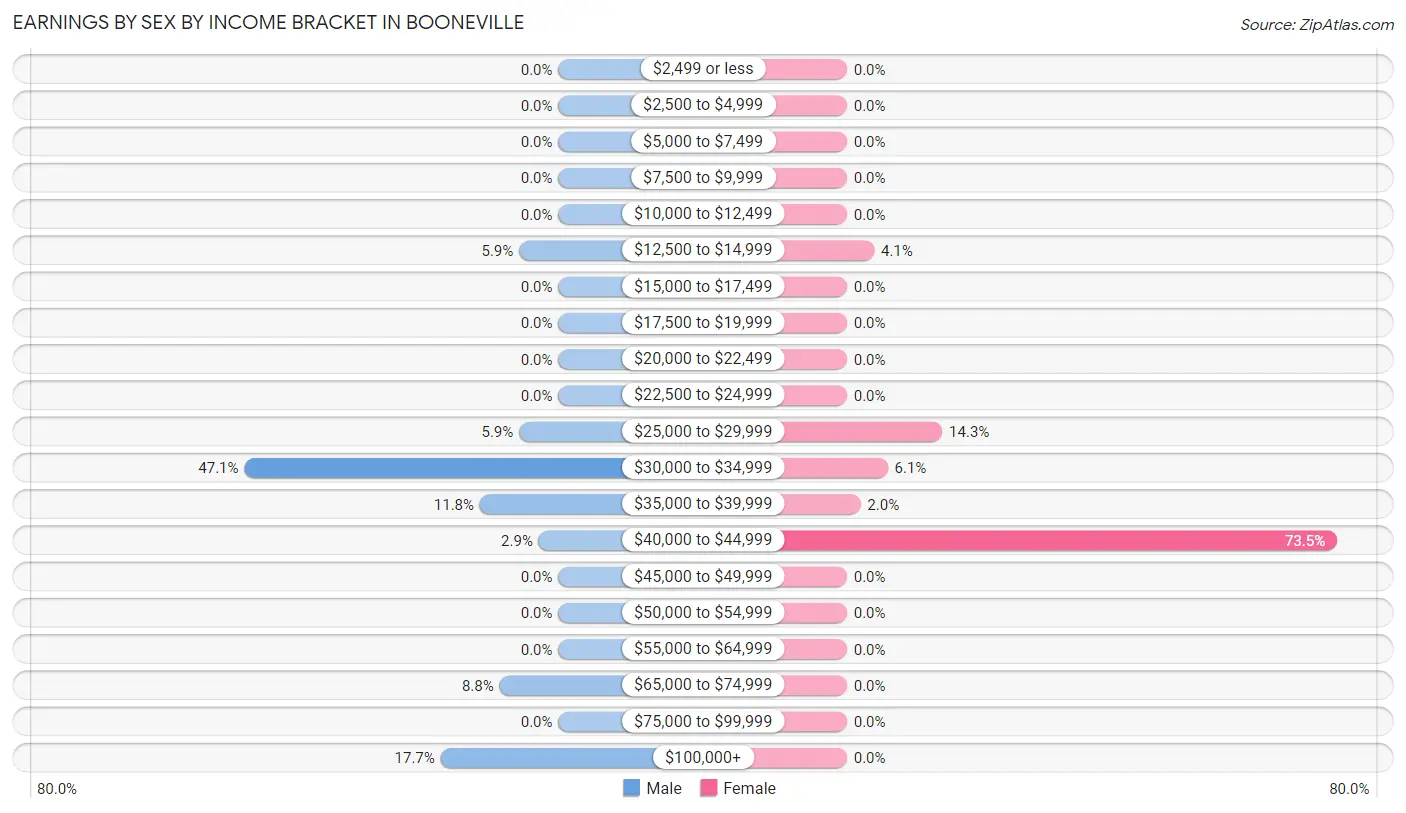
Earnings by Sex by Income Bracket in Booneville
The most common earnings brackets in Booneville are $30,000 to $34,999 for men (16 | 47.1%) and $40,000 to $44,999 for women (36 | 73.5%).
| Income | Male | Female |
| $2,499 or less | 0 (0.0%) | 0 (0.0%) |
| $2,500 to $4,999 | 0 (0.0%) | 0 (0.0%) |
| $5,000 to $7,499 | 0 (0.0%) | 0 (0.0%) |
| $7,500 to $9,999 | 0 (0.0%) | 0 (0.0%) |
| $10,000 to $12,499 | 0 (0.0%) | 0 (0.0%) |
| $12,500 to $14,999 | 2 (5.9%) | 2 (4.1%) |
| $15,000 to $17,499 | 0 (0.0%) | 0 (0.0%) |
| $17,500 to $19,999 | 0 (0.0%) | 0 (0.0%) |
| $20,000 to $22,499 | 0 (0.0%) | 0 (0.0%) |
| $22,500 to $24,999 | 0 (0.0%) | 0 (0.0%) |
| $25,000 to $29,999 | 2 (5.9%) | 7 (14.3%) |
| $30,000 to $34,999 | 16 (47.1%) | 3 (6.1%) |
| $35,000 to $39,999 | 4 (11.8%) | 1 (2.0%) |
| $40,000 to $44,999 | 1 (2.9%) | 36 (73.5%) |
| $45,000 to $49,999 | 0 (0.0%) | 0 (0.0%) |
| $50,000 to $54,999 | 0 (0.0%) | 0 (0.0%) |
| $55,000 to $64,999 | 0 (0.0%) | 0 (0.0%) |
| $65,000 to $74,999 | 3 (8.8%) | 0 (0.0%) |
| $75,000 to $99,999 | 0 (0.0%) | 0 (0.0%) |
| $100,000+ | 6 (17.6%) | 0 (0.0%) |
| Total | 34 (100.0%) | 49 (100.0%) |
Earnings by Sex by Educational Attainment in Booneville
| Educational Attainment | Male Income | Female Income |
| Less than High School | - | - |
| High School Diploma | - | - |
| College or Associate's Degree | - | - |
| Bachelor's Degree | - | - |
| Graduate Degree | - | - |
| Total | $32,031 | $43,299 |
Family Income in Booneville
Family Income Brackets in Booneville
According to the Booneville family income data, there are 10 families falling into the $35,000 to $49,999 income range, which is the most common income bracket and makes up 37.0% of all families.
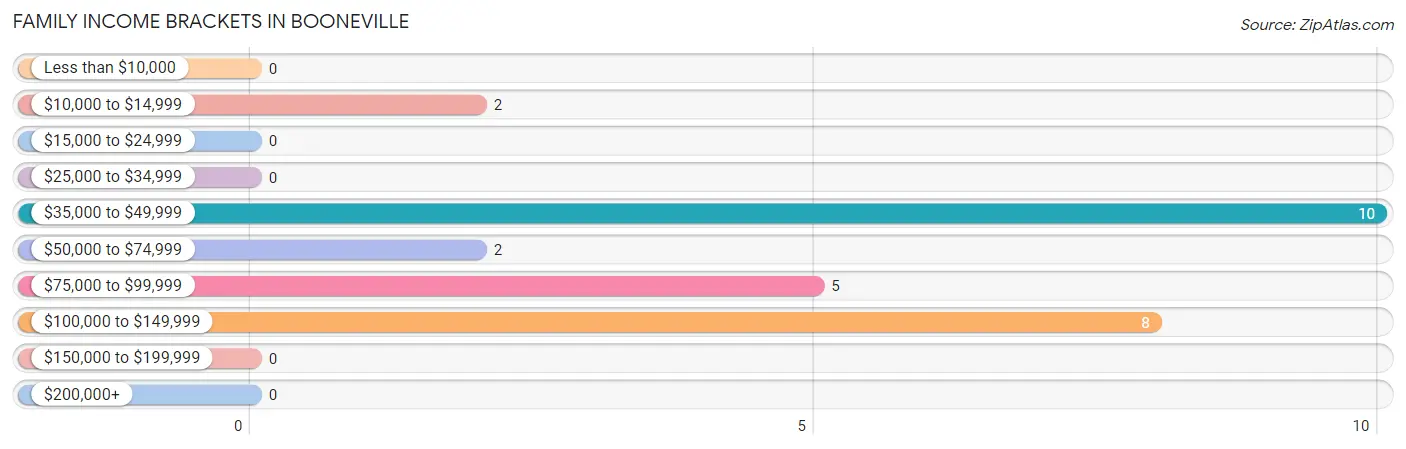
| Income Bracket | # Families | % Families |
| Less than $10,000 | 0 | 0.0% |
| $10,000 to $14,999 | 2 | 7.4% |
| $15,000 to $24,999 | 0 | 0.0% |
| $25,000 to $34,999 | 0 | 0.0% |
| $35,000 to $49,999 | 10 | 37.0% |
| $50,000 to $74,999 | 2 | 7.4% |
| $75,000 to $99,999 | 5 | 18.5% |
| $100,000 to $149,999 | 8 | 29.6% |
| $150,000 to $199,999 | 0 | 0.0% |
| $200,000+ | 0 | 0.0% |
Family Income by Famaliy Size in Booneville
2-person families (13 | 48.1%) account for the highest median family income in Booneville with $48,438 per family, while 2-person families (13 | 48.1%) have the highest median income of $24,219 per family member.
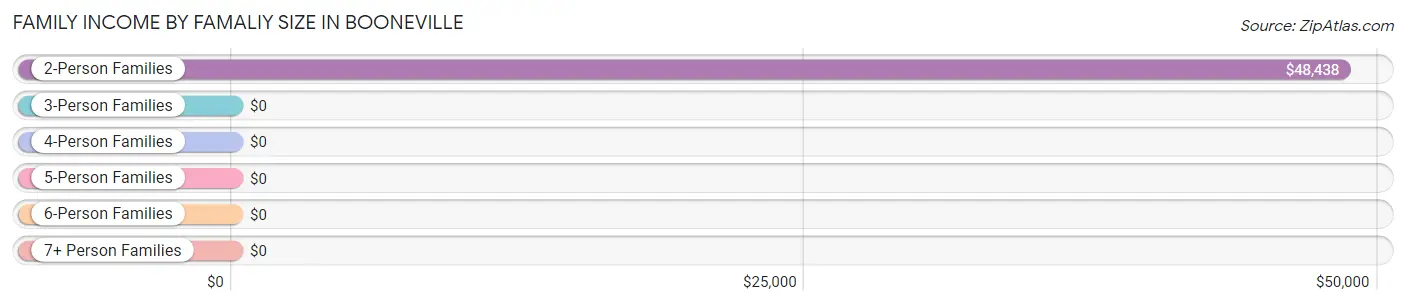
| Income Bracket | # Families | Median Income |
| 2-Person Families | 13 (48.1%) | $48,438 |
| 3-Person Families | 2 (7.4%) | $0 |
| 4-Person Families | 6 (22.2%) | $0 |
| 5-Person Families | 3 (11.1%) | $0 |
| 6-Person Families | 3 (11.1%) | $0 |
| 7+ Person Families | 0 (0.0%) | $0 |
| Total | 27 (100.0%) | $59,375 |
Family Income by Number of Earners in Booneville
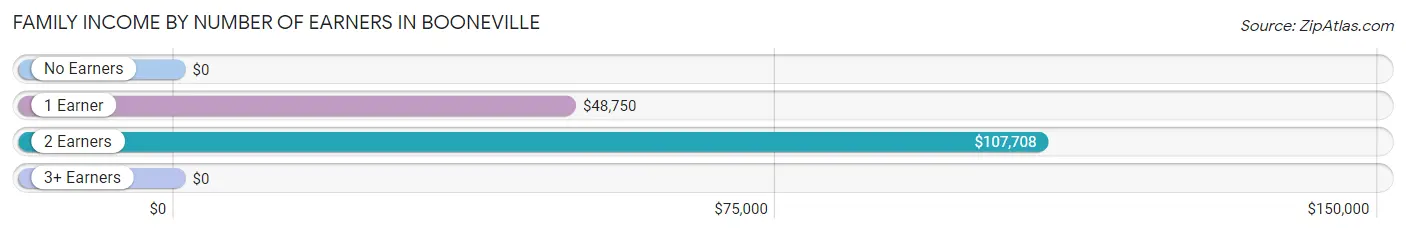
| Number of Earners | # Families | Median Income |
| No Earners | 4 (14.8%) | $0 |
| 1 Earner | 12 (44.4%) | $48,750 |
| 2 Earners | 11 (40.7%) | $107,708 |
| 3+ Earners | 0 (0.0%) | $0 |
| Total | 27 (100.0%) | $59,375 |
Household Income in Booneville
Household Income Brackets in Booneville
With 10 households falling in the category, the $35,000 to $49,999 income range is the most frequent in Booneville, accounting for 33.3% of all households.
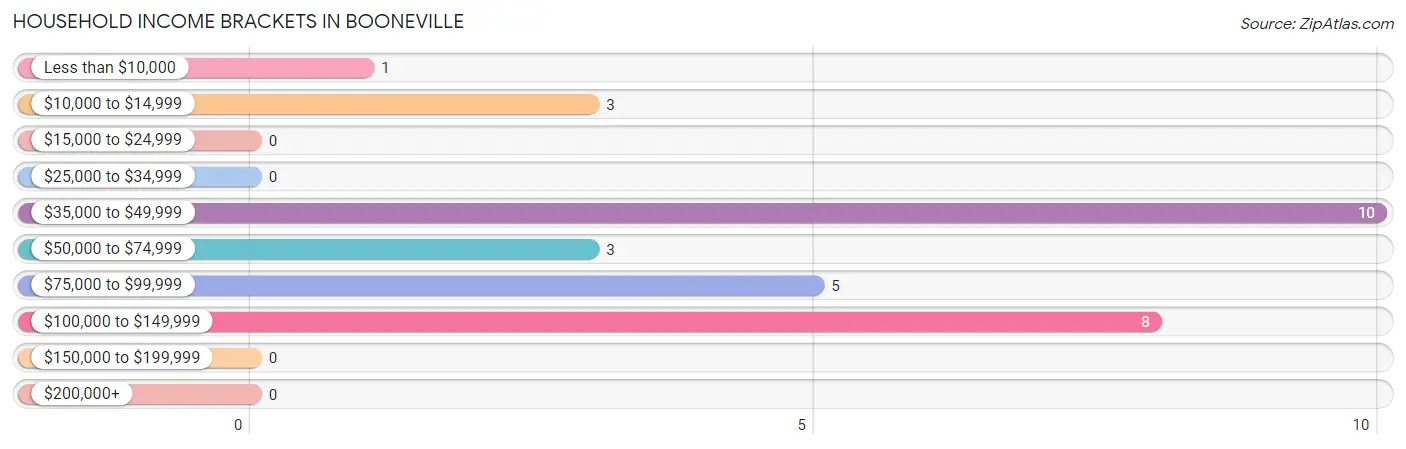
| Income Bracket | # Households | % Households |
| Less than $10,000 | 1 | 3.3% |
| $10,000 to $14,999 | 3 | 10.0% |
| $15,000 to $24,999 | 0 | 0.0% |
| $25,000 to $34,999 | 0 | 0.0% |
| $35,000 to $49,999 | 10 | 33.3% |
| $50,000 to $74,999 | 3 | 10.0% |
| $75,000 to $99,999 | 5 | 16.7% |
| $100,000 to $149,999 | 8 | 26.7% |
| $150,000 to $199,999 | 0 | 0.0% |
| $200,000+ | 0 | 0.0% |
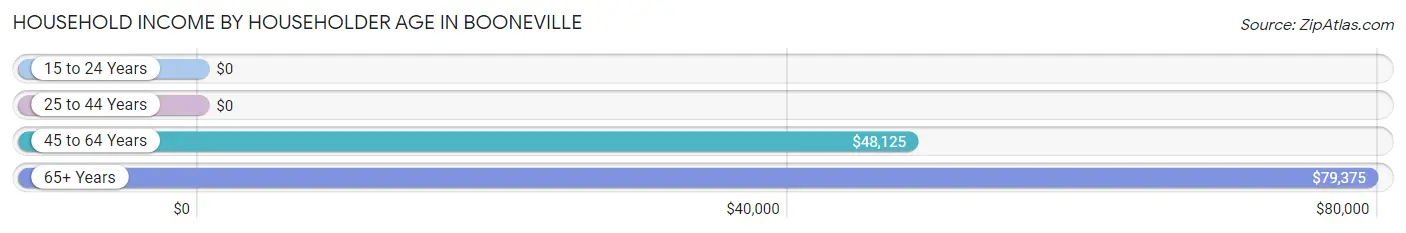
Household Income by Householder Age in Booneville
The median household income in Booneville is $55,000, with the highest median household income of $79,375 found in the 65+ years age bracket for the primary householder. A total of 13 households (43.3%) fall into this category.
| Income Bracket | # Households | Median Income |
| 15 to 24 Years | 0 (0.0%) | $0 |
| 25 to 44 Years | 5 (16.7%) | $0 |
| 45 to 64 Years | 12 (40.0%) | $48,125 |
| 65+ Years | 13 (43.3%) | $79,375 |
| Total | 30 (100.0%) | $55,000 |
Poverty in Booneville
Income Below Poverty by Sex and Age in Booneville
With 8.7% poverty level for males and 8.6% for females among the residents of Booneville, 12 to 14 year old males and 45 to 54 year old females are the most vulnerable to poverty, with 4 males (66.7%) and 2 females (66.7%) in their respective age groups living below the poverty level.
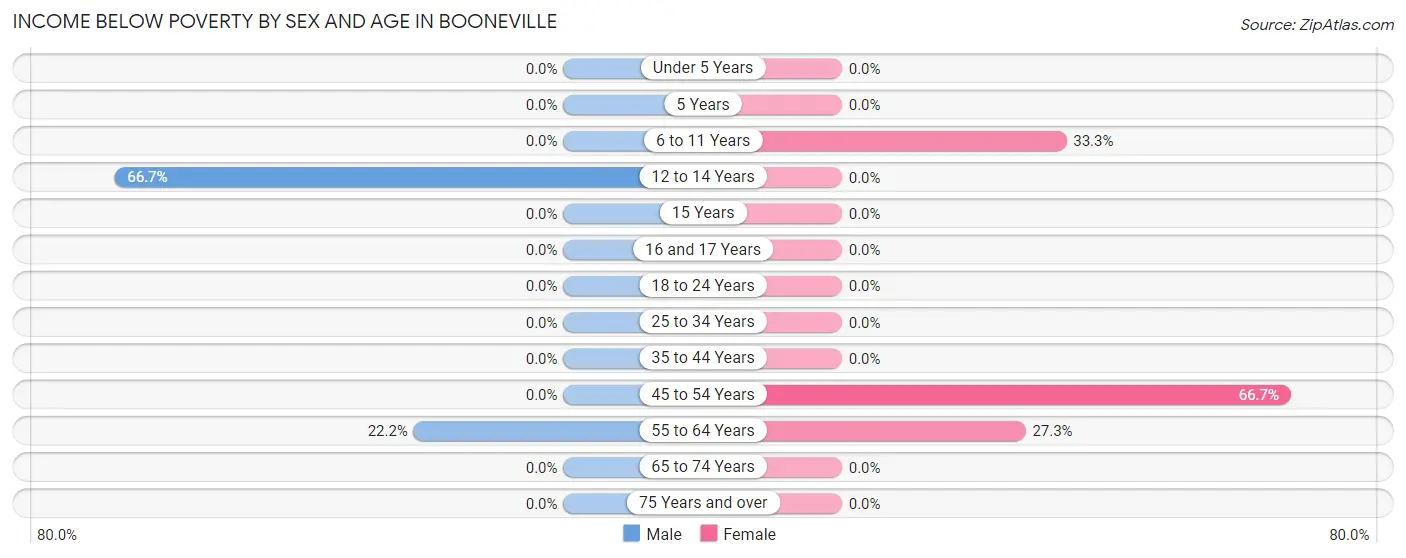
| Age Bracket | Male | Female |
| Under 5 Years | 0 (0.0%) | 0 (0.0%) |
| 5 Years | 0 (0.0%) | 0 (0.0%) |
| 6 to 11 Years | 0 (0.0%) | 1 (33.3%) |
| 12 to 14 Years | 4 (66.7%) | 0 (0.0%) |
| 15 Years | 0 (0.0%) | 0 (0.0%) |
| 16 and 17 Years | 0 (0.0%) | 0 (0.0%) |
| 18 to 24 Years | 0 (0.0%) | 0 (0.0%) |
| 25 to 34 Years | 0 (0.0%) | 0 (0.0%) |
| 35 to 44 Years | 0 (0.0%) | 0 (0.0%) |
| 45 to 54 Years | 0 (0.0%) | 2 (66.7%) |
| 55 to 64 Years | 2 (22.2%) | 3 (27.3%) |
| 65 to 74 Years | 0 (0.0%) | 0 (0.0%) |
| 75 Years and over | 0 (0.0%) | 0 (0.0%) |
| Total | 6 (8.7%) | 6 (8.6%) |
Income Above Poverty by Sex and Age in Booneville
According to the poverty statistics in Booneville, males aged 5 years and females aged 25 to 34 years are the age groups that are most secure financially, with 100.0% of males and 100.0% of females in these age groups living above the poverty line.
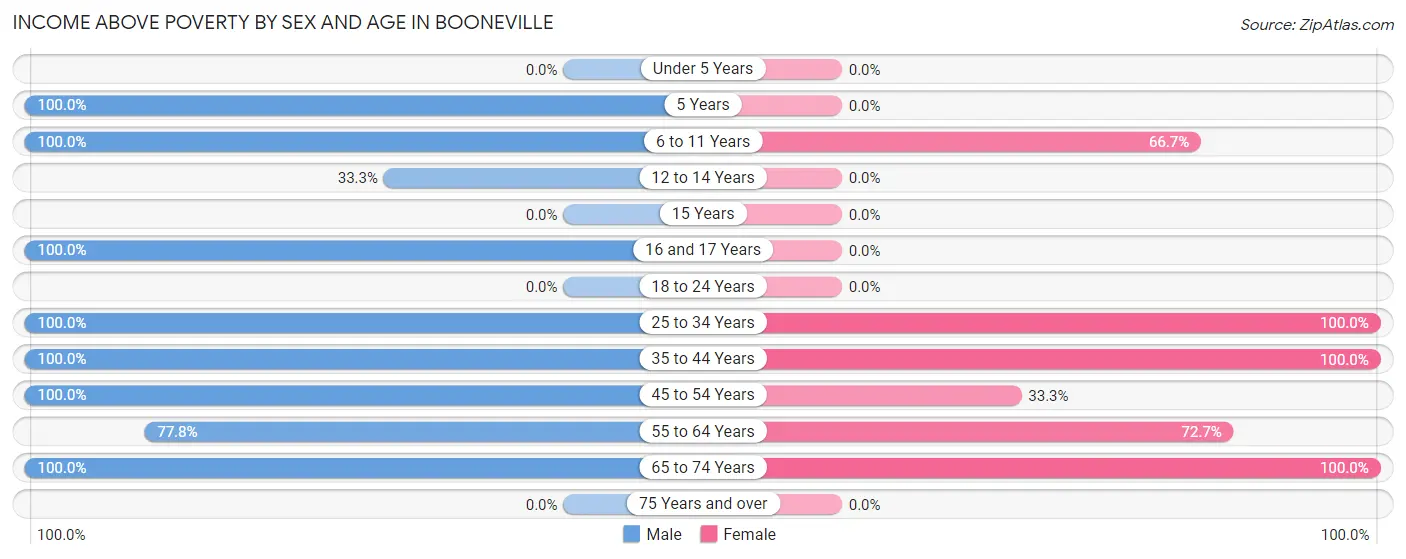
| Age Bracket | Male | Female |
| Under 5 Years | 0 (0.0%) | 0 (0.0%) |
| 5 Years | 2 (100.0%) | 0 (0.0%) |
| 6 to 11 Years | 14 (100.0%) | 2 (66.7%) |
| 12 to 14 Years | 2 (33.3%) | 0 (0.0%) |
| 15 Years | 0 (0.0%) | 0 (0.0%) |
| 16 and 17 Years | 1 (100.0%) | 0 (0.0%) |
| 18 to 24 Years | 0 (0.0%) | 0 (0.0%) |
| 25 to 34 Years | 9 (100.0%) | 5 (100.0%) |
| 35 to 44 Years | 18 (100.0%) | 36 (100.0%) |
| 45 to 54 Years | 2 (100.0%) | 1 (33.3%) |
| 55 to 64 Years | 7 (77.8%) | 8 (72.7%) |
| 65 to 74 Years | 8 (100.0%) | 12 (100.0%) |
| 75 Years and over | 0 (0.0%) | 0 (0.0%) |
| Total | 63 (91.3%) | 64 (91.4%) |
Income Below Poverty Among Married-Couple Families in Booneville
The poverty statistics for married-couple families in Booneville show that 11.8% or 2 of the total 17 families live below the poverty line. Families with 3 or 4 children have the highest poverty rate of 33.3%, comprising of 2 families. On the other hand, families with no children have the lowest poverty rate of 0.0%, which includes 0 families.
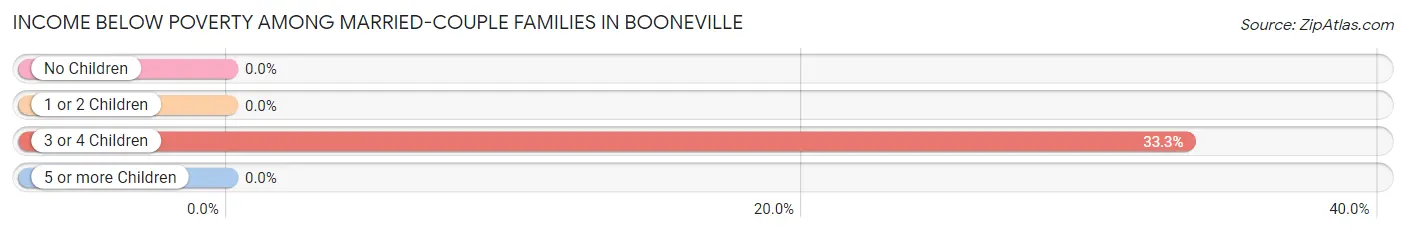
| Children | Above Poverty | Below Poverty |
| No Children | 11 (100.0%) | 0 (0.0%) |
| 1 or 2 Children | 0 (0.0%) | 0 (0.0%) |
| 3 or 4 Children | 4 (66.7%) | 2 (33.3%) |
| 5 or more Children | 0 (0.0%) | 0 (0.0%) |
| Total | 15 (88.2%) | 2 (11.8%) |
Income Below Poverty Among Single-Parent Households in Booneville
| Children | Single Father | Single Mother |
| No Children | 0 (0.0%) | 0 (0.0%) |
| 1 or 2 Children | 0 (0.0%) | 0 (0.0%) |
| 3 or 4 Children | 0 (0.0%) | 0 (0.0%) |
| 5 or more Children | 0 (0.0%) | 0 (0.0%) |
| Total | 0 (0.0%) | 0 (0.0%) |
Income Below Poverty Among Married-Couple vs Single-Parent Households in Booneville
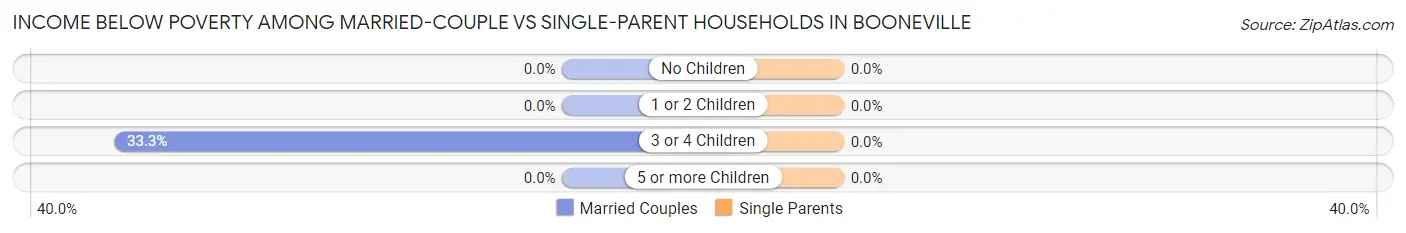
| Children | Married-Couple Families | Single-Parent Households |
| No Children | 0 (0.0%) | 0 (0.0%) |
| 1 or 2 Children | 0 (0.0%) | 0 (0.0%) |
| 3 or 4 Children | 2 (33.3%) | 0 (0.0%) |
| 5 or more Children | 0 (0.0%) | 0 (0.0%) |
| Total | 2 (11.8%) | 0 (0.0%) |
Race in Booneville
The most populous races in Booneville are White / Caucasian (131 | 94.2%), Asian (6 | 4.3%), and Two or more Races (2 | 1.4%).
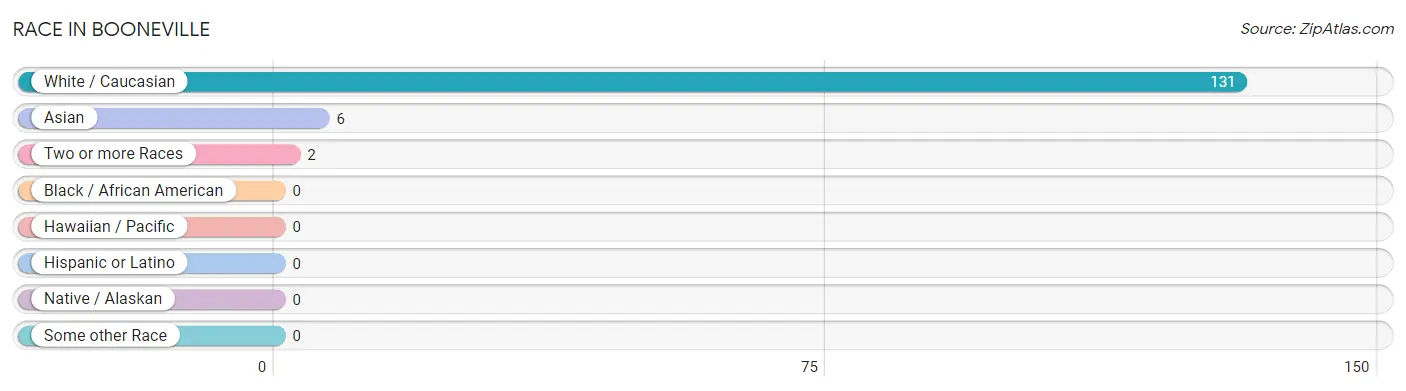
| Race | # Population | % Population |
| Asian | 6 | 4.3% |
| Black / African American | 0 | 0.0% |
| Hawaiian / Pacific | 0 | 0.0% |
| Hispanic or Latino | 0 | 0.0% |
| Native / Alaskan | 0 | 0.0% |
| White / Caucasian | 131 | 94.2% |
| Two or more Races | 2 | 1.4% |
| Some other Race | 0 | 0.0% |
| Total | 139 | 100.0% |
Ancestry in Booneville
The most populous ancestries reported in Booneville are American (26 | 18.7%), English (8 | 5.8%), Burmese (6 | 4.3%), Dutch (4 | 2.9%), and Italian (3 | 2.2%), together accounting for 33.8% of all Booneville residents.
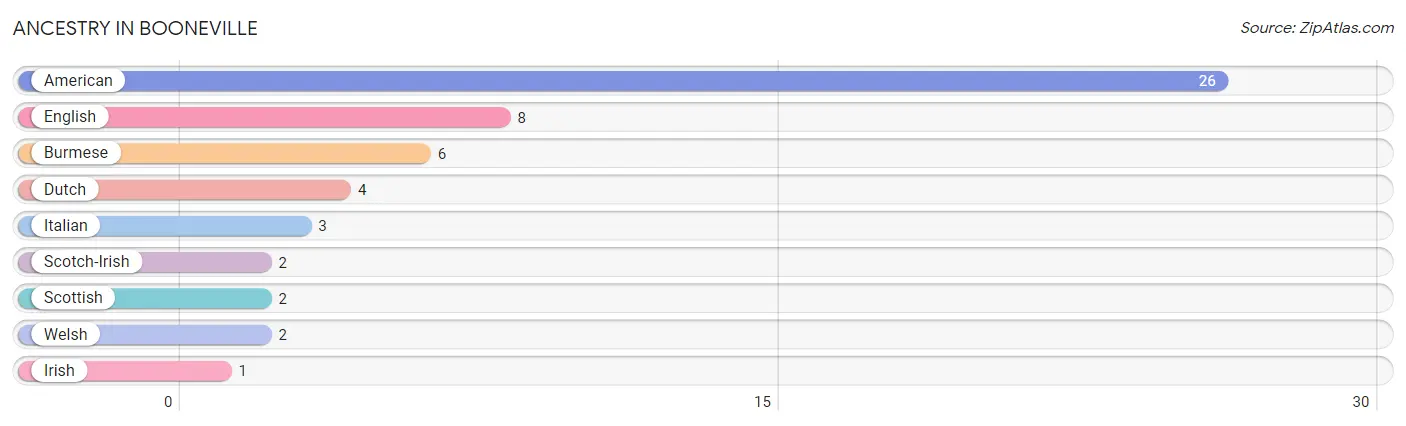
| Ancestry | # Population | % Population |
| American | 26 | 18.7% |
| Burmese | 6 | 4.3% |
| Dutch | 4 | 2.9% |
| English | 8 | 5.8% |
| Irish | 1 | 0.7% |
| Italian | 3 | 2.2% |
| Scotch-Irish | 2 | 1.4% |
| Scottish | 2 | 1.4% |
| Welsh | 2 | 1.4% | View All 9 Rows |
Immigrants in Booneville
The most numerous immigrant groups reported in Booneville came from Asia (6 | 4.3%), Eastern Asia (6 | 4.3%), and Korea (6 | 4.3%), together accounting for 13.0% of all Booneville residents.
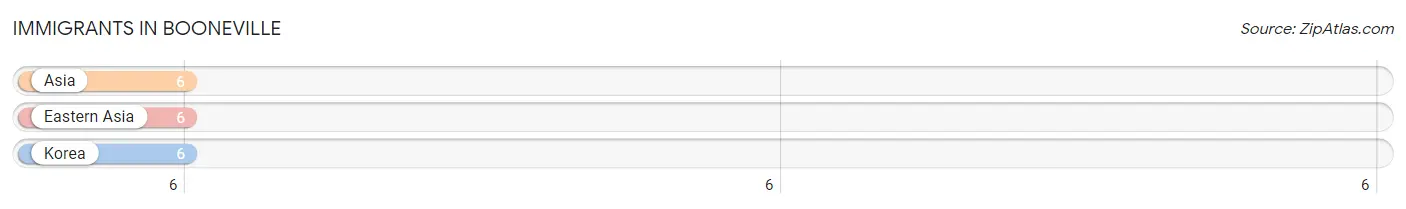
| Immigration Origin | # Population | % Population |
| Asia | 6 | 4.3% |
| Eastern Asia | 6 | 4.3% |
| Korea | 6 | 4.3% | View All 3 Rows |
Sex and Age in Booneville
Sex and Age in Booneville
The most populous age groups in Booneville are 35 to 39 Years (18 | 26.1%) for men and 35 to 39 Years (36 | 51.4%) for women.
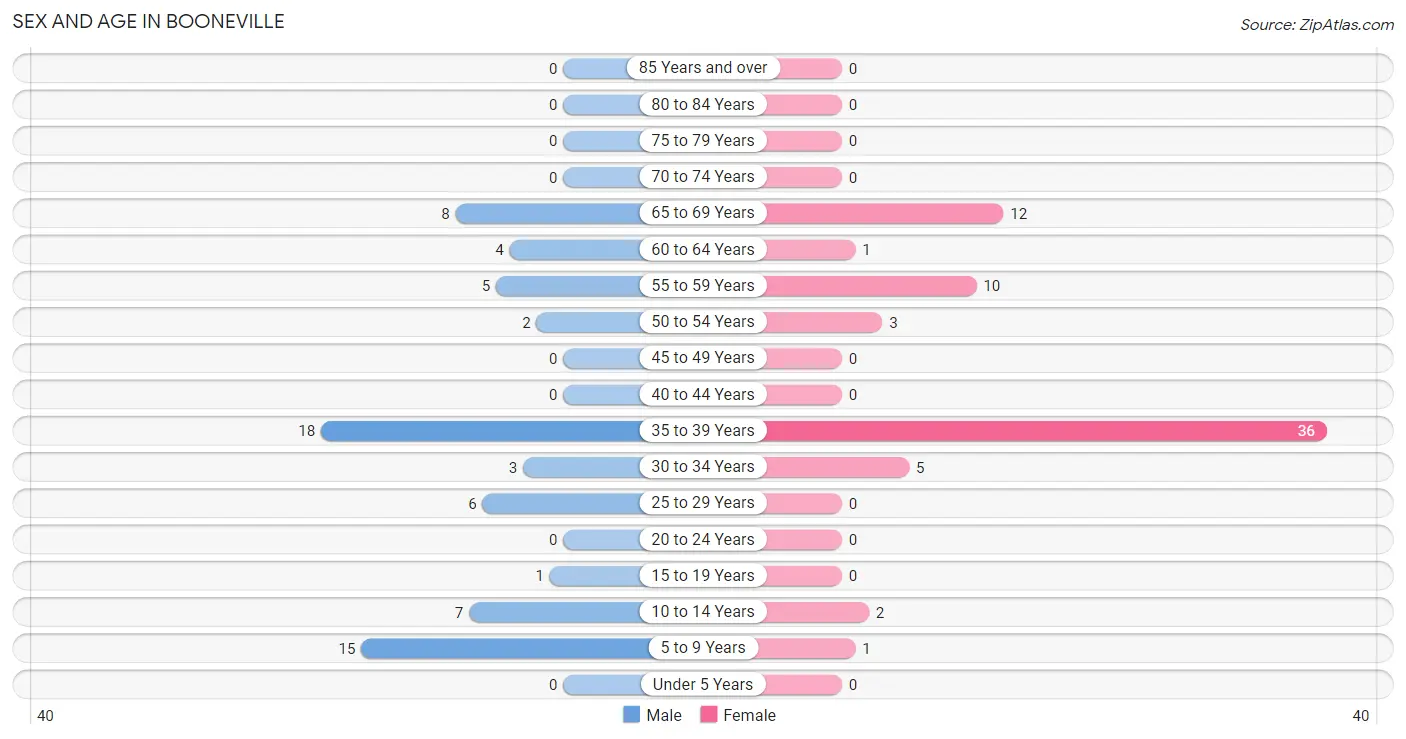
| Age Bracket | Male | Female |
| Under 5 Years | 0 (0.0%) | 0 (0.0%) |
| 5 to 9 Years | 15 (21.7%) | 1 (1.4%) |
| 10 to 14 Years | 7 (10.1%) | 2 (2.9%) |
| 15 to 19 Years | 1 (1.5%) | 0 (0.0%) |
| 20 to 24 Years | 0 (0.0%) | 0 (0.0%) |
| 25 to 29 Years | 6 (8.7%) | 0 (0.0%) |
| 30 to 34 Years | 3 (4.3%) | 5 (7.1%) |
| 35 to 39 Years | 18 (26.1%) | 36 (51.4%) |
| 40 to 44 Years | 0 (0.0%) | 0 (0.0%) |
| 45 to 49 Years | 0 (0.0%) | 0 (0.0%) |
| 50 to 54 Years | 2 (2.9%) | 3 (4.3%) |
| 55 to 59 Years | 5 (7.2%) | 10 (14.3%) |
| 60 to 64 Years | 4 (5.8%) | 1 (1.4%) |
| 65 to 69 Years | 8 (11.6%) | 12 (17.1%) |
| 70 to 74 Years | 0 (0.0%) | 0 (0.0%) |
| 75 to 79 Years | 0 (0.0%) | 0 (0.0%) |
| 80 to 84 Years | 0 (0.0%) | 0 (0.0%) |
| 85 Years and over | 0 (0.0%) | 0 (0.0%) |
| Total | 69 (100.0%) | 70 (100.0%) |
Families and Households in Booneville
Median Family Size in Booneville
The median family size in Booneville is 5.00 persons per family, with single female/mother families (6 | 22.2%) accounting for the largest median family size of 11.5 persons per family. On the other hand, single male/father families (4 | 14.8%) represent the smallest median family size with 2.75 persons per family.
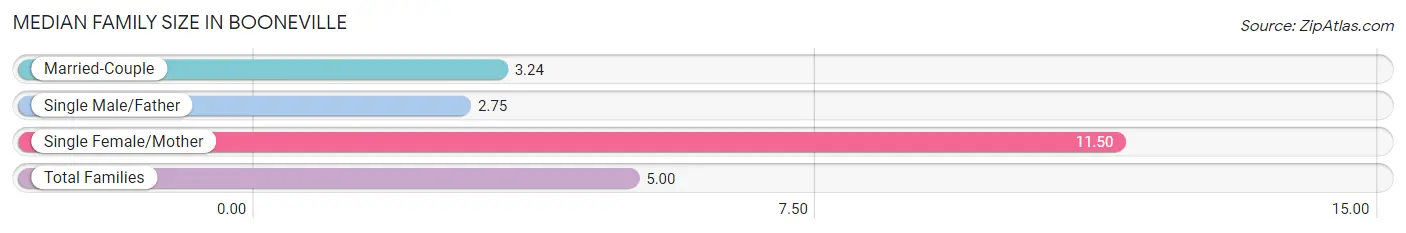
| Family Type | # Families | Family Size |
| Married-Couple | 17 (63.0%) | 3.24 |
| Single Male/Father | 4 (14.8%) | 2.75 |
| Single Female/Mother | 6 (22.2%) | 11.50 |
| Total Families | 27 (100.0%) | 5.00 |
Median Household Size in Booneville
The median household size in Booneville is 4.63 persons per household, with single female/mother households (6 | 20.0%) accounting for the largest median household size of 11.5 persons per household. non-family households (3 | 10.0%) represent the smallest median household size with 1.33 persons per household.
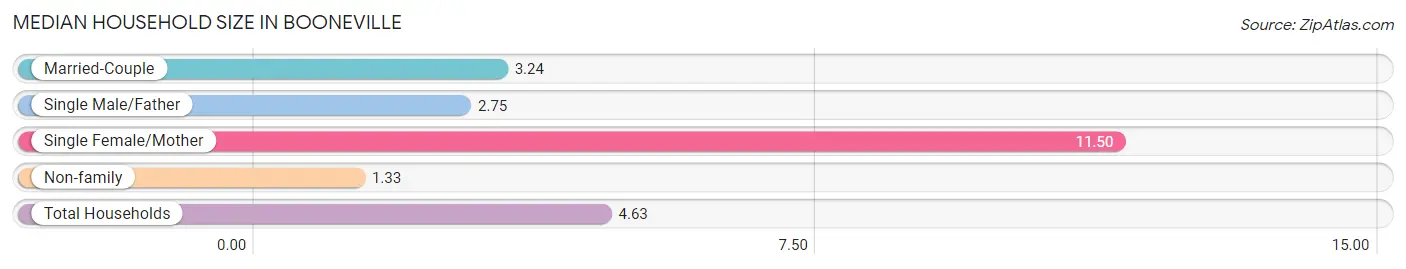
| Household Type | # Households | Household Size |
| Married-Couple | 17 (56.7%) | 3.24 |
| Single Male/Father | 4 (13.3%) | 2.75 |
| Single Female/Mother | 6 (20.0%) | 11.50 |
| Non-family | 3 (10.0%) | 1.33 |
| Total Households | 30 (100.0%) | 4.63 |
Household Size by Marriage Status in Booneville
Out of a total of 30 households in Booneville, 27 (90.0%) are family households, while 3 (10.0%) are nonfamily households. The most numerous type of family households are 2-person households, comprising 13, and the most common type of nonfamily households are 1-person households, comprising 2.
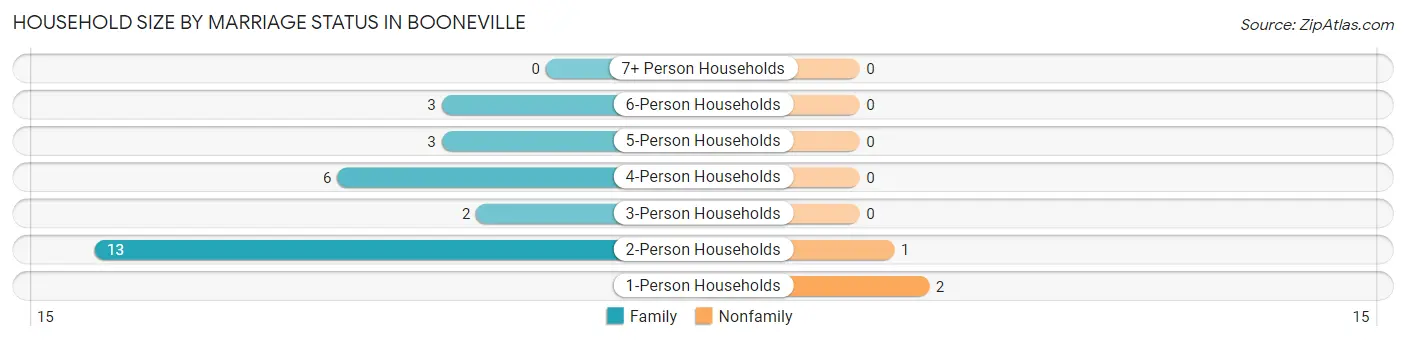
| Household Size | Family Households | Nonfamily Households |
| 1-Person Households | - | 2 (6.7%) |
| 2-Person Households | 13 (43.3%) | 1 (3.3%) |
| 3-Person Households | 2 (6.7%) | 0 (0.0%) |
| 4-Person Households | 6 (20.0%) | 0 (0.0%) |
| 5-Person Households | 3 (10.0%) | 0 (0.0%) |
| 6-Person Households | 3 (10.0%) | 0 (0.0%) |
| 7+ Person Households | 0 (0.0%) | 0 (0.0%) |
| Total | 27 (90.0%) | 3 (10.0%) |
Female Fertility in Booneville
Fertility by Age in Booneville
| Age Bracket | Women with Births | Births / 1,000 Women |
| 15 to 19 years | 0 (0.0%) | 0.0 |
| 20 to 34 years | 0 (0.0%) | 0.0 |
| 35 to 50 years | 0 (0.0%) | 0.0 |
| Total | 0 (0.0%) | 0.0 |
Fertility by Age by Marriage Status in Booneville
| Age Bracket | Married | Unmarried |
| 15 to 19 years | 0 (0.0%) | 0 (0.0%) |
| 20 to 34 years | 0 (0.0%) | 0 (0.0%) |
| 35 to 50 years | 0 (0.0%) | 0 (0.0%) |
| Total | 0 (0.0%) | 0 (0.0%) |
Fertility by Education in Booneville
| Educational Attainment | Women with Births | Births / 1,000 Women |
| Less than High School | 0 (0.0%) | 0.0 |
| High School Diploma | 0 (0.0%) | 0.0 |
| College or Associate's Degree | 0 (0.0%) | 0.0 |
| Bachelor's Degree | 0 (0.0%) | 0.0 |
| Graduate Degree | 0 (0.0%) | 0.0 |
| Total | 0 (0.0%) | 0.0 |
Fertility by Education by Marriage Status in Booneville
| Educational Attainment | Married | Unmarried |
| Less than High School | 0 (0.0%) | 0 (0.0%) |
| High School Diploma | 0 (0.0%) | 0 (0.0%) |
| College or Associate's Degree | 0 (0.0%) | 0 (0.0%) |
| Bachelor's Degree | 0 (0.0%) | 0 (0.0%) |
| Graduate Degree | 0 (0.0%) | 0 (0.0%) |
| Total | 0 (0.0%) | 0 (0.0%) |
Employment Characteristics in Booneville
Employment by Class of Employer in Booneville
Among the 83 employed individuals in Booneville, not-for-profit organizations (43 | 51.8%), private company employees (32 | 38.6%), and local government employees (8 | 9.6%) make up the most common classes of employment.
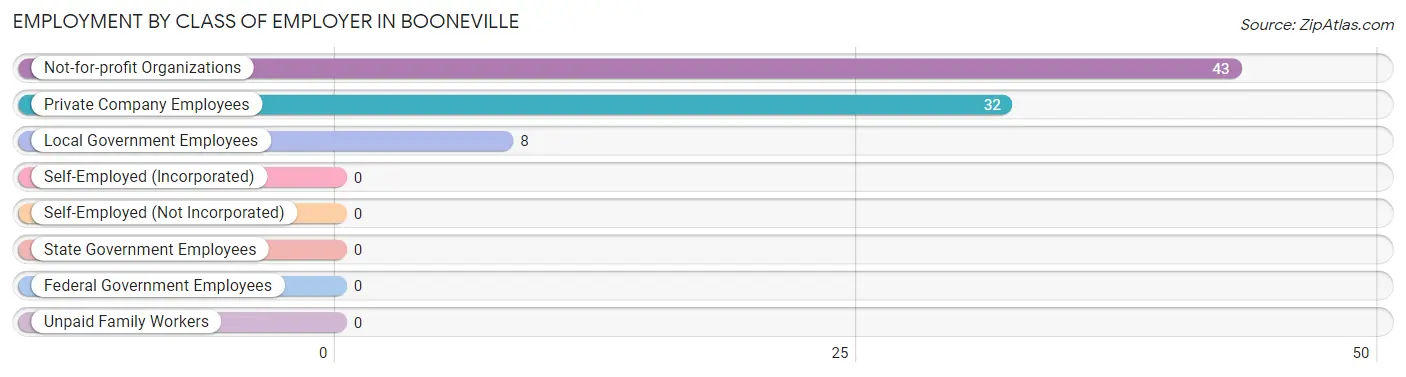
| Employer Class | # Employees | % Employees |
| Private Company Employees | 32 | 38.6% |
| Self-Employed (Incorporated) | 0 | 0.0% |
| Self-Employed (Not Incorporated) | 0 | 0.0% |
| Not-for-profit Organizations | 43 | 51.8% |
| Local Government Employees | 8 | 9.6% |
| State Government Employees | 0 | 0.0% |
| Federal Government Employees | 0 | 0.0% |
| Unpaid Family Workers | 0 | 0.0% |
| Total | 83 | 100.0% |
Employment Status by Age in Booneville
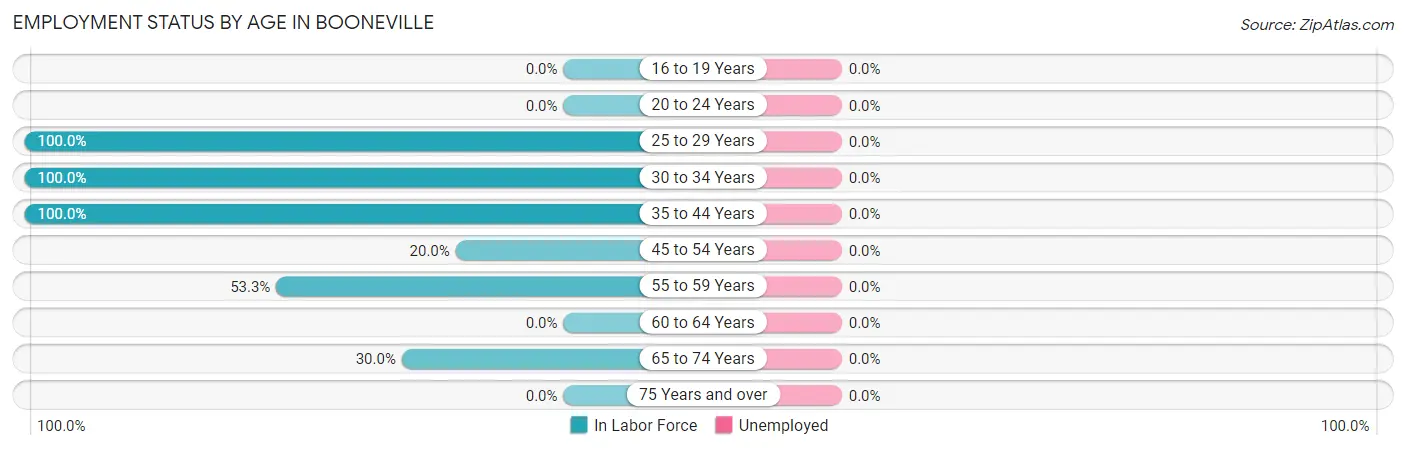
| Age Bracket | In Labor Force | Unemployed |
| 16 to 19 Years | 0 (0.0%) | 0 (0.0%) |
| 20 to 24 Years | 0 (0.0%) | 0 (0.0%) |
| 25 to 29 Years | 6 (100.0%) | 0 (0.0%) |
| 30 to 34 Years | 8 (100.0%) | 0 (0.0%) |
| 35 to 44 Years | 54 (100.0%) | 0 (0.0%) |
| 45 to 54 Years | 1 (20.0%) | 0 (0.0%) |
| 55 to 59 Years | 8 (53.3%) | 0 (0.0%) |
| 60 to 64 Years | 0 (0.0%) | 0 (0.0%) |
| 65 to 74 Years | 6 (30.0%) | 0 (0.0%) |
| 75 Years and over | 0 (0.0%) | 0 (0.0%) |
| Total | 83 (72.8%) | 0 (0.0%) |
Employment Status by Educational Attainment in Booneville
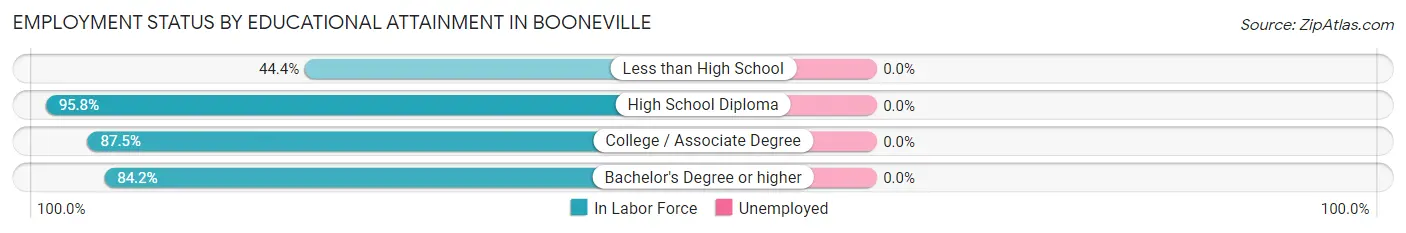
| Educational Attainment | In Labor Force | Unemployed |
| Less than High School | 8 (44.4%) | 0 (0.0%) |
| High School Diploma | 46 (95.8%) | 0 (0.0%) |
| College / Associate Degree | 7 (87.5%) | 0 (0.0%) |
| Bachelor's Degree or higher | 16 (84.2%) | 0 (0.0%) |
| Total | 77 (82.8%) | 0 (0.0%) |
Employment Occupations by Sex in Booneville
Management, Business, Science and Arts Occupations
The most common Management, Business, Science and Arts occupations in Booneville are Community & Social Service (38 | 45.8%), Education, Arts & Media (36 | 43.4%), and Education Instruction & Library (2 | 2.4%).
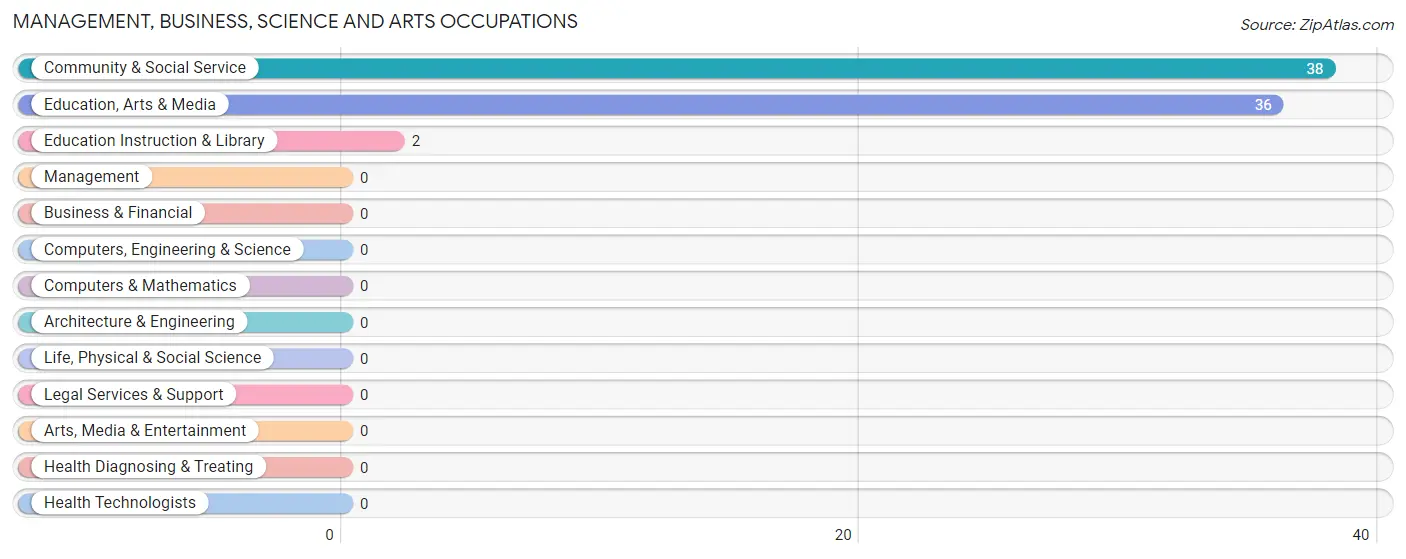
Management, Business, Science and Arts Occupations by Sex
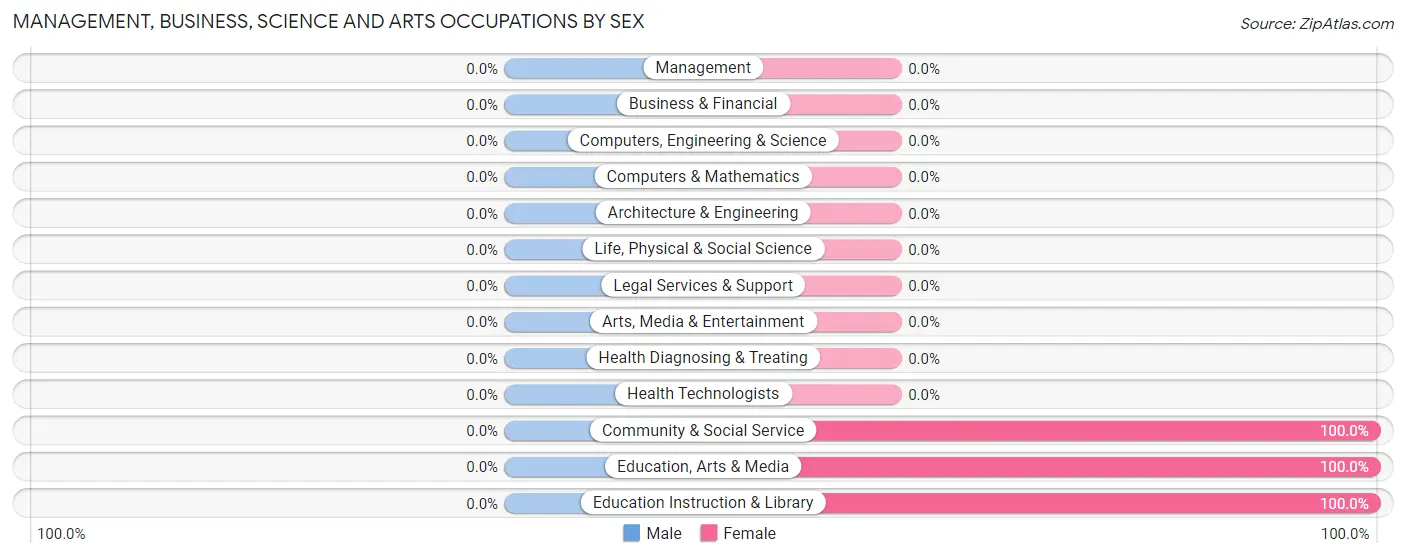
| Occupation | Male | Female |
| Management | 0 (0.0%) | 0 (0.0%) |
| Business & Financial | 0 (0.0%) | 0 (0.0%) |
| Computers, Engineering & Science | 0 (0.0%) | 0 (0.0%) |
| Computers & Mathematics | 0 (0.0%) | 0 (0.0%) |
| Architecture & Engineering | 0 (0.0%) | 0 (0.0%) |
| Life, Physical & Social Science | 0 (0.0%) | 0 (0.0%) |
| Community & Social Service | 0 (0.0%) | 38 (100.0%) |
| Education, Arts & Media | 0 (0.0%) | 36 (100.0%) |
| Legal Services & Support | 0 (0.0%) | 0 (0.0%) |
| Education Instruction & Library | 0 (0.0%) | 2 (100.0%) |
| Arts, Media & Entertainment | 0 (0.0%) | 0 (0.0%) |
| Health Diagnosing & Treating | 0 (0.0%) | 0 (0.0%) |
| Health Technologists | 0 (0.0%) | 0 (0.0%) |
| Total (Category) | 0 (0.0%) | 38 (100.0%) |
| Total (Overall) | 34 (41.0%) | 49 (59.0%) |
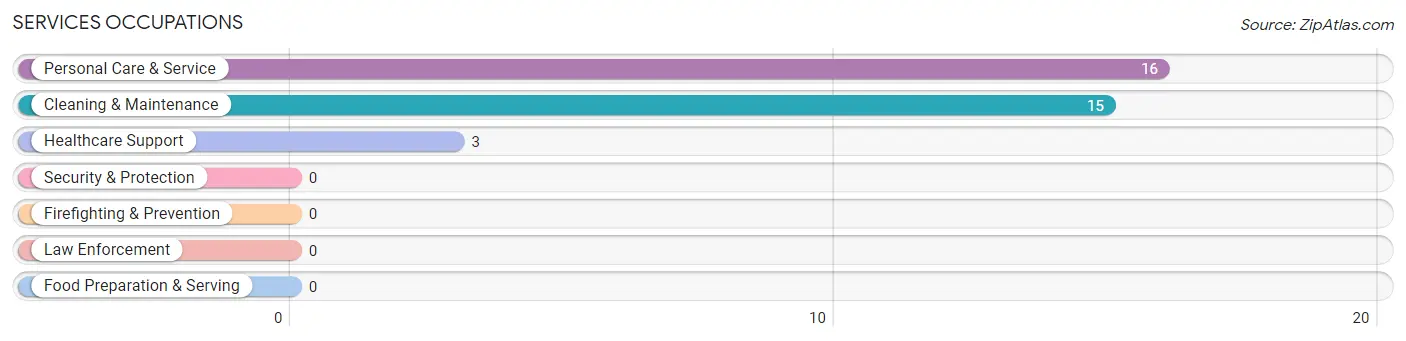
Services Occupations
The most common Services occupations in Booneville are Personal Care & Service (16 | 19.3%), Cleaning & Maintenance (15 | 18.1%), and Healthcare Support (3 | 3.6%).
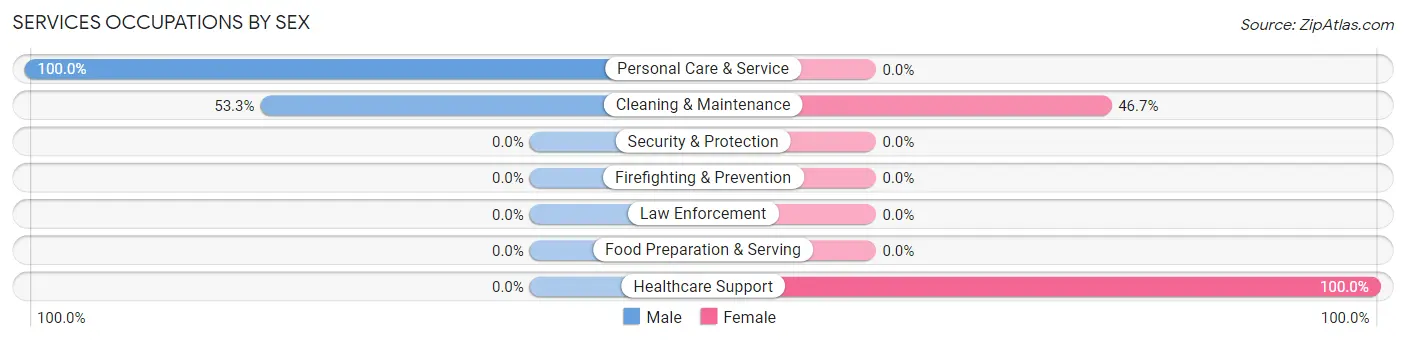
Services Occupations by Sex
Within the Services occupations in Booneville, the most male-oriented occupations are Personal Care & Service (100.0%), and Cleaning & Maintenance (53.3%), while the most female-oriented occupations are Healthcare Support (100.0%), and Cleaning & Maintenance (46.7%).
| Occupation | Male | Female |
| Healthcare Support | 0 (0.0%) | 3 (100.0%) |
| Security & Protection | 0 (0.0%) | 0 (0.0%) |
| Firefighting & Prevention | 0 (0.0%) | 0 (0.0%) |
| Law Enforcement | 0 (0.0%) | 0 (0.0%) |
| Food Preparation & Serving | 0 (0.0%) | 0 (0.0%) |
| Cleaning & Maintenance | 8 (53.3%) | 7 (46.7%) |
| Personal Care & Service | 16 (100.0%) | 0 (0.0%) |
| Total (Category) | 24 (70.6%) | 10 (29.4%) |
| Total (Overall) | 34 (41.0%) | 49 (59.0%) |
Sales and Office Occupations
The most common Sales and Office occupations in Booneville are , and Office & Administration (4 | 4.8%).
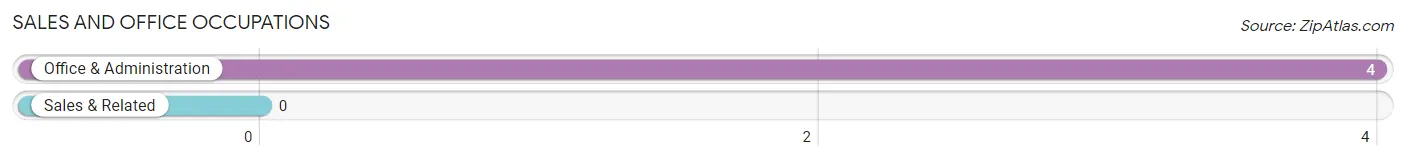
Sales and Office Occupations by Sex
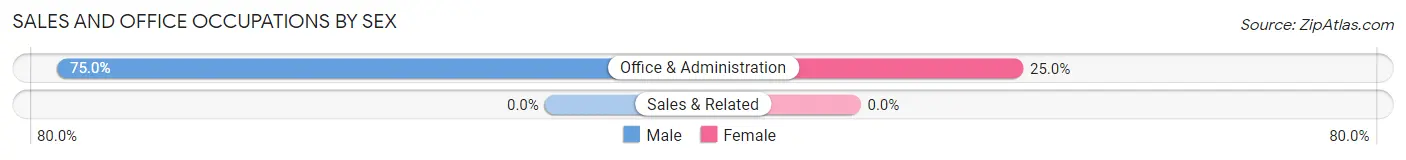
| Occupation | Male | Female |
| Sales & Related | 0 (0.0%) | 0 (0.0%) |
| Office & Administration | 3 (75.0%) | 1 (25.0%) |
| Total (Category) | 3 (75.0%) | 1 (25.0%) |
| Total (Overall) | 34 (41.0%) | 49 (59.0%) |
Natural Resources, Construction and Maintenance Occupations
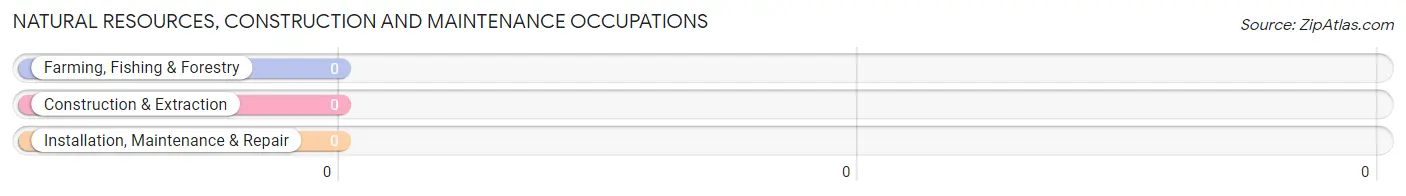
Natural Resources, Construction and Maintenance Occupations by Sex
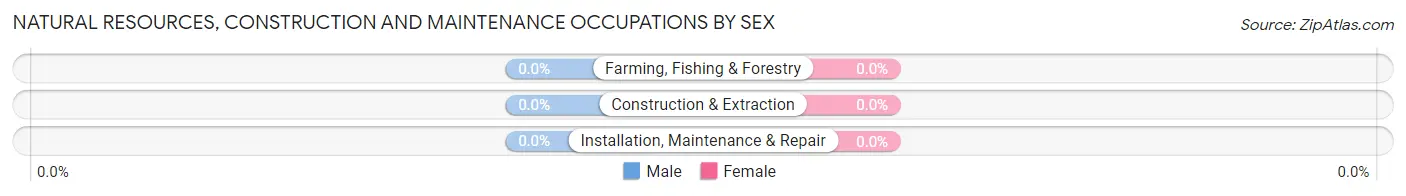
| Occupation | Male | Female |
| Farming, Fishing & Forestry | 0 (0.0%) | 0 (0.0%) |
| Construction & Extraction | 0 (0.0%) | 0 (0.0%) |
| Installation, Maintenance & Repair | 0 (0.0%) | 0 (0.0%) |
| Total (Category) | 0 (0.0%) | 0 (0.0%) |
| Total (Overall) | 34 (41.0%) | 49 (59.0%) |
Production, Transportation and Moving Occupations
The most common Production, Transportation and Moving occupations in Booneville are , and Transportation (7 | 8.4%).
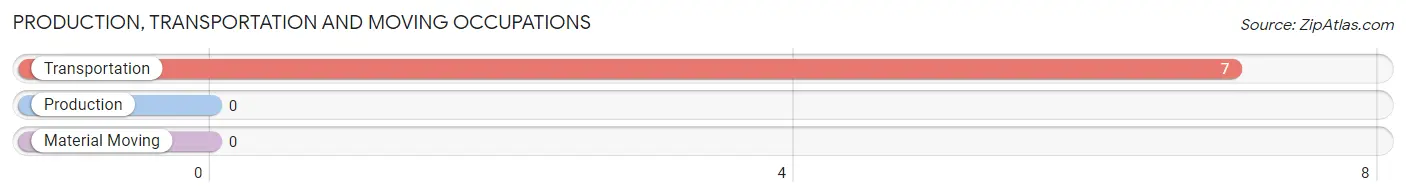
Production, Transportation and Moving Occupations by Sex
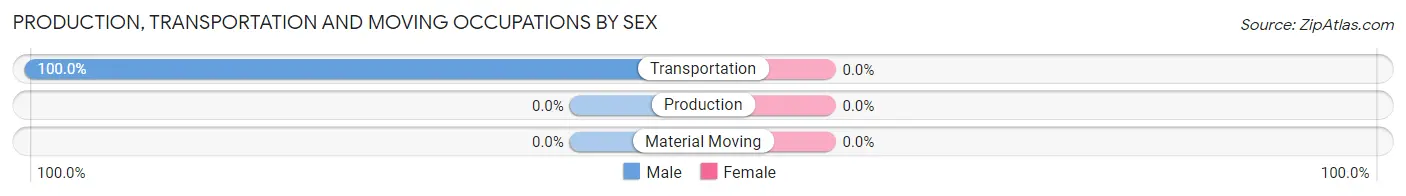
| Occupation | Male | Female |
| Production | 0 (0.0%) | 0 (0.0%) |
| Transportation | 7 (100.0%) | 0 (0.0%) |
| Material Moving | 0 (0.0%) | 0 (0.0%) |
| Total (Category) | 7 (100.0%) | 0 (0.0%) |
| Total (Overall) | 34 (41.0%) | 49 (59.0%) |
Employment Industries by Sex in Booneville
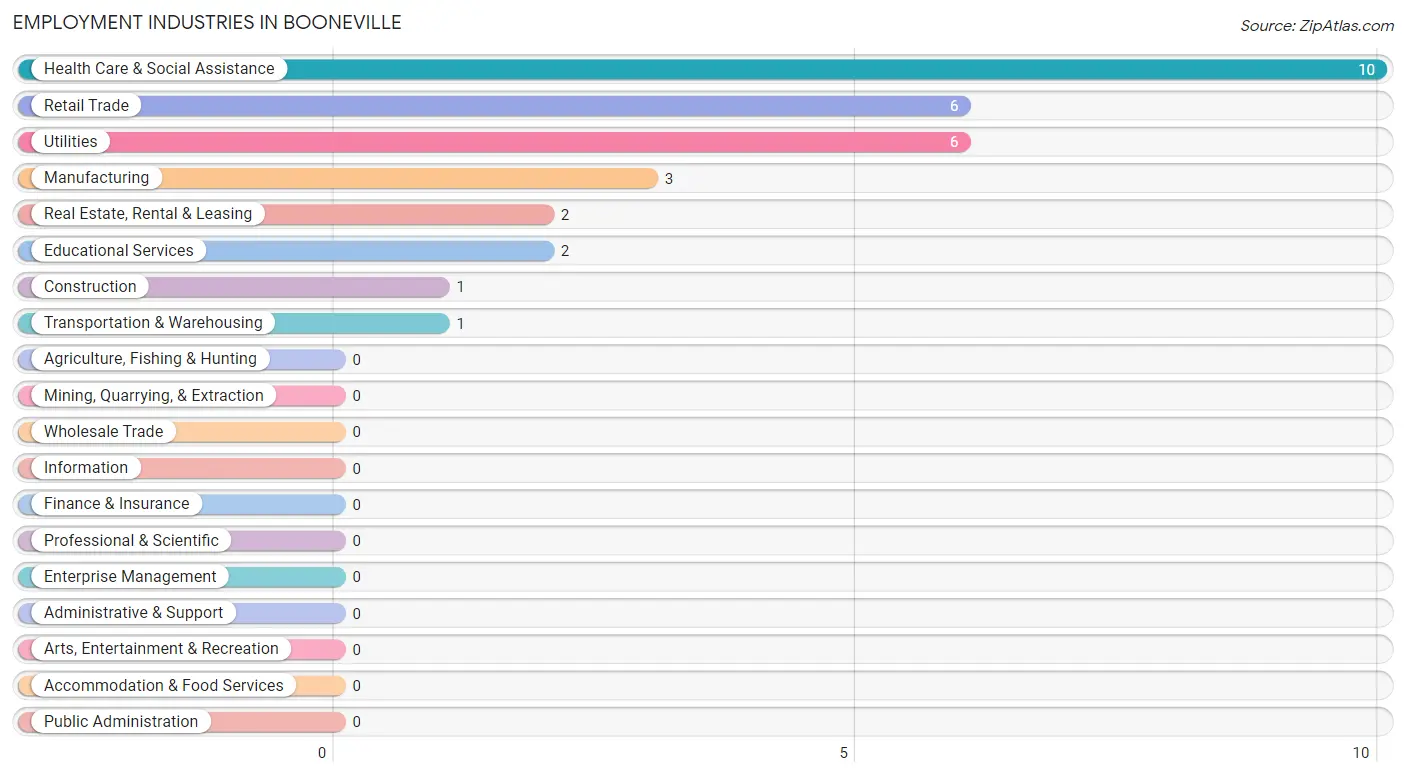
Employment Industries in Booneville
The major employment industries in Booneville include Health Care & Social Assistance (10 | 12.0%), Retail Trade (6 | 7.2%), Utilities (6 | 7.2%), Manufacturing (3 | 3.6%), and Real Estate, Rental & Leasing (2 | 2.4%).
Employment Industries by Sex in Booneville
The Booneville industries that see more men than women are Manufacturing (100.0%), Retail Trade (100.0%), and Transportation & Warehousing (100.0%), whereas the industries that tend to have a higher number of women are Construction (100.0%), Educational Services (100.0%), and Health Care & Social Assistance (100.0%).
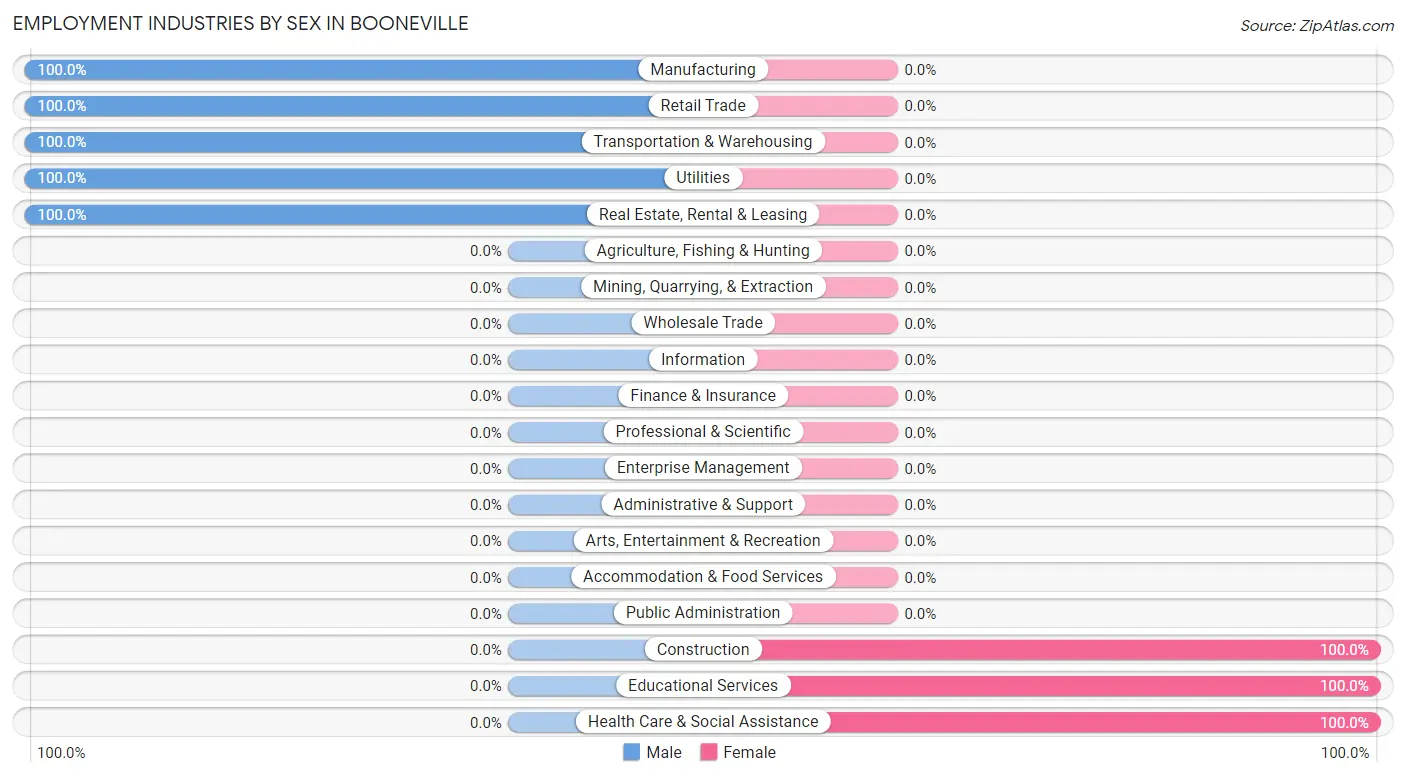
| Industry | Male | Female |
| Agriculture, Fishing & Hunting | 0 (0.0%) | 0 (0.0%) |
| Mining, Quarrying, & Extraction | 0 (0.0%) | 0 (0.0%) |
| Construction | 0 (0.0%) | 1 (100.0%) |
| Manufacturing | 3 (100.0%) | 0 (0.0%) |
| Wholesale Trade | 0 (0.0%) | 0 (0.0%) |
| Retail Trade | 6 (100.0%) | 0 (0.0%) |
| Transportation & Warehousing | 1 (100.0%) | 0 (0.0%) |
| Utilities | 6 (100.0%) | 0 (0.0%) |
| Information | 0 (0.0%) | 0 (0.0%) |
| Finance & Insurance | 0 (0.0%) | 0 (0.0%) |
| Real Estate, Rental & Leasing | 2 (100.0%) | 0 (0.0%) |
| Professional & Scientific | 0 (0.0%) | 0 (0.0%) |
| Enterprise Management | 0 (0.0%) | 0 (0.0%) |
| Administrative & Support | 0 (0.0%) | 0 (0.0%) |
| Educational Services | 0 (0.0%) | 2 (100.0%) |
| Health Care & Social Assistance | 0 (0.0%) | 10 (100.0%) |
| Arts, Entertainment & Recreation | 0 (0.0%) | 0 (0.0%) |
| Accommodation & Food Services | 0 (0.0%) | 0 (0.0%) |
| Public Administration | 0 (0.0%) | 0 (0.0%) |
| Total | 34 (41.0%) | 49 (59.0%) |
Education in Booneville
School Enrollment in Booneville
The most common levels of schooling among the 26 students in Booneville are kindergarten (13 | 50.0%), middle school (9 | 34.6%), and elementary school (3 | 11.5%).
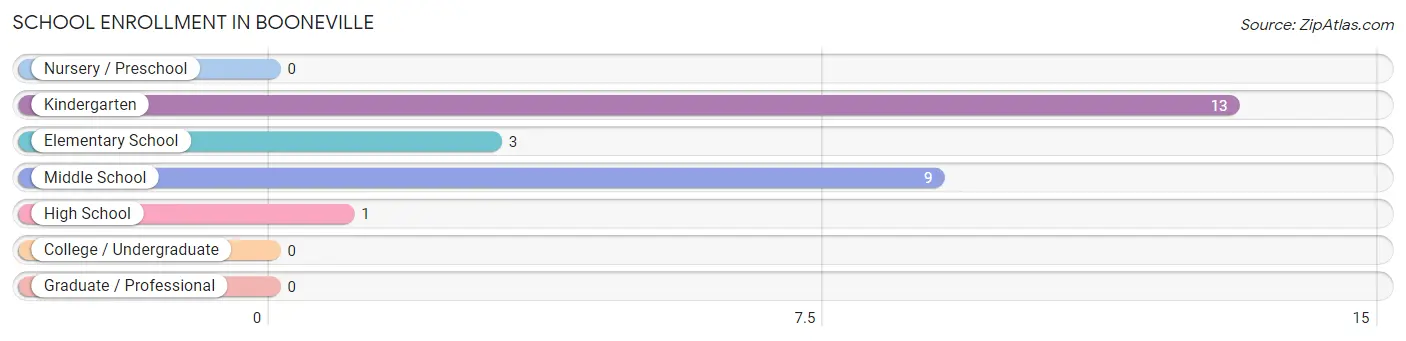
| School Level | # Students | % Students |
| Nursery / Preschool | 0 | 0.0% |
| Kindergarten | 13 | 50.0% |
| Elementary School | 3 | 11.5% |
| Middle School | 9 | 34.6% |
| High School | 1 | 3.8% |
| College / Undergraduate | 0 | 0.0% |
| Graduate / Professional | 0 | 0.0% |
| Total | 26 | 100.0% |
School Enrollment by Age by Funding Source in Booneville
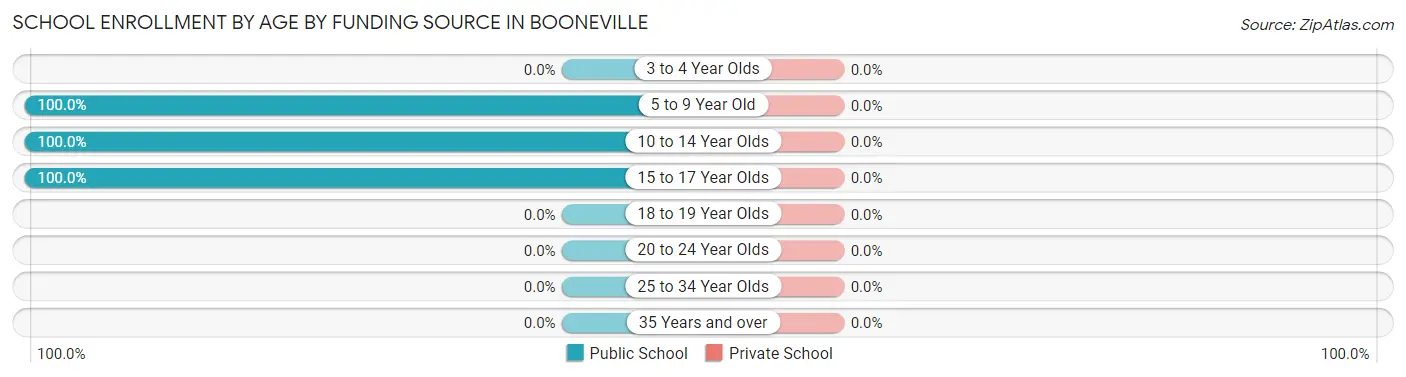
| Age Bracket | Public School | Private School |
| 3 to 4 Year Olds | 0 (0.0%) | 0 (0.0%) |
| 5 to 9 Year Old | 16 (100.0%) | 0 (0.0%) |
| 10 to 14 Year Olds | 9 (100.0%) | 0 (0.0%) |
| 15 to 17 Year Olds | 1 (100.0%) | 0 (0.0%) |
| 18 to 19 Year Olds | 0 (0.0%) | 0 (0.0%) |
| 20 to 24 Year Olds | 0 (0.0%) | 0 (0.0%) |
| 25 to 34 Year Olds | 0 (0.0%) | 0 (0.0%) |
| 35 Years and over | 0 (0.0%) | 0 (0.0%) |
| Total | 26 (100.0%) | 0 (0.0%) |
Educational Attainment by Field of Study in Booneville
Arts & humanities (16 | 76.2%), science & technology (3 | 14.3%), and bio, nature & agricultural (2 | 9.5%) are the most common fields of study among 21 individuals in Booneville who have obtained a bachelor's degree or higher.
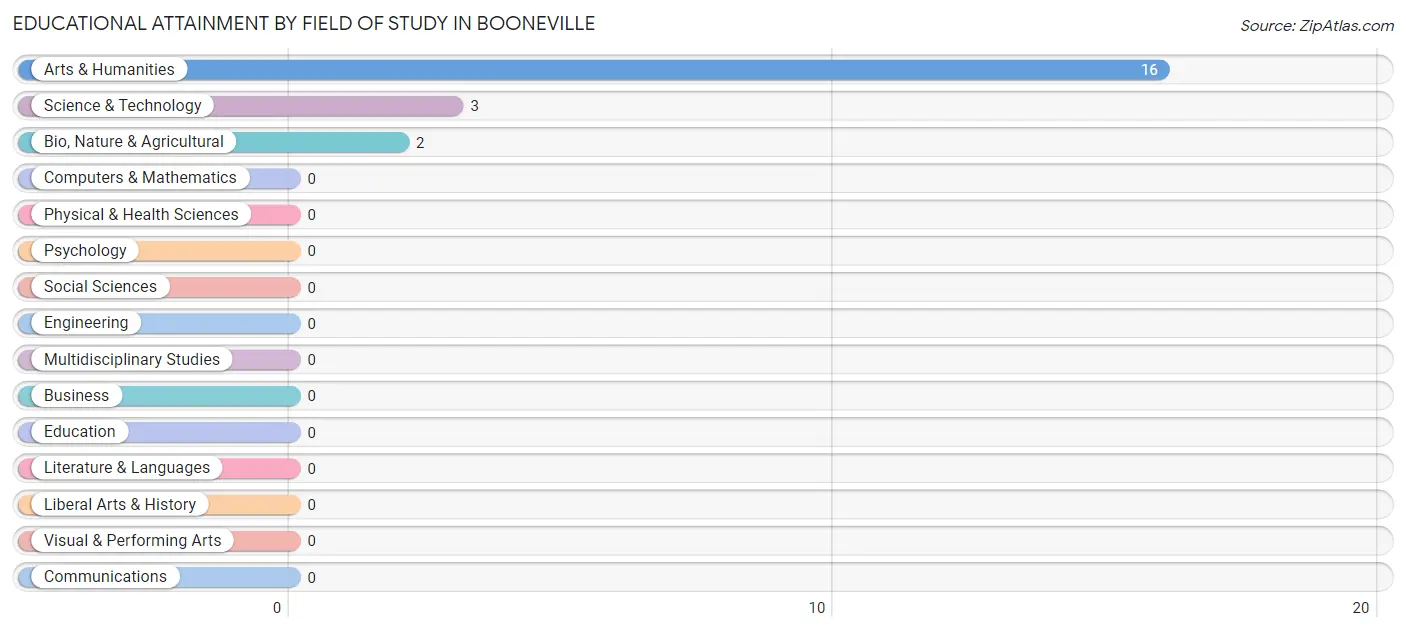
| Field of Study | # Graduates | % Graduates |
| Computers & Mathematics | 0 | 0.0% |
| Bio, Nature & Agricultural | 2 | 9.5% |
| Physical & Health Sciences | 0 | 0.0% |
| Psychology | 0 | 0.0% |
| Social Sciences | 0 | 0.0% |
| Engineering | 0 | 0.0% |
| Multidisciplinary Studies | 0 | 0.0% |
| Science & Technology | 3 | 14.3% |
| Business | 0 | 0.0% |
| Education | 0 | 0.0% |
| Literature & Languages | 0 | 0.0% |
| Liberal Arts & History | 0 | 0.0% |
| Visual & Performing Arts | 0 | 0.0% |
| Communications | 0 | 0.0% |
| Arts & Humanities | 16 | 76.2% |
| Total | 21 | 100.0% |
Transportation & Commute in Booneville
Vehicle Availability by Sex in Booneville
The most prevalent vehicle ownership categories in Booneville are males with 4 vehicles (18, accounting for 52.9%) and females with 4 vehicles (36, making up 36.7%).
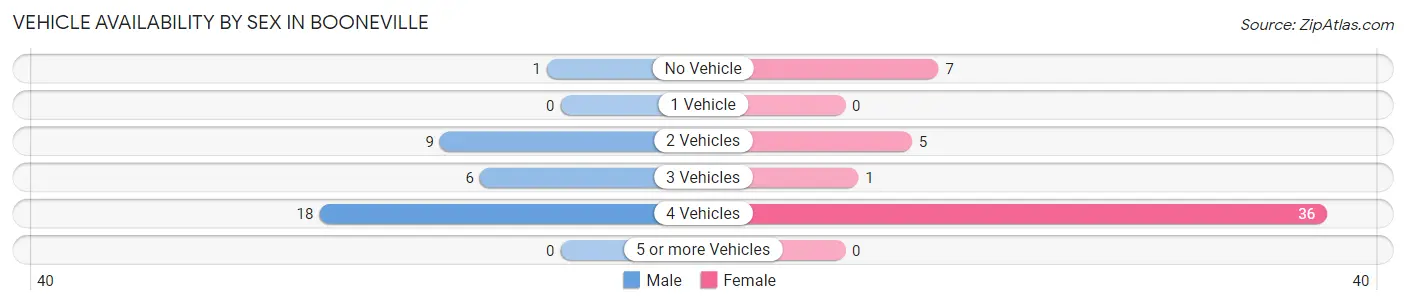
| Vehicles Available | Male | Female |
| No Vehicle | 1 (2.9%) | 7 (14.3%) |
| 1 Vehicle | 0 (0.0%) | 0 (0.0%) |
| 2 Vehicles | 9 (26.5%) | 5 (10.2%) |
| 3 Vehicles | 6 (17.6%) | 1 (2.0%) |
| 4 Vehicles | 18 (52.9%) | 36 (73.5%) |
| 5 or more Vehicles | 0 (0.0%) | 0 (0.0%) |
| Total | 34 (100.0%) | 49 (100.0%) |
Commute Time in Booneville
The most frequently occuring commute durations in Booneville are less than 5 minutes (39 commuters, 50.6%), 5 to 9 minutes (28 commuters, 36.4%), and 60 to 89 minutes (4 commuters, 5.2%).
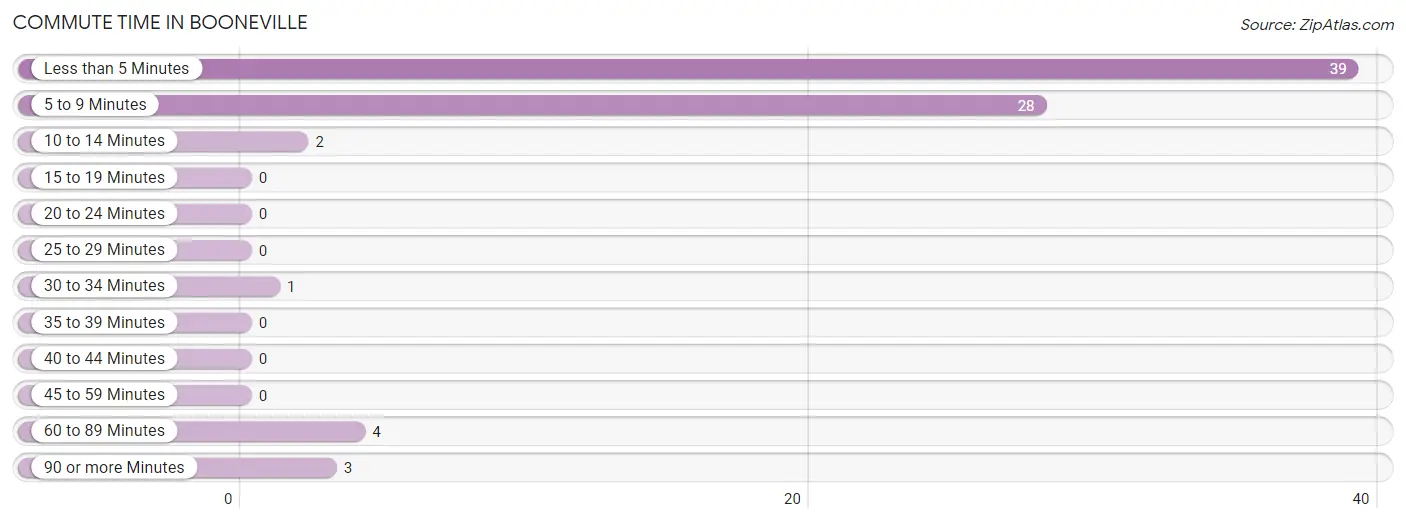
| Commute Time | # Commuters | % Commuters |
| Less than 5 Minutes | 39 | 50.6% |
| 5 to 9 Minutes | 28 | 36.4% |
| 10 to 14 Minutes | 2 | 2.6% |
| 15 to 19 Minutes | 0 | 0.0% |
| 20 to 24 Minutes | 0 | 0.0% |
| 25 to 29 Minutes | 0 | 0.0% |
| 30 to 34 Minutes | 1 | 1.3% |
| 35 to 39 Minutes | 0 | 0.0% |
| 40 to 44 Minutes | 0 | 0.0% |
| 45 to 59 Minutes | 0 | 0.0% |
| 60 to 89 Minutes | 4 | 5.2% |
| 90 or more Minutes | 3 | 3.9% |
Commute Time by Sex in Booneville
The most common commute times in Booneville are 5 to 9 minutes (18 commuters, 64.3%) for males and less than 5 minutes (38 commuters, 77.5%) for females.
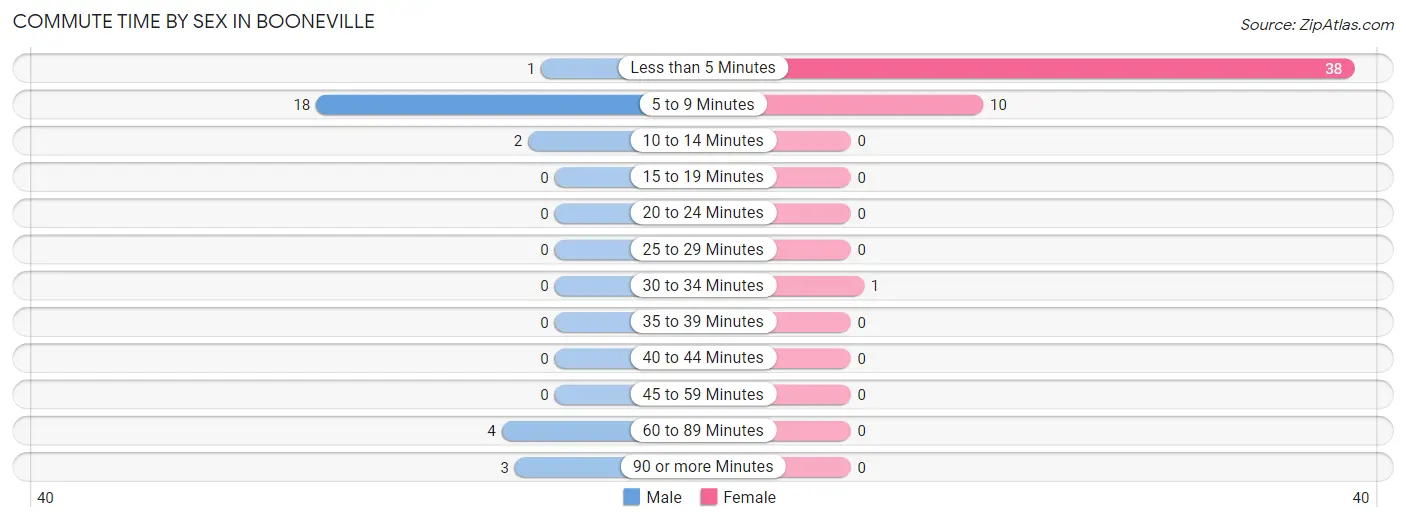
| Commute Time | Male | Female |
| Less than 5 Minutes | 1 (3.6%) | 38 (77.5%) |
| 5 to 9 Minutes | 18 (64.3%) | 10 (20.4%) |
| 10 to 14 Minutes | 2 (7.1%) | 0 (0.0%) |
| 15 to 19 Minutes | 0 (0.0%) | 0 (0.0%) |
| 20 to 24 Minutes | 0 (0.0%) | 0 (0.0%) |
| 25 to 29 Minutes | 0 (0.0%) | 0 (0.0%) |
| 30 to 34 Minutes | 0 (0.0%) | 1 (2.0%) |
| 35 to 39 Minutes | 0 (0.0%) | 0 (0.0%) |
| 40 to 44 Minutes | 0 (0.0%) | 0 (0.0%) |
| 45 to 59 Minutes | 0 (0.0%) | 0 (0.0%) |
| 60 to 89 Minutes | 4 (14.3%) | 0 (0.0%) |
| 90 or more Minutes | 3 (10.7%) | 0 (0.0%) |
Time of Departure to Work by Sex in Booneville
The most frequent times of departure to work in Booneville are 9:00 AM to 9:59 AM (20, 71.4%) for males and 6:00 AM to 6:29 AM (36, 73.5%) for females.
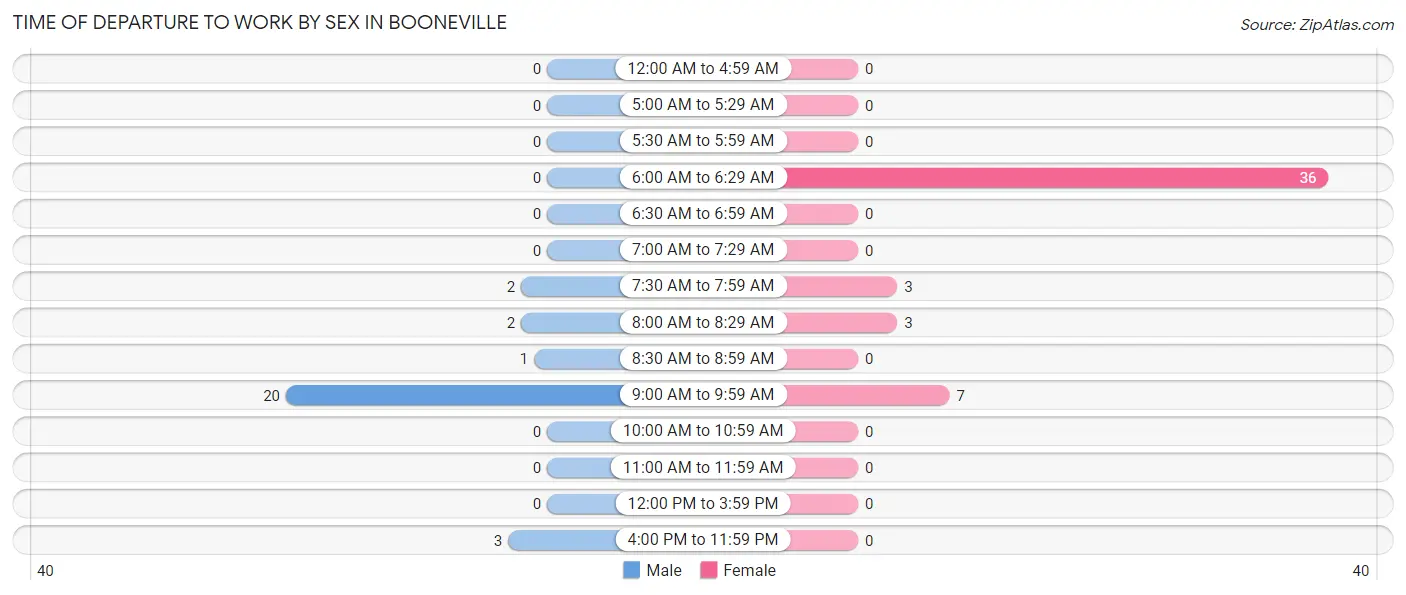
| Time of Departure | Male | Female |
| 12:00 AM to 4:59 AM | 0 (0.0%) | 0 (0.0%) |
| 5:00 AM to 5:29 AM | 0 (0.0%) | 0 (0.0%) |
| 5:30 AM to 5:59 AM | 0 (0.0%) | 0 (0.0%) |
| 6:00 AM to 6:29 AM | 0 (0.0%) | 36 (73.5%) |
| 6:30 AM to 6:59 AM | 0 (0.0%) | 0 (0.0%) |
| 7:00 AM to 7:29 AM | 0 (0.0%) | 0 (0.0%) |
| 7:30 AM to 7:59 AM | 2 (7.1%) | 3 (6.1%) |
| 8:00 AM to 8:29 AM | 2 (7.1%) | 3 (6.1%) |
| 8:30 AM to 8:59 AM | 1 (3.6%) | 0 (0.0%) |
| 9:00 AM to 9:59 AM | 20 (71.4%) | 7 (14.3%) |
| 10:00 AM to 10:59 AM | 0 (0.0%) | 0 (0.0%) |
| 11:00 AM to 11:59 AM | 0 (0.0%) | 0 (0.0%) |
| 12:00 PM to 3:59 PM | 0 (0.0%) | 0 (0.0%) |
| 4:00 PM to 11:59 PM | 3 (10.7%) | 0 (0.0%) |
| Total | 28 (100.0%) | 49 (100.0%) |
Housing Occupancy in Booneville
Occupancy by Ownership in Booneville
Of the total 30 dwellings in Booneville, owner-occupied units account for 20 (66.7%), while renter-occupied units make up 10 (33.3%).
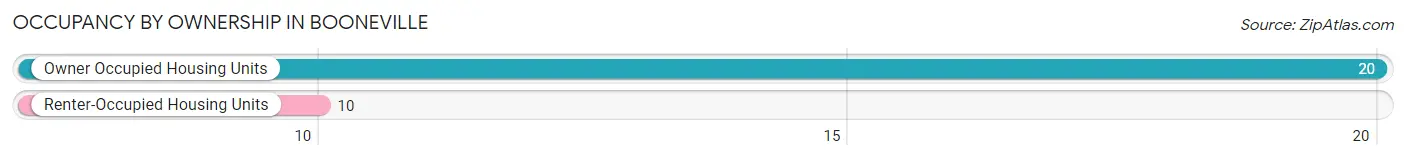
| Occupancy | # Housing Units | % Housing Units |
| Owner Occupied Housing Units | 20 | 66.7% |
| Renter-Occupied Housing Units | 10 | 33.3% |
| Total Occupied Housing Units | 30 | 100.0% |
Occupancy by Household Size in Booneville
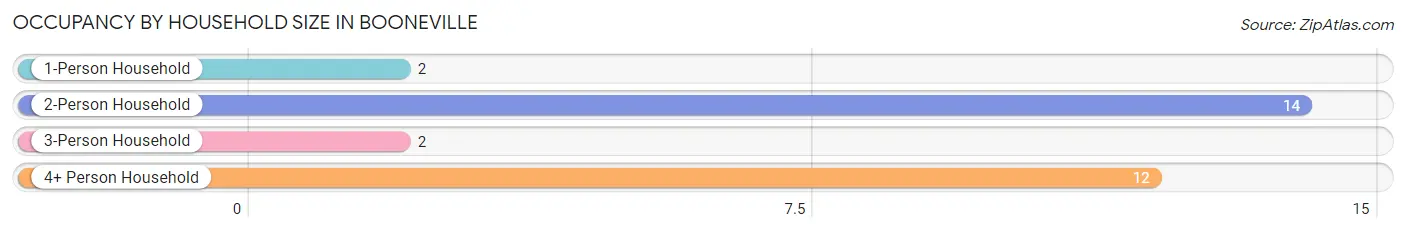
| Household Size | # Housing Units | % Housing Units |
| 1-Person Household | 2 | 6.7% |
| 2-Person Household | 14 | 46.7% |
| 3-Person Household | 2 | 6.7% |
| 4+ Person Household | 12 | 40.0% |
| Total Housing Units | 30 | 100.0% |
Occupancy by Ownership by Household Size in Booneville
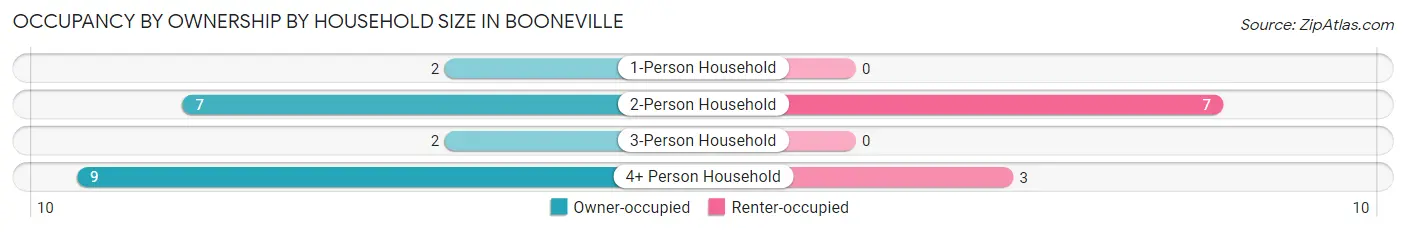
| Household Size | Owner-occupied | Renter-occupied |
| 1-Person Household | 2 (100.0%) | 0 (0.0%) |
| 2-Person Household | 7 (50.0%) | 7 (50.0%) |
| 3-Person Household | 2 (100.0%) | 0 (0.0%) |
| 4+ Person Household | 9 (75.0%) | 3 (25.0%) |
| Total Housing Units | 20 (66.7%) | 10 (33.3%) |
Occupancy by Educational Attainment in Booneville
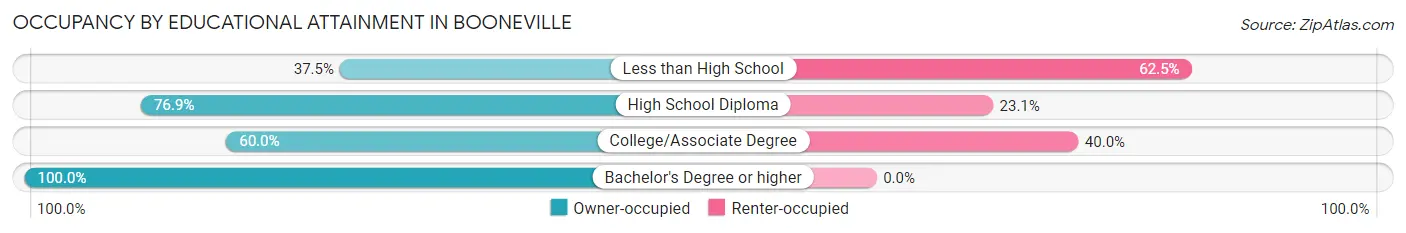
| Household Size | Owner-occupied | Renter-occupied |
| Less than High School | 3 (37.5%) | 5 (62.5%) |
| High School Diploma | 10 (76.9%) | 3 (23.1%) |
| College/Associate Degree | 3 (60.0%) | 2 (40.0%) |
| Bachelor's Degree or higher | 4 (100.0%) | 0 (0.0%) |
Occupancy by Age of Householder in Booneville
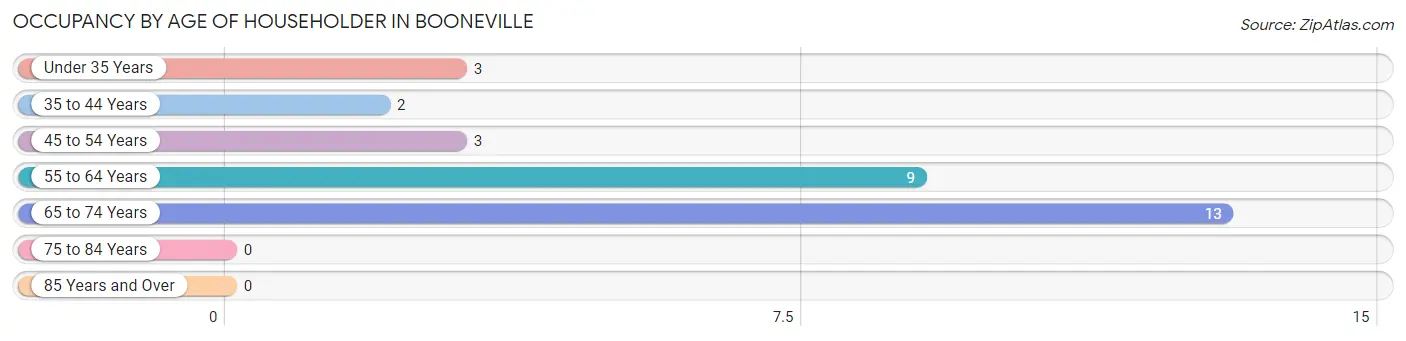
| Age Bracket | # Households | % Households |
| Under 35 Years | 3 | 10.0% |
| 35 to 44 Years | 2 | 6.7% |
| 45 to 54 Years | 3 | 10.0% |
| 55 to 64 Years | 9 | 30.0% |
| 65 to 74 Years | 13 | 43.3% |
| 75 to 84 Years | 0 | 0.0% |
| 85 Years and Over | 0 | 0.0% |
| Total | 30 | 100.0% |
Housing Finances in Booneville
Median Income by Occupancy in Booneville
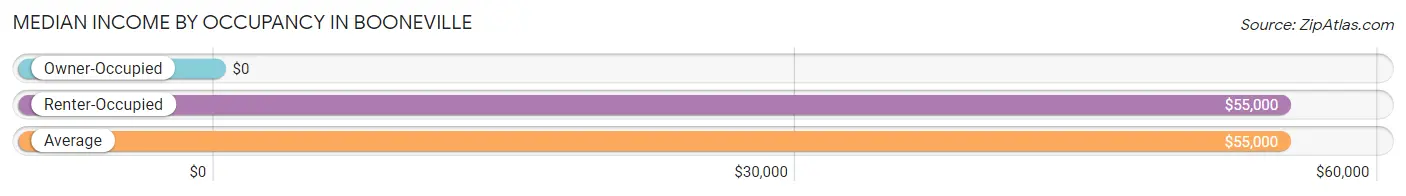
| Occupancy Type | # Households | Median Income |
| Owner-Occupied | 20 (66.7%) | $0 |
| Renter-Occupied | 10 (33.3%) | $55,000 |
| Average | 30 (100.0%) | $55,000 |
Occupancy by Householder Income Bracket in Booneville
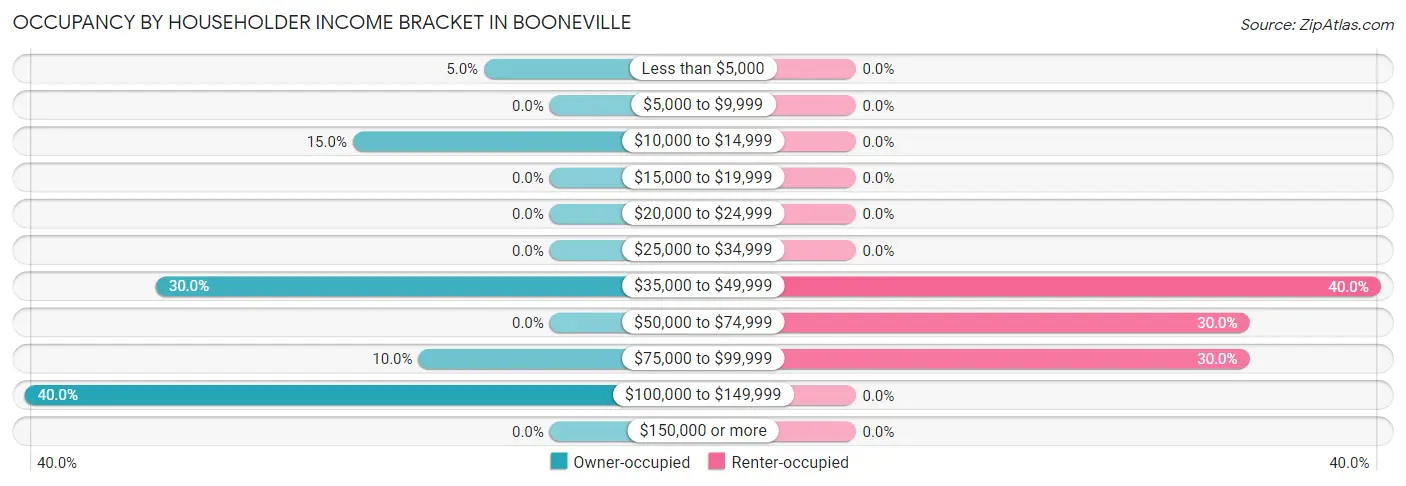
| Income Bracket | Owner-occupied | Renter-occupied |
| Less than $5,000 | 1 (5.0%) | 0 (0.0%) |
| $5,000 to $9,999 | 0 (0.0%) | 0 (0.0%) |
| $10,000 to $14,999 | 3 (15.0%) | 0 (0.0%) |
| $15,000 to $19,999 | 0 (0.0%) | 0 (0.0%) |
| $20,000 to $24,999 | 0 (0.0%) | 0 (0.0%) |
| $25,000 to $34,999 | 0 (0.0%) | 0 (0.0%) |
| $35,000 to $49,999 | 6 (30.0%) | 4 (40.0%) |
| $50,000 to $74,999 | 0 (0.0%) | 3 (30.0%) |
| $75,000 to $99,999 | 2 (10.0%) | 3 (30.0%) |
| $100,000 to $149,999 | 8 (40.0%) | 0 (0.0%) |
| $150,000 or more | 0 (0.0%) | 0 (0.0%) |
| Total | 20 (100.0%) | 10 (100.0%) |
Monthly Housing Cost Tiers in Booneville
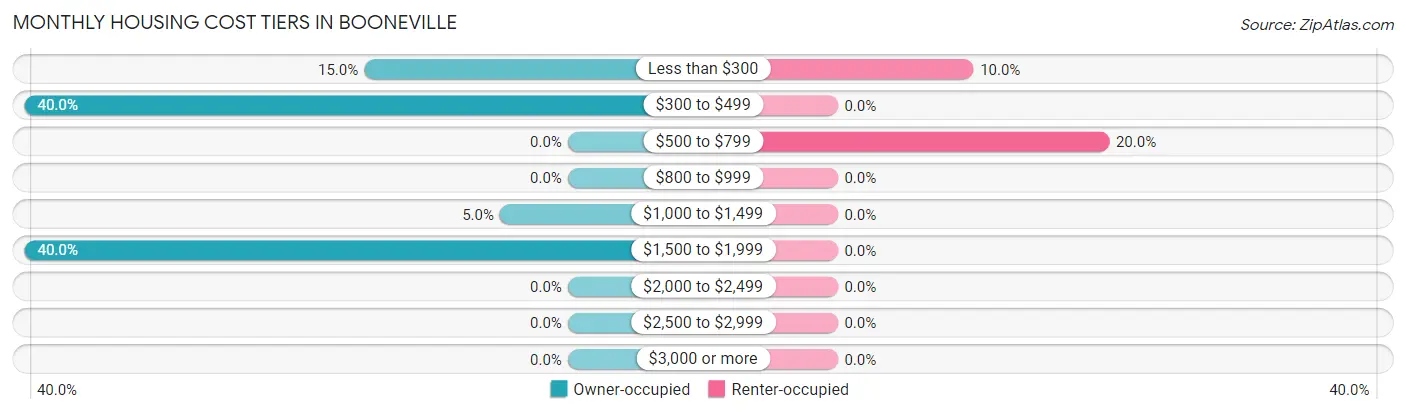
| Monthly Cost | Owner-occupied | Renter-occupied |
| Less than $300 | 3 (15.0%) | 1 (10.0%) |
| $300 to $499 | 8 (40.0%) | 0 (0.0%) |
| $500 to $799 | 0 (0.0%) | 2 (20.0%) |
| $800 to $999 | 0 (0.0%) | 0 (0.0%) |
| $1,000 to $1,499 | 1 (5.0%) | 0 (0.0%) |
| $1,500 to $1,999 | 8 (40.0%) | 0 (0.0%) |
| $2,000 to $2,499 | 0 (0.0%) | 0 (0.0%) |
| $2,500 to $2,999 | 0 (0.0%) | 0 (0.0%) |
| $3,000 or more | 0 (0.0%) | 0 (0.0%) |
| Total | 20 (100.0%) | 10 (100.0%) |
Physical Housing Characteristics in Booneville
Housing Structures in Booneville
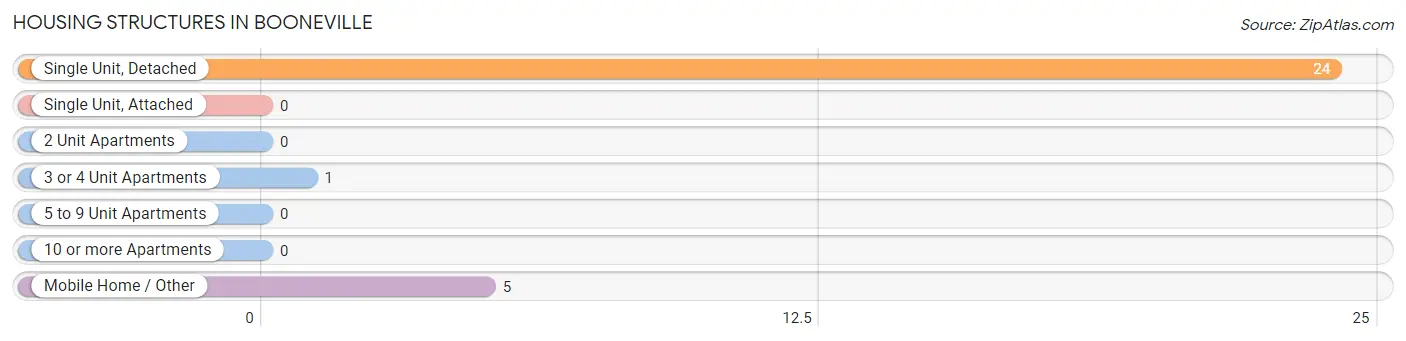
| Structure Type | # Housing Units | % Housing Units |
| Single Unit, Detached | 24 | 80.0% |
| Single Unit, Attached | 0 | 0.0% |
| 2 Unit Apartments | 0 | 0.0% |
| 3 or 4 Unit Apartments | 1 | 3.3% |
| 5 to 9 Unit Apartments | 0 | 0.0% |
| 10 or more Apartments | 0 | 0.0% |
| Mobile Home / Other | 5 | 16.7% |
| Total | 30 | 100.0% |
Housing Structures by Occupancy in Booneville
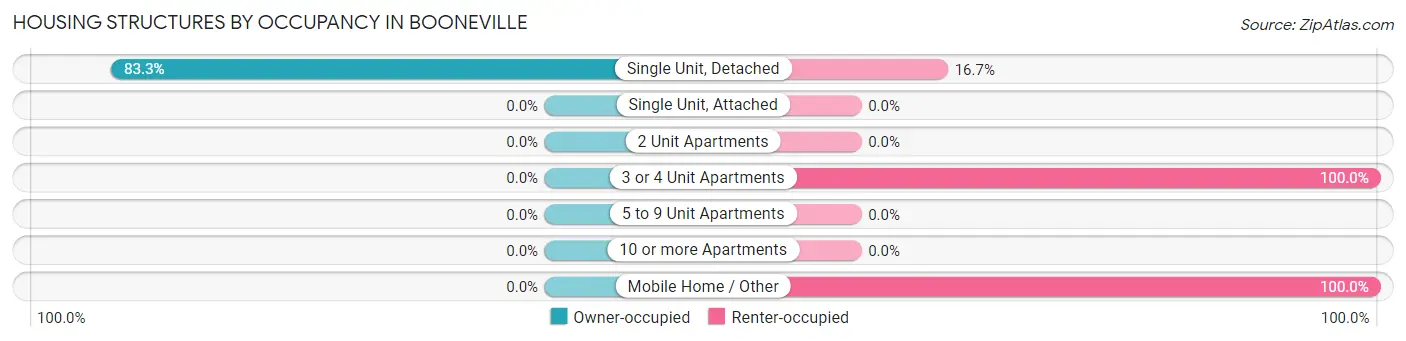
| Structure Type | Owner-occupied | Renter-occupied |
| Single Unit, Detached | 20 (83.3%) | 4 (16.7%) |
| Single Unit, Attached | 0 (0.0%) | 0 (0.0%) |
| 2 Unit Apartments | 0 (0.0%) | 0 (0.0%) |
| 3 or 4 Unit Apartments | 0 (0.0%) | 1 (100.0%) |
| 5 to 9 Unit Apartments | 0 (0.0%) | 0 (0.0%) |
| 10 or more Apartments | 0 (0.0%) | 0 (0.0%) |
| Mobile Home / Other | 0 (0.0%) | 5 (100.0%) |
| Total | 20 (66.7%) | 10 (33.3%) |
Housing Structures by Number of Rooms in Booneville
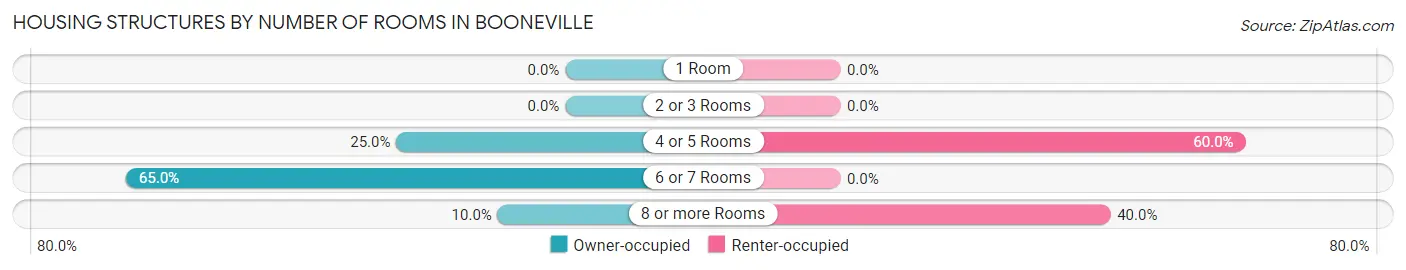
| Number of Rooms | Owner-occupied | Renter-occupied |
| 1 Room | 0 (0.0%) | 0 (0.0%) |
| 2 or 3 Rooms | 0 (0.0%) | 0 (0.0%) |
| 4 or 5 Rooms | 5 (25.0%) | 6 (60.0%) |
| 6 or 7 Rooms | 13 (65.0%) | 0 (0.0%) |
| 8 or more Rooms | 2 (10.0%) | 4 (40.0%) |
| Total | 20 (100.0%) | 10 (100.0%) |
Housing Structure by Heating Type in Booneville
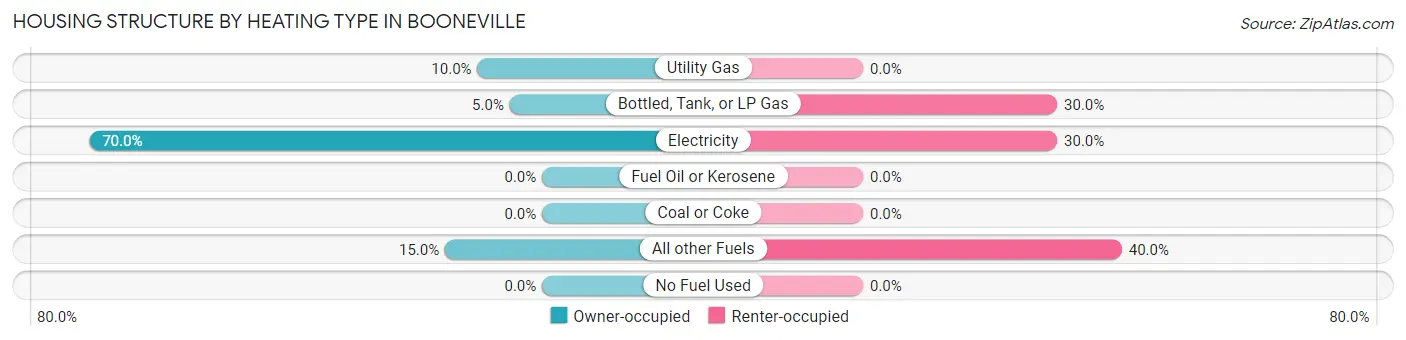
| Heating Type | Owner-occupied | Renter-occupied |
| Utility Gas | 2 (10.0%) | 0 (0.0%) |
| Bottled, Tank, or LP Gas | 1 (5.0%) | 3 (30.0%) |
| Electricity | 14 (70.0%) | 3 (30.0%) |
| Fuel Oil or Kerosene | 0 (0.0%) | 0 (0.0%) |
| Coal or Coke | 0 (0.0%) | 0 (0.0%) |
| All other Fuels | 3 (15.0%) | 4 (40.0%) |
| No Fuel Used | 0 (0.0%) | 0 (0.0%) |
| Total | 20 (100.0%) | 10 (100.0%) |
Household Vehicle Usage in Booneville
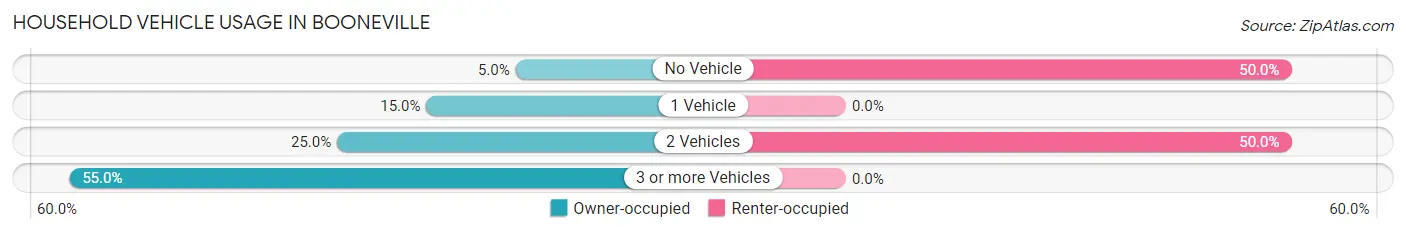
| Vehicles per Household | Owner-occupied | Renter-occupied |
| No Vehicle | 1 (5.0%) | 5 (50.0%) |
| 1 Vehicle | 3 (15.0%) | 0 (0.0%) |
| 2 Vehicles | 5 (25.0%) | 5 (50.0%) |
| 3 or more Vehicles | 11 (55.0%) | 0 (0.0%) |
| Total | 20 (100.0%) | 10 (100.0%) |
Real Estate & Mortgages in Booneville
Real Estate and Mortgage Overview in Booneville
| Characteristic | Without Mortgage | With Mortgage |
| Housing Units | 9 | 11 |
| Median Property Value | $98,300 | $215,600 |
| Median Household Income | $37,083 | $0 |
| Monthly Housing Costs | $363 | $0 |
| Real Estate Taxes | $1,375 | $1 |
Property Value by Mortgage Status in Booneville
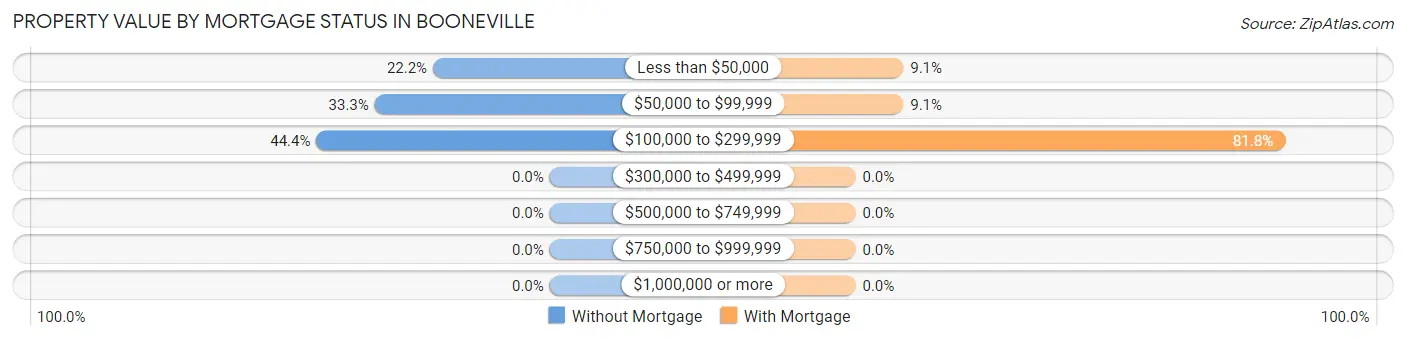
| Property Value | Without Mortgage | With Mortgage |
| Less than $50,000 | 2 (22.2%) | 1 (9.1%) |
| $50,000 to $99,999 | 3 (33.3%) | 1 (9.1%) |
| $100,000 to $299,999 | 4 (44.4%) | 9 (81.8%) |
| $300,000 to $499,999 | 0 (0.0%) | 0 (0.0%) |
| $500,000 to $749,999 | 0 (0.0%) | 0 (0.0%) |
| $750,000 to $999,999 | 0 (0.0%) | 0 (0.0%) |
| $1,000,000 or more | 0 (0.0%) | 0 (0.0%) |
| Total | 9 (100.0%) | 11 (100.0%) |
Household Income by Mortgage Status in Booneville
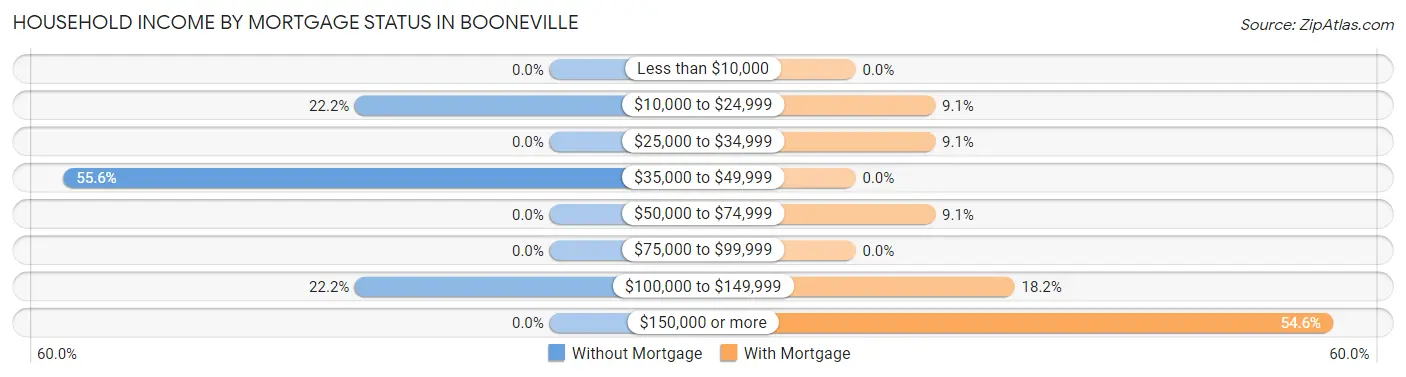
| Household Income | Without Mortgage | With Mortgage |
| Less than $10,000 | 0 (0.0%) | 0 (0.0%) |
| $10,000 to $24,999 | 2 (22.2%) | 1 (9.1%) |
| $25,000 to $34,999 | 0 (0.0%) | 1 (9.1%) |
| $35,000 to $49,999 | 5 (55.6%) | 0 (0.0%) |
| $50,000 to $74,999 | 0 (0.0%) | 1 (9.1%) |
| $75,000 to $99,999 | 0 (0.0%) | 0 (0.0%) |
| $100,000 to $149,999 | 2 (22.2%) | 2 (18.2%) |
| $150,000 or more | 0 (0.0%) | 6 (54.5%) |
| Total | 9 (100.0%) | 11 (100.0%) |
Property Value to Household Income Ratio in Booneville
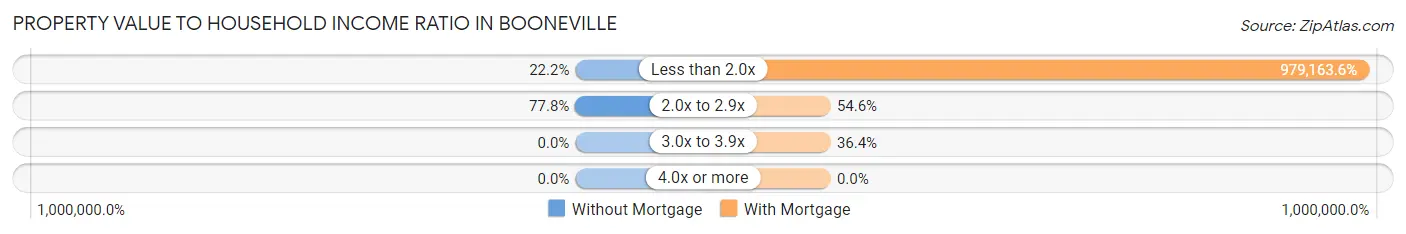
| Value-to-Income Ratio | Without Mortgage | With Mortgage |
| Less than 2.0x | 2 (22.2%) | 107,708 (979,163.6%) |
| 2.0x to 2.9x | 7 (77.8%) | 6 (54.5%) |
| 3.0x to 3.9x | 0 (0.0%) | 4 (36.4%) |
| 4.0x or more | 0 (0.0%) | 0 (0.0%) |
| Total | 9 (100.0%) | 11 (100.0%) |
Real Estate Taxes by Mortgage Status in Booneville
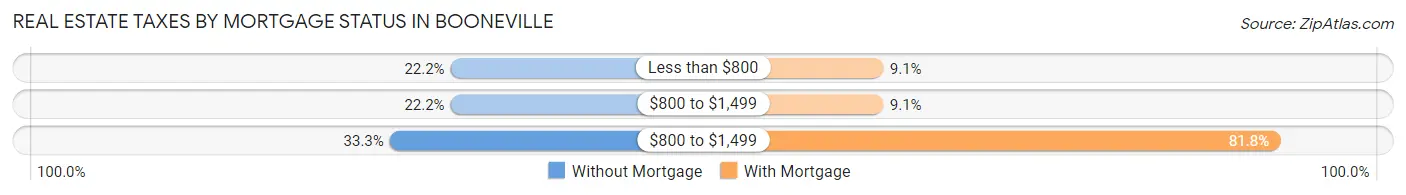
| Property Taxes | Without Mortgage | With Mortgage |
| Less than $800 | 2 (22.2%) | 1 (9.1%) |
| $800 to $1,499 | 2 (22.2%) | 1 (9.1%) |
| $800 to $1,499 | 3 (33.3%) | 9 (81.8%) |
| Total | 9 (100.0%) | 11 (100.0%) |
Health & Disability in Booneville
Health Insurance Coverage by Age in Booneville
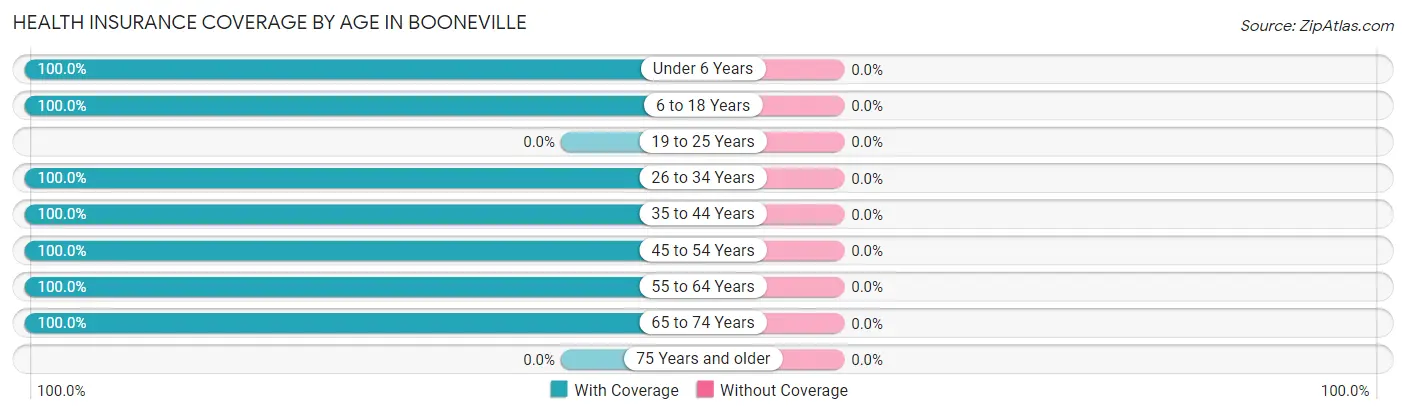
| Age Bracket | With Coverage | Without Coverage |
| Under 6 Years | 2 (100.0%) | 0 (0.0%) |
| 6 to 18 Years | 24 (100.0%) | 0 (0.0%) |
| 19 to 25 Years | 0 (0.0%) | 0 (0.0%) |
| 26 to 34 Years | 14 (100.0%) | 0 (0.0%) |
| 35 to 44 Years | 54 (100.0%) | 0 (0.0%) |
| 45 to 54 Years | 5 (100.0%) | 0 (0.0%) |
| 55 to 64 Years | 20 (100.0%) | 0 (0.0%) |
| 65 to 74 Years | 20 (100.0%) | 0 (0.0%) |
| 75 Years and older | 0 (0.0%) | 0 (0.0%) |
| Total | 139 (100.0%) | 0 (0.0%) |
Health Insurance Coverage by Citizenship Status in Booneville
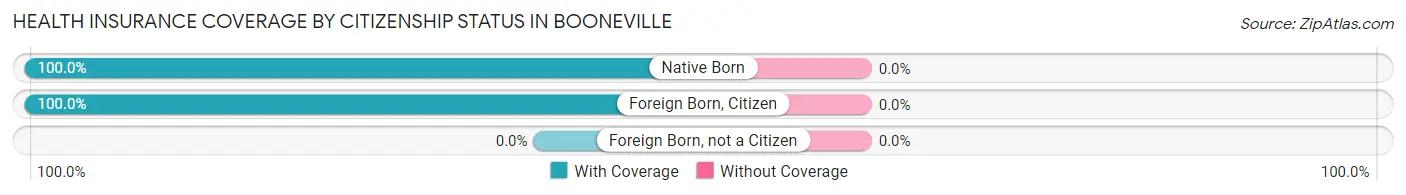
| Citizenship Status | With Coverage | Without Coverage |
| Native Born | 2 (100.0%) | 0 (0.0%) |
| Foreign Born, Citizen | 24 (100.0%) | 0 (0.0%) |
| Foreign Born, not a Citizen | 0 (0.0%) | 0 (0.0%) |
Health Insurance Coverage by Household Income in Booneville
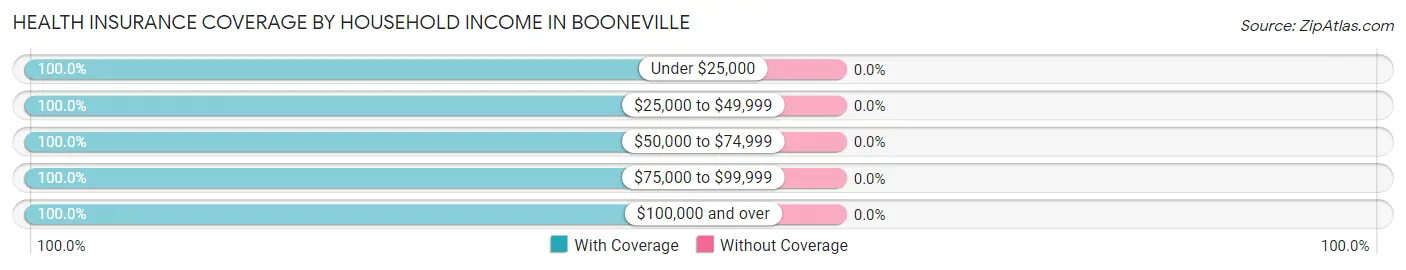
| Household Income | With Coverage | Without Coverage |
| Under $25,000 | 11 (100.0%) | 0 (0.0%) |
| $25,000 to $49,999 | 28 (100.0%) | 0 (0.0%) |
| $50,000 to $74,999 | 7 (100.0%) | 0 (0.0%) |
| $75,000 to $99,999 | 15 (100.0%) | 0 (0.0%) |
| $100,000 and over | 78 (100.0%) | 0 (0.0%) |
Public vs Private Health Insurance Coverage by Age in Booneville
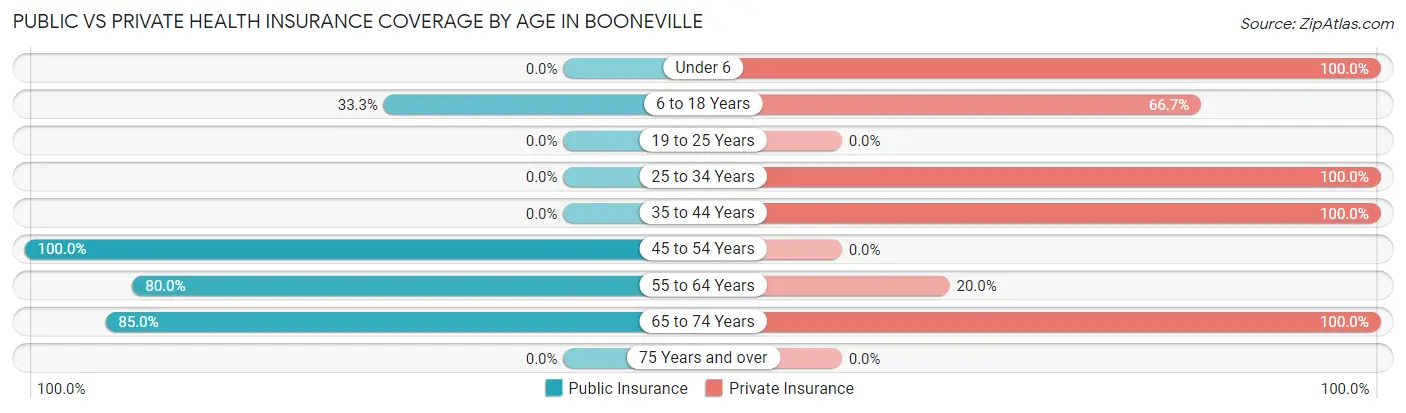
| Age Bracket | Public Insurance | Private Insurance |
| Under 6 | 0 (0.0%) | 2 (100.0%) |
| 6 to 18 Years | 8 (33.3%) | 16 (66.7%) |
| 19 to 25 Years | 0 (0.0%) | 0 (0.0%) |
| 25 to 34 Years | 0 (0.0%) | 14 (100.0%) |
| 35 to 44 Years | 0 (0.0%) | 54 (100.0%) |
| 45 to 54 Years | 5 (100.0%) | 0 (0.0%) |
| 55 to 64 Years | 16 (80.0%) | 4 (20.0%) |
| 65 to 74 Years | 17 (85.0%) | 20 (100.0%) |
| 75 Years and over | 0 (0.0%) | 0 (0.0%) |
| Total | 46 (33.1%) | 110 (79.1%) |
Disability Status by Sex by Age in Booneville
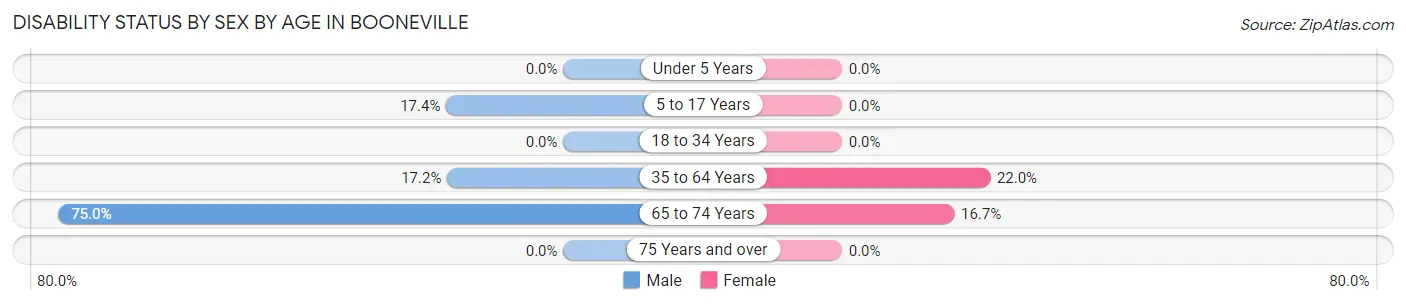
| Age Bracket | Male | Female |
| Under 5 Years | 0 (0.0%) | 0 (0.0%) |
| 5 to 17 Years | 4 (17.4%) | 0 (0.0%) |
| 18 to 34 Years | 0 (0.0%) | 0 (0.0%) |
| 35 to 64 Years | 5 (17.2%) | 11 (22.0%) |
| 65 to 74 Years | 6 (75.0%) | 2 (16.7%) |
| 75 Years and over | 0 (0.0%) | 0 (0.0%) |
Disability Class by Sex by Age in Booneville
Disability Class: Hearing Difficulty
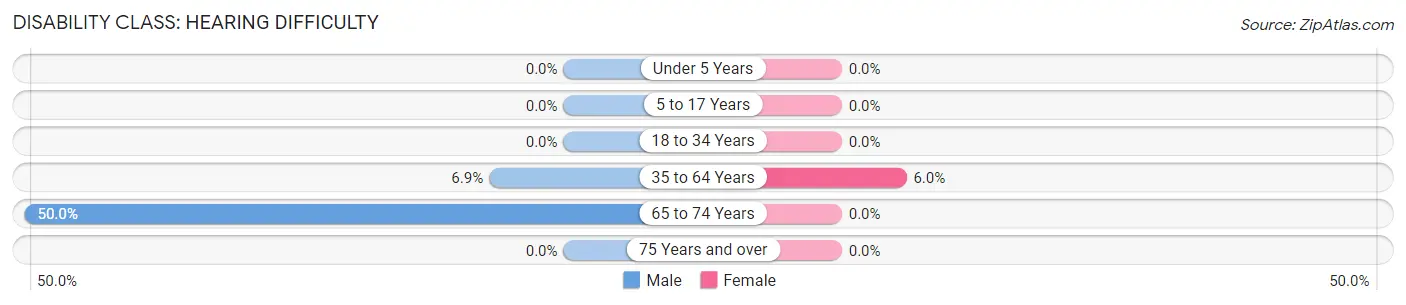
| Age Bracket | Male | Female |
| Under 5 Years | 0 (0.0%) | 0 (0.0%) |
| 5 to 17 Years | 0 (0.0%) | 0 (0.0%) |
| 18 to 34 Years | 0 (0.0%) | 0 (0.0%) |
| 35 to 64 Years | 2 (6.9%) | 3 (6.0%) |
| 65 to 74 Years | 4 (50.0%) | 0 (0.0%) |
| 75 Years and over | 0 (0.0%) | 0 (0.0%) |
Disability Class: Vision Difficulty
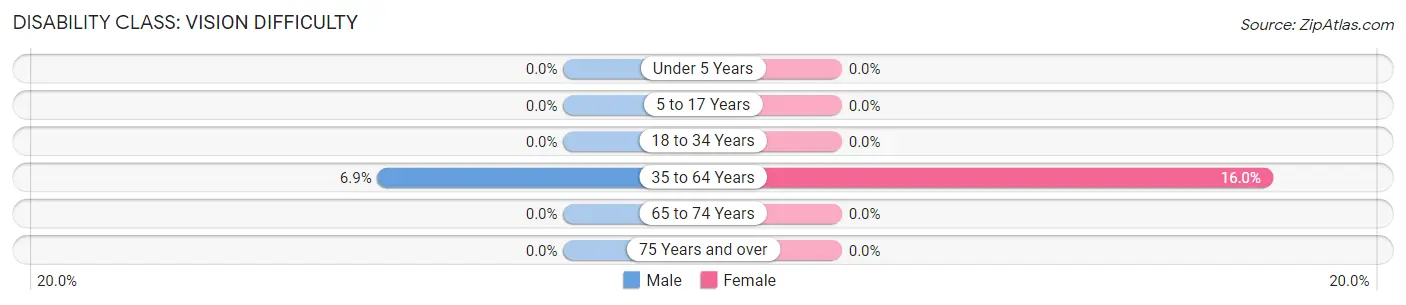
| Age Bracket | Male | Female |
| Under 5 Years | 0 (0.0%) | 0 (0.0%) |
| 5 to 17 Years | 0 (0.0%) | 0 (0.0%) |
| 18 to 34 Years | 0 (0.0%) | 0 (0.0%) |
| 35 to 64 Years | 2 (6.9%) | 8 (16.0%) |
| 65 to 74 Years | 0 (0.0%) | 0 (0.0%) |
| 75 Years and over | 0 (0.0%) | 0 (0.0%) |
Disability Class: Cognitive Difficulty
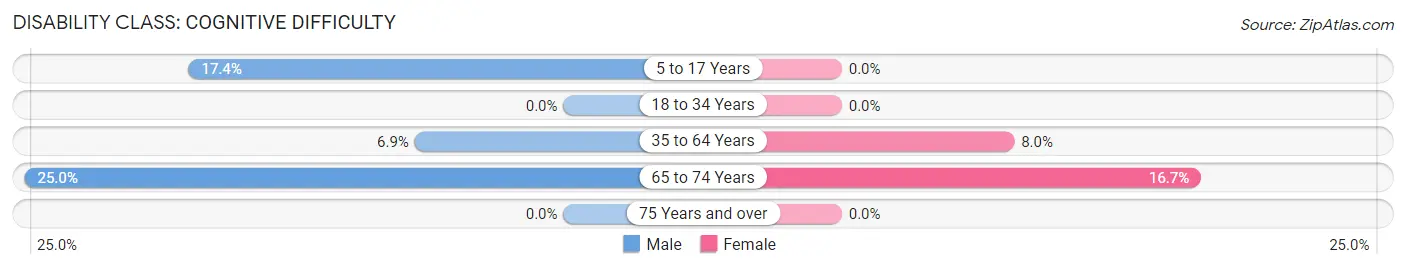
| Age Bracket | Male | Female |
| 5 to 17 Years | 4 (17.4%) | 0 (0.0%) |
| 18 to 34 Years | 0 (0.0%) | 0 (0.0%) |
| 35 to 64 Years | 2 (6.9%) | 4 (8.0%) |
| 65 to 74 Years | 2 (25.0%) | 2 (16.7%) |
| 75 Years and over | 0 (0.0%) | 0 (0.0%) |
Disability Class: Ambulatory Difficulty
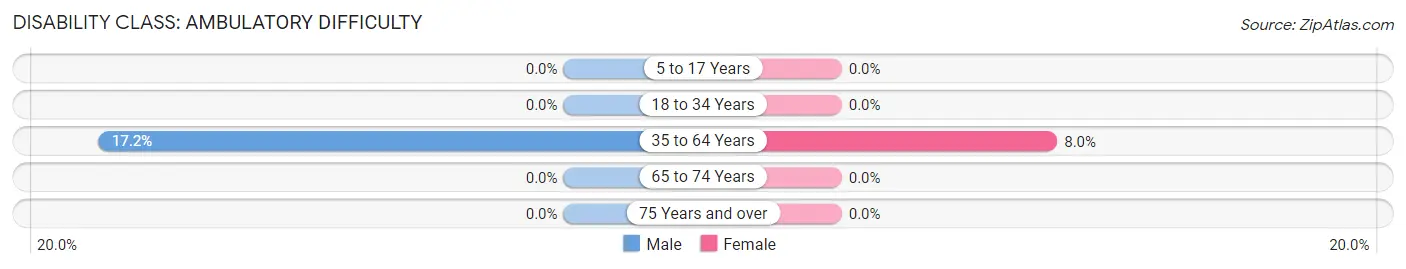
| Age Bracket | Male | Female |
| 5 to 17 Years | 0 (0.0%) | 0 (0.0%) |
| 18 to 34 Years | 0 (0.0%) | 0 (0.0%) |
| 35 to 64 Years | 5 (17.2%) | 4 (8.0%) |
| 65 to 74 Years | 0 (0.0%) | 0 (0.0%) |
| 75 Years and over | 0 (0.0%) | 0 (0.0%) |
Disability Class: Self-Care Difficulty
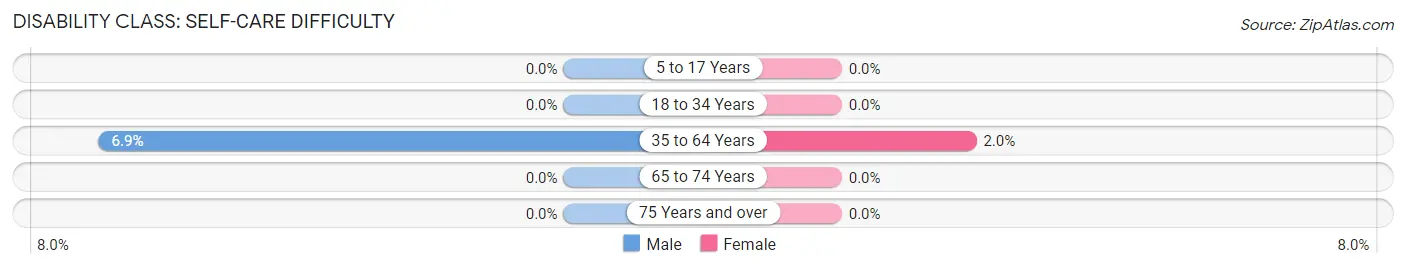
| Age Bracket | Male | Female |
| 5 to 17 Years | 0 (0.0%) | 0 (0.0%) |
| 18 to 34 Years | 0 (0.0%) | 0 (0.0%) |
| 35 to 64 Years | 2 (6.9%) | 1 (2.0%) |
| 65 to 74 Years | 0 (0.0%) | 0 (0.0%) |
| 75 Years and over | 0 (0.0%) | 0 (0.0%) |
Technology Access in Booneville
Computing Device Access in Booneville
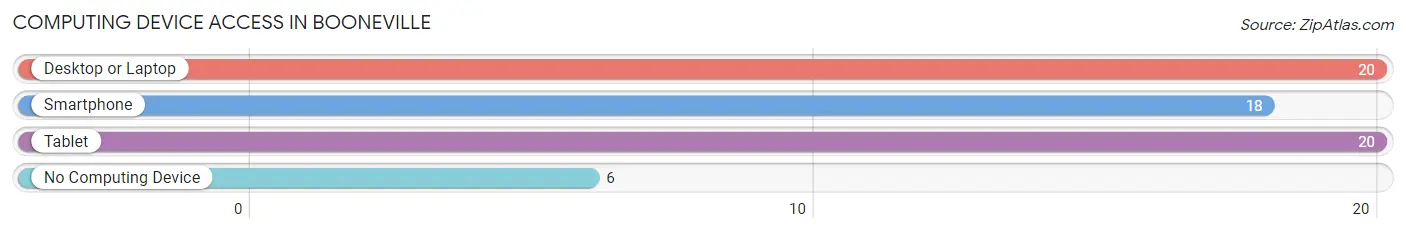
| Device Type | # Households | % Households |
| Desktop or Laptop | 20 | 66.7% |
| Smartphone | 18 | 60.0% |
| Tablet | 20 | 66.7% |
| No Computing Device | 6 | 20.0% |
| Total | 30 | 100.0% |
Internet Access in Booneville
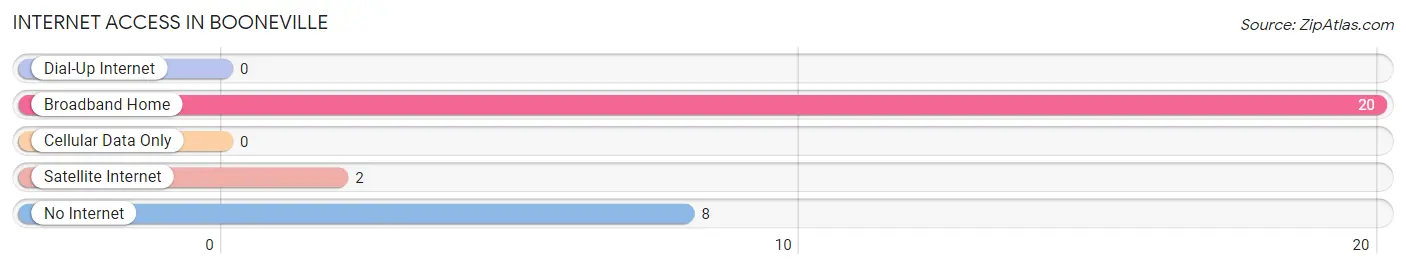
| Internet Type | # Households | % Households |
| Dial-Up Internet | 0 | 0.0% |
| Broadband Home | 20 | 66.7% |
| Cellular Data Only | 0 | 0.0% |
| Satellite Internet | 2 | 6.7% |
| No Internet | 8 | 26.7% |
| Total | 30 | 100.0% |
Booneville Summary
Booneville is a small city located in Owsley County, Kentucky. It is situated in the foothills of the Appalachian Mountains and is part of the Eastern Kentucky Coalfield. The city has a population of 1,845 people as of the 2010 census.
History
Booneville was founded in 1820 by William Boone, a Revolutionary War veteran. The city was named after Boone and was originally known as Boone's Station. The city was incorporated in 1872 and has been the county seat of Owsley County since 1872.
The city was an important stop on the Kentucky Central Railroad, which connected the city to Lexington and Cincinnati. The railroad was a major factor in the growth of the city and the surrounding area.
Geography
Booneville is located in the foothills of the Appalachian Mountains in eastern Kentucky. The city is situated at an elevation of 845 feet above sea level. The city is located in the Daniel Boone National Forest and is surrounded by the Red River Gorge Geological Area.
The city is located at the intersection of US Route 421 and Kentucky Route 11. The nearest major cities are Lexington, Kentucky (90 miles away) and Cincinnati, Ohio (120 miles away).
Economy
Booneville's economy is largely based on agriculture and tourism. The city is home to several farms and ranches, as well as a number of tourist attractions. The city is also home to a number of small businesses, including restaurants, retail stores, and service providers.
The city is also home to a number of manufacturing companies, including a furniture factory, a woodworking plant, and a plastics factory. The city is also home to a number of coal mines, which provide employment for many of the city's residents.
Demographics
As of the 2010 census, Booneville had a population of 1,845 people. The racial makeup of the city was 97.3% White, 0.7% African American, 0.2% Native American, 0.2% Asian, 0.1% Pacific Islander, 0.3% from other races, and 1.2% from two or more races. Hispanic or Latino of any race were 1.2% of the population.
The median income for a household in the city was $25,938, and the median income for a family was $31,250. The per capita income for the city was $14,945. About 17.2% of families and 20.2% of the population were below the poverty line, including 28.3% of those under age 18 and 16.2% of those age 65 or over.
Booneville is served by the Owsley County School District, which includes two elementary schools, one middle school, and one high school. The city is also home to a branch of the University of Kentucky.
Common Questions
What is Per Capita Income in Booneville?
Per Capita income in Booneville is $30,403.
What is the Median Family Income in Booneville?
Median Family Income in Booneville is $59,375.
What is the Median Household income in Booneville?
Median Household Income in Booneville is $55,000.
What is Income or Wage Gap in Booneville?
Income or Wage Gap in Booneville is 26.0%.
Women in Booneville earn 74.0 cents for every dollar earned by a man.
What is Inequality or Gini Index in Booneville?
Inequality or Gini Index in Booneville is 0.32.
What is the Total Population of Booneville?
Total Population of Booneville is 139.
What is the Total Male Population of Booneville?
Total Male Population of Booneville is 69.
What is the Total Female Population of Booneville?
Total Female Population of Booneville is 70.
What is the Ratio of Males per 100 Females in Booneville?
There are 98.57 Males per 100 Females in Booneville.
What is the Ratio of Females per 100 Males in Booneville?
There are 101.45 Females per 100 Males in Booneville.
What is the Median Population Age in Booneville?
Median Population Age in Booneville is 36.8 Years.
What is the Average Family Size in Booneville
Average Family Size in Booneville is 5.0 People.
What is the Average Household Size in Booneville
Average Household Size in Booneville is 4.6 People.
How Large is the Labor Force in Booneville?
There are 83 People in the Labor Forcein in Booneville.
What is the Percentage of People in the Labor Force in Booneville?
72.8% of People are in the Labor Force in Booneville.