Henderson, NE Map & Demographics
Henderson Map
Henderson Overview
$29,713
PER CAPITA INCOME
$78,068
AVG FAMILY INCOME
$72,656
AVG HOUSEHOLD INCOME
4.2%
WAGE / INCOME GAP [ % ]
95.8¢/ $1
WAGE / INCOME GAP [ $ ]
0.37
INEQUALITY / GINI INDEX
958
TOTAL POPULATION
365
MALE POPULATION
593
FEMALE POPULATION
61.55
MALES / 100 FEMALES
162.47
FEMALES / 100 MALES
42.1
MEDIAN AGE
3.1
AVG FAMILY SIZE
2.4
AVG HOUSEHOLD SIZE
380
LABOR FORCE [ PEOPLE ]
52.0%
PERCENT IN LABOR FORCE
Henderson Zip Codes
Henderson Area Codes
Income in Henderson
Income Overview in Henderson
Per Capita Income in Henderson is $29,713, while median incomes of families and households are $78,068 and $72,656 respectively.
| Characteristic | Number | Measure |
| Per Capita Income | 958 | $29,713 |
| Median Family Income | 257 | $78,068 |
| Mean Family Income | 257 | $85,916 |
| Median Household Income | 381 | $72,656 |
| Mean Household Income | 381 | $73,215 |
| Income Deficit | 257 | $0 |
| Wage / Income Gap (%) | 958 | 4.22% |
| Wage / Income Gap ($) | 958 | 95.78¢ per $1 |
| Gini / Inequality Index | 958 | 0.37 |
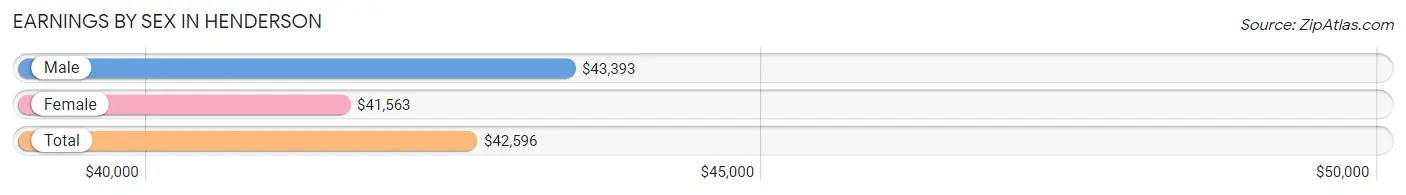
Earnings by Sex in Henderson
Average Earnings in Henderson are $42,596, $43,393 for men and $41,563 for women, a difference of 4.2%.
| Sex | Number | Average Earnings |
| Male | 189 (44.8%) | $43,393 |
| Female | 233 (55.2%) | $41,563 |
| Total | 422 (100.0%) | $42,596 |
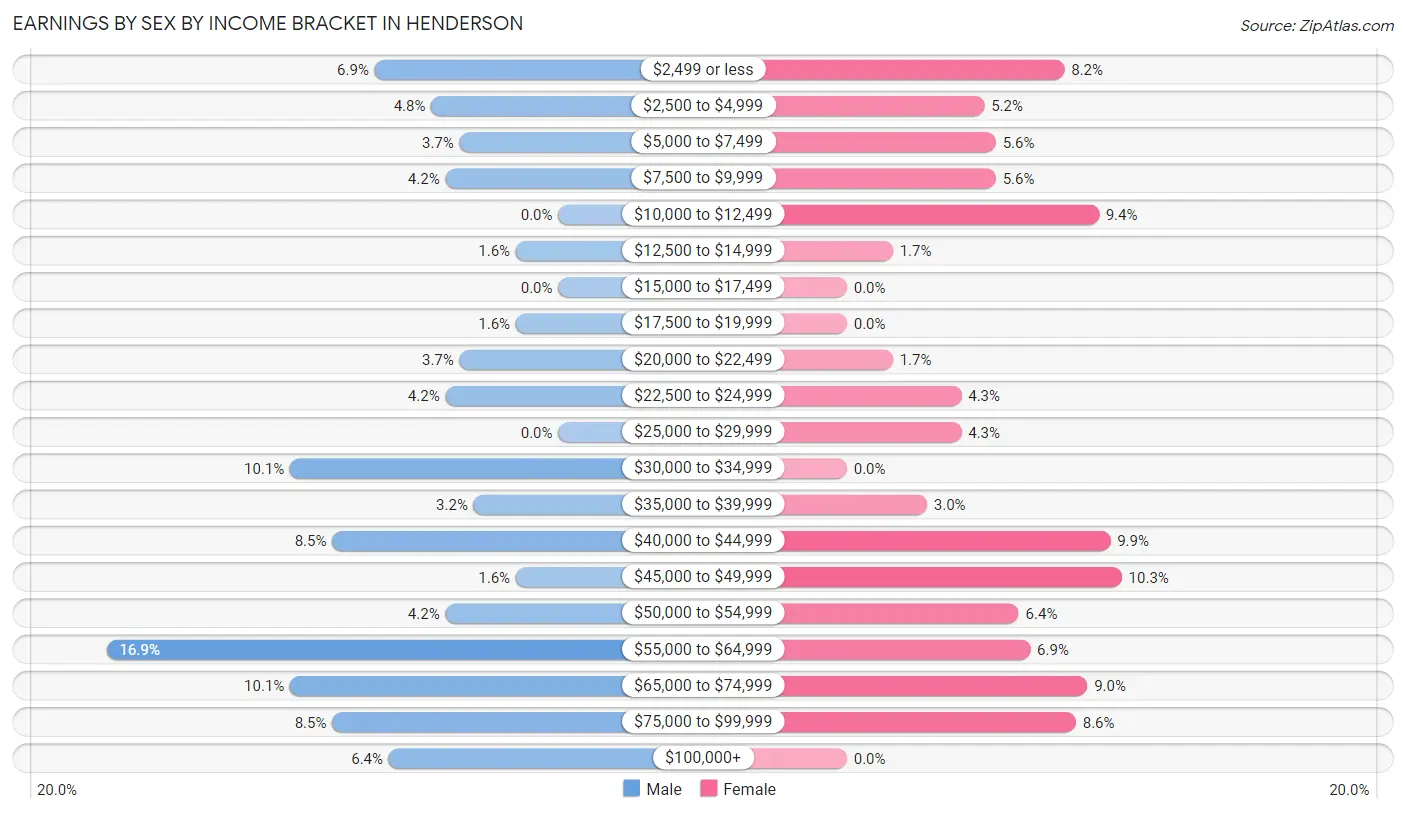
Earnings by Sex by Income Bracket in Henderson
The most common earnings brackets in Henderson are $55,000 to $64,999 for men (32 | 16.9%) and $45,000 to $49,999 for women (24 | 10.3%).
| Income | Male | Female |
| $2,499 or less | 13 (6.9%) | 19 (8.2%) |
| $2,500 to $4,999 | 9 (4.8%) | 12 (5.1%) |
| $5,000 to $7,499 | 7 (3.7%) | 13 (5.6%) |
| $7,500 to $9,999 | 8 (4.2%) | 13 (5.6%) |
| $10,000 to $12,499 | 0 (0.0%) | 22 (9.4%) |
| $12,500 to $14,999 | 3 (1.6%) | 4 (1.7%) |
| $15,000 to $17,499 | 0 (0.0%) | 0 (0.0%) |
| $17,500 to $19,999 | 3 (1.6%) | 0 (0.0%) |
| $20,000 to $22,499 | 7 (3.7%) | 4 (1.7%) |
| $22,500 to $24,999 | 8 (4.2%) | 10 (4.3%) |
| $25,000 to $29,999 | 0 (0.0%) | 10 (4.3%) |
| $30,000 to $34,999 | 19 (10.1%) | 0 (0.0%) |
| $35,000 to $39,999 | 6 (3.2%) | 7 (3.0%) |
| $40,000 to $44,999 | 16 (8.5%) | 23 (9.9%) |
| $45,000 to $49,999 | 3 (1.6%) | 24 (10.3%) |
| $50,000 to $54,999 | 8 (4.2%) | 15 (6.4%) |
| $55,000 to $64,999 | 32 (16.9%) | 16 (6.9%) |
| $65,000 to $74,999 | 19 (10.1%) | 21 (9.0%) |
| $75,000 to $99,999 | 16 (8.5%) | 20 (8.6%) |
| $100,000+ | 12 (6.4%) | 0 (0.0%) |
| Total | 189 (100.0%) | 233 (100.0%) |
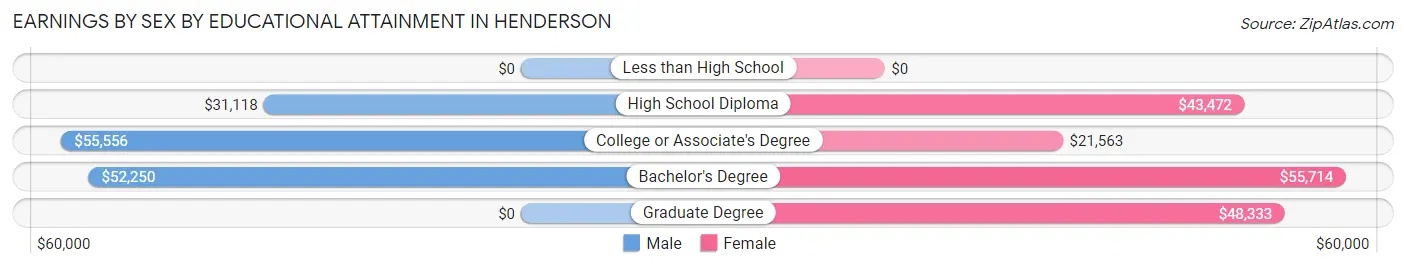
Earnings by Sex by Educational Attainment in Henderson
Average earnings in Henderson are $43,393 for men and $44,342 for women, a difference of 2.1%. Men with an educational attainment of college or associate's degree enjoy the highest average annual earnings of $55,556, while those with high school diploma education earn the least with $31,118. Women with an educational attainment of bachelor's degree earn the most with the average annual earnings of $55,714, while those with college or associate's degree education have the smallest earnings of $21,563.
| Educational Attainment | Male Income | Female Income |
| Less than High School | - | - |
| High School Diploma | $31,118 | $43,472 |
| College or Associate's Degree | $55,556 | $21,563 |
| Bachelor's Degree | $52,250 | $55,714 |
| Graduate Degree | - | - |
| Total | $43,393 | $44,342 |
Family Income in Henderson
Family Income Brackets in Henderson
According to the Henderson family income data, there are 75 families falling into the $75,000 to $99,999 income range, which is the most common income bracket and makes up 29.2% of all families. Conversely, the $15,000 to $24,999 income bracket is the least frequent group with only 2 families (0.8%) belonging to this category.
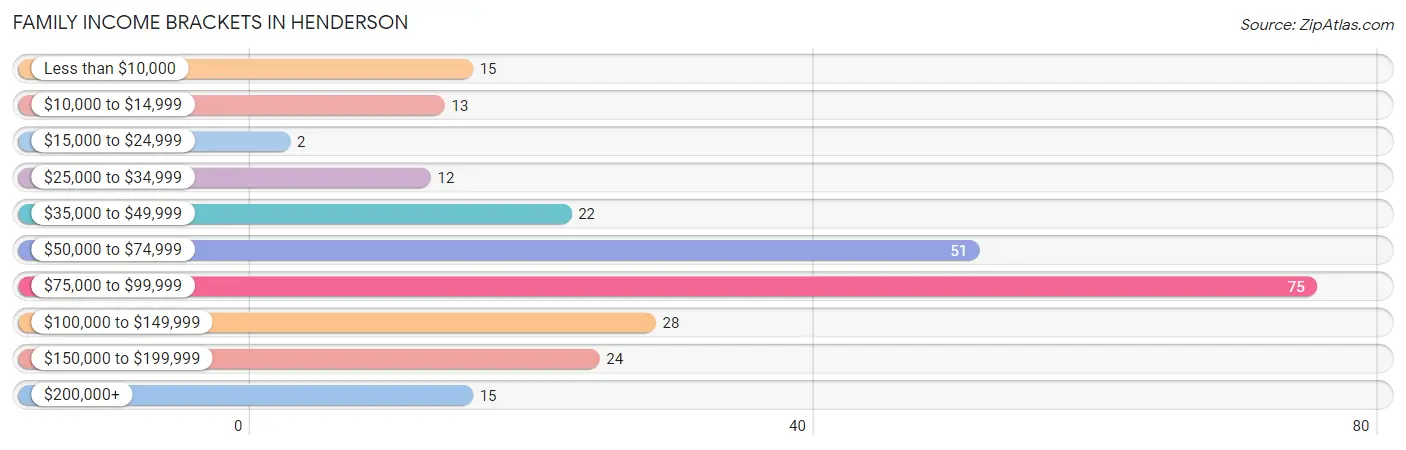
| Income Bracket | # Families | % Families |
| Less than $10,000 | 15 | 5.8% |
| $10,000 to $14,999 | 13 | 5.1% |
| $15,000 to $24,999 | 2 | 0.8% |
| $25,000 to $34,999 | 12 | 4.7% |
| $35,000 to $49,999 | 22 | 8.6% |
| $50,000 to $74,999 | 51 | 19.8% |
| $75,000 to $99,999 | 75 | 29.2% |
| $100,000 to $149,999 | 28 | 10.9% |
| $150,000 to $199,999 | 24 | 9.3% |
| $200,000+ | 15 | 5.8% |
Family Income by Famaliy Size in Henderson
5-person families (21 | 8.2%) account for the highest median family income in Henderson with $163,250 per family, while 3-person families (24 | 9.3%) have the highest median income of $38,681 per family member.
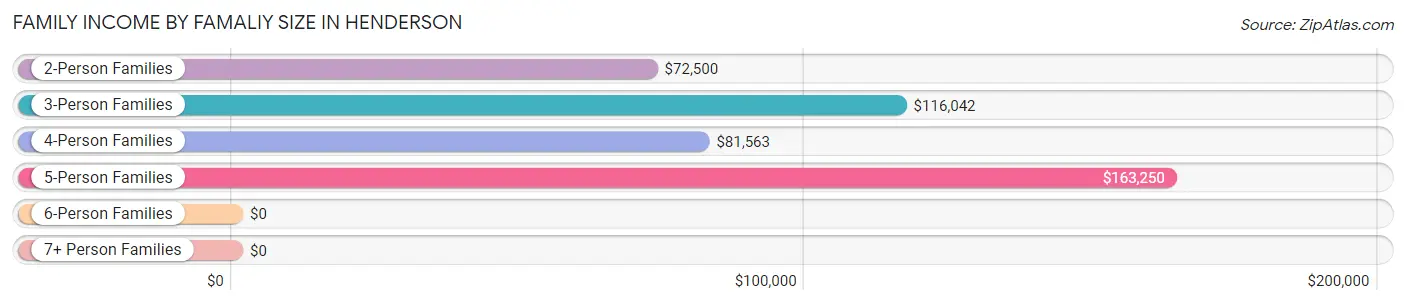
| Income Bracket | # Families | Median Income |
| 2-Person Families | 140 (54.5%) | $72,500 |
| 3-Person Families | 24 (9.3%) | $116,042 |
| 4-Person Families | 53 (20.6%) | $81,563 |
| 5-Person Families | 21 (8.2%) | $163,250 |
| 6-Person Families | 1 (0.4%) | $0 |
| 7+ Person Families | 18 (7.0%) | $0 |
| Total | 257 (100.0%) | $78,068 |
Family Income by Number of Earners in Henderson
The median family income in Henderson is $78,068, with families comprising 3+ earners (27) having the highest median family income of $154,792, while families with no earners (65) have the lowest median family income of $58,125, accounting for 10.5% and 25.3% of families, respectively.
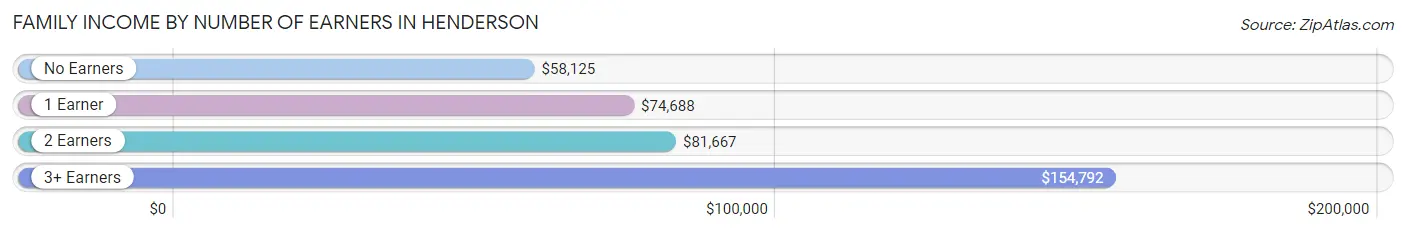
| Number of Earners | # Families | Median Income |
| No Earners | 65 (25.3%) | $58,125 |
| 1 Earner | 29 (11.3%) | $74,688 |
| 2 Earners | 136 (52.9%) | $81,667 |
| 3+ Earners | 27 (10.5%) | $154,792 |
| Total | 257 (100.0%) | $78,068 |
Household Income in Henderson
Household Income Brackets in Henderson
With 116 households falling in the category, the $75,000 to $99,999 income range is the most frequent in Henderson, accounting for 30.4% of all households. In contrast, only 13 households (3.4%) fall into the $10,000 to $14,999 income bracket, making it the least populous group.
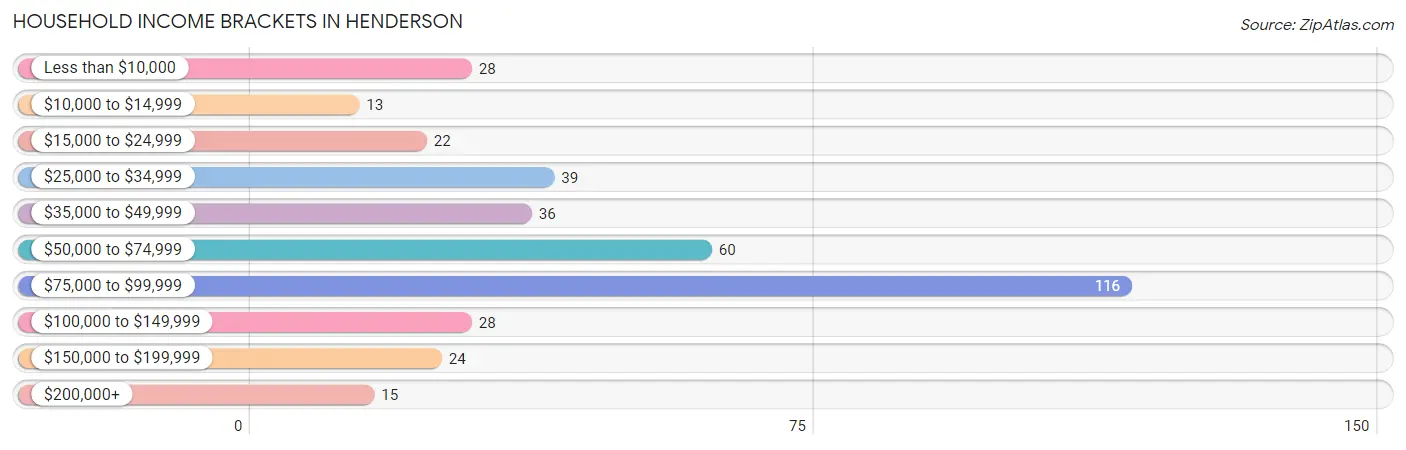
| Income Bracket | # Households | % Households |
| Less than $10,000 | 28 | 7.3% |
| $10,000 to $14,999 | 13 | 3.4% |
| $15,000 to $24,999 | 22 | 5.8% |
| $25,000 to $34,999 | 39 | 10.2% |
| $35,000 to $49,999 | 36 | 9.4% |
| $50,000 to $74,999 | 60 | 15.7% |
| $75,000 to $99,999 | 116 | 30.4% |
| $100,000 to $149,999 | 28 | 7.3% |
| $150,000 to $199,999 | 24 | 6.3% |
| $200,000+ | 15 | 3.9% |
Household Income by Householder Age in Henderson
The median household income in Henderson is $72,656, with the highest median household income of $82,794 found in the 25 to 44 years age bracket for the primary householder. A total of 114 households (29.9%) fall into this category.
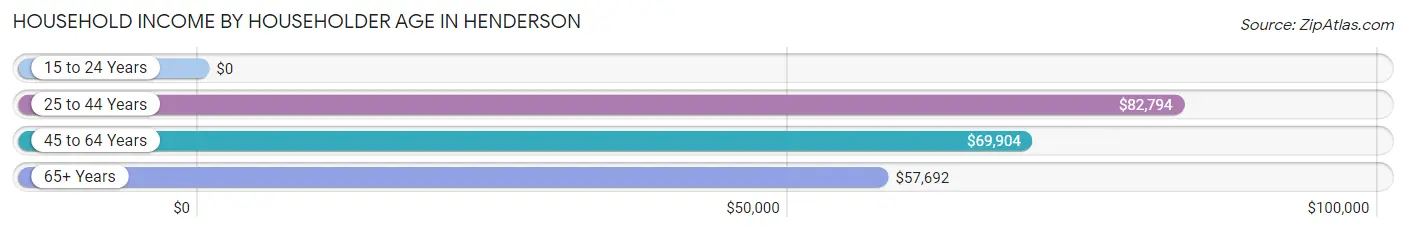
| Income Bracket | # Households | Median Income |
| 15 to 24 Years | 0 (0.0%) | $0 |
| 25 to 44 Years | 114 (29.9%) | $82,794 |
| 45 to 64 Years | 81 (21.3%) | $69,904 |
| 65+ Years | 186 (48.8%) | $57,692 |
| Total | 381 (100.0%) | $72,656 |
Poverty in Henderson
Income Below Poverty by Sex and Age in Henderson
With 13.8% poverty level for males and 10.8% for females among the residents of Henderson, 6 to 11 year old males and 5 year old females are the most vulnerable to poverty, with 3 males (33.3%) and 1 females (100.0%) in their respective age groups living below the poverty level.
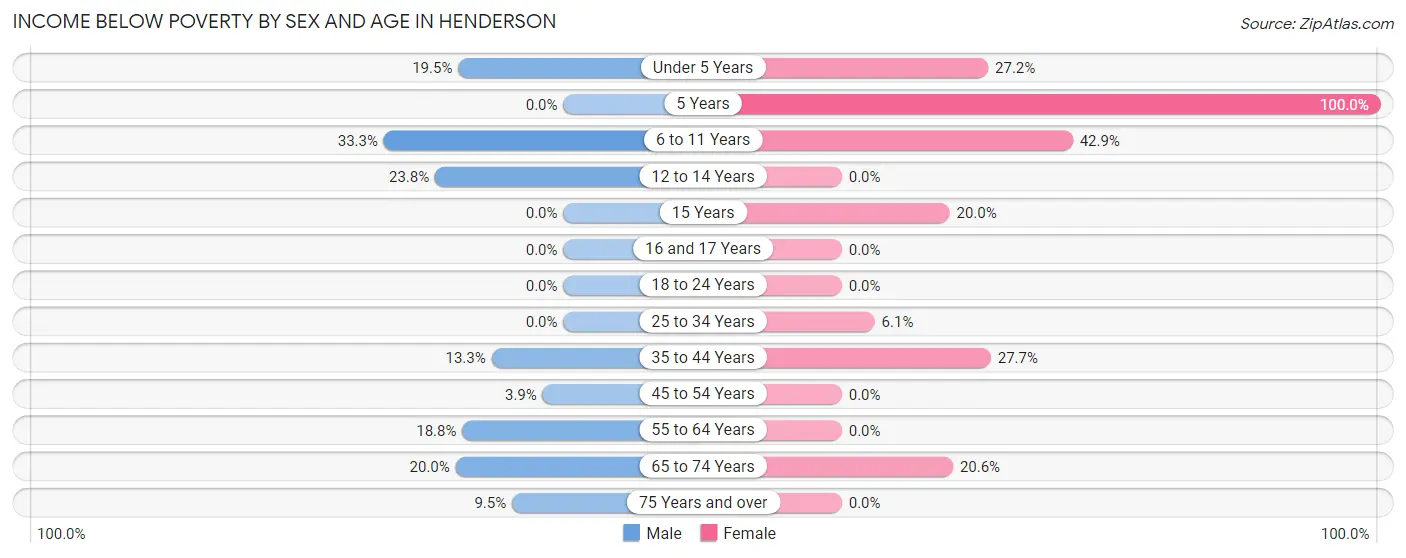
| Age Bracket | Male | Female |
| Under 5 Years | 8 (19.5%) | 22 (27.2%) |
| 5 Years | 0 (0.0%) | 1 (100.0%) |
| 6 to 11 Years | 3 (33.3%) | 6 (42.9%) |
| 12 to 14 Years | 5 (23.8%) | 0 (0.0%) |
| 15 Years | 0 (0.0%) | 1 (20.0%) |
| 16 and 17 Years | 0 (0.0%) | 0 (0.0%) |
| 18 to 24 Years | 0 (0.0%) | 0 (0.0%) |
| 25 to 34 Years | 0 (0.0%) | 5 (6.1%) |
| 35 to 44 Years | 6 (13.3%) | 13 (27.7%) |
| 45 to 54 Years | 1 (3.8%) | 0 (0.0%) |
| 55 to 64 Years | 9 (18.8%) | 0 (0.0%) |
| 65 to 74 Years | 11 (20.0%) | 13 (20.6%) |
| 75 Years and over | 6 (9.5%) | 0 (0.0%) |
| Total | 49 (13.8%) | 61 (10.8%) |
Income Above Poverty by Sex and Age in Henderson
According to the poverty statistics in Henderson, males aged 25 to 34 years and females aged 12 to 14 years are the age groups that are most secure financially, with 100.0% of males and 100.0% of females in these age groups living above the poverty line.
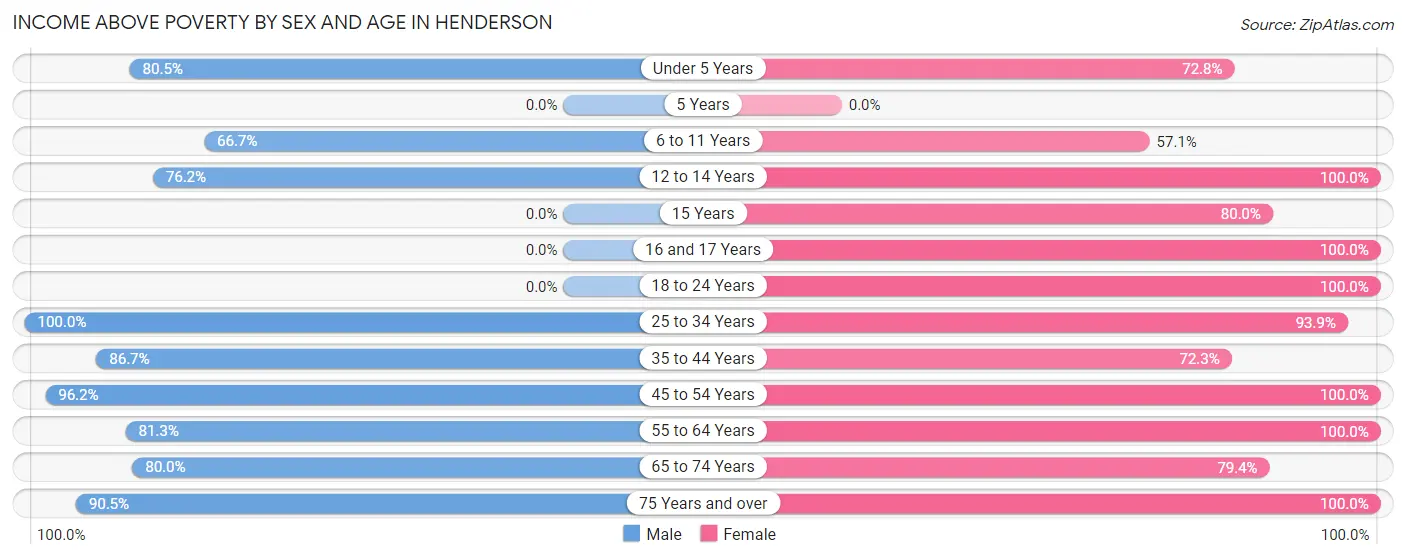
| Age Bracket | Male | Female |
| Under 5 Years | 33 (80.5%) | 59 (72.8%) |
| 5 Years | 0 (0.0%) | 0 (0.0%) |
| 6 to 11 Years | 6 (66.7%) | 8 (57.1%) |
| 12 to 14 Years | 16 (76.2%) | 55 (100.0%) |
| 15 Years | 0 (0.0%) | 4 (80.0%) |
| 16 and 17 Years | 0 (0.0%) | 38 (100.0%) |
| 18 to 24 Years | 0 (0.0%) | 16 (100.0%) |
| 25 to 34 Years | 46 (100.0%) | 77 (93.9%) |
| 35 to 44 Years | 39 (86.7%) | 34 (72.3%) |
| 45 to 54 Years | 25 (96.2%) | 19 (100.0%) |
| 55 to 64 Years | 39 (81.2%) | 40 (100.0%) |
| 65 to 74 Years | 44 (80.0%) | 50 (79.4%) |
| 75 Years and over | 57 (90.5%) | 105 (100.0%) |
| Total | 305 (86.2%) | 505 (89.2%) |
Income Below Poverty Among Married-Couple Families in Henderson
The poverty statistics for married-couple families in Henderson show that 10.7% or 27 of the total 253 families live below the poverty line. Families with 5 or more children have the highest poverty rate of 72.2%, comprising of 13 families. On the other hand, families with 1 or 2 children have the lowest poverty rate of 0.0%, which includes 0 families.
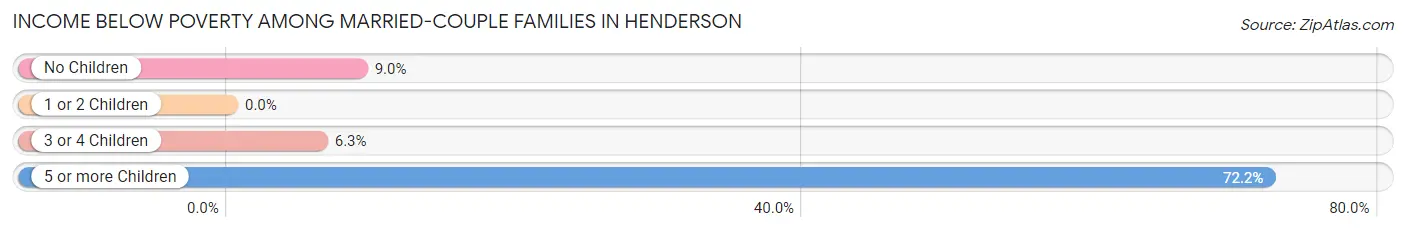
| Children | Above Poverty | Below Poverty |
| No Children | 131 (91.0%) | 13 (9.0%) |
| 1 or 2 Children | 75 (100.0%) | 0 (0.0%) |
| 3 or 4 Children | 15 (93.8%) | 1 (6.2%) |
| 5 or more Children | 5 (27.8%) | 13 (72.2%) |
| Total | 226 (89.3%) | 27 (10.7%) |
Income Below Poverty Among Single-Parent Households in Henderson
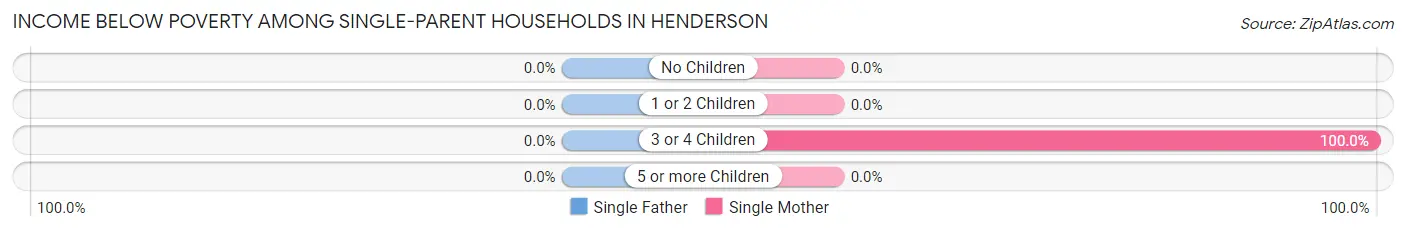
| Children | Single Father | Single Mother |
| No Children | 0 (0.0%) | 0 (0.0%) |
| 1 or 2 Children | 0 (0.0%) | 0 (0.0%) |
| 3 or 4 Children | 0 (0.0%) | 4 (100.0%) |
| 5 or more Children | 0 (0.0%) | 0 (0.0%) |
| Total | 0 (0.0%) | 4 (100.0%) |
Income Below Poverty Among Married-Couple vs Single-Parent Households in Henderson
The poverty data for Henderson shows that 27 of the married-couple family households (10.7%) and 4 of the single-parent households (100.0%) are living below the poverty level. Within the married-couple family households, those with 5 or more children have the highest poverty rate, with 13 households (72.2%) falling below the poverty line. Among the single-parent households, those with 3 or 4 children have the highest poverty rate, with 4 household (100.0%) living below poverty.
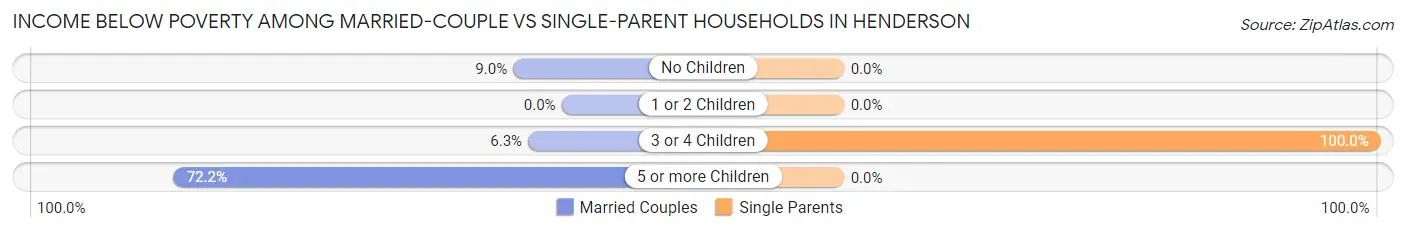
| Children | Married-Couple Families | Single-Parent Households |
| No Children | 13 (9.0%) | 0 (0.0%) |
| 1 or 2 Children | 0 (0.0%) | 0 (0.0%) |
| 3 or 4 Children | 1 (6.2%) | 4 (100.0%) |
| 5 or more Children | 13 (72.2%) | 0 (0.0%) |
| Total | 27 (10.7%) | 4 (100.0%) |
Race in Henderson
The most populous races in Henderson are White / Caucasian (893 | 93.2%), Two or more Races (61 | 6.4%), and Hispanic or Latino (5 | 0.5%).
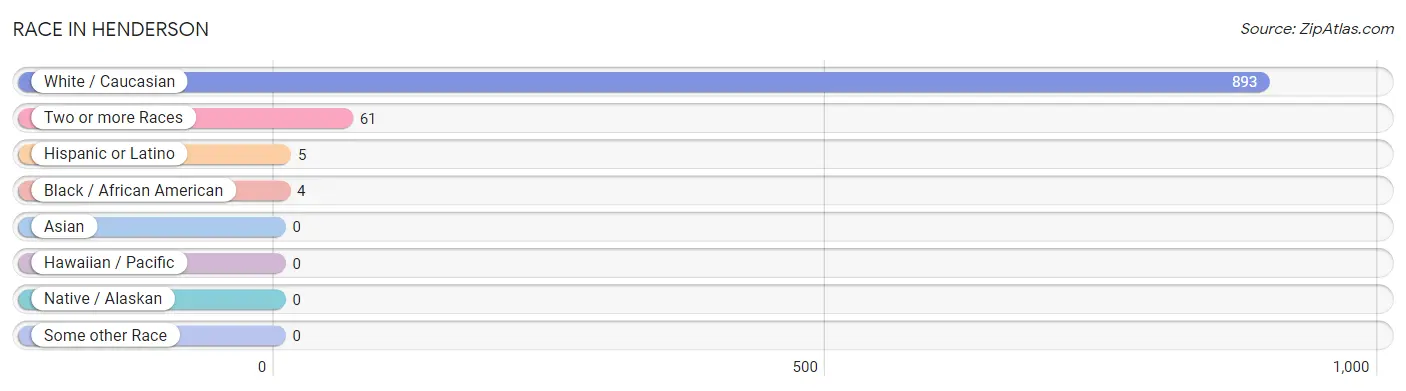
| Race | # Population | % Population |
| Asian | 0 | 0.0% |
| Black / African American | 4 | 0.4% |
| Hawaiian / Pacific | 0 | 0.0% |
| Hispanic or Latino | 5 | 0.5% |
| Native / Alaskan | 0 | 0.0% |
| White / Caucasian | 893 | 93.2% |
| Two or more Races | 61 | 6.4% |
| Some other Race | 0 | 0.0% |
| Total | 958 | 100.0% |
Ancestry in Henderson
The most populous ancestries reported in Henderson are German (556 | 58.0%), English (105 | 11.0%), Dutch (66 | 6.9%), French (57 | 5.9%), and Irish (51 | 5.3%), together accounting for 87.2% of all Henderson residents.
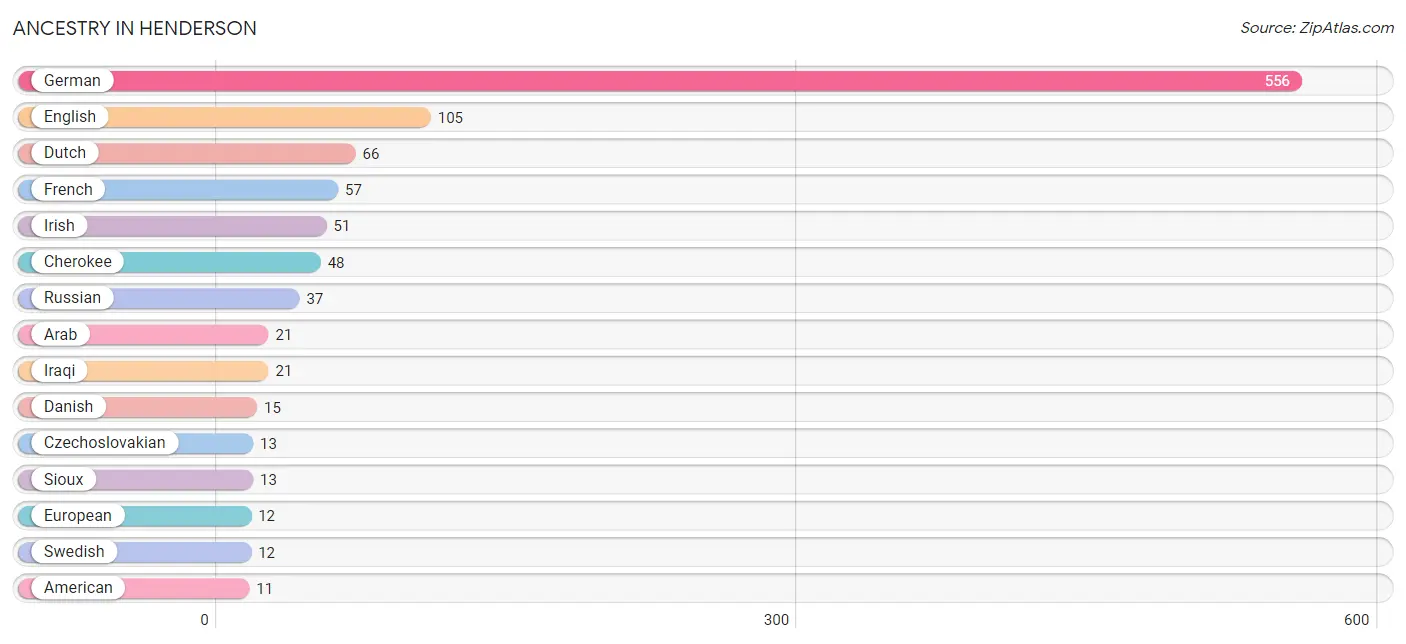
| Ancestry | # Population | % Population |
| American | 11 | 1.1% |
| Arab | 21 | 2.2% |
| British | 4 | 0.4% |
| Central American | 4 | 0.4% |
| Central American Indian | 1 | 0.1% |
| Cherokee | 48 | 5.0% |
| Czech | 5 | 0.5% |
| Czechoslovakian | 13 | 1.4% |
| Danish | 15 | 1.6% |
| Dutch | 66 | 6.9% |
| English | 105 | 11.0% |
| European | 12 | 1.3% |
| Finnish | 5 | 0.5% |
| French | 57 | 5.9% |
| German | 556 | 58.0% |
| Iraqi | 21 | 2.2% |
| Irish | 51 | 5.3% |
| Mexican | 1 | 0.1% |
| Mexican American Indian | 1 | 0.1% |
| Northern European | 3 | 0.3% |
| Norwegian | 4 | 0.4% |
| Russian | 37 | 3.9% |
| Salvadoran | 4 | 0.4% |
| Scottish | 9 | 0.9% |
| Sioux | 13 | 1.4% |
| Swedish | 12 | 1.3% |
| Thai | 1 | 0.1% | View All 27 Rows |
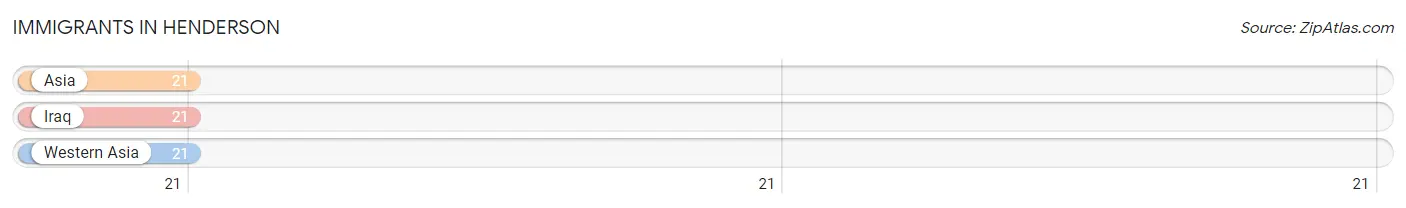
Immigrants in Henderson
The most numerous immigrant groups reported in Henderson came from Asia (21 | 2.2%), Iraq (21 | 2.2%), and Western Asia (21 | 2.2%), together accounting for 6.6% of all Henderson residents.
| Immigration Origin | # Population | % Population |
| Asia | 21 | 2.2% |
| Iraq | 21 | 2.2% |
| Western Asia | 21 | 2.2% | View All 3 Rows |
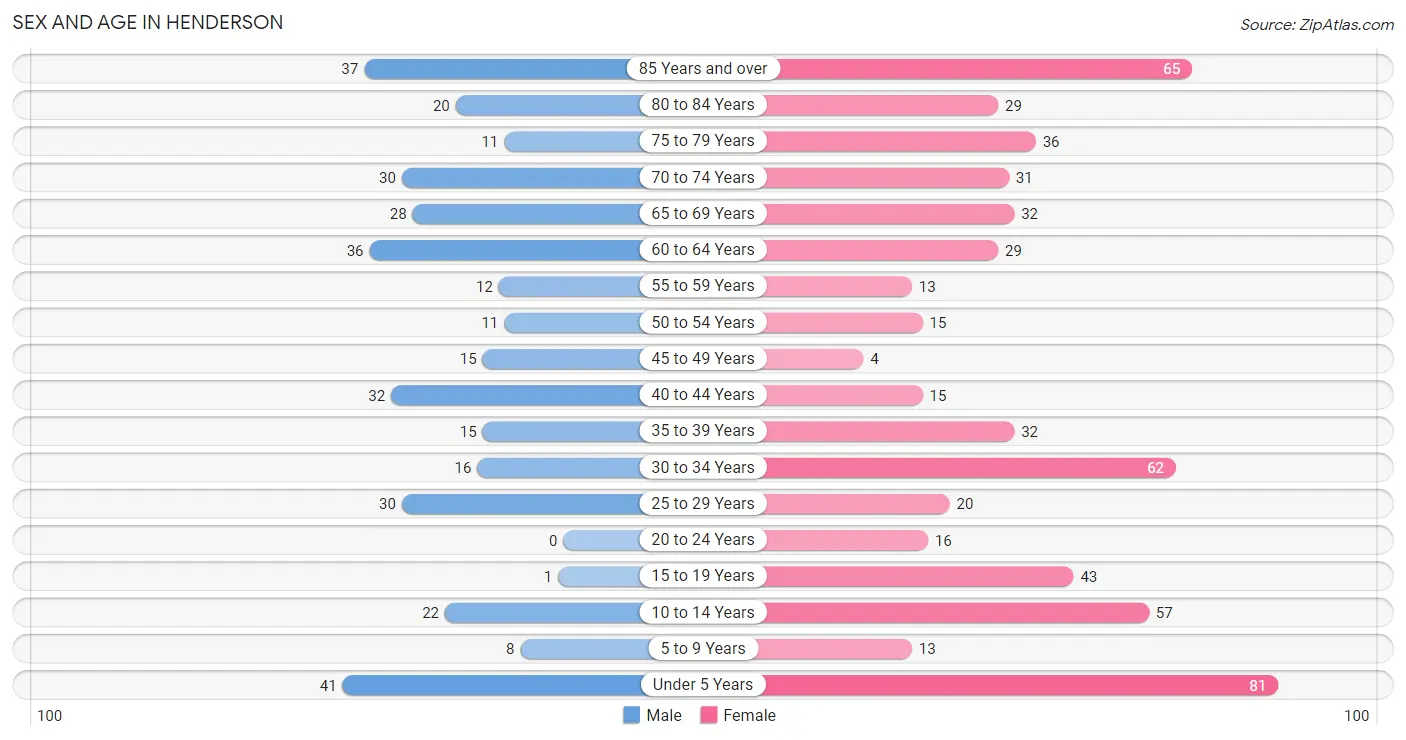
Sex and Age in Henderson
Sex and Age in Henderson
The most populous age groups in Henderson are Under 5 Years (41 | 11.2%) for men and Under 5 Years (81 | 13.7%) for women.
| Age Bracket | Male | Female |
| Under 5 Years | 41 (11.2%) | 81 (13.7%) |
| 5 to 9 Years | 8 (2.2%) | 13 (2.2%) |
| 10 to 14 Years | 22 (6.0%) | 57 (9.6%) |
| 15 to 19 Years | 1 (0.3%) | 43 (7.2%) |
| 20 to 24 Years | 0 (0.0%) | 16 (2.7%) |
| 25 to 29 Years | 30 (8.2%) | 20 (3.4%) |
| 30 to 34 Years | 16 (4.4%) | 62 (10.5%) |
| 35 to 39 Years | 15 (4.1%) | 32 (5.4%) |
| 40 to 44 Years | 32 (8.8%) | 15 (2.5%) |
| 45 to 49 Years | 15 (4.1%) | 4 (0.7%) |
| 50 to 54 Years | 11 (3.0%) | 15 (2.5%) |
| 55 to 59 Years | 12 (3.3%) | 13 (2.2%) |
| 60 to 64 Years | 36 (9.9%) | 29 (4.9%) |
| 65 to 69 Years | 28 (7.7%) | 32 (5.4%) |
| 70 to 74 Years | 30 (8.2%) | 31 (5.2%) |
| 75 to 79 Years | 11 (3.0%) | 36 (6.1%) |
| 80 to 84 Years | 20 (5.5%) | 29 (4.9%) |
| 85 Years and over | 37 (10.1%) | 65 (11.0%) |
| Total | 365 (100.0%) | 593 (100.0%) |
Families and Households in Henderson
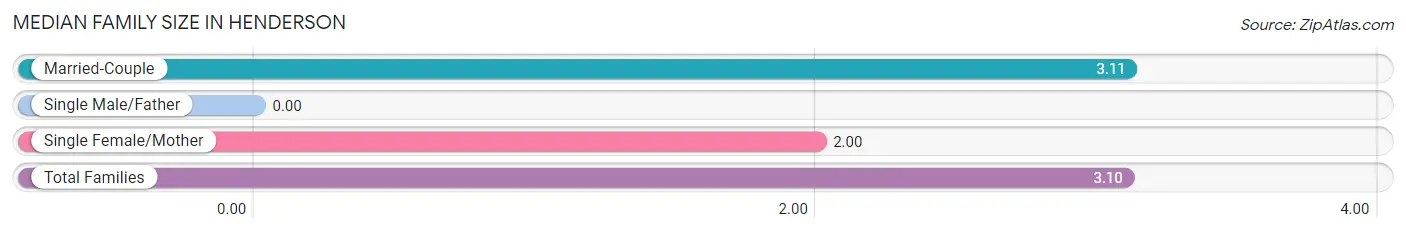
Median Family Size in Henderson
| Family Type | # Families | Family Size |
| Married-Couple | 253 (98.4%) | 3.11 |
| Single Male/Father | 0 (0.0%) | - |
| Single Female/Mother | 4 (1.6%) | 2.00 |
| Total Families | 257 (100.0%) | 3.10 |
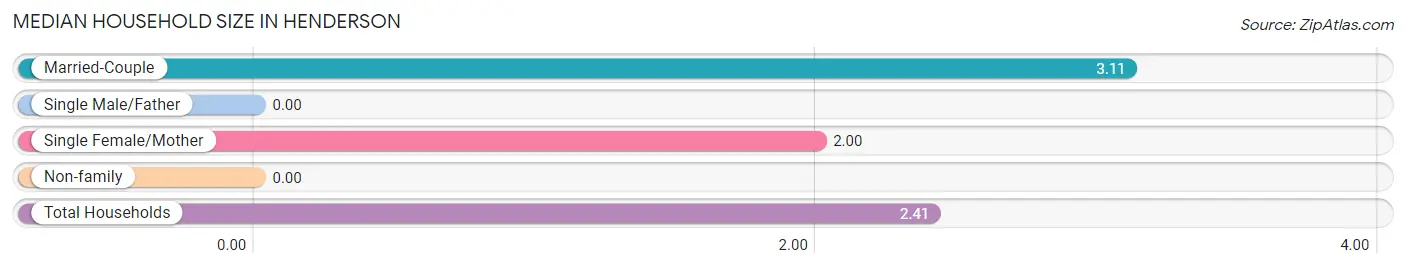
Median Household Size in Henderson
| Household Type | # Households | Household Size |
| Married-Couple | 253 (66.4%) | 3.11 |
| Single Male/Father | 0 (0.0%) | - |
| Single Female/Mother | 4 (1.1%) | 2.00 |
| Non-family | 124 (32.6%) | - |
| Total Households | 381 (100.0%) | 2.41 |
Household Size by Marriage Status in Henderson
Out of a total of 381 households in Henderson, 257 (67.4%) are family households, while 124 (32.6%) are nonfamily households. The most numerous type of family households are 2-person households, comprising 140, and the most common type of nonfamily households are 1-person households, comprising 124.
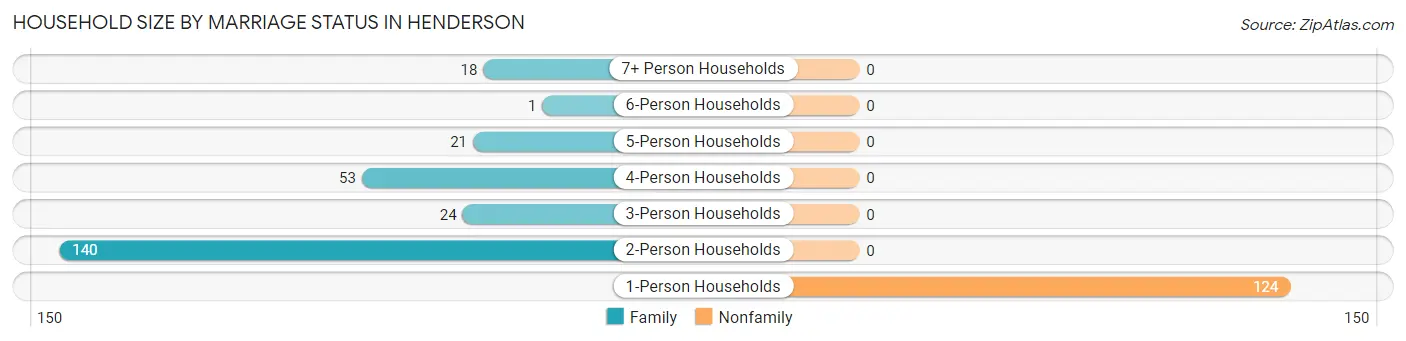
| Household Size | Family Households | Nonfamily Households |
| 1-Person Households | - | 124 (32.6%) |
| 2-Person Households | 140 (36.7%) | 0 (0.0%) |
| 3-Person Households | 24 (6.3%) | 0 (0.0%) |
| 4-Person Households | 53 (13.9%) | 0 (0.0%) |
| 5-Person Households | 21 (5.5%) | 0 (0.0%) |
| 6-Person Households | 1 (0.3%) | 0 (0.0%) |
| 7+ Person Households | 18 (4.7%) | 0 (0.0%) |
| Total | 257 (67.4%) | 124 (32.6%) |
Female Fertility in Henderson
Fertility by Age in Henderson
Average fertility rate in Henderson is 176.0 births per 1,000 women. Women in the age bracket of 35 to 50 years have the highest fertility rate with 266.0 births per 1,000 women. Women in the age bracket of 20 to 34 years acount for 52.8% of all women with births.
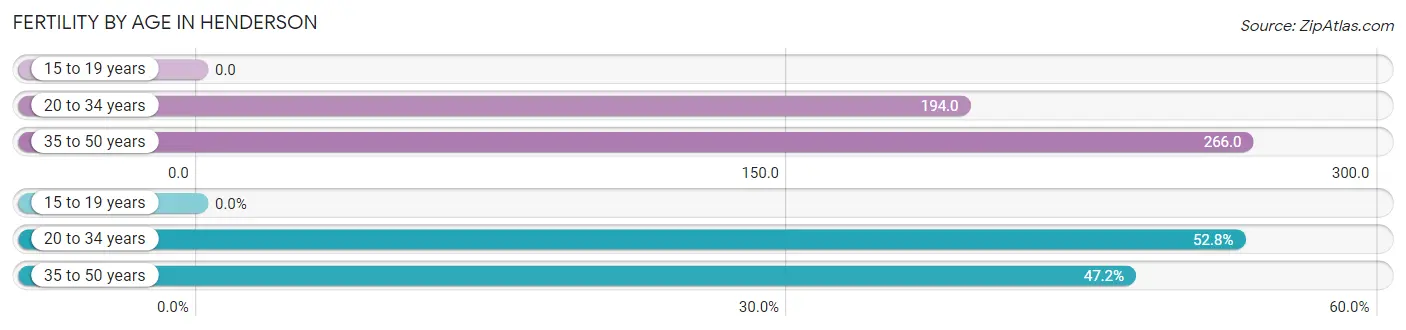
| Age Bracket | Women with Births | Births / 1,000 Women |
| 15 to 19 years | 0 (0.0%) | 0.0 |
| 20 to 34 years | 19 (52.8%) | 194.0 |
| 35 to 50 years | 17 (47.2%) | 266.0 |
| Total | 36 (100.0%) | 176.0 |
Fertility by Age by Marriage Status in Henderson
83.3% of women with births (36) in Henderson are married. The highest percentage of unmarried women with births falls into 20 to 34 years age bracket with 31.6% of them unmarried at the time of birth, while the lowest percentage of unmarried women with births belong to 35 to 50 years age bracket with 0.0% of them unmarried.
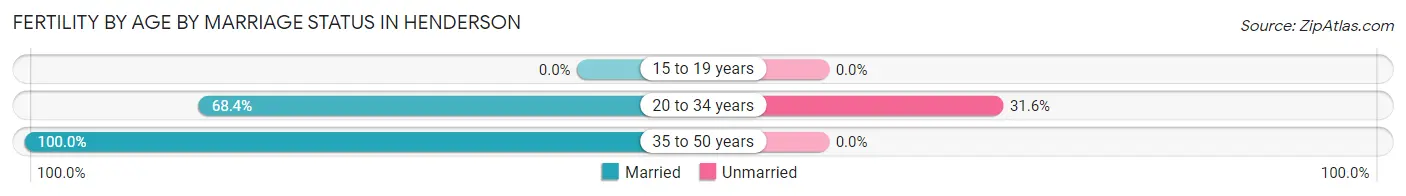
| Age Bracket | Married | Unmarried |
| 15 to 19 years | 0 (0.0%) | 0 (0.0%) |
| 20 to 34 years | 13 (68.4%) | 6 (31.6%) |
| 35 to 50 years | 17 (100.0%) | 0 (0.0%) |
| Total | 30 (83.3%) | 6 (16.7%) |
Fertility by Education in Henderson
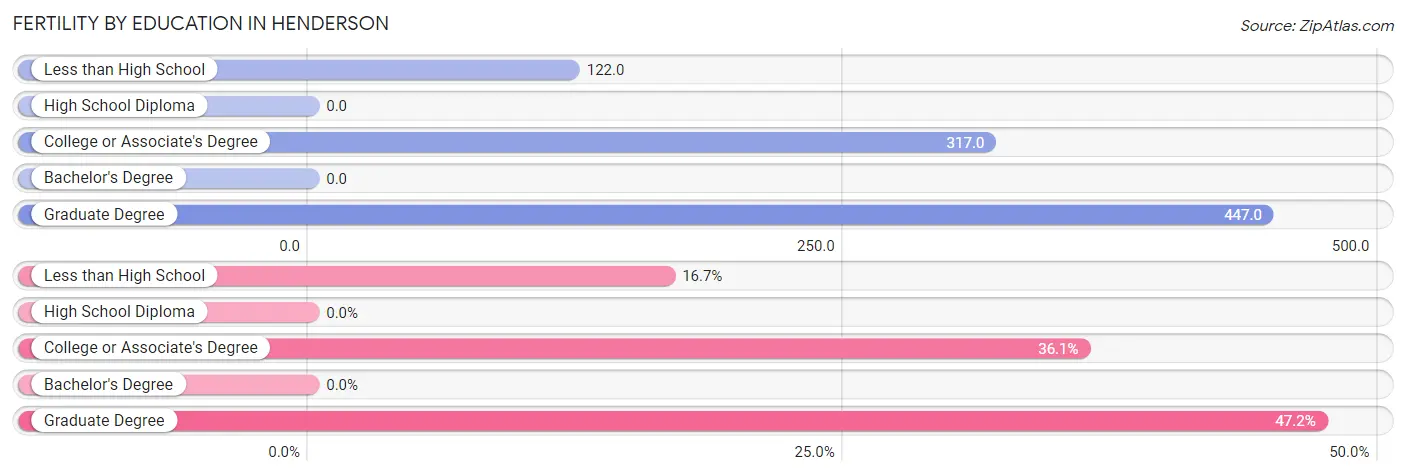
| Educational Attainment | Women with Births | Births / 1,000 Women |
| Less than High School | 6 (16.7%) | 122.0 |
| High School Diploma | 0 (0.0%) | 0.0 |
| College or Associate's Degree | 13 (36.1%) | 317.0 |
| Bachelor's Degree | 0 (0.0%) | 0.0 |
| Graduate Degree | 17 (47.2%) | 447.0 |
| Total | 36 (100.0%) | 176.0 |
Fertility by Education by Marriage Status in Henderson
16.7% of women with births in Henderson are unmarried. Women with the educational attainment of college or associate's degree are most likely to be married with 100.0% of them married at childbirth, while women with the educational attainment of less than high school are least likely to be married with 100.0% of them unmarried at childbirth.
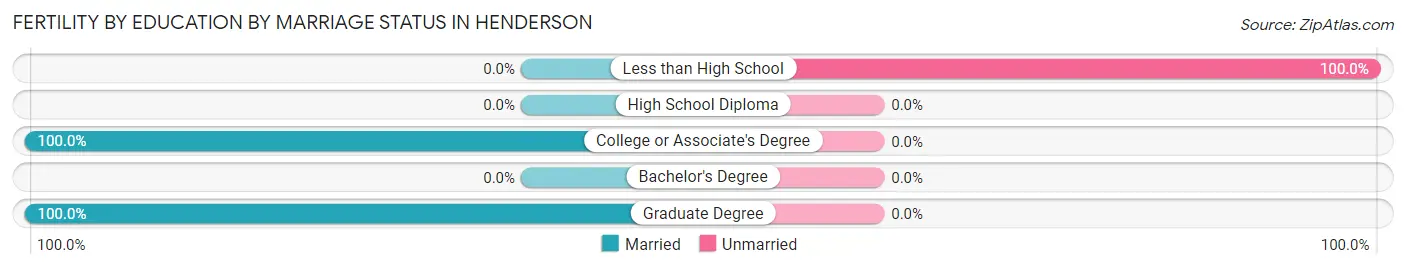
| Educational Attainment | Married | Unmarried |
| Less than High School | 0 (0.0%) | 6 (100.0%) |
| High School Diploma | 0 (0.0%) | 0 (0.0%) |
| College or Associate's Degree | 13 (100.0%) | 0 (0.0%) |
| Bachelor's Degree | 0 (0.0%) | 0 (0.0%) |
| Graduate Degree | 17 (100.0%) | 0 (0.0%) |
| Total | 30 (83.3%) | 6 (16.7%) |
Employment Characteristics in Henderson
Employment by Class of Employer in Henderson
Among the 376 employed individuals in Henderson, private company employees (185 | 49.2%), self-employed (not incorporated) (60 | 16.0%), and not-for-profit organizations (60 | 16.0%) make up the most common classes of employment.
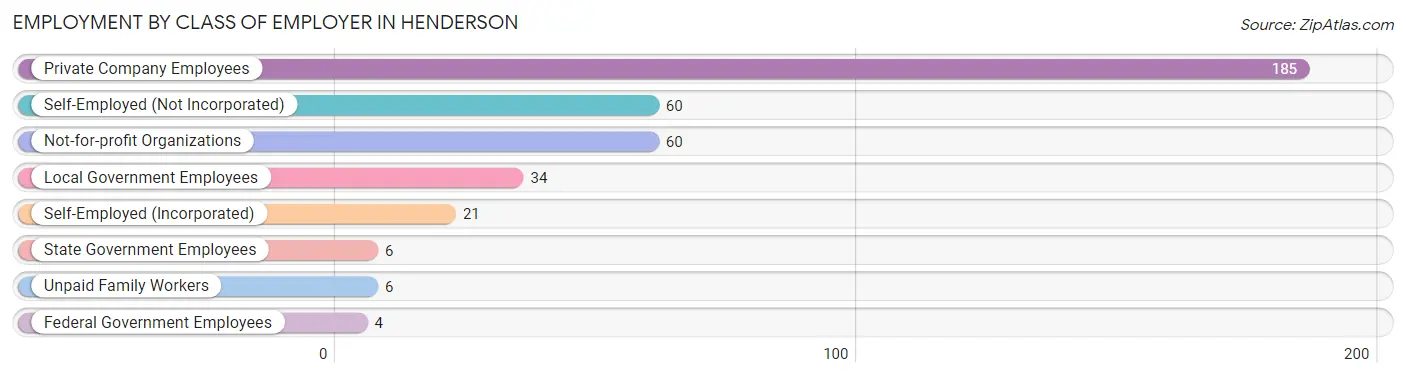
| Employer Class | # Employees | % Employees |
| Private Company Employees | 185 | 49.2% |
| Self-Employed (Incorporated) | 21 | 5.6% |
| Self-Employed (Not Incorporated) | 60 | 16.0% |
| Not-for-profit Organizations | 60 | 16.0% |
| Local Government Employees | 34 | 9.0% |
| State Government Employees | 6 | 1.6% |
| Federal Government Employees | 4 | 1.1% |
| Unpaid Family Workers | 6 | 1.6% |
| Total | 376 | 100.0% |
Employment Status by Age in Henderson
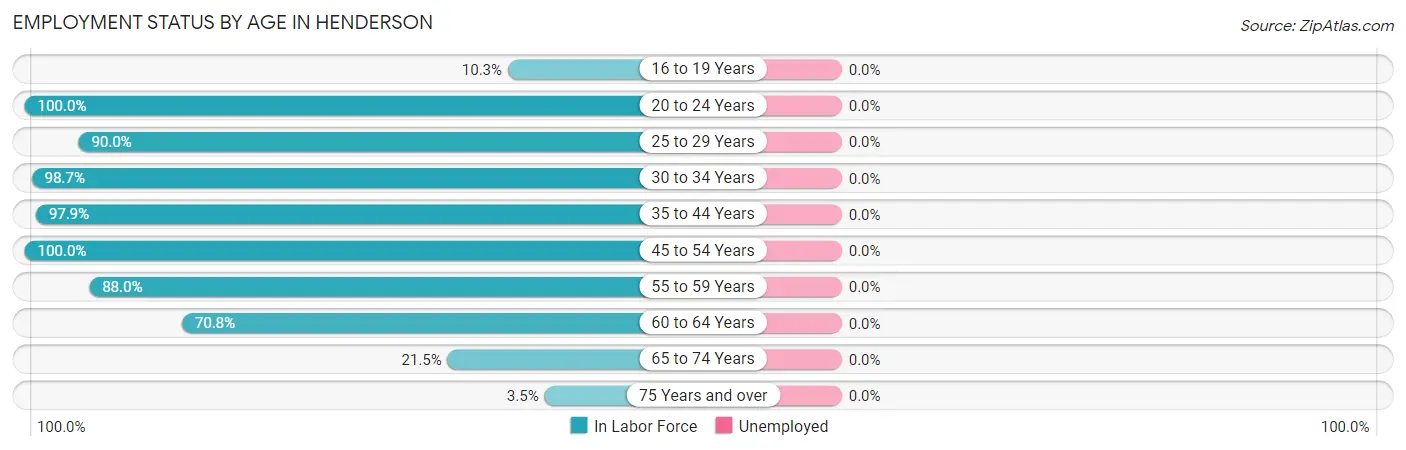
| Age Bracket | In Labor Force | Unemployed |
| 16 to 19 Years | 4 (10.3%) | 0 (0.0%) |
| 20 to 24 Years | 16 (100.0%) | 0 (0.0%) |
| 25 to 29 Years | 45 (90.0%) | 0 (0.0%) |
| 30 to 34 Years | 77 (98.7%) | 0 (0.0%) |
| 35 to 44 Years | 92 (97.9%) | 0 (0.0%) |
| 45 to 54 Years | 45 (100.0%) | 0 (0.0%) |
| 55 to 59 Years | 22 (88.0%) | 0 (0.0%) |
| 60 to 64 Years | 46 (70.8%) | 0 (0.0%) |
| 65 to 74 Years | 26 (21.5%) | 0 (0.0%) |
| 75 Years and over | 7 (3.5%) | 0 (0.0%) |
| Total | 380 (52.0%) | 0 (0.0%) |
Employment Status by Educational Attainment in Henderson
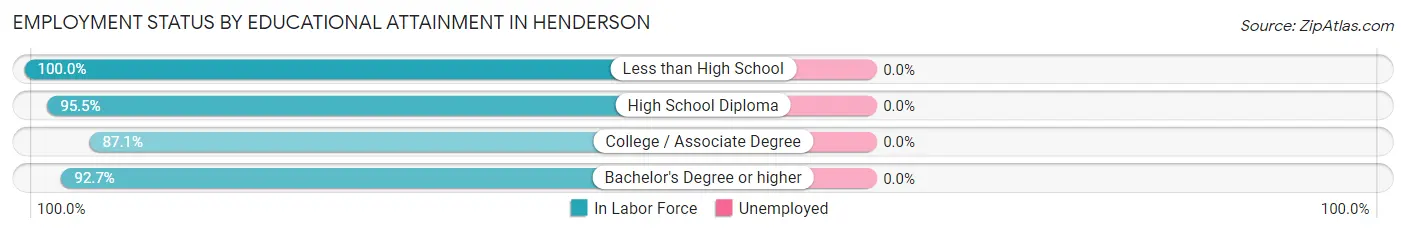
| Educational Attainment | In Labor Force | Unemployed |
| Less than High School | 14 (100.0%) | 0 (0.0%) |
| High School Diploma | 84 (95.5%) | 0 (0.0%) |
| College / Associate Degree | 115 (87.1%) | 0 (0.0%) |
| Bachelor's Degree or higher | 114 (92.7%) | 0 (0.0%) |
| Total | 327 (91.6%) | 0 (0.0%) |
Employment Occupations by Sex in Henderson
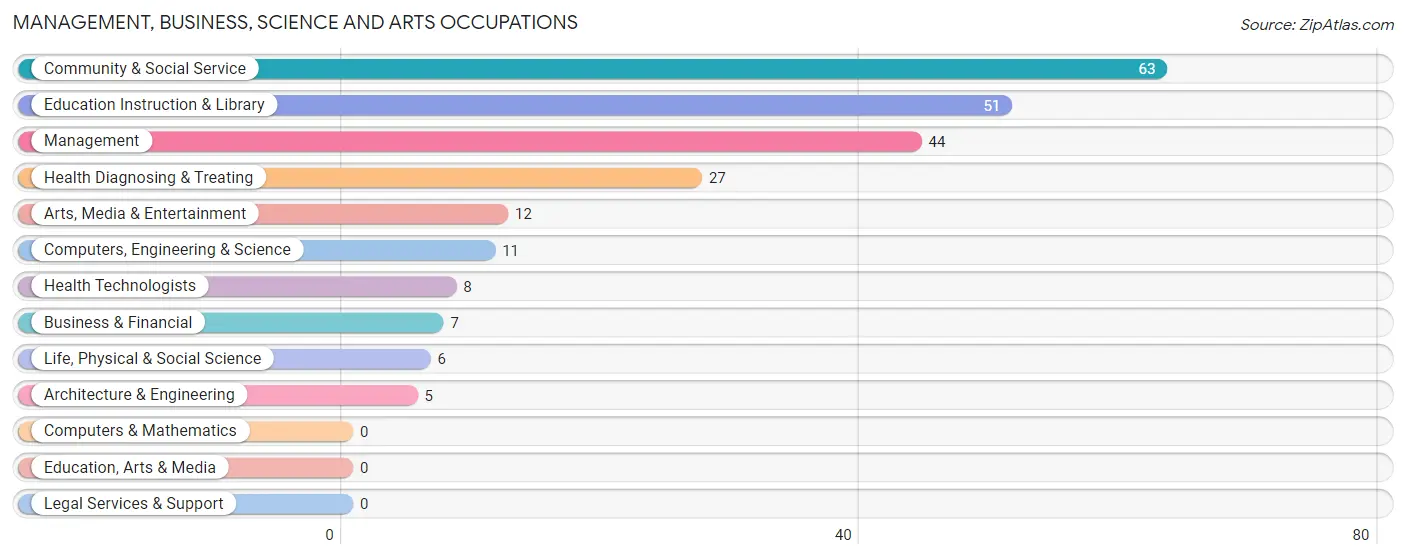
Management, Business, Science and Arts Occupations
The most common Management, Business, Science and Arts occupations in Henderson are Community & Social Service (63 | 16.6%), Education Instruction & Library (51 | 13.4%), Management (44 | 11.6%), Health Diagnosing & Treating (27 | 7.1%), and Arts, Media & Entertainment (12 | 3.2%).
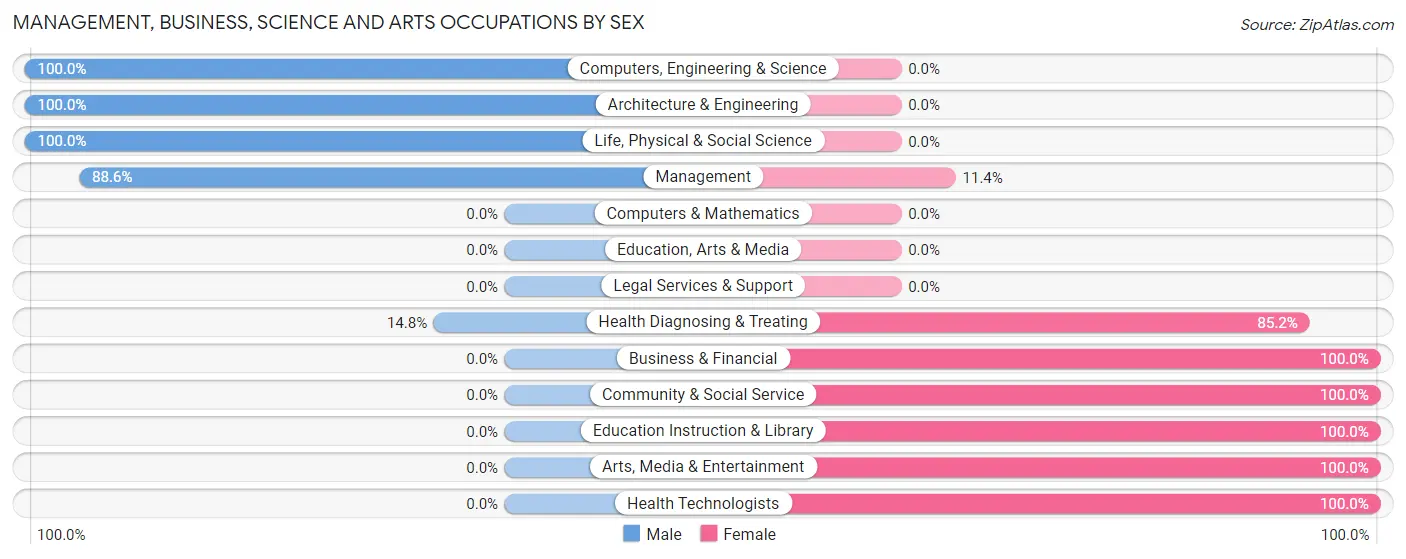
Management, Business, Science and Arts Occupations by Sex
Within the Management, Business, Science and Arts occupations in Henderson, the most male-oriented occupations are Computers, Engineering & Science (100.0%), Architecture & Engineering (100.0%), and Life, Physical & Social Science (100.0%), while the most female-oriented occupations are Business & Financial (100.0%), Community & Social Service (100.0%), and Education Instruction & Library (100.0%).
| Occupation | Male | Female |
| Management | 39 (88.6%) | 5 (11.4%) |
| Business & Financial | 0 (0.0%) | 7 (100.0%) |
| Computers, Engineering & Science | 11 (100.0%) | 0 (0.0%) |
| Computers & Mathematics | 0 (0.0%) | 0 (0.0%) |
| Architecture & Engineering | 5 (100.0%) | 0 (0.0%) |
| Life, Physical & Social Science | 6 (100.0%) | 0 (0.0%) |
| Community & Social Service | 0 (0.0%) | 63 (100.0%) |
| Education, Arts & Media | 0 (0.0%) | 0 (0.0%) |
| Legal Services & Support | 0 (0.0%) | 0 (0.0%) |
| Education Instruction & Library | 0 (0.0%) | 51 (100.0%) |
| Arts, Media & Entertainment | 0 (0.0%) | 12 (100.0%) |
| Health Diagnosing & Treating | 4 (14.8%) | 23 (85.2%) |
| Health Technologists | 0 (0.0%) | 8 (100.0%) |
| Total (Category) | 54 (35.5%) | 98 (64.5%) |
| Total (Overall) | 176 (46.3%) | 204 (53.7%) |
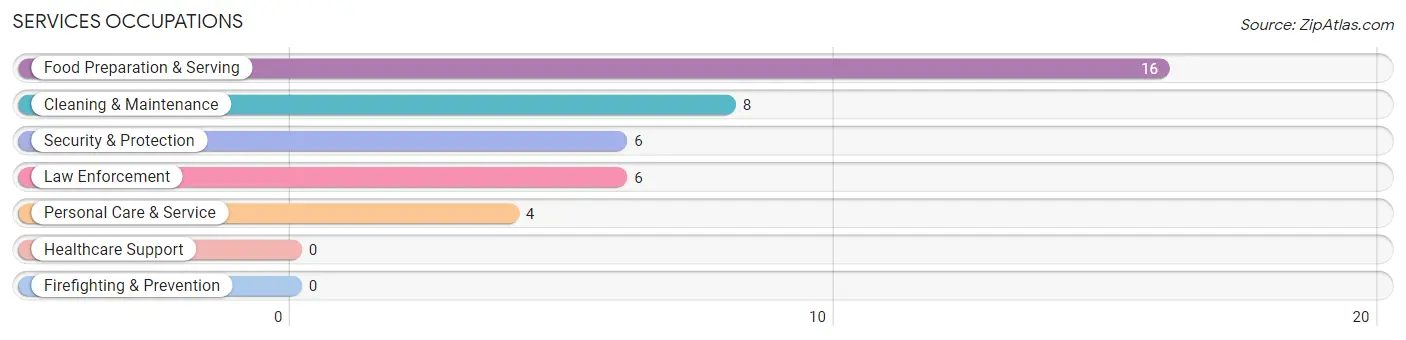
Services Occupations
The most common Services occupations in Henderson are Food Preparation & Serving (16 | 4.2%), Cleaning & Maintenance (8 | 2.1%), Security & Protection (6 | 1.6%), Law Enforcement (6 | 1.6%), and Personal Care & Service (4 | 1.1%).
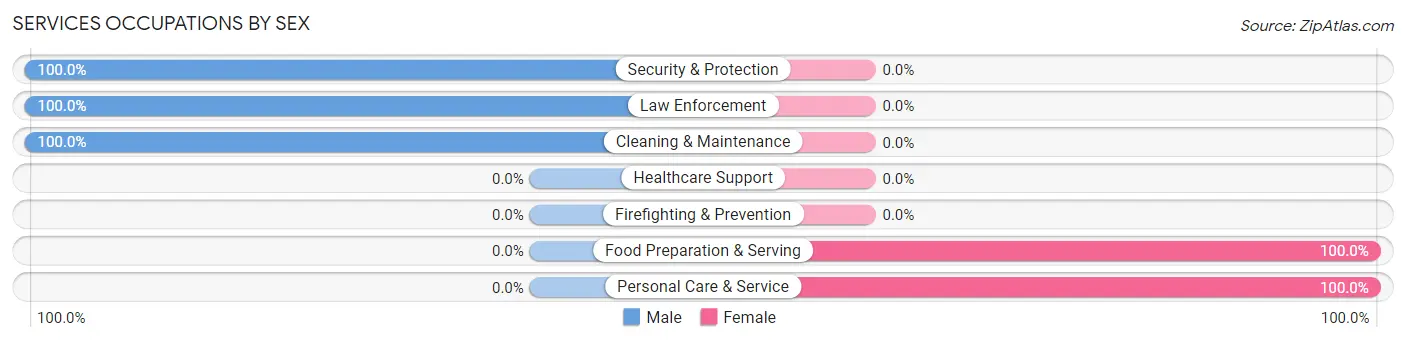
Services Occupations by Sex
Within the Services occupations in Henderson, the most male-oriented occupations are Security & Protection (100.0%), Law Enforcement (100.0%), and Cleaning & Maintenance (100.0%), while the most female-oriented occupations are Food Preparation & Serving (100.0%), and Personal Care & Service (100.0%).
| Occupation | Male | Female |
| Healthcare Support | 0 (0.0%) | 0 (0.0%) |
| Security & Protection | 6 (100.0%) | 0 (0.0%) |
| Firefighting & Prevention | 0 (0.0%) | 0 (0.0%) |
| Law Enforcement | 6 (100.0%) | 0 (0.0%) |
| Food Preparation & Serving | 0 (0.0%) | 16 (100.0%) |
| Cleaning & Maintenance | 8 (100.0%) | 0 (0.0%) |
| Personal Care & Service | 0 (0.0%) | 4 (100.0%) |
| Total (Category) | 14 (41.2%) | 20 (58.8%) |
| Total (Overall) | 176 (46.3%) | 204 (53.7%) |
Sales and Office Occupations
The most common Sales and Office occupations in Henderson are Sales & Related (59 | 15.5%), and Office & Administration (34 | 8.9%).
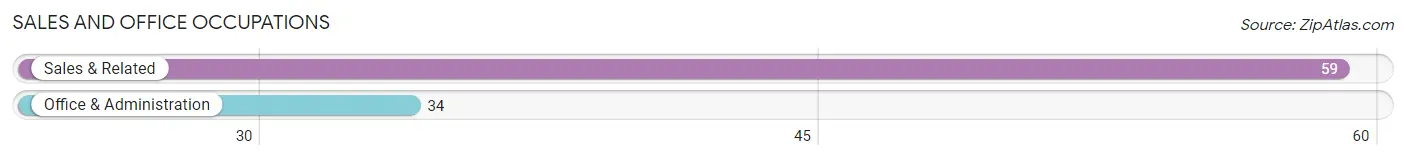
Sales and Office Occupations by Sex
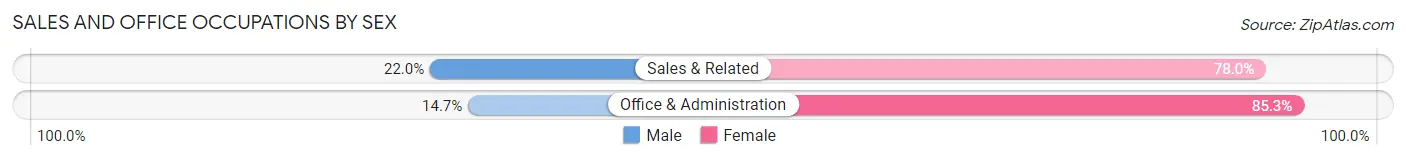
| Occupation | Male | Female |
| Sales & Related | 13 (22.0%) | 46 (78.0%) |
| Office & Administration | 5 (14.7%) | 29 (85.3%) |
| Total (Category) | 18 (19.4%) | 75 (80.6%) |
| Total (Overall) | 176 (46.3%) | 204 (53.7%) |
Natural Resources, Construction and Maintenance Occupations
The most common Natural Resources, Construction and Maintenance occupations in Henderson are Construction & Extraction (24 | 6.3%), Installation, Maintenance & Repair (17 | 4.5%), and Farming, Fishing & Forestry (4 | 1.1%).
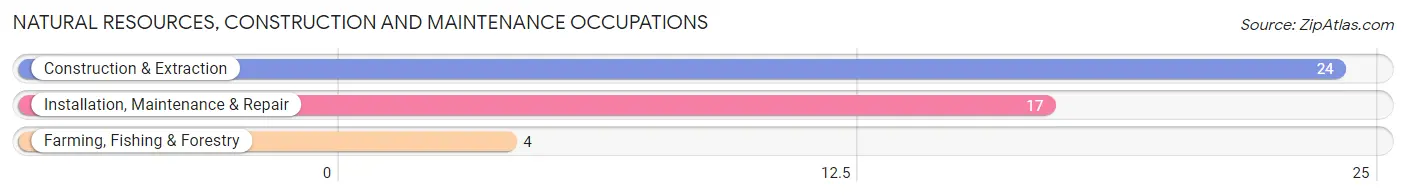
Natural Resources, Construction and Maintenance Occupations by Sex
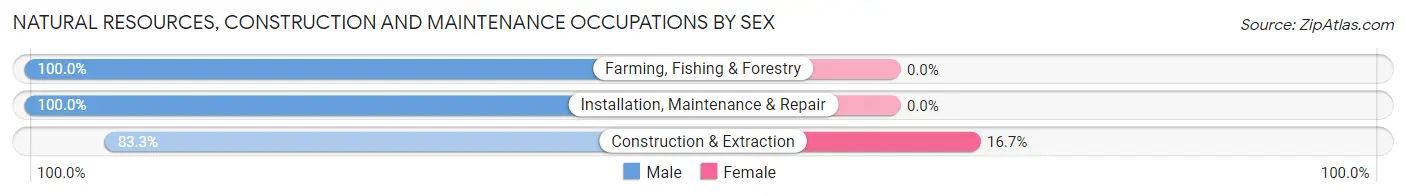
| Occupation | Male | Female |
| Farming, Fishing & Forestry | 4 (100.0%) | 0 (0.0%) |
| Construction & Extraction | 20 (83.3%) | 4 (16.7%) |
| Installation, Maintenance & Repair | 17 (100.0%) | 0 (0.0%) |
| Total (Category) | 41 (91.1%) | 4 (8.9%) |
| Total (Overall) | 176 (46.3%) | 204 (53.7%) |
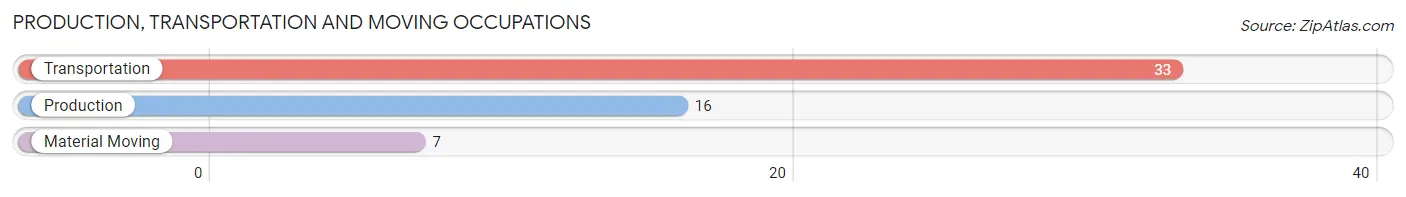
Production, Transportation and Moving Occupations
The most common Production, Transportation and Moving occupations in Henderson are Transportation (33 | 8.7%), Production (16 | 4.2%), and Material Moving (7 | 1.8%).
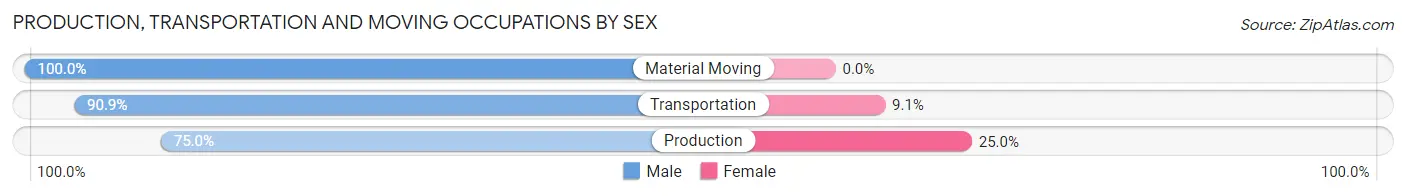
Production, Transportation and Moving Occupations by Sex
| Occupation | Male | Female |
| Production | 12 (75.0%) | 4 (25.0%) |
| Transportation | 30 (90.9%) | 3 (9.1%) |
| Material Moving | 7 (100.0%) | 0 (0.0%) |
| Total (Category) | 49 (87.5%) | 7 (12.5%) |
| Total (Overall) | 176 (46.3%) | 204 (53.7%) |
Employment Industries by Sex in Henderson
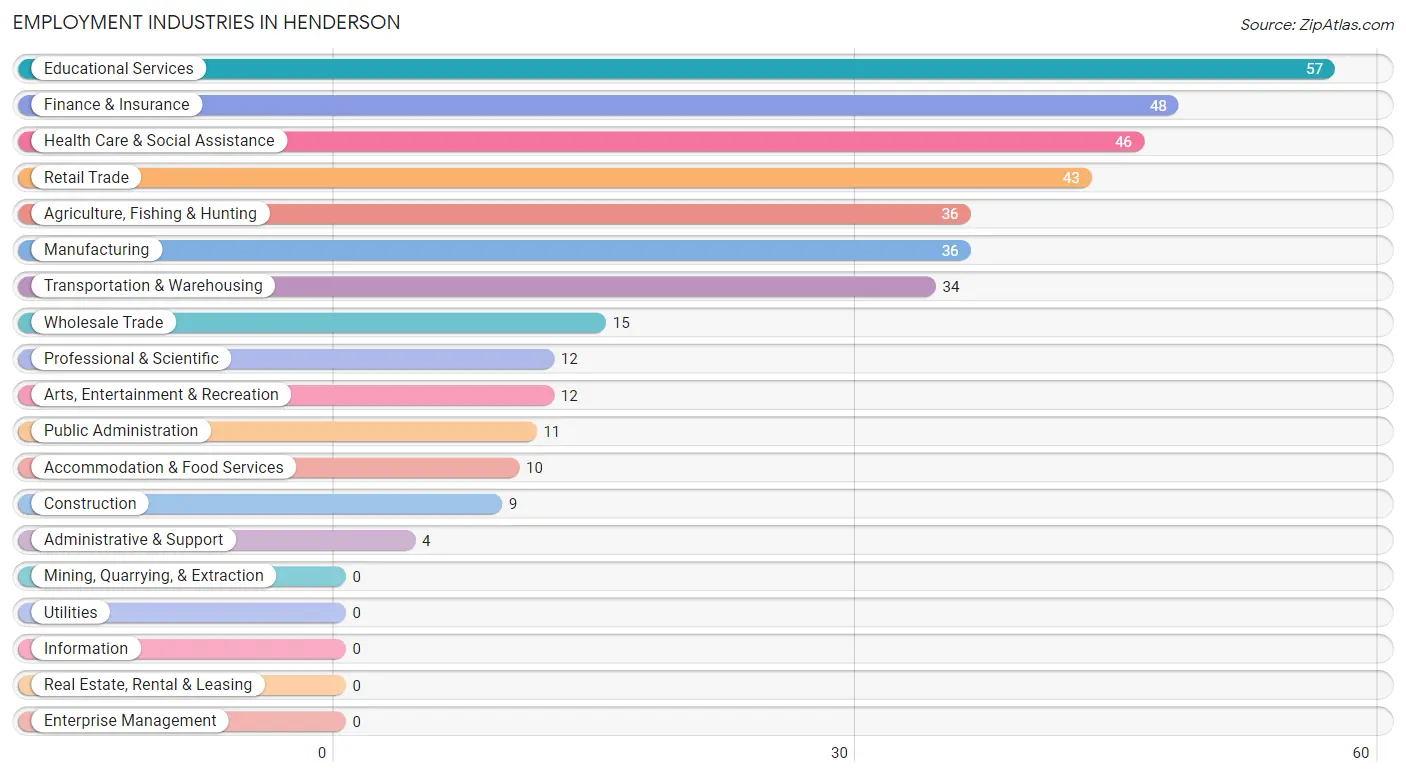
Employment Industries in Henderson
The major employment industries in Henderson include Educational Services (57 | 15.0%), Finance & Insurance (48 | 12.6%), Health Care & Social Assistance (46 | 12.1%), Retail Trade (43 | 11.3%), and Agriculture, Fishing & Hunting (36 | 9.5%).
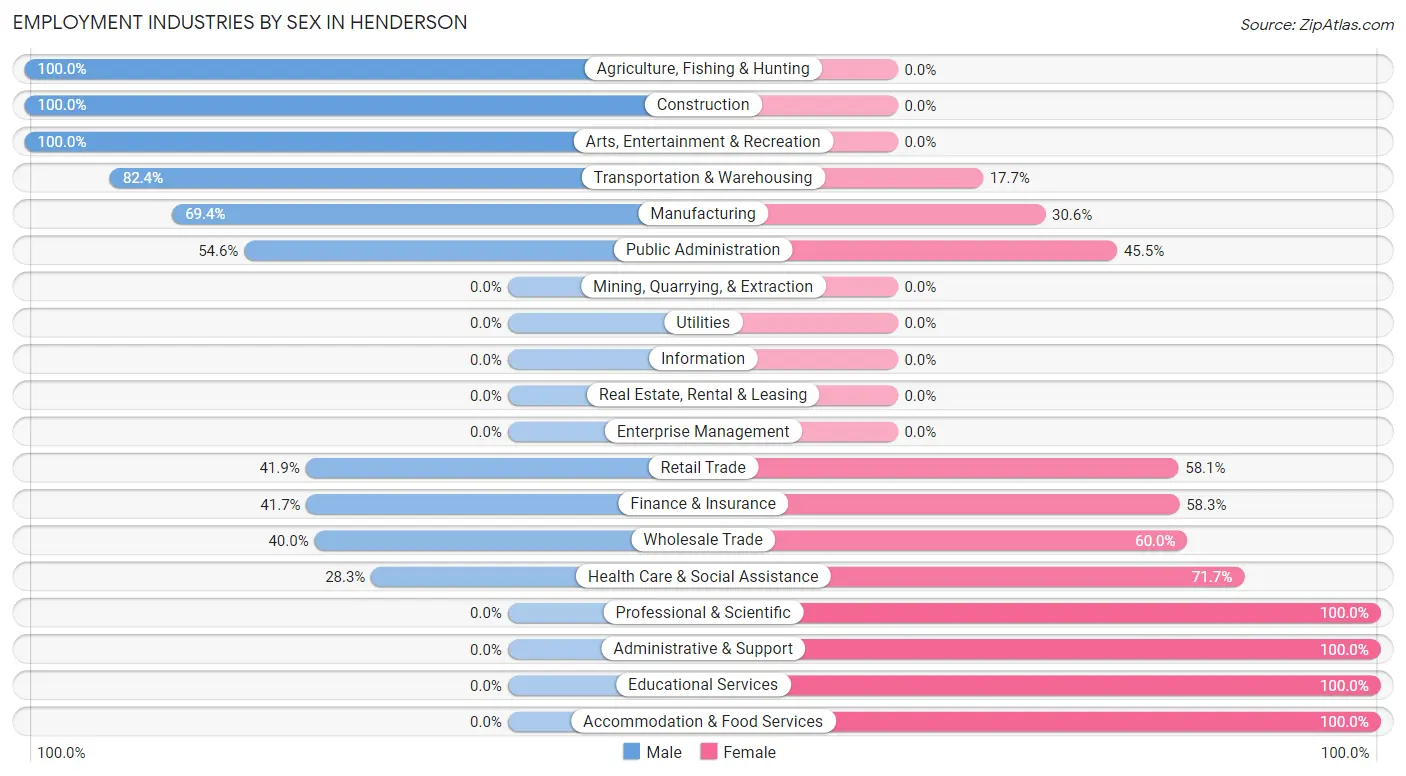
Employment Industries by Sex in Henderson
The Henderson industries that see more men than women are Agriculture, Fishing & Hunting (100.0%), Construction (100.0%), and Arts, Entertainment & Recreation (100.0%), whereas the industries that tend to have a higher number of women are Professional & Scientific (100.0%), Administrative & Support (100.0%), and Educational Services (100.0%).
| Industry | Male | Female |
| Agriculture, Fishing & Hunting | 36 (100.0%) | 0 (0.0%) |
| Mining, Quarrying, & Extraction | 0 (0.0%) | 0 (0.0%) |
| Construction | 9 (100.0%) | 0 (0.0%) |
| Manufacturing | 25 (69.4%) | 11 (30.6%) |
| Wholesale Trade | 6 (40.0%) | 9 (60.0%) |
| Retail Trade | 18 (41.9%) | 25 (58.1%) |
| Transportation & Warehousing | 28 (82.4%) | 6 (17.6%) |
| Utilities | 0 (0.0%) | 0 (0.0%) |
| Information | 0 (0.0%) | 0 (0.0%) |
| Finance & Insurance | 20 (41.7%) | 28 (58.3%) |
| Real Estate, Rental & Leasing | 0 (0.0%) | 0 (0.0%) |
| Professional & Scientific | 0 (0.0%) | 12 (100.0%) |
| Enterprise Management | 0 (0.0%) | 0 (0.0%) |
| Administrative & Support | 0 (0.0%) | 4 (100.0%) |
| Educational Services | 0 (0.0%) | 57 (100.0%) |
| Health Care & Social Assistance | 13 (28.3%) | 33 (71.7%) |
| Arts, Entertainment & Recreation | 12 (100.0%) | 0 (0.0%) |
| Accommodation & Food Services | 0 (0.0%) | 10 (100.0%) |
| Public Administration | 6 (54.5%) | 5 (45.5%) |
| Total | 176 (46.3%) | 204 (53.7%) |
Education in Henderson
School Enrollment in Henderson
The most common levels of schooling among the 177 students in Henderson are middle school (68 | 38.4%), high school (54 | 30.5%), and elementary school (21 | 11.9%).

| School Level | # Students | % Students |
| Nursery / Preschool | 20 | 11.3% |
| Kindergarten | 0 | 0.0% |
| Elementary School | 21 | 11.9% |
| Middle School | 68 | 38.4% |
| High School | 54 | 30.5% |
| College / Undergraduate | 14 | 7.9% |
| Graduate / Professional | 0 | 0.0% |
| Total | 177 | 100.0% |
School Enrollment by Age by Funding Source in Henderson
Out of a total of 177 students who are enrolled in schools in Henderson, 30 (16.9%) attend a private institution, while the remaining 147 (83.1%) are enrolled in public schools. The age group of 18 to 19 year olds has the highest likelihood of being enrolled in private schools, with 1 (100.0% in the age bracket) enrolled. Conversely, the age group of 15 to 17 year olds has the lowest likelihood of being enrolled in a private school, with 43 (100.0% in the age bracket) attending a public institution.
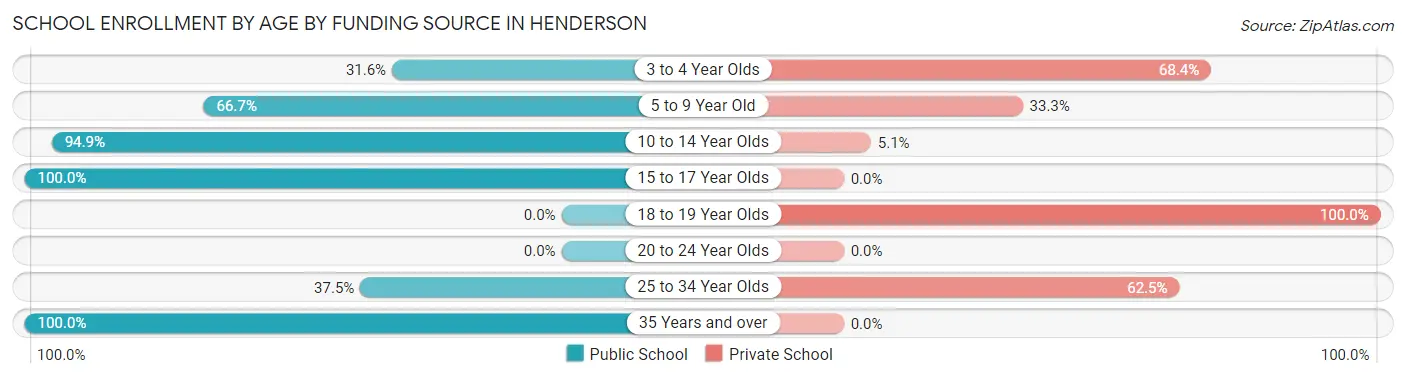
| Age Bracket | Public School | Private School |
| 3 to 4 Year Olds | 6 (31.6%) | 13 (68.4%) |
| 5 to 9 Year Old | 14 (66.7%) | 7 (33.3%) |
| 10 to 14 Year Olds | 75 (94.9%) | 4 (5.1%) |
| 15 to 17 Year Olds | 43 (100.0%) | 0 (0.0%) |
| 18 to 19 Year Olds | 0 (0.0%) | 1 (100.0%) |
| 20 to 24 Year Olds | 0 (0.0%) | 0 (0.0%) |
| 25 to 34 Year Olds | 3 (37.5%) | 5 (62.5%) |
| 35 Years and over | 6 (100.0%) | 0 (0.0%) |
| Total | 147 (83.1%) | 30 (16.9%) |
Educational Attainment by Field of Study in Henderson
Education (87 | 43.7%), business (42 | 21.1%), visual & performing arts (16 | 8.0%), bio, nature & agricultural (15 | 7.5%), and literature & languages (13 | 6.5%) are the most common fields of study among 199 individuals in Henderson who have obtained a bachelor's degree or higher.
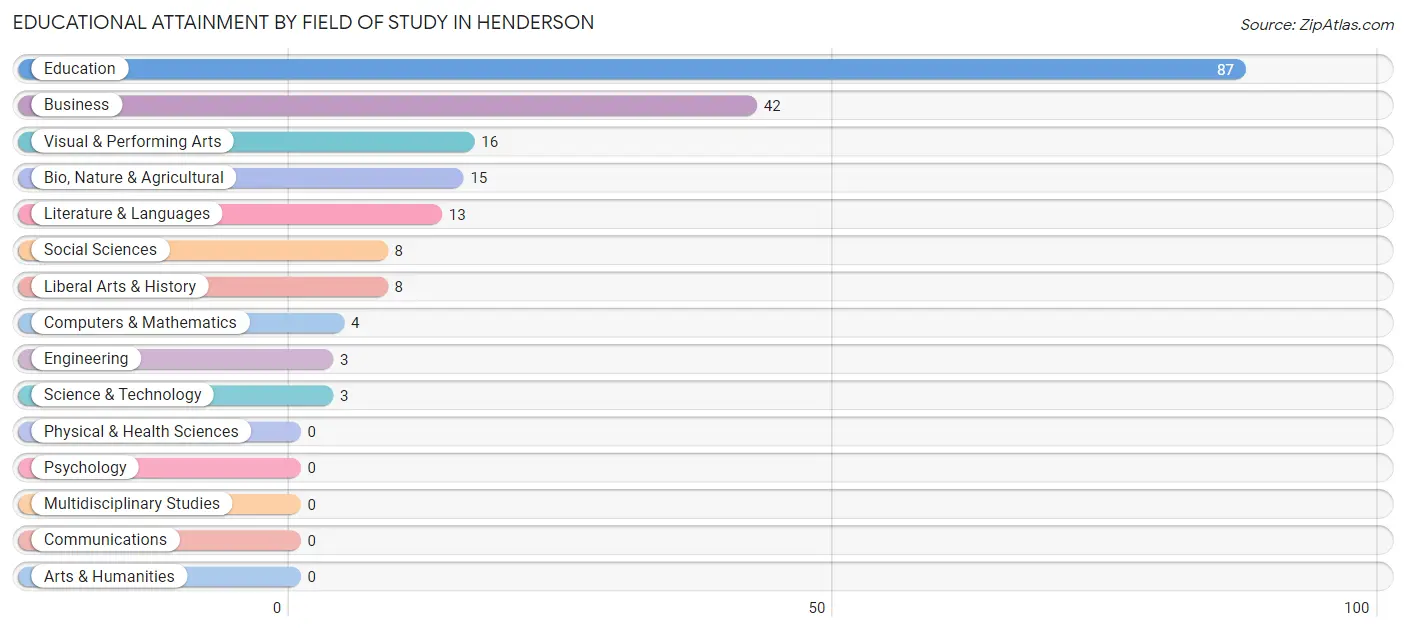
| Field of Study | # Graduates | % Graduates |
| Computers & Mathematics | 4 | 2.0% |
| Bio, Nature & Agricultural | 15 | 7.5% |
| Physical & Health Sciences | 0 | 0.0% |
| Psychology | 0 | 0.0% |
| Social Sciences | 8 | 4.0% |
| Engineering | 3 | 1.5% |
| Multidisciplinary Studies | 0 | 0.0% |
| Science & Technology | 3 | 1.5% |
| Business | 42 | 21.1% |
| Education | 87 | 43.7% |
| Literature & Languages | 13 | 6.5% |
| Liberal Arts & History | 8 | 4.0% |
| Visual & Performing Arts | 16 | 8.0% |
| Communications | 0 | 0.0% |
| Arts & Humanities | 0 | 0.0% |
| Total | 199 | 100.0% |
Transportation & Commute in Henderson
Vehicle Availability by Sex in Henderson
The most prevalent vehicle ownership categories in Henderson are males with 2 vehicles (96, accounting for 54.5%) and females with 2 vehicles (95, making up 48.0%).
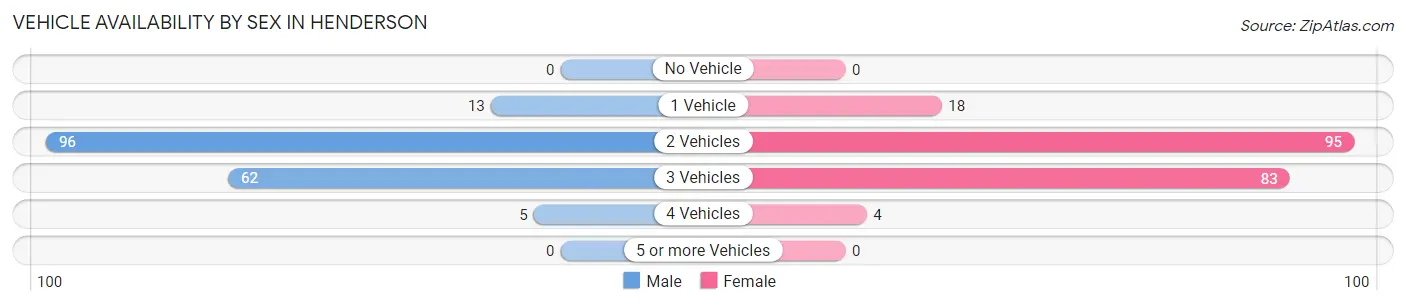
| Vehicles Available | Male | Female |
| No Vehicle | 0 (0.0%) | 0 (0.0%) |
| 1 Vehicle | 13 (7.4%) | 18 (9.0%) |
| 2 Vehicles | 96 (54.5%) | 95 (47.5%) |
| 3 Vehicles | 62 (35.2%) | 83 (41.5%) |
| 4 Vehicles | 5 (2.8%) | 4 (2.0%) |
| 5 or more Vehicles | 0 (0.0%) | 0 (0.0%) |
| Total | 176 (100.0%) | 200 (100.0%) |
Commute Time in Henderson
The most frequently occuring commute durations in Henderson are less than 5 minutes (147 commuters, 42.1%), 5 to 9 minutes (66 commuters, 18.9%), and 20 to 24 minutes (66 commuters, 18.9%).
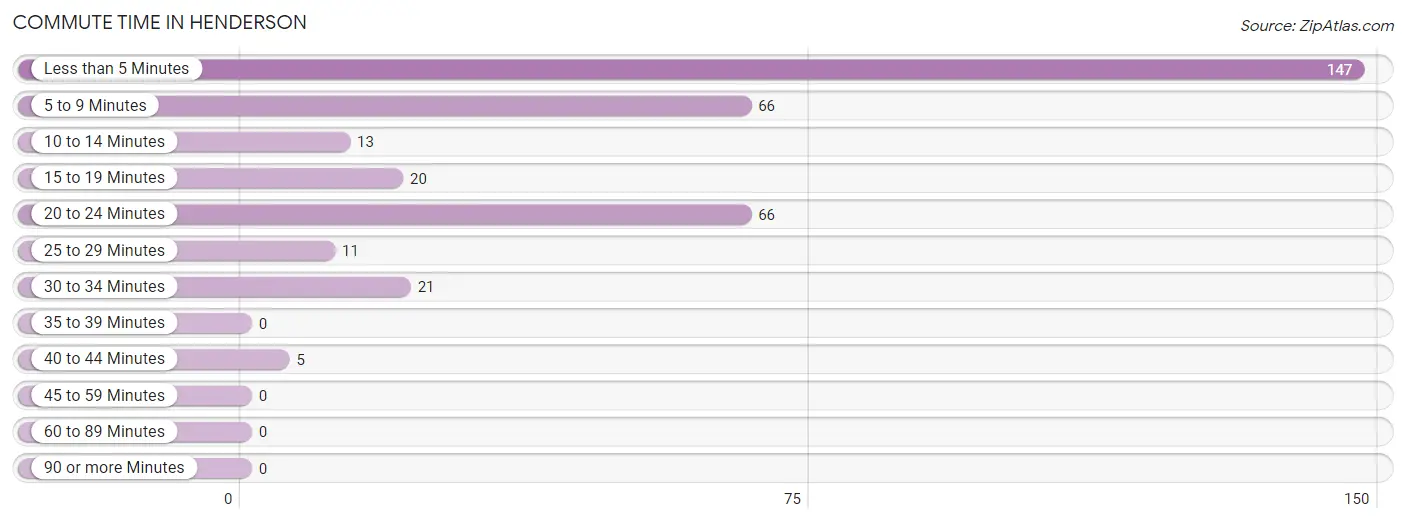
| Commute Time | # Commuters | % Commuters |
| Less than 5 Minutes | 147 | 42.1% |
| 5 to 9 Minutes | 66 | 18.9% |
| 10 to 14 Minutes | 13 | 3.7% |
| 15 to 19 Minutes | 20 | 5.7% |
| 20 to 24 Minutes | 66 | 18.9% |
| 25 to 29 Minutes | 11 | 3.2% |
| 30 to 34 Minutes | 21 | 6.0% |
| 35 to 39 Minutes | 0 | 0.0% |
| 40 to 44 Minutes | 5 | 1.4% |
| 45 to 59 Minutes | 0 | 0.0% |
| 60 to 89 Minutes | 0 | 0.0% |
| 90 or more Minutes | 0 | 0.0% |
Commute Time by Sex in Henderson
The most common commute times in Henderson are less than 5 minutes (74 commuters, 42.8%) for males and less than 5 minutes (73 commuters, 41.5%) for females.
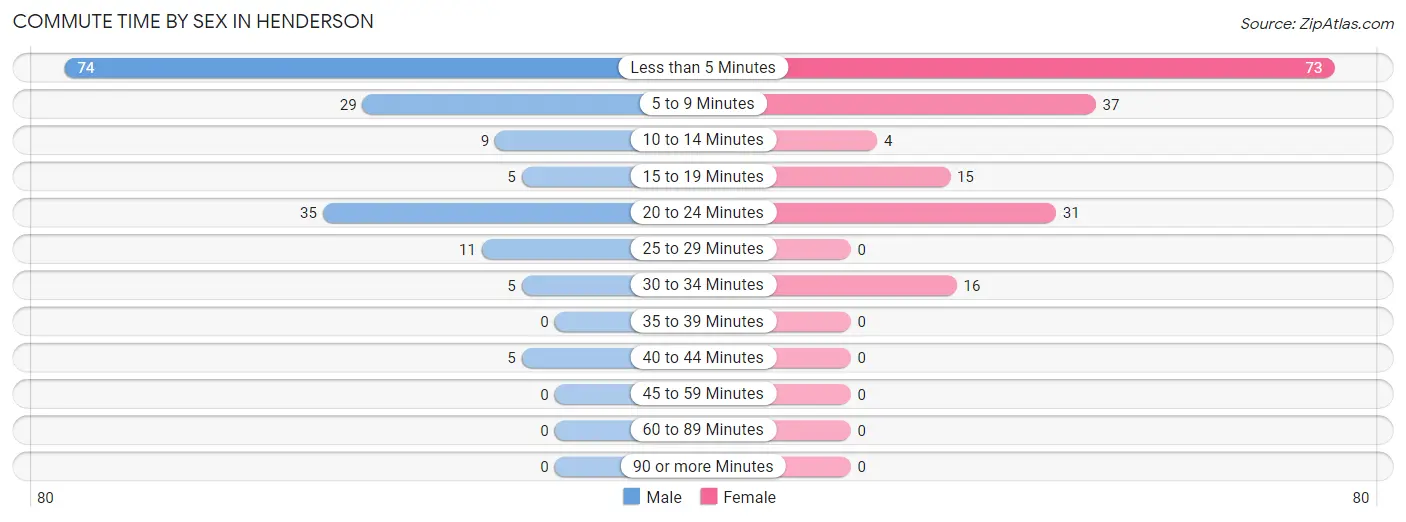
| Commute Time | Male | Female |
| Less than 5 Minutes | 74 (42.8%) | 73 (41.5%) |
| 5 to 9 Minutes | 29 (16.8%) | 37 (21.0%) |
| 10 to 14 Minutes | 9 (5.2%) | 4 (2.3%) |
| 15 to 19 Minutes | 5 (2.9%) | 15 (8.5%) |
| 20 to 24 Minutes | 35 (20.2%) | 31 (17.6%) |
| 25 to 29 Minutes | 11 (6.4%) | 0 (0.0%) |
| 30 to 34 Minutes | 5 (2.9%) | 16 (9.1%) |
| 35 to 39 Minutes | 0 (0.0%) | 0 (0.0%) |
| 40 to 44 Minutes | 5 (2.9%) | 0 (0.0%) |
| 45 to 59 Minutes | 0 (0.0%) | 0 (0.0%) |
| 60 to 89 Minutes | 0 (0.0%) | 0 (0.0%) |
| 90 or more Minutes | 0 (0.0%) | 0 (0.0%) |
Time of Departure to Work by Sex in Henderson
The most frequent times of departure to work in Henderson are 7:30 AM to 7:59 AM (56, 32.4%) for males and 7:30 AM to 7:59 AM (70, 39.8%) for females.
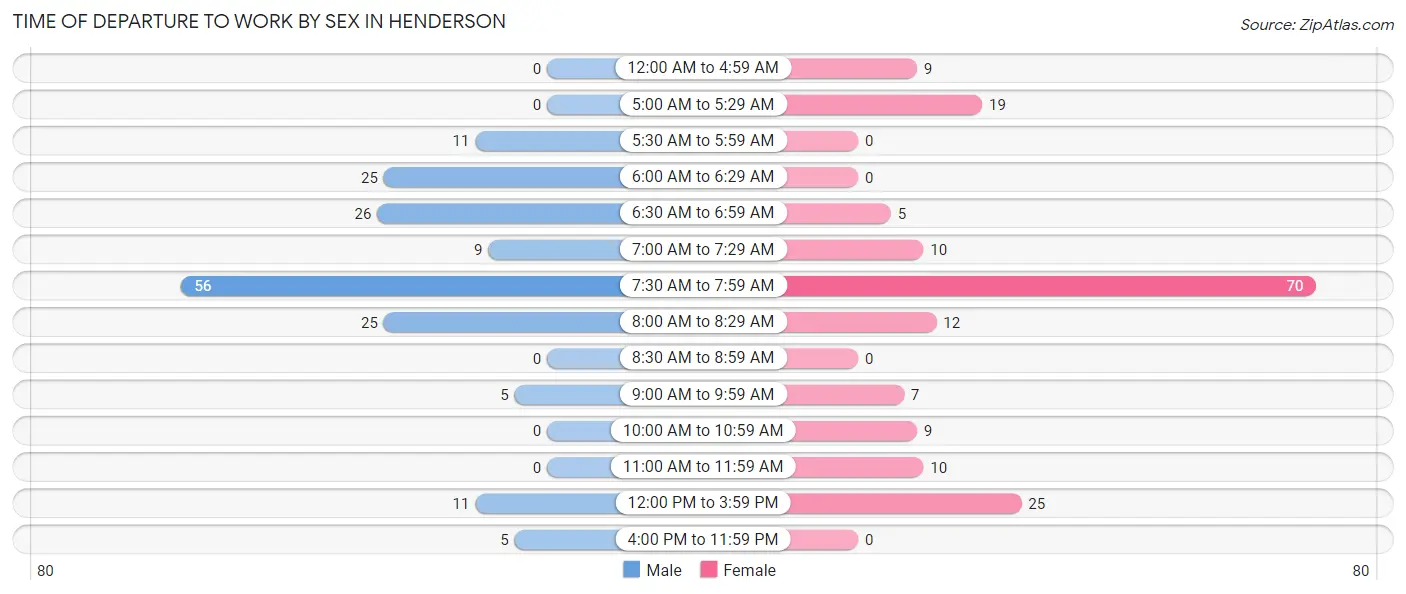
| Time of Departure | Male | Female |
| 12:00 AM to 4:59 AM | 0 (0.0%) | 9 (5.1%) |
| 5:00 AM to 5:29 AM | 0 (0.0%) | 19 (10.8%) |
| 5:30 AM to 5:59 AM | 11 (6.4%) | 0 (0.0%) |
| 6:00 AM to 6:29 AM | 25 (14.4%) | 0 (0.0%) |
| 6:30 AM to 6:59 AM | 26 (15.0%) | 5 (2.8%) |
| 7:00 AM to 7:29 AM | 9 (5.2%) | 10 (5.7%) |
| 7:30 AM to 7:59 AM | 56 (32.4%) | 70 (39.8%) |
| 8:00 AM to 8:29 AM | 25 (14.4%) | 12 (6.8%) |
| 8:30 AM to 8:59 AM | 0 (0.0%) | 0 (0.0%) |
| 9:00 AM to 9:59 AM | 5 (2.9%) | 7 (4.0%) |
| 10:00 AM to 10:59 AM | 0 (0.0%) | 9 (5.1%) |
| 11:00 AM to 11:59 AM | 0 (0.0%) | 10 (5.7%) |
| 12:00 PM to 3:59 PM | 11 (6.4%) | 25 (14.2%) |
| 4:00 PM to 11:59 PM | 5 (2.9%) | 0 (0.0%) |
| Total | 173 (100.0%) | 176 (100.0%) |
Housing Occupancy in Henderson
Occupancy by Ownership in Henderson
Of the total 381 dwellings in Henderson, owner-occupied units account for 343 (90.0%), while renter-occupied units make up 38 (10.0%).
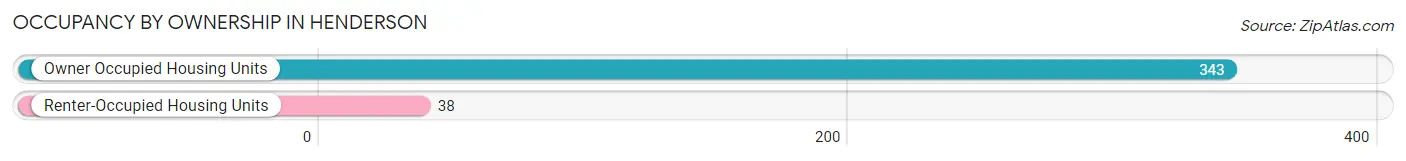
| Occupancy | # Housing Units | % Housing Units |
| Owner Occupied Housing Units | 343 | 90.0% |
| Renter-Occupied Housing Units | 38 | 10.0% |
| Total Occupied Housing Units | 381 | 100.0% |
Occupancy by Household Size in Henderson
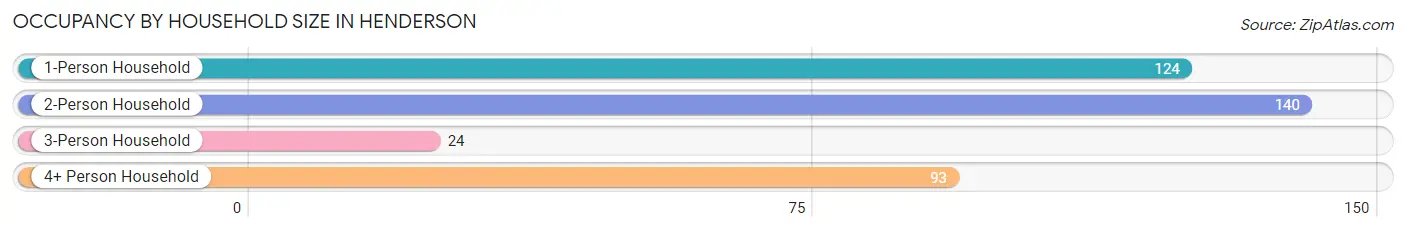
| Household Size | # Housing Units | % Housing Units |
| 1-Person Household | 124 | 32.6% |
| 2-Person Household | 140 | 36.7% |
| 3-Person Household | 24 | 6.3% |
| 4+ Person Household | 93 | 24.4% |
| Total Housing Units | 381 | 100.0% |
Occupancy by Ownership by Household Size in Henderson
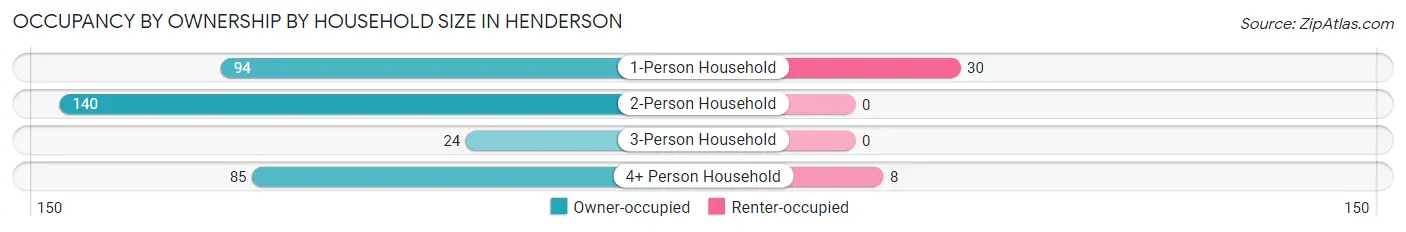
| Household Size | Owner-occupied | Renter-occupied |
| 1-Person Household | 94 (75.8%) | 30 (24.2%) |
| 2-Person Household | 140 (100.0%) | 0 (0.0%) |
| 3-Person Household | 24 (100.0%) | 0 (0.0%) |
| 4+ Person Household | 85 (91.4%) | 8 (8.6%) |
| Total Housing Units | 343 (90.0%) | 38 (10.0%) |
Occupancy by Educational Attainment in Henderson
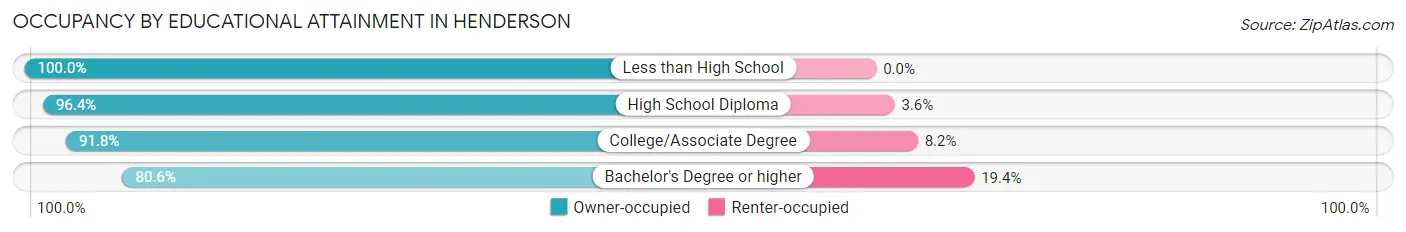
| Household Size | Owner-occupied | Renter-occupied |
| Less than High School | 5 (100.0%) | 0 (0.0%) |
| High School Diploma | 106 (96.4%) | 4 (3.6%) |
| College/Associate Degree | 145 (91.8%) | 13 (8.2%) |
| Bachelor's Degree or higher | 87 (80.6%) | 21 (19.4%) |
Occupancy by Age of Householder in Henderson
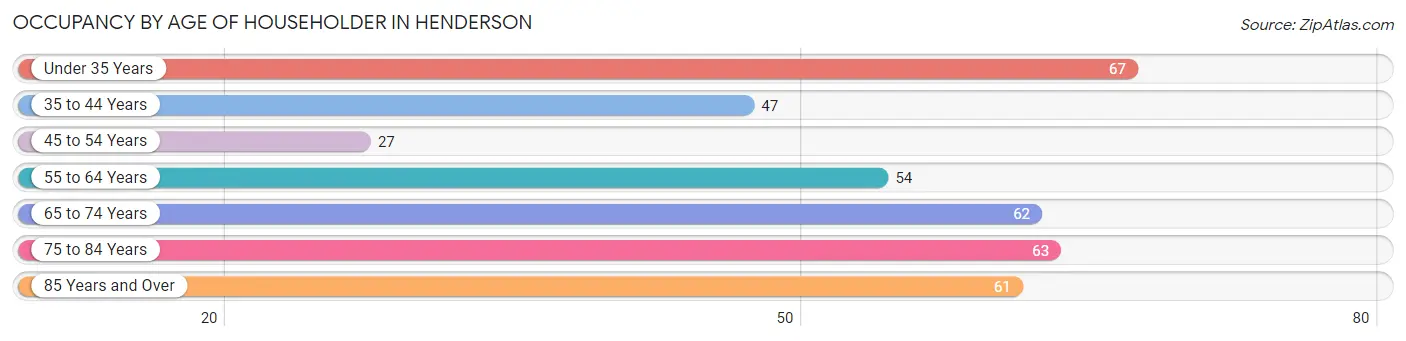
| Age Bracket | # Households | % Households |
| Under 35 Years | 67 | 17.6% |
| 35 to 44 Years | 47 | 12.3% |
| 45 to 54 Years | 27 | 7.1% |
| 55 to 64 Years | 54 | 14.2% |
| 65 to 74 Years | 62 | 16.3% |
| 75 to 84 Years | 63 | 16.5% |
| 85 Years and Over | 61 | 16.0% |
| Total | 381 | 100.0% |
Housing Finances in Henderson
Median Income by Occupancy in Henderson
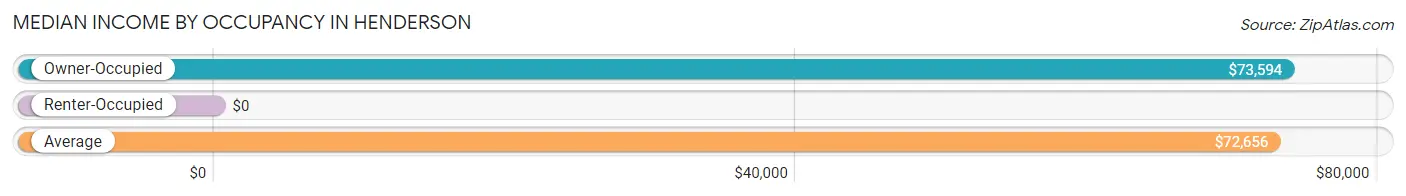
| Occupancy Type | # Households | Median Income |
| Owner-Occupied | 343 (90.0%) | $73,594 |
| Renter-Occupied | 38 (10.0%) | $0 |
| Average | 381 (100.0%) | $72,656 |
Occupancy by Householder Income Bracket in Henderson
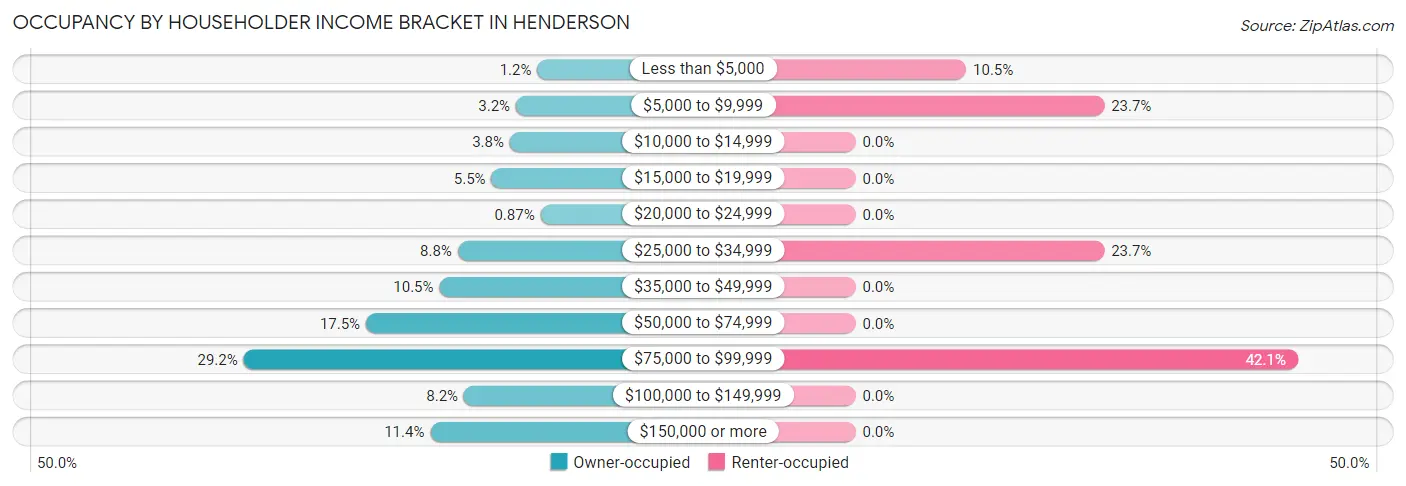
| Income Bracket | Owner-occupied | Renter-occupied |
| Less than $5,000 | 4 (1.2%) | 4 (10.5%) |
| $5,000 to $9,999 | 11 (3.2%) | 9 (23.7%) |
| $10,000 to $14,999 | 13 (3.8%) | 0 (0.0%) |
| $15,000 to $19,999 | 19 (5.5%) | 0 (0.0%) |
| $20,000 to $24,999 | 3 (0.9%) | 0 (0.0%) |
| $25,000 to $34,999 | 30 (8.7%) | 9 (23.7%) |
| $35,000 to $49,999 | 36 (10.5%) | 0 (0.0%) |
| $50,000 to $74,999 | 60 (17.5%) | 0 (0.0%) |
| $75,000 to $99,999 | 100 (29.1%) | 16 (42.1%) |
| $100,000 to $149,999 | 28 (8.2%) | 0 (0.0%) |
| $150,000 or more | 39 (11.4%) | 0 (0.0%) |
| Total | 343 (100.0%) | 38 (100.0%) |
Monthly Housing Cost Tiers in Henderson
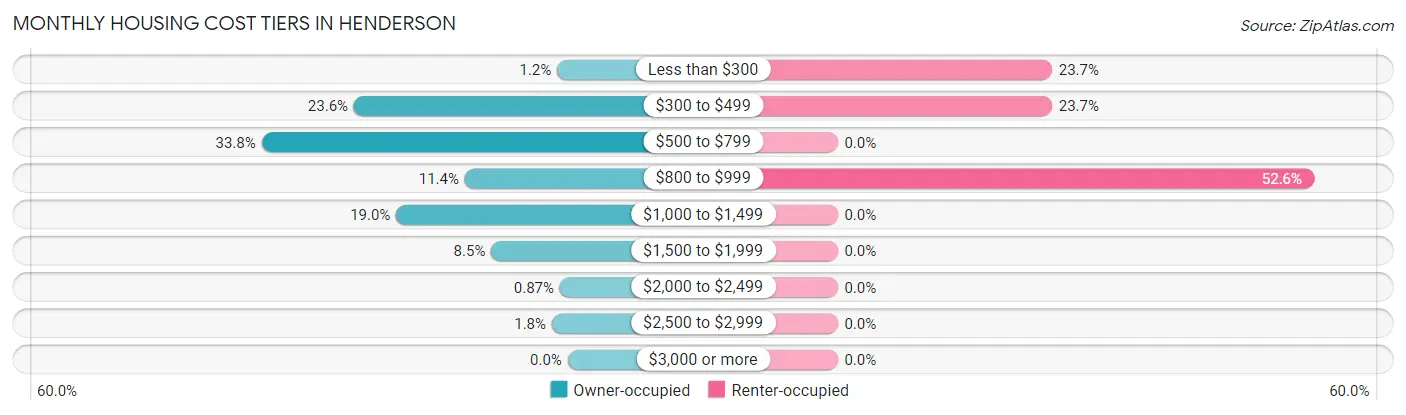
| Monthly Cost | Owner-occupied | Renter-occupied |
| Less than $300 | 4 (1.2%) | 9 (23.7%) |
| $300 to $499 | 81 (23.6%) | 9 (23.7%) |
| $500 to $799 | 116 (33.8%) | 0 (0.0%) |
| $800 to $999 | 39 (11.4%) | 20 (52.6%) |
| $1,000 to $1,499 | 65 (19.0%) | 0 (0.0%) |
| $1,500 to $1,999 | 29 (8.5%) | 0 (0.0%) |
| $2,000 to $2,499 | 3 (0.9%) | 0 (0.0%) |
| $2,500 to $2,999 | 6 (1.8%) | 0 (0.0%) |
| $3,000 or more | 0 (0.0%) | 0 (0.0%) |
| Total | 343 (100.0%) | 38 (100.0%) |
Physical Housing Characteristics in Henderson
Housing Structures in Henderson
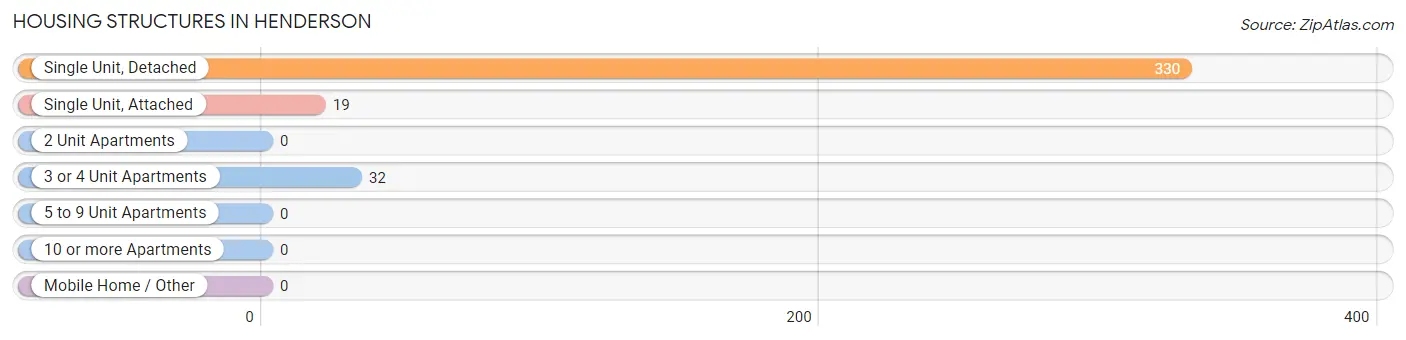
| Structure Type | # Housing Units | % Housing Units |
| Single Unit, Detached | 330 | 86.6% |
| Single Unit, Attached | 19 | 5.0% |
| 2 Unit Apartments | 0 | 0.0% |
| 3 or 4 Unit Apartments | 32 | 8.4% |
| 5 to 9 Unit Apartments | 0 | 0.0% |
| 10 or more Apartments | 0 | 0.0% |
| Mobile Home / Other | 0 | 0.0% |
| Total | 381 | 100.0% |
Housing Structures by Occupancy in Henderson
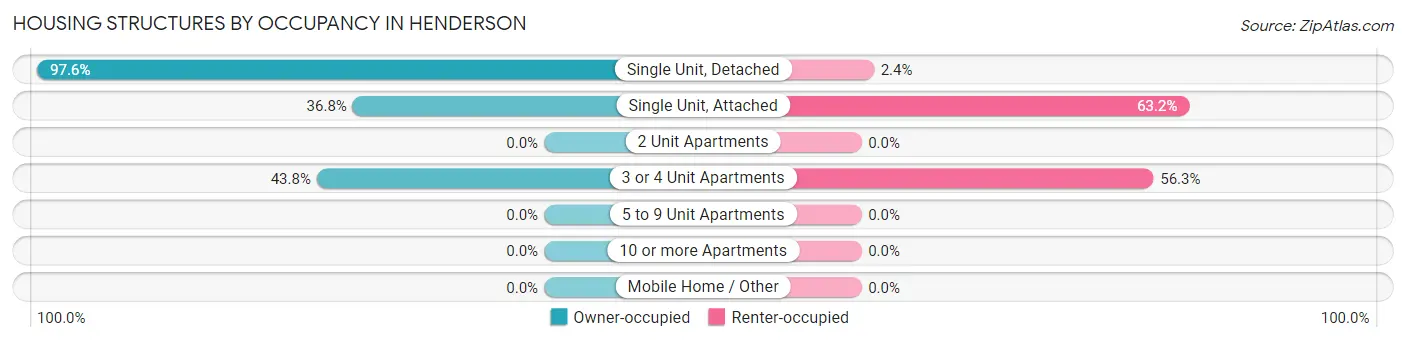
| Structure Type | Owner-occupied | Renter-occupied |
| Single Unit, Detached | 322 (97.6%) | 8 (2.4%) |
| Single Unit, Attached | 7 (36.8%) | 12 (63.2%) |
| 2 Unit Apartments | 0 (0.0%) | 0 (0.0%) |
| 3 or 4 Unit Apartments | 14 (43.8%) | 18 (56.2%) |
| 5 to 9 Unit Apartments | 0 (0.0%) | 0 (0.0%) |
| 10 or more Apartments | 0 (0.0%) | 0 (0.0%) |
| Mobile Home / Other | 0 (0.0%) | 0 (0.0%) |
| Total | 343 (90.0%) | 38 (10.0%) |
Housing Structures by Number of Rooms in Henderson
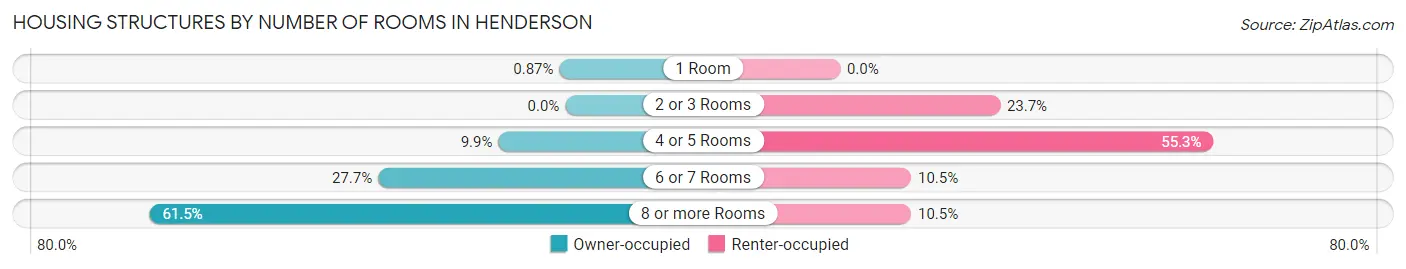
| Number of Rooms | Owner-occupied | Renter-occupied |
| 1 Room | 3 (0.9%) | 0 (0.0%) |
| 2 or 3 Rooms | 0 (0.0%) | 9 (23.7%) |
| 4 or 5 Rooms | 34 (9.9%) | 21 (55.3%) |
| 6 or 7 Rooms | 95 (27.7%) | 4 (10.5%) |
| 8 or more Rooms | 211 (61.5%) | 4 (10.5%) |
| Total | 343 (100.0%) | 38 (100.0%) |
Housing Structure by Heating Type in Henderson
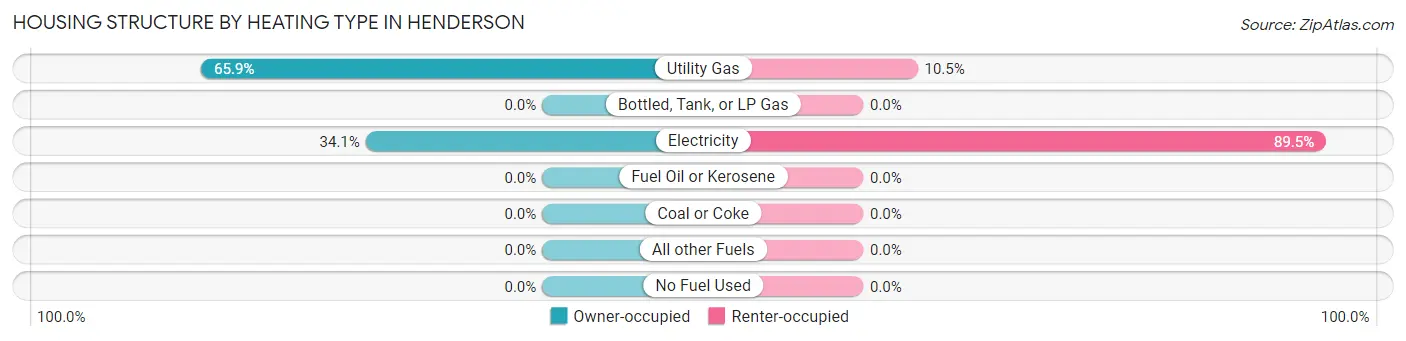
| Heating Type | Owner-occupied | Renter-occupied |
| Utility Gas | 226 (65.9%) | 4 (10.5%) |
| Bottled, Tank, or LP Gas | 0 (0.0%) | 0 (0.0%) |
| Electricity | 117 (34.1%) | 34 (89.5%) |
| Fuel Oil or Kerosene | 0 (0.0%) | 0 (0.0%) |
| Coal or Coke | 0 (0.0%) | 0 (0.0%) |
| All other Fuels | 0 (0.0%) | 0 (0.0%) |
| No Fuel Used | 0 (0.0%) | 0 (0.0%) |
| Total | 343 (100.0%) | 38 (100.0%) |
Household Vehicle Usage in Henderson
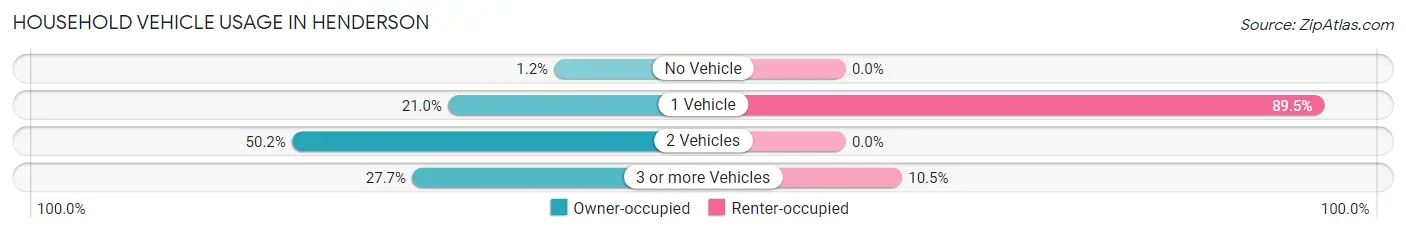
| Vehicles per Household | Owner-occupied | Renter-occupied |
| No Vehicle | 4 (1.2%) | 0 (0.0%) |
| 1 Vehicle | 72 (21.0%) | 34 (89.5%) |
| 2 Vehicles | 172 (50.1%) | 0 (0.0%) |
| 3 or more Vehicles | 95 (27.7%) | 4 (10.5%) |
| Total | 343 (100.0%) | 38 (100.0%) |
Real Estate & Mortgages in Henderson
Real Estate and Mortgage Overview in Henderson
| Characteristic | Without Mortgage | With Mortgage |
| Housing Units | 194 | 149 |
| Median Property Value | $136,100 | $142,000 |
| Median Household Income | $48,611 | $32 |
| Monthly Housing Costs | $515 | $0 |
| Real Estate Taxes | $1,593 | $0 |
Property Value by Mortgage Status in Henderson
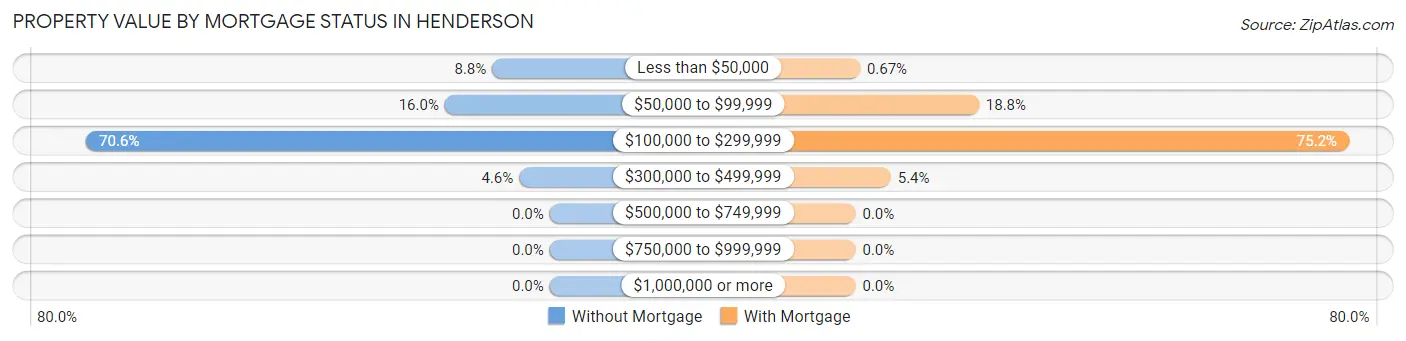
| Property Value | Without Mortgage | With Mortgage |
| Less than $50,000 | 17 (8.8%) | 1 (0.7%) |
| $50,000 to $99,999 | 31 (16.0%) | 28 (18.8%) |
| $100,000 to $299,999 | 137 (70.6%) | 112 (75.2%) |
| $300,000 to $499,999 | 9 (4.6%) | 8 (5.4%) |
| $500,000 to $749,999 | 0 (0.0%) | 0 (0.0%) |
| $750,000 to $999,999 | 0 (0.0%) | 0 (0.0%) |
| $1,000,000 or more | 0 (0.0%) | 0 (0.0%) |
| Total | 194 (100.0%) | 149 (100.0%) |
Household Income by Mortgage Status in Henderson
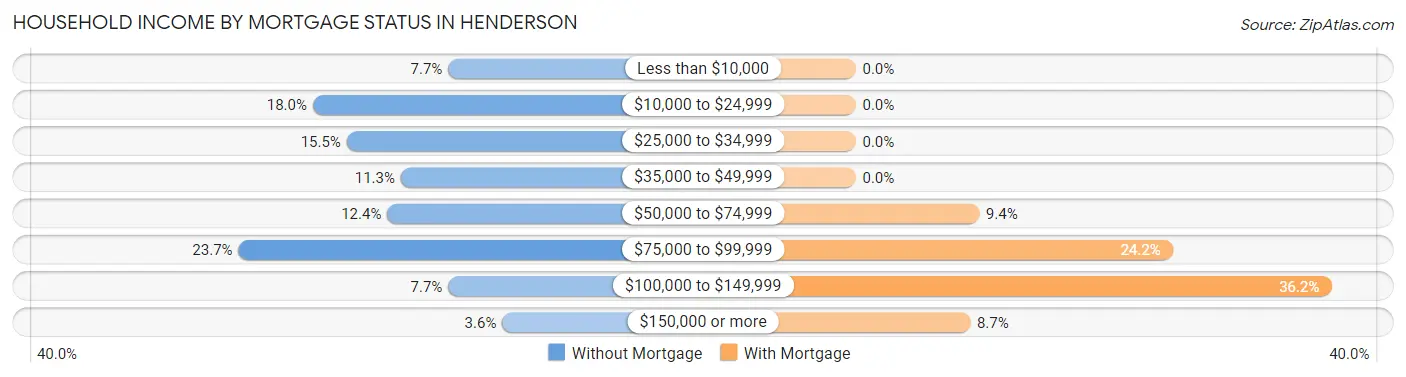
| Household Income | Without Mortgage | With Mortgage |
| Less than $10,000 | 15 (7.7%) | 0 (0.0%) |
| $10,000 to $24,999 | 35 (18.0%) | 0 (0.0%) |
| $25,000 to $34,999 | 30 (15.5%) | 0 (0.0%) |
| $35,000 to $49,999 | 22 (11.3%) | 0 (0.0%) |
| $50,000 to $74,999 | 24 (12.4%) | 14 (9.4%) |
| $75,000 to $99,999 | 46 (23.7%) | 36 (24.2%) |
| $100,000 to $149,999 | 15 (7.7%) | 54 (36.2%) |
| $150,000 or more | 7 (3.6%) | 13 (8.7%) |
| Total | 194 (100.0%) | 149 (100.0%) |
Property Value to Household Income Ratio in Henderson
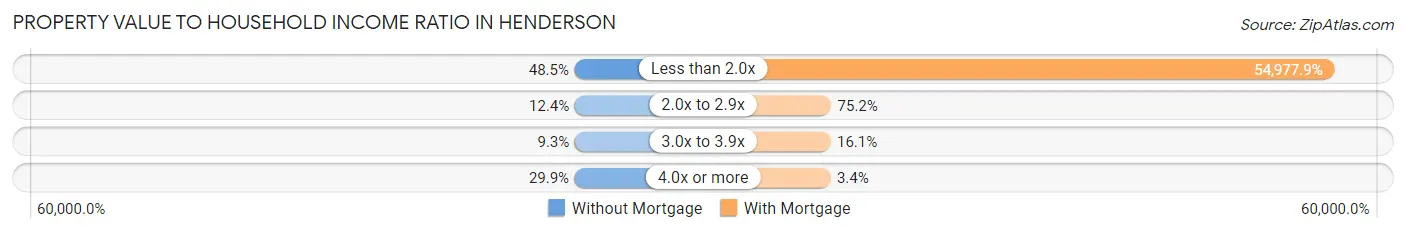
| Value-to-Income Ratio | Without Mortgage | With Mortgage |
| Less than 2.0x | 94 (48.4%) | 81,917 (54,977.9%) |
| 2.0x to 2.9x | 24 (12.4%) | 112 (75.2%) |
| 3.0x to 3.9x | 18 (9.3%) | 24 (16.1%) |
| 4.0x or more | 58 (29.9%) | 5 (3.4%) |
| Total | 194 (100.0%) | 149 (100.0%) |
Real Estate Taxes by Mortgage Status in Henderson
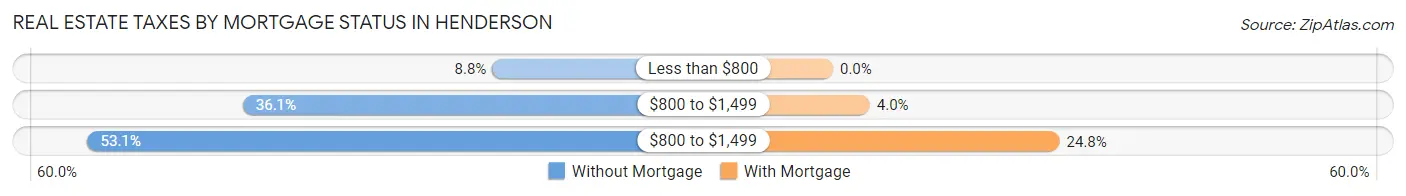
| Property Taxes | Without Mortgage | With Mortgage |
| Less than $800 | 17 (8.8%) | 0 (0.0%) |
| $800 to $1,499 | 70 (36.1%) | 6 (4.0%) |
| $800 to $1,499 | 103 (53.1%) | 37 (24.8%) |
| Total | 194 (100.0%) | 149 (100.0%) |
Health & Disability in Henderson
Health Insurance Coverage by Age in Henderson
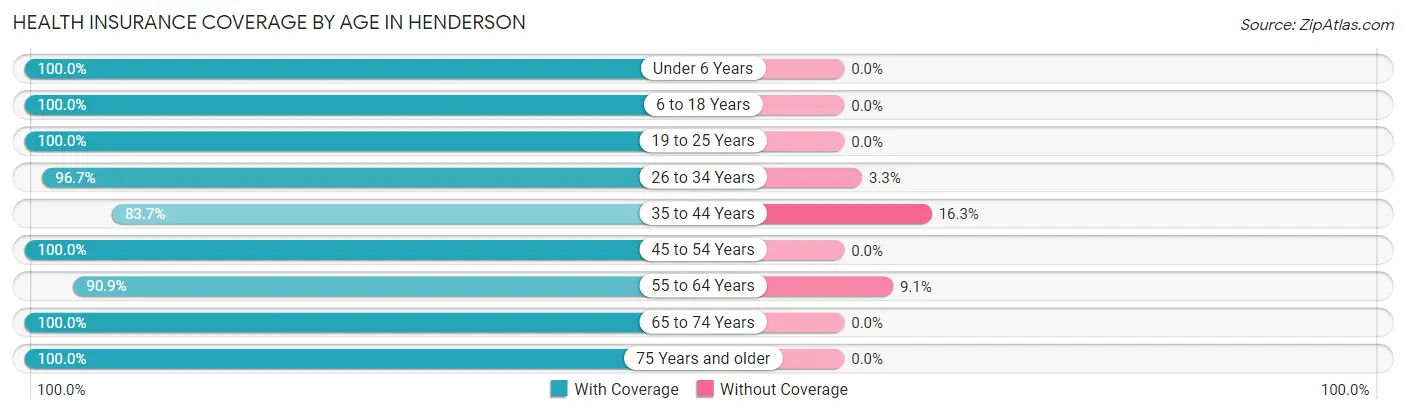
| Age Bracket | With Coverage | Without Coverage |
| Under 6 Years | 123 (100.0%) | 0 (0.0%) |
| 6 to 18 Years | 142 (100.0%) | 0 (0.0%) |
| 19 to 25 Years | 23 (100.0%) | 0 (0.0%) |
| 26 to 34 Years | 117 (96.7%) | 4 (3.3%) |
| 35 to 44 Years | 77 (83.7%) | 15 (16.3%) |
| 45 to 54 Years | 45 (100.0%) | 0 (0.0%) |
| 55 to 64 Years | 80 (90.9%) | 8 (9.1%) |
| 65 to 74 Years | 118 (100.0%) | 0 (0.0%) |
| 75 Years and older | 168 (100.0%) | 0 (0.0%) |
| Total | 893 (97.1%) | 27 (2.9%) |
Health Insurance Coverage by Citizenship Status in Henderson
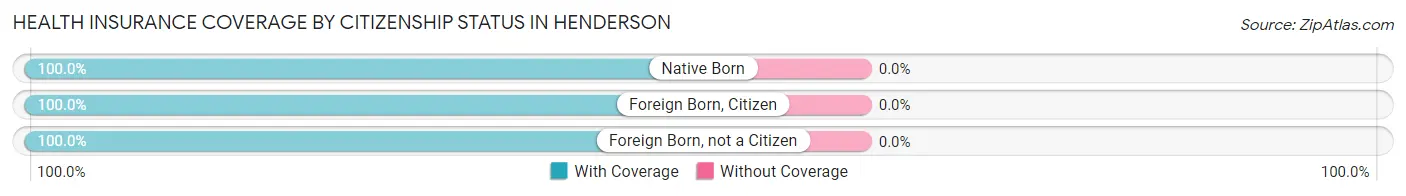
| Citizenship Status | With Coverage | Without Coverage |
| Native Born | 123 (100.0%) | 0 (0.0%) |
| Foreign Born, Citizen | 142 (100.0%) | 0 (0.0%) |
| Foreign Born, not a Citizen | 23 (100.0%) | 0 (0.0%) |
Health Insurance Coverage by Household Income in Henderson
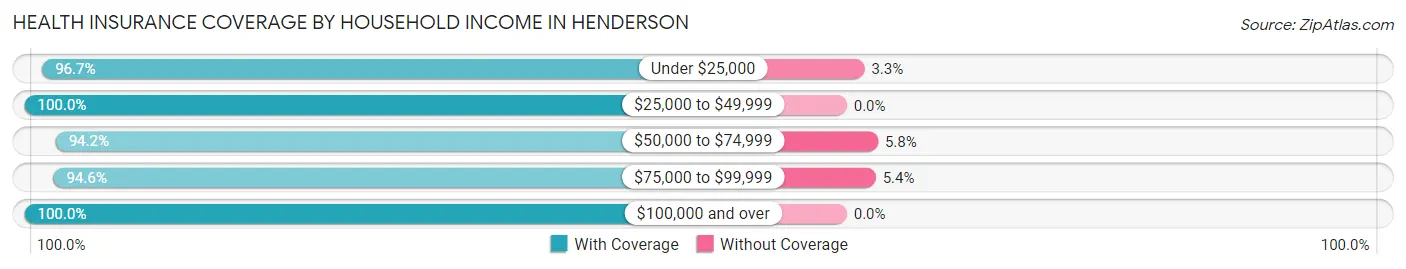
| Household Income | With Coverage | Without Coverage |
| Under $25,000 | 117 (96.7%) | 4 (3.3%) |
| $25,000 to $49,999 | 134 (100.0%) | 0 (0.0%) |
| $50,000 to $74,999 | 129 (94.2%) | 8 (5.8%) |
| $75,000 to $99,999 | 262 (94.6%) | 15 (5.4%) |
| $100,000 and over | 251 (100.0%) | 0 (0.0%) |
Public vs Private Health Insurance Coverage by Age in Henderson
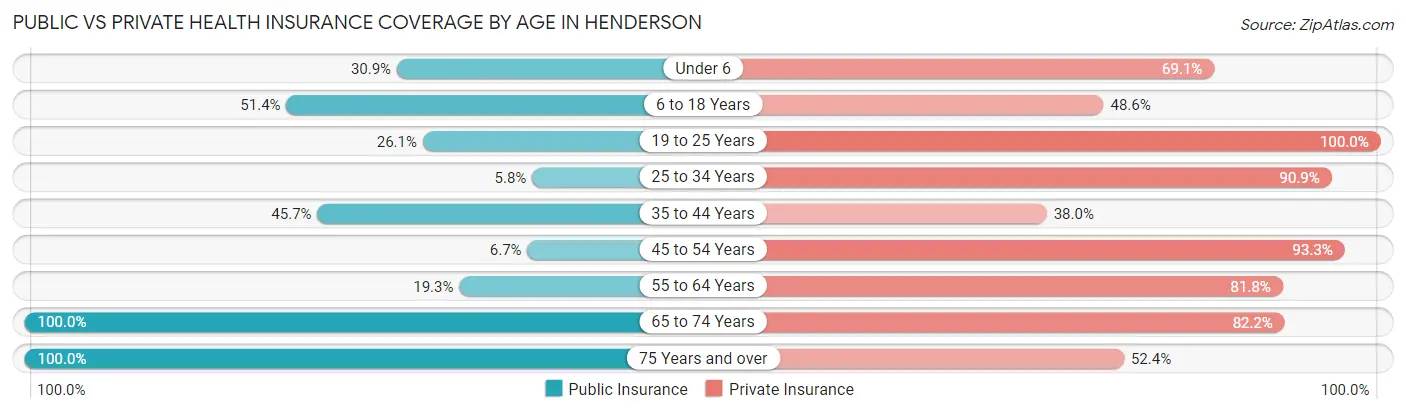
| Age Bracket | Public Insurance | Private Insurance |
| Under 6 | 38 (30.9%) | 85 (69.1%) |
| 6 to 18 Years | 73 (51.4%) | 69 (48.6%) |
| 19 to 25 Years | 6 (26.1%) | 23 (100.0%) |
| 25 to 34 Years | 7 (5.8%) | 110 (90.9%) |
| 35 to 44 Years | 42 (45.7%) | 35 (38.0%) |
| 45 to 54 Years | 3 (6.7%) | 42 (93.3%) |
| 55 to 64 Years | 17 (19.3%) | 72 (81.8%) |
| 65 to 74 Years | 118 (100.0%) | 97 (82.2%) |
| 75 Years and over | 168 (100.0%) | 88 (52.4%) |
| Total | 472 (51.3%) | 621 (67.5%) |
Disability Status by Sex by Age in Henderson
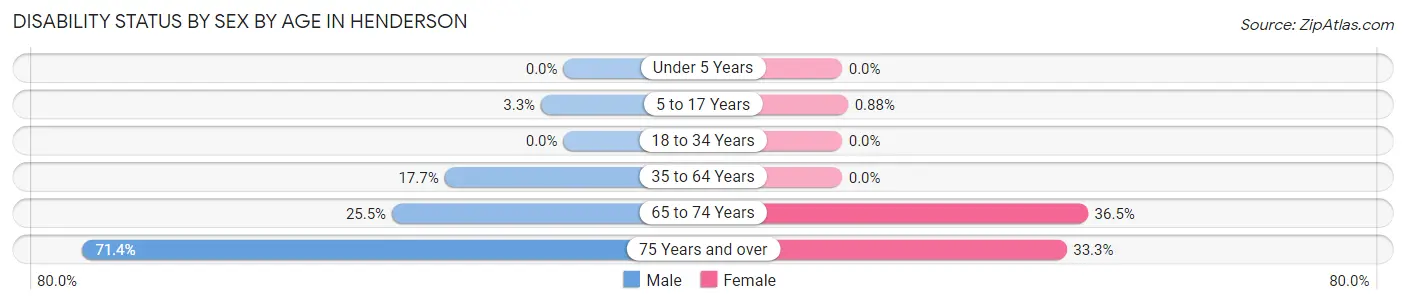
| Age Bracket | Male | Female |
| Under 5 Years | 0 (0.0%) | 0 (0.0%) |
| 5 to 17 Years | 1 (3.3%) | 1 (0.9%) |
| 18 to 34 Years | 0 (0.0%) | 0 (0.0%) |
| 35 to 64 Years | 21 (17.6%) | 0 (0.0%) |
| 65 to 74 Years | 14 (25.5%) | 23 (36.5%) |
| 75 Years and over | 45 (71.4%) | 35 (33.3%) |
Disability Class by Sex by Age in Henderson
Disability Class: Hearing Difficulty
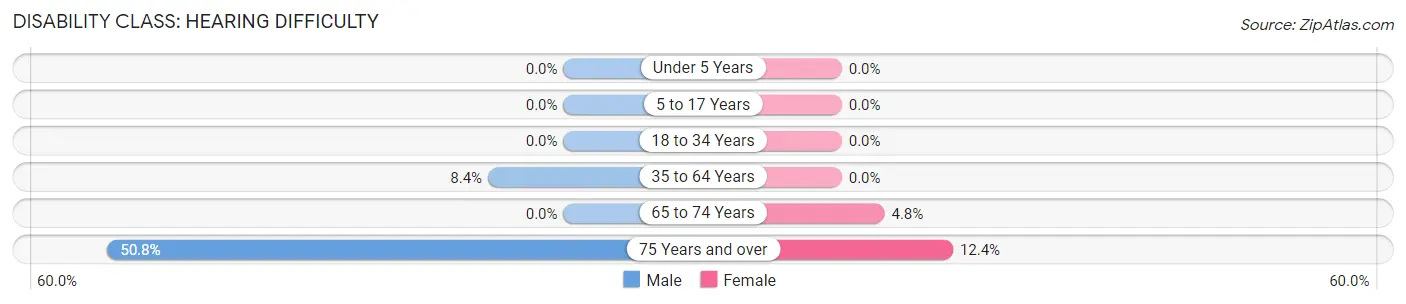
| Age Bracket | Male | Female |
| Under 5 Years | 0 (0.0%) | 0 (0.0%) |
| 5 to 17 Years | 0 (0.0%) | 0 (0.0%) |
| 18 to 34 Years | 0 (0.0%) | 0 (0.0%) |
| 35 to 64 Years | 10 (8.4%) | 0 (0.0%) |
| 65 to 74 Years | 0 (0.0%) | 3 (4.8%) |
| 75 Years and over | 32 (50.8%) | 13 (12.4%) |
Disability Class: Vision Difficulty
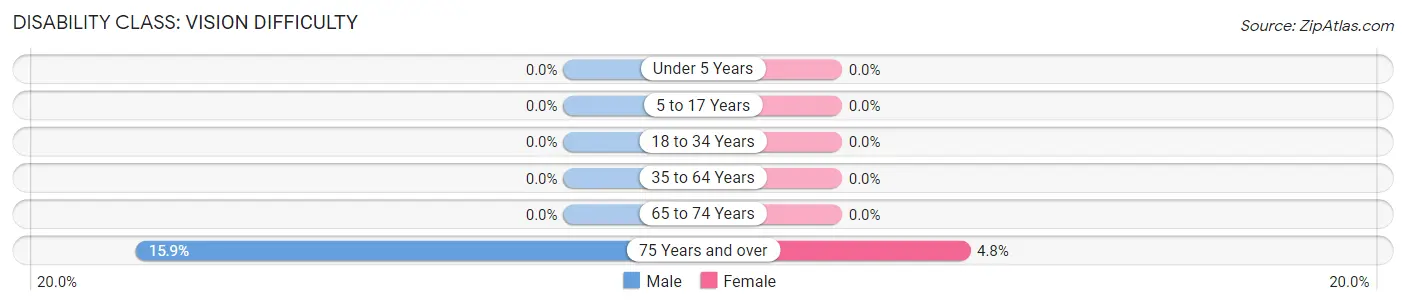
| Age Bracket | Male | Female |
| Under 5 Years | 0 (0.0%) | 0 (0.0%) |
| 5 to 17 Years | 0 (0.0%) | 0 (0.0%) |
| 18 to 34 Years | 0 (0.0%) | 0 (0.0%) |
| 35 to 64 Years | 0 (0.0%) | 0 (0.0%) |
| 65 to 74 Years | 0 (0.0%) | 0 (0.0%) |
| 75 Years and over | 10 (15.9%) | 5 (4.8%) |
Disability Class: Cognitive Difficulty
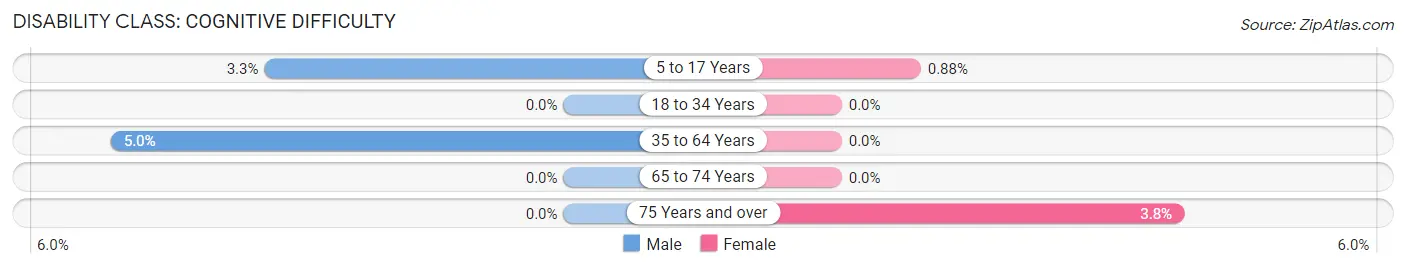
| Age Bracket | Male | Female |
| 5 to 17 Years | 1 (3.3%) | 1 (0.9%) |
| 18 to 34 Years | 0 (0.0%) | 0 (0.0%) |
| 35 to 64 Years | 6 (5.0%) | 0 (0.0%) |
| 65 to 74 Years | 0 (0.0%) | 0 (0.0%) |
| 75 Years and over | 0 (0.0%) | 4 (3.8%) |
Disability Class: Ambulatory Difficulty
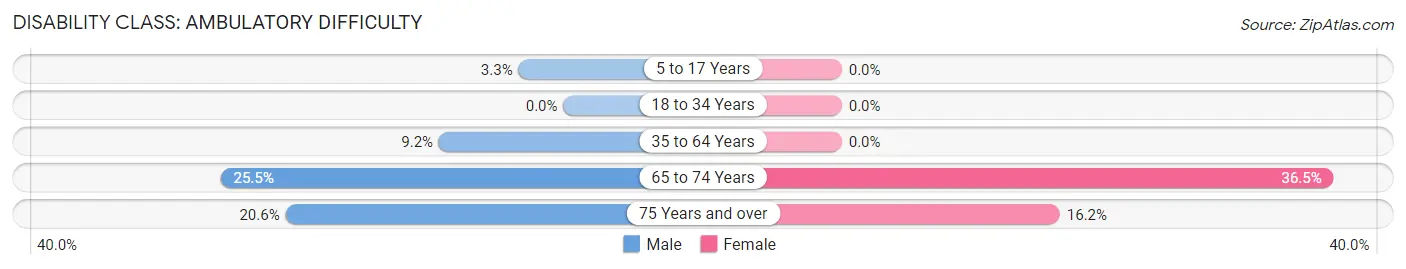
| Age Bracket | Male | Female |
| 5 to 17 Years | 1 (3.3%) | 0 (0.0%) |
| 18 to 34 Years | 0 (0.0%) | 0 (0.0%) |
| 35 to 64 Years | 11 (9.2%) | 0 (0.0%) |
| 65 to 74 Years | 14 (25.5%) | 23 (36.5%) |
| 75 Years and over | 13 (20.6%) | 17 (16.2%) |
Disability Class: Self-Care Difficulty
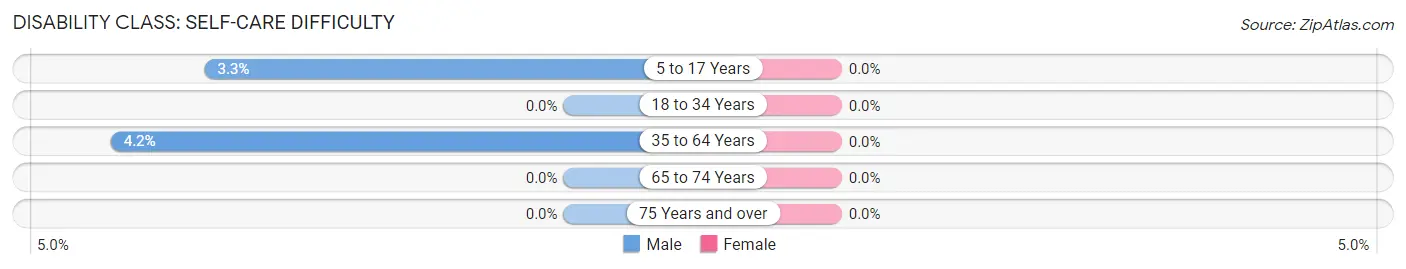
| Age Bracket | Male | Female |
| 5 to 17 Years | 1 (3.3%) | 0 (0.0%) |
| 18 to 34 Years | 0 (0.0%) | 0 (0.0%) |
| 35 to 64 Years | 5 (4.2%) | 0 (0.0%) |
| 65 to 74 Years | 0 (0.0%) | 0 (0.0%) |
| 75 Years and over | 0 (0.0%) | 0 (0.0%) |
Technology Access in Henderson
Computing Device Access in Henderson
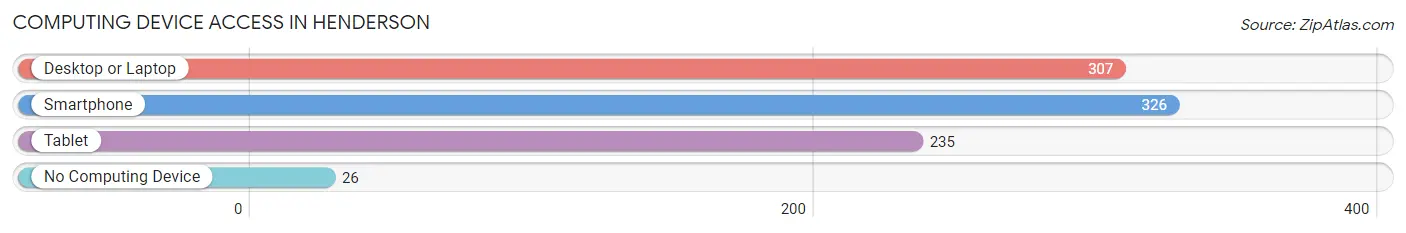
| Device Type | # Households | % Households |
| Desktop or Laptop | 307 | 80.6% |
| Smartphone | 326 | 85.6% |
| Tablet | 235 | 61.7% |
| No Computing Device | 26 | 6.8% |
| Total | 381 | 100.0% |
Internet Access in Henderson
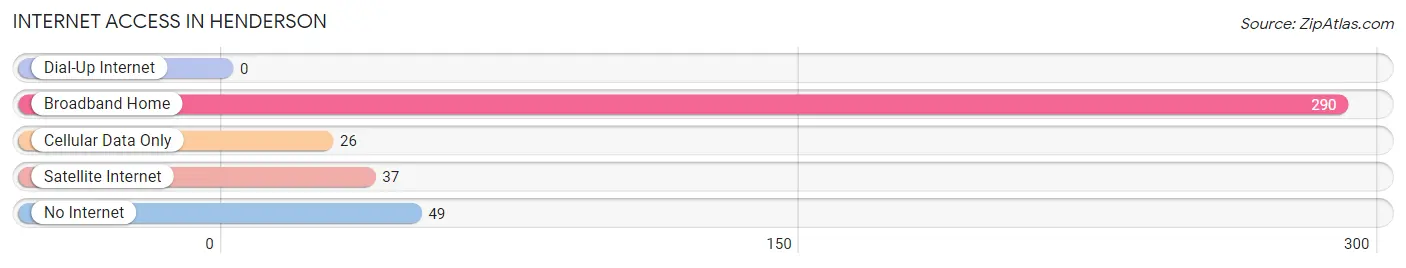
| Internet Type | # Households | % Households |
| Dial-Up Internet | 0 | 0.0% |
| Broadband Home | 290 | 76.1% |
| Cellular Data Only | 26 | 6.8% |
| Satellite Internet | 37 | 9.7% |
| No Internet | 49 | 12.9% |
| Total | 381 | 100.0% |
Henderson Summary
Henderson, Nebraska is a small town located in York County, Nebraska. It is situated on the banks of the Big Blue River and is home to approximately 1,000 people. The town was founded in 1871 and has a rich history of farming, ranching, and small business.
Geography
Henderson is located in the southeastern corner of York County, Nebraska. It is situated on the banks of the Big Blue River, which is a tributary of the Platte River. The town is located approximately 30 miles east of Lincoln, Nebraska and is part of the Lincoln Metropolitan Statistical Area. The town is surrounded by rolling hills and farmland, and is home to a variety of wildlife.
Economy
Henderson’s economy is largely based on agriculture and small businesses. The town is home to several farms and ranches, as well as a variety of small businesses. These businesses include a grocery store, a hardware store, a restaurant, and a few other small shops. The town also has a few manufacturing plants, which provide jobs for many of the town’s residents.
Demographics
As of the 2010 census, Henderson had a population of 1,000 people. The town is predominantly white, with a small Hispanic population. The median household income is $45,000, and the median age is 38. The town has a low unemployment rate, and the majority of the population is employed in the agricultural and small business sectors.
History
Henderson was founded in 1871 by a group of settlers from Ohio. The town was named after the first settler, William Henderson. The town quickly grew and became a center for farming and ranching. In the late 19th century, the town was home to several small businesses, including a blacksmith, a general store, and a hotel.
In the early 20th century, Henderson experienced a period of growth and prosperity. The town was home to several manufacturing plants, and the population grew to over 1,000 people. The town also had a thriving agricultural industry, and the town’s farmers were able to produce a variety of crops.
In the late 20th century, Henderson experienced a period of decline. Many of the town’s manufacturing plants closed, and the population began to decline. However, the town has experienced a resurgence in recent years, and the population has begun to grow again. The town is now home to a variety of small businesses, and the agricultural industry is still thriving.
Henderson is a small town with a rich history and a bright future. The town is home to a variety of businesses and industries, and the population is growing. The town is a great place to live, work, and raise a family.
Common Questions
What is Per Capita Income in Henderson?
Per Capita income in Henderson is $29,713.
What is the Median Family Income in Henderson?
Median Family Income in Henderson is $78,068.
What is the Median Household income in Henderson?
Median Household Income in Henderson is $72,656.
What is Income or Wage Gap in Henderson?
Income or Wage Gap in Henderson is 4.2%.
Women in Henderson earn 95.8 cents for every dollar earned by a man.
What is Inequality or Gini Index in Henderson?
Inequality or Gini Index in Henderson is 0.37.
What is the Total Population of Henderson?
Total Population of Henderson is 958.
What is the Total Male Population of Henderson?
Total Male Population of Henderson is 365.
What is the Total Female Population of Henderson?
Total Female Population of Henderson is 593.
What is the Ratio of Males per 100 Females in Henderson?
There are 61.55 Males per 100 Females in Henderson.
What is the Ratio of Females per 100 Males in Henderson?
There are 162.47 Females per 100 Males in Henderson.
What is the Median Population Age in Henderson?
Median Population Age in Henderson is 42.1 Years.
What is the Average Family Size in Henderson
Average Family Size in Henderson is 3.1 People.
What is the Average Household Size in Henderson
Average Household Size in Henderson is 2.4 People.
How Large is the Labor Force in Henderson?
There are 380 People in the Labor Forcein in Henderson.
What is the Percentage of People in the Labor Force in Henderson?
52.0% of People are in the Labor Force in Henderson.