Anoka, MN Map & Demographics
Anoka Map
Anoka Overview
$38,815
PER CAPITA INCOME
$90,219
AVG FAMILY INCOME
$73,118
AVG HOUSEHOLD INCOME
24.6%
WAGE / INCOME GAP [ % ]
75.4¢/ $1
WAGE / INCOME GAP [ $ ]
$5,408
FAMILY INCOME DEFICIT
0.43
INEQUALITY / GINI INDEX
17,892
TOTAL POPULATION
8,834
MALE POPULATION
9,058
FEMALE POPULATION
97.53
MALES / 100 FEMALES
102.54
FEMALES / 100 MALES
40.1
MEDIAN AGE
3.0
AVG FAMILY SIZE
2.4
AVG HOUSEHOLD SIZE
9,038
LABOR FORCE [ PEOPLE ]
62.5%
PERCENT IN LABOR FORCE
5.2%
UNEMPLOYMENT RATE
Anoka Zip Codes
Anoka Area Codes
Income in Anoka
Income Overview in Anoka
Per Capita Income in Anoka is $38,815, while median incomes of families and households are $90,219 and $73,118 respectively.
| Characteristic | Number | Measure |
| Per Capita Income | 17,892 | $38,815 |
| Median Family Income | 4,445 | $90,219 |
| Mean Family Income | 4,445 | $106,686 |
| Median Household Income | 7,166 | $73,118 |
| Mean Household Income | 7,166 | $92,979 |
| Income Deficit | 4,445 | $5,408 |
| Wage / Income Gap (%) | 17,892 | 24.58% |
| Wage / Income Gap ($) | 17,892 | 75.42¢ per $1 |
| Gini / Inequality Index | 17,892 | 0.43 |
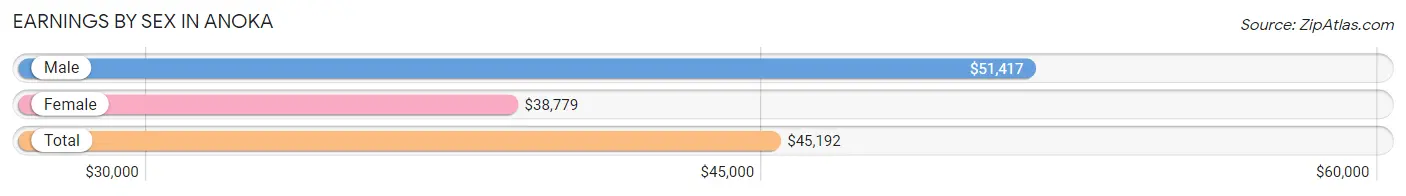
Earnings by Sex in Anoka
Average Earnings in Anoka are $45,192, $51,417 for men and $38,779 for women, a difference of 24.6%.
| Sex | Number | Average Earnings |
| Male | 5,252 (55.8%) | $51,417 |
| Female | 4,157 (44.2%) | $38,779 |
| Total | 9,409 (100.0%) | $45,192 |
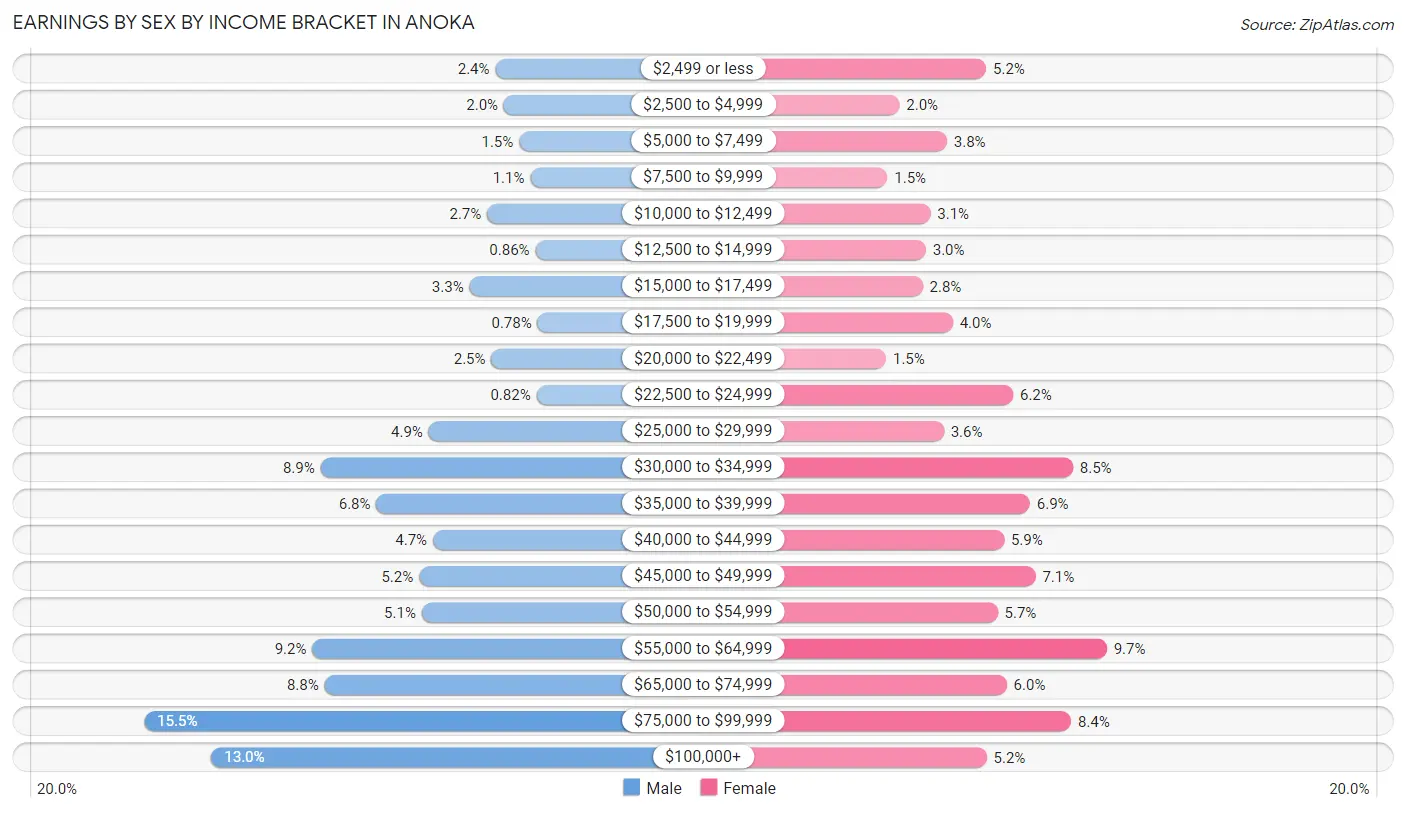
Earnings by Sex by Income Bracket in Anoka
The most common earnings brackets in Anoka are $75,000 to $99,999 for men (815 | 15.5%) and $55,000 to $64,999 for women (405 | 9.7%).
| Income | Male | Female |
| $2,499 or less | 124 (2.4%) | 217 (5.2%) |
| $2,500 to $4,999 | 107 (2.0%) | 82 (2.0%) |
| $5,000 to $7,499 | 77 (1.5%) | 156 (3.7%) |
| $7,500 to $9,999 | 55 (1.1%) | 63 (1.5%) |
| $10,000 to $12,499 | 140 (2.7%) | 130 (3.1%) |
| $12,500 to $14,999 | 45 (0.9%) | 123 (3.0%) |
| $15,000 to $17,499 | 175 (3.3%) | 118 (2.8%) |
| $17,500 to $19,999 | 41 (0.8%) | 165 (4.0%) |
| $20,000 to $22,499 | 132 (2.5%) | 61 (1.5%) |
| $22,500 to $24,999 | 43 (0.8%) | 259 (6.2%) |
| $25,000 to $29,999 | 255 (4.9%) | 151 (3.6%) |
| $30,000 to $34,999 | 468 (8.9%) | 352 (8.5%) |
| $35,000 to $39,999 | 358 (6.8%) | 285 (6.9%) |
| $40,000 to $44,999 | 247 (4.7%) | 245 (5.9%) |
| $45,000 to $49,999 | 274 (5.2%) | 294 (7.1%) |
| $50,000 to $54,999 | 269 (5.1%) | 235 (5.7%) |
| $55,000 to $64,999 | 484 (9.2%) | 405 (9.7%) |
| $65,000 to $74,999 | 460 (8.8%) | 249 (6.0%) |
| $75,000 to $99,999 | 815 (15.5%) | 349 (8.4%) |
| $100,000+ | 683 (13.0%) | 218 (5.2%) |
| Total | 5,252 (100.0%) | 4,157 (100.0%) |
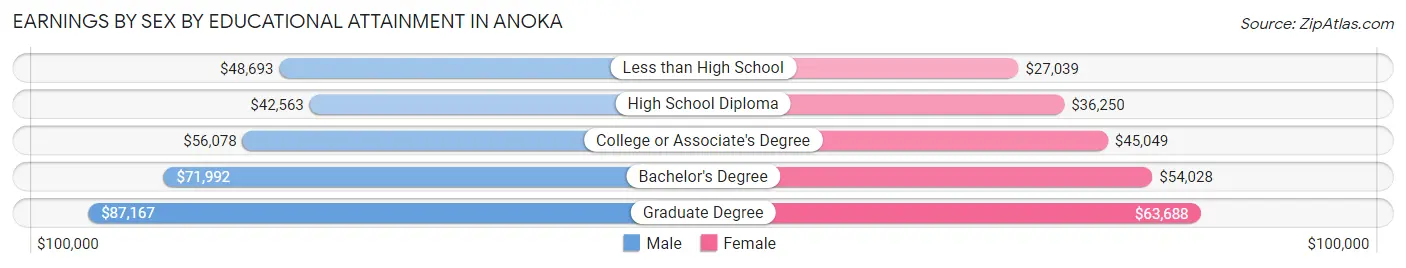
Earnings by Sex by Educational Attainment in Anoka
Average earnings in Anoka are $57,017 for men and $44,002 for women, a difference of 22.8%. Men with an educational attainment of graduate degree enjoy the highest average annual earnings of $87,167, while those with high school diploma education earn the least with $42,563. Women with an educational attainment of graduate degree earn the most with the average annual earnings of $63,688, while those with less than high school education have the smallest earnings of $27,039.
| Educational Attainment | Male Income | Female Income |
| Less than High School | $48,693 | $27,039 |
| High School Diploma | $42,563 | $36,250 |
| College or Associate's Degree | $56,078 | $45,049 |
| Bachelor's Degree | $71,992 | $54,028 |
| Graduate Degree | $87,167 | $63,688 |
| Total | $57,017 | $44,002 |
Family Income in Anoka
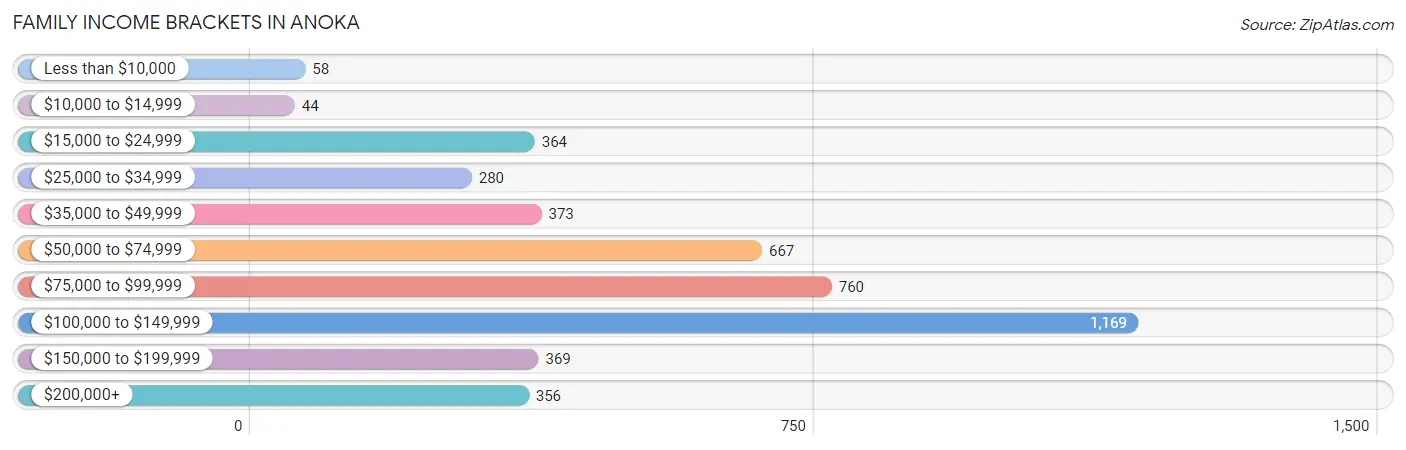
Family Income Brackets in Anoka
According to the Anoka family income data, there are 1,169 families falling into the $100,000 to $149,999 income range, which is the most common income bracket and makes up 26.3% of all families. Conversely, the $10,000 to $14,999 income bracket is the least frequent group with only 44 families (1.0%) belonging to this category.
| Income Bracket | # Families | % Families |
| Less than $10,000 | 58 | 1.3% |
| $10,000 to $14,999 | 44 | 1.0% |
| $15,000 to $24,999 | 364 | 8.2% |
| $25,000 to $34,999 | 280 | 6.3% |
| $35,000 to $49,999 | 373 | 8.4% |
| $50,000 to $74,999 | 667 | 15.0% |
| $75,000 to $99,999 | 760 | 17.1% |
| $100,000 to $149,999 | 1,169 | 26.3% |
| $150,000 to $199,999 | 369 | 8.3% |
| $200,000+ | 356 | 8.0% |
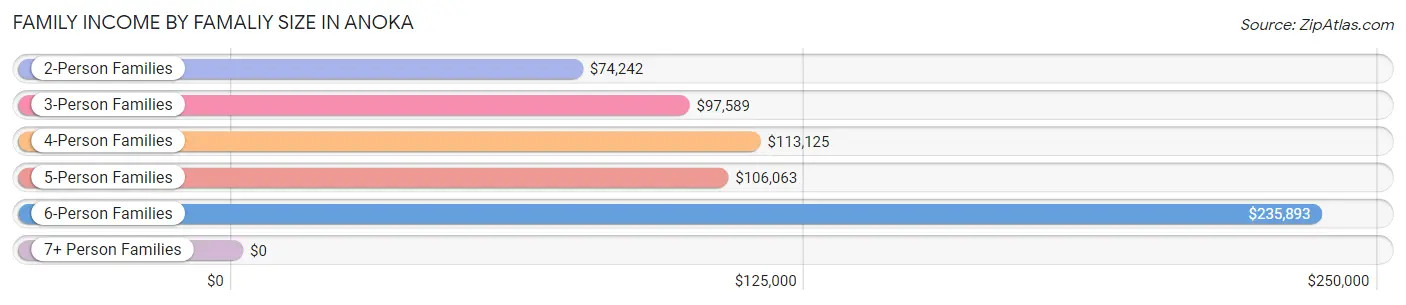
Family Income by Famaliy Size in Anoka
6-person families (68 | 1.5%) account for the highest median family income in Anoka with $235,893 per family, while 6-person families (68 | 1.5%) have the highest median income of $39,316 per family member.
| Income Bracket | # Families | Median Income |
| 2-Person Families | 2,166 (48.7%) | $74,242 |
| 3-Person Families | 997 (22.4%) | $97,589 |
| 4-Person Families | 746 (16.8%) | $113,125 |
| 5-Person Families | 451 (10.2%) | $106,063 |
| 6-Person Families | 68 (1.5%) | $235,893 |
| 7+ Person Families | 17 (0.4%) | $0 |
| Total | 4,445 (100.0%) | $90,219 |
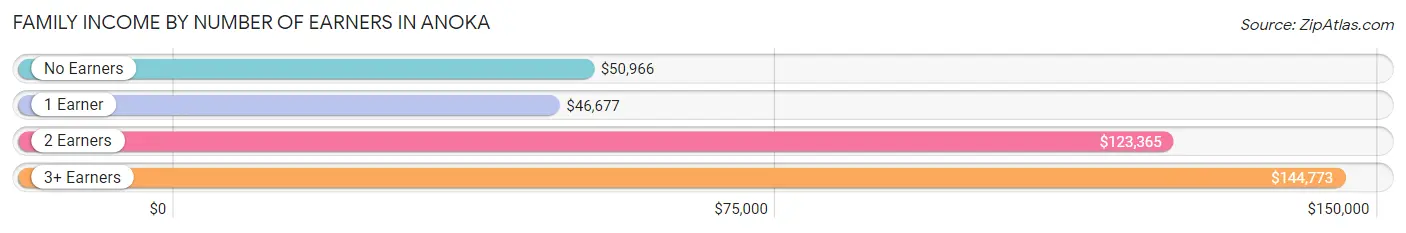
Family Income by Number of Earners in Anoka
The median family income in Anoka is $90,219, with families comprising 3+ earners (550) having the highest median family income of $144,773, while families with 1 earner (1,430) have the lowest median family income of $46,677, accounting for 12.4% and 32.2% of families, respectively.
| Number of Earners | # Families | Median Income |
| No Earners | 597 (13.4%) | $50,966 |
| 1 Earner | 1,430 (32.2%) | $46,677 |
| 2 Earners | 1,868 (42.0%) | $123,365 |
| 3+ Earners | 550 (12.4%) | $144,773 |
| Total | 4,445 (100.0%) | $90,219 |
Household Income in Anoka
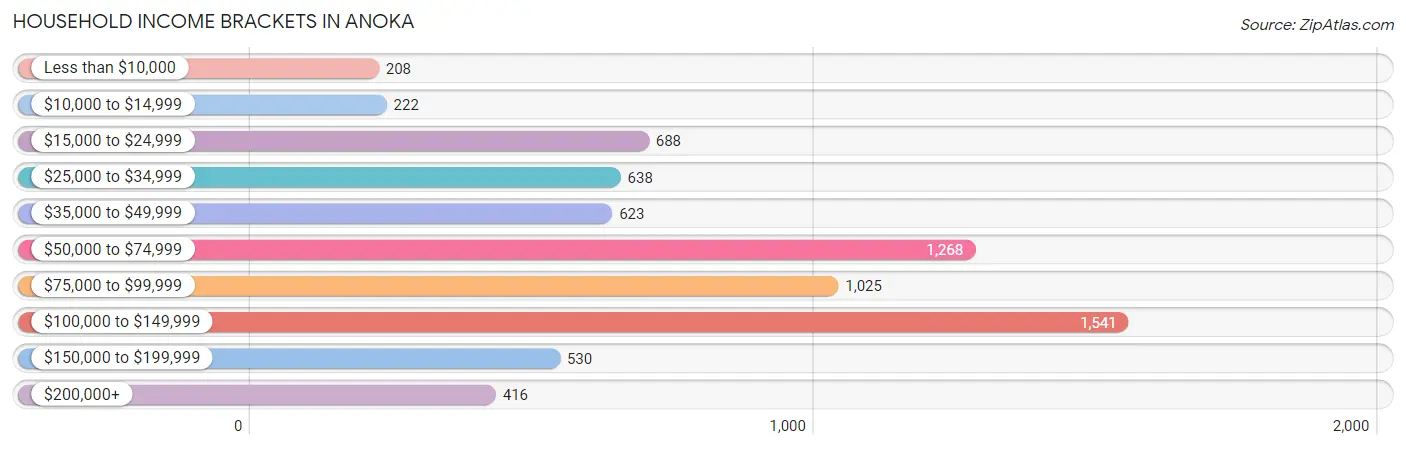
Household Income Brackets in Anoka
With 1,541 households falling in the category, the $100,000 to $149,999 income range is the most frequent in Anoka, accounting for 21.5% of all households. In contrast, only 208 households (2.9%) fall into the less than $10,000 income bracket, making it the least populous group.
| Income Bracket | # Households | % Households |
| Less than $10,000 | 208 | 2.9% |
| $10,000 to $14,999 | 222 | 3.1% |
| $15,000 to $24,999 | 688 | 9.6% |
| $25,000 to $34,999 | 638 | 8.9% |
| $35,000 to $49,999 | 623 | 8.7% |
| $50,000 to $74,999 | 1,268 | 17.7% |
| $75,000 to $99,999 | 1,025 | 14.3% |
| $100,000 to $149,999 | 1,541 | 21.5% |
| $150,000 to $199,999 | 530 | 7.4% |
| $200,000+ | 416 | 5.8% |
Household Income by Householder Age in Anoka
The median household income in Anoka is $73,118, with the highest median household income of $89,556 found in the 45 to 64 years age bracket for the primary householder. A total of 2,512 households (35.0%) fall into this category. Meanwhile, the 15 to 24 years age bracket for the primary householder has the lowest median household income of $50,507, with 398 households (5.6%) in this group.
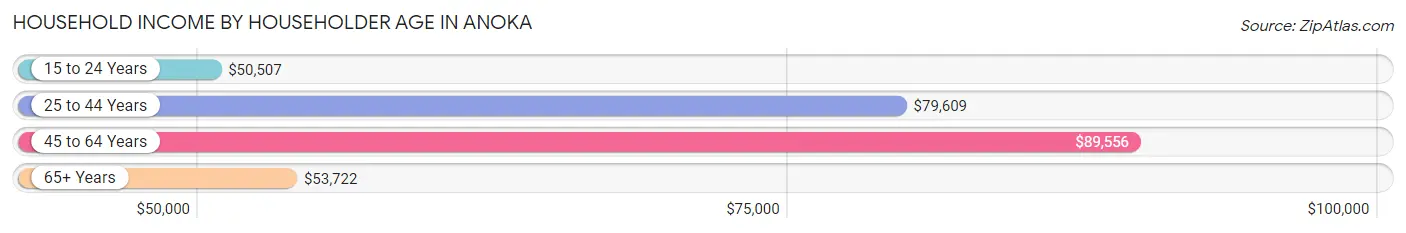
| Income Bracket | # Households | Median Income |
| 15 to 24 Years | 398 (5.6%) | $50,507 |
| 25 to 44 Years | 2,187 (30.5%) | $79,609 |
| 45 to 64 Years | 2,512 (35.0%) | $89,556 |
| 65+ Years | 2,069 (28.9%) | $53,722 |
| Total | 7,166 (100.0%) | $73,118 |
Poverty in Anoka
Income Below Poverty by Sex and Age in Anoka
With 7.1% poverty level for males and 10.8% for females among the residents of Anoka, 15 year old males and 5 year old females are the most vulnerable to poverty, with 49 males (30.8%) and 12 females (21.0%) in their respective age groups living below the poverty level.
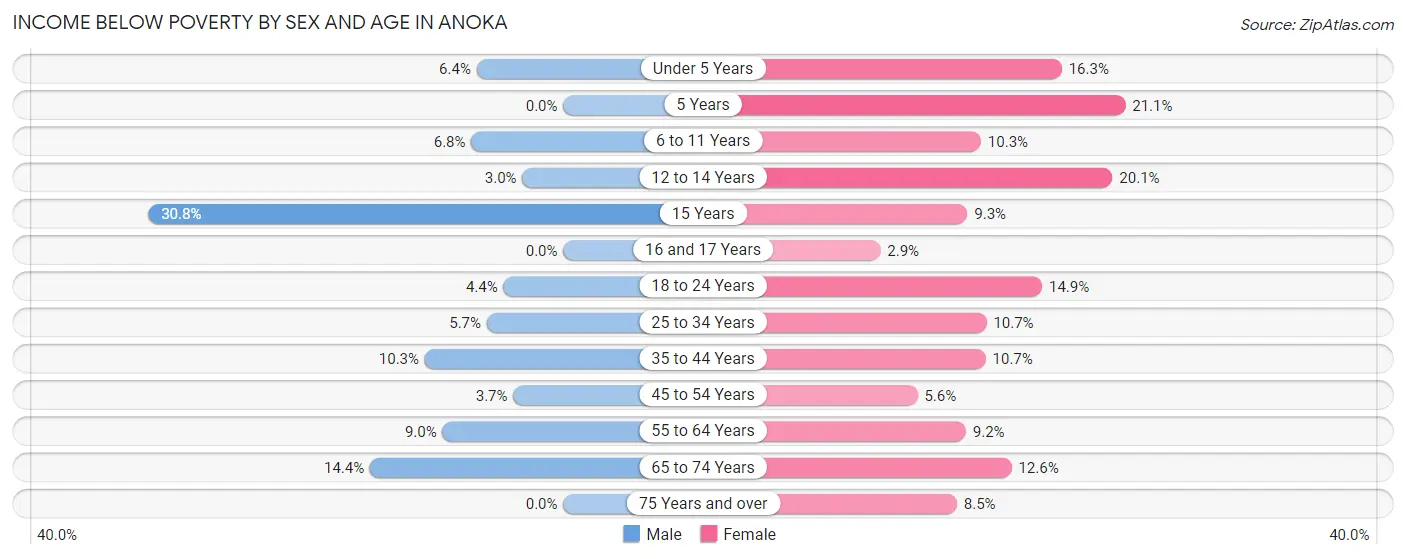
| Age Bracket | Male | Female |
| Under 5 Years | 29 (6.4%) | 98 (16.3%) |
| 5 Years | 0 (0.0%) | 12 (21.0%) |
| 6 to 11 Years | 36 (6.8%) | 78 (10.3%) |
| 12 to 14 Years | 13 (3.0%) | 47 (20.1%) |
| 15 Years | 49 (30.8%) | 11 (9.3%) |
| 16 and 17 Years | 0 (0.0%) | 4 (2.9%) |
| 18 to 24 Years | 27 (4.4%) | 95 (14.9%) |
| 25 to 34 Years | 83 (5.7%) | 133 (10.7%) |
| 35 to 44 Years | 120 (10.3%) | 102 (10.7%) |
| 45 to 54 Years | 37 (3.7%) | 50 (5.6%) |
| 55 to 64 Years | 107 (9.0%) | 111 (9.2%) |
| 65 to 74 Years | 98 (14.3%) | 132 (12.6%) |
| 75 Years and over | 0 (0.0%) | 79 (8.5%) |
| Total | 599 (7.1%) | 952 (10.8%) |
Income Above Poverty by Sex and Age in Anoka
According to the poverty statistics in Anoka, males aged 5 years and females aged 16 and 17 years are the age groups that are most secure financially, with 100.0% of males and 97.1% of females in these age groups living above the poverty line.
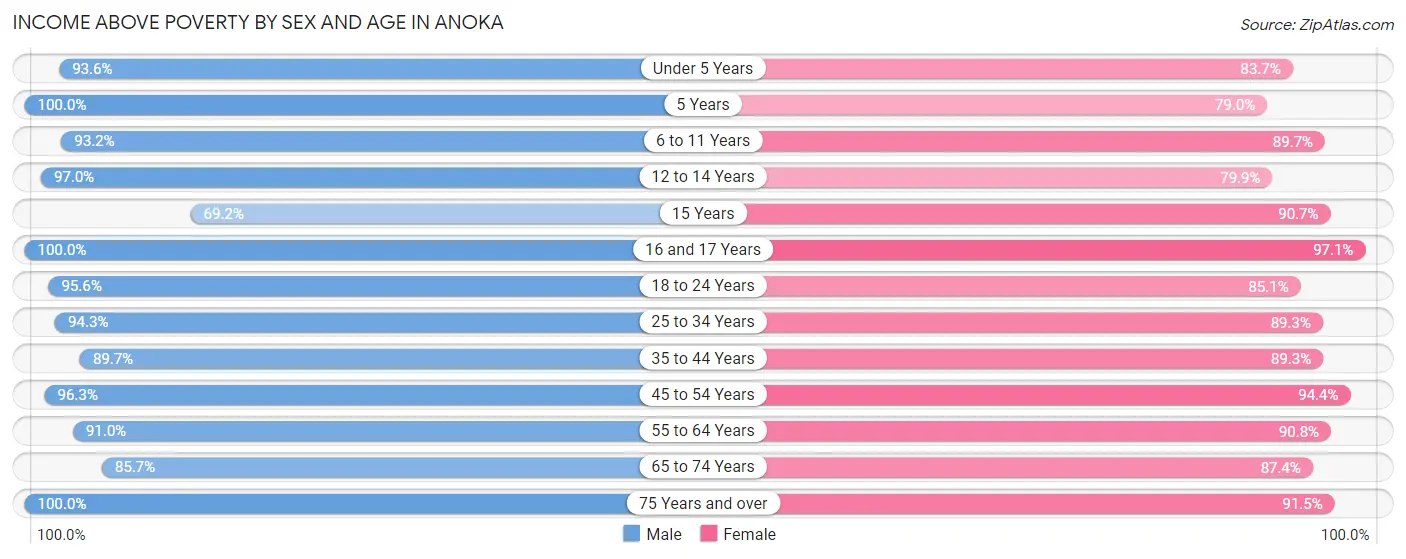
| Age Bracket | Male | Female |
| Under 5 Years | 422 (93.6%) | 502 (83.7%) |
| 5 Years | 25 (100.0%) | 45 (78.9%) |
| 6 to 11 Years | 491 (93.2%) | 677 (89.7%) |
| 12 to 14 Years | 415 (97.0%) | 187 (79.9%) |
| 15 Years | 110 (69.2%) | 107 (90.7%) |
| 16 and 17 Years | 273 (100.0%) | 136 (97.1%) |
| 18 to 24 Years | 581 (95.6%) | 544 (85.1%) |
| 25 to 34 Years | 1,379 (94.3%) | 1,105 (89.3%) |
| 35 to 44 Years | 1,047 (89.7%) | 853 (89.3%) |
| 45 to 54 Years | 961 (96.3%) | 840 (94.4%) |
| 55 to 64 Years | 1,086 (91.0%) | 1,094 (90.8%) |
| 65 to 74 Years | 585 (85.7%) | 916 (87.4%) |
| 75 Years and over | 419 (100.0%) | 846 (91.5%) |
| Total | 7,794 (92.9%) | 7,852 (89.2%) |
Income Below Poverty Among Married-Couple Families in Anoka
The poverty statistics for married-couple families in Anoka show that 2.5% or 79 of the total 3,204 families live below the poverty line. Families with 3 or 4 children have the highest poverty rate of 6.8%, comprising of 20 families. On the other hand, families with 5 or more children have the lowest poverty rate of 0.0%, which includes 0 families.
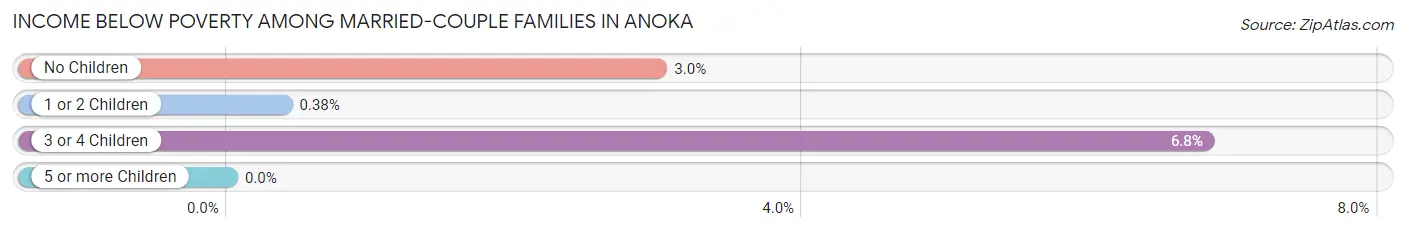
| Children | Above Poverty | Below Poverty |
| No Children | 1,782 (97.0%) | 55 (3.0%) |
| 1 or 2 Children | 1,062 (99.6%) | 4 (0.4%) |
| 3 or 4 Children | 274 (93.2%) | 20 (6.8%) |
| 5 or more Children | 7 (100.0%) | 0 (0.0%) |
| Total | 3,125 (97.5%) | 79 (2.5%) |
Income Below Poverty Among Single-Parent Households in Anoka
According to the poverty data in Anoka, 12.2% or 50 single-father households and 22.1% or 184 single-mother households are living below the poverty line. Among single-father households, those with 1 or 2 children have the highest poverty rate, with 45 households (18.9%) experiencing poverty. Likewise, among single-mother households, those with 1 or 2 children have the highest poverty rate, with 122 households (26.4%) falling below the poverty line.
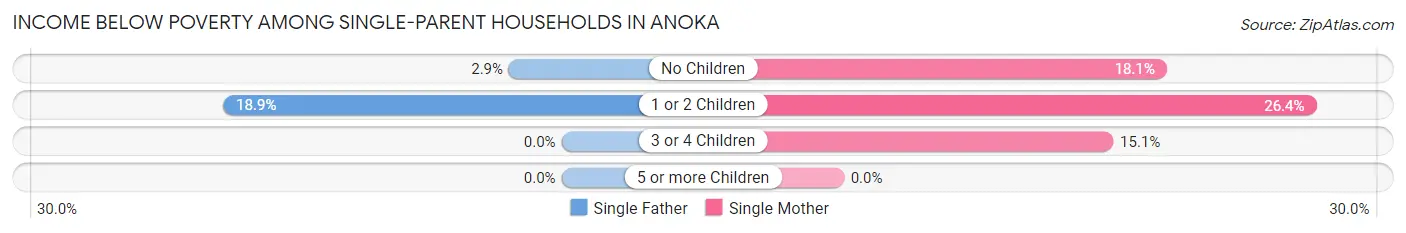
| Children | Single Father | Single Mother |
| No Children | 5 (2.9%) | 37 (18.0%) |
| 1 or 2 Children | 45 (18.9%) | 122 (26.4%) |
| 3 or 4 Children | 0 (0.0%) | 25 (15.1%) |
| 5 or more Children | 0 (0.0%) | 0 (0.0%) |
| Total | 50 (12.2%) | 184 (22.1%) |
Income Below Poverty Among Married-Couple vs Single-Parent Households in Anoka
The poverty data for Anoka shows that 79 of the married-couple family households (2.5%) and 234 of the single-parent households (18.9%) are living below the poverty level. Within the married-couple family households, those with 3 or 4 children have the highest poverty rate, with 20 households (6.8%) falling below the poverty line. Among the single-parent households, those with 1 or 2 children have the highest poverty rate, with 167 household (23.9%) living below poverty.
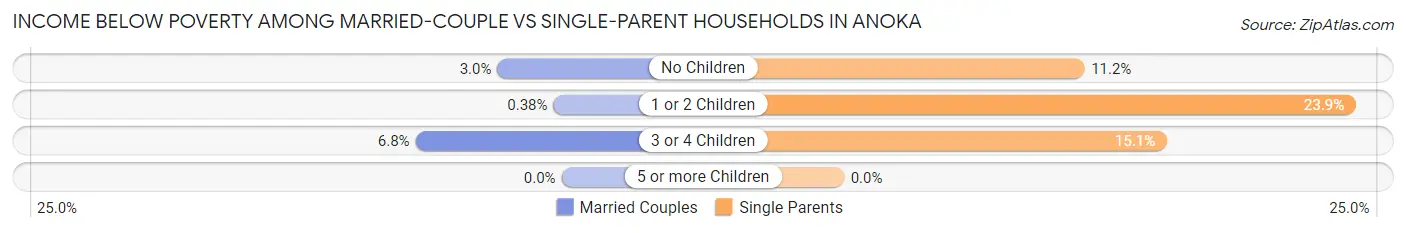
| Children | Married-Couple Families | Single-Parent Households |
| No Children | 55 (3.0%) | 42 (11.2%) |
| 1 or 2 Children | 4 (0.4%) | 167 (23.9%) |
| 3 or 4 Children | 20 (6.8%) | 25 (15.1%) |
| 5 or more Children | 0 (0.0%) | 0 (0.0%) |
| Total | 79 (2.5%) | 234 (18.9%) |
Race in Anoka
The most populous races in Anoka are White / Caucasian (14,043 | 78.5%), Black / African American (1,442 | 8.1%), and Two or more Races (1,239 | 6.9%).
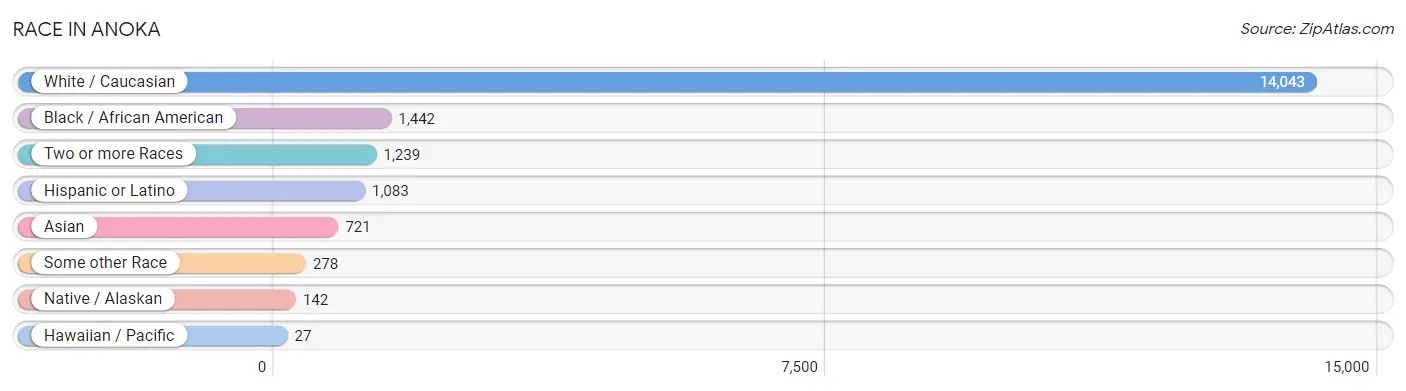
| Race | # Population | % Population |
| Asian | 721 | 4.0% |
| Black / African American | 1,442 | 8.1% |
| Hawaiian / Pacific | 27 | 0.2% |
| Hispanic or Latino | 1,083 | 6.0% |
| Native / Alaskan | 142 | 0.8% |
| White / Caucasian | 14,043 | 78.5% |
| Two or more Races | 1,239 | 6.9% |
| Some other Race | 278 | 1.5% |
| Total | 17,892 | 100.0% |
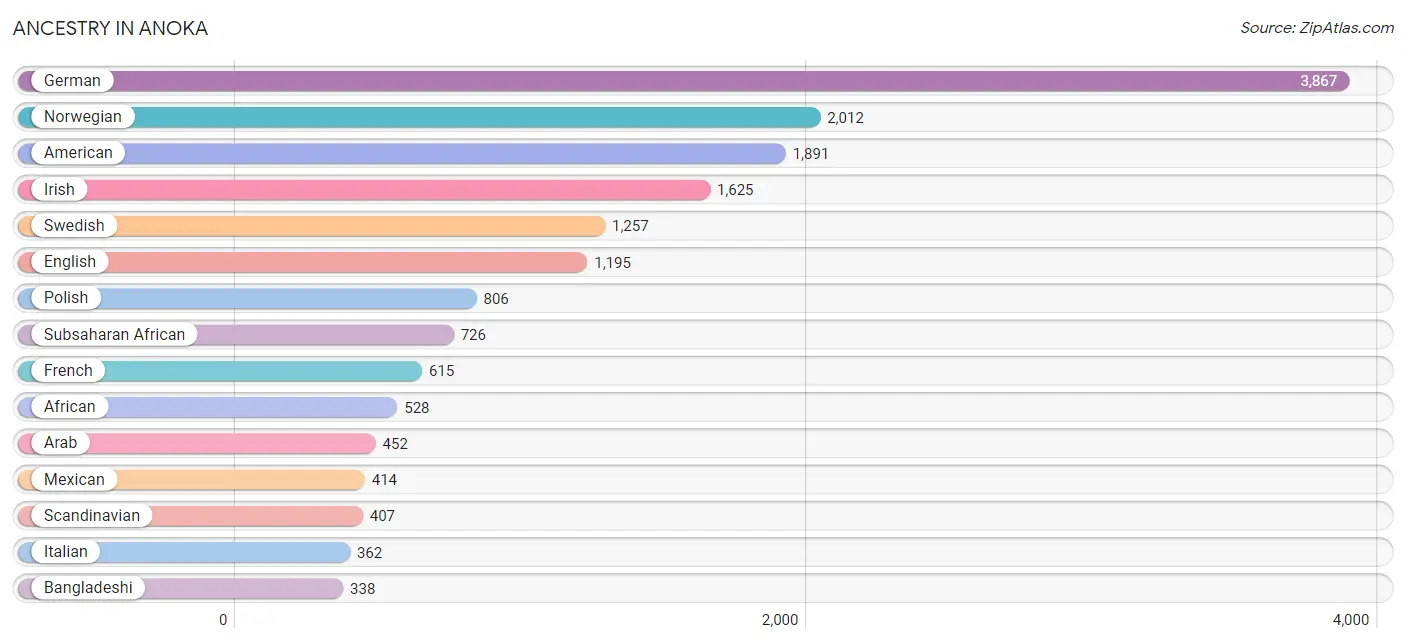
Ancestry in Anoka
The most populous ancestries reported in Anoka are German (3,867 | 21.6%), Norwegian (2,012 | 11.3%), American (1,891 | 10.6%), Irish (1,625 | 9.1%), and Swedish (1,257 | 7.0%), together accounting for 59.5% of all Anoka residents.
| Ancestry | # Population | % Population |
| African | 528 | 2.9% |
| American | 1,891 | 10.6% |
| Arab | 452 | 2.5% |
| Bangladeshi | 338 | 1.9% |
| Bhutanese | 216 | 1.2% |
| Blackfeet | 52 | 0.3% |
| Brazilian | 13 | 0.1% |
| British | 52 | 0.3% |
| Burmese | 180 | 1.0% |
| Canadian | 11 | 0.1% |
| Carpatho Rusyn | 8 | 0.0% |
| Central American | 206 | 1.1% |
| Cherokee | 12 | 0.1% |
| Chippewa | 137 | 0.8% |
| Colombian | 7 | 0.0% |
| Croatian | 6 | 0.0% |
| Cuban | 75 | 0.4% |
| Czech | 59 | 0.3% |
| Czechoslovakian | 35 | 0.2% |
| Danish | 147 | 0.8% |
| Dominican | 55 | 0.3% |
| Dutch | 191 | 1.1% |
| Eastern European | 28 | 0.2% |
| Egyptian | 50 | 0.3% |
| English | 1,195 | 6.7% |
| European | 331 | 1.8% |
| Finnish | 264 | 1.5% |
| French | 615 | 3.4% |
| French Canadian | 168 | 0.9% |
| German | 3,867 | 21.6% |
| Ghanaian | 2 | 0.0% |
| Greek | 11 | 0.1% |
| Guamanian / Chamorro | 14 | 0.1% |
| Guatemalan | 3 | 0.0% |
| Guyanese | 11 | 0.1% |
| Haitian | 4 | 0.0% |
| Honduran | 43 | 0.2% |
| Hungarian | 22 | 0.1% |
| Indian (Asian) | 136 | 0.8% |
| Iraqi | 269 | 1.5% |
| Irish | 1,625 | 9.1% |
| Iroquois | 35 | 0.2% |
| Italian | 362 | 2.0% |
| Kenyan | 135 | 0.7% |
| Korean | 57 | 0.3% |
| Lebanese | 24 | 0.1% |
| Liberian | 3 | 0.0% |
| Lithuanian | 60 | 0.3% |
| Macedonian | 12 | 0.1% |
| Malaysian | 28 | 0.2% |
| Mexican | 414 | 2.3% |
| Norwegian | 2,012 | 11.3% |
| Pakistani | 58 | 0.3% |
| Pennsylvania German | 16 | 0.1% |
| Polish | 806 | 4.5% |
| Portuguese | 46 | 0.3% |
| Puerto Rican | 12 | 0.1% |
| Romanian | 22 | 0.1% |
| Russian | 79 | 0.4% |
| Salvadoran | 160 | 0.9% |
| Scandinavian | 407 | 2.3% |
| Scotch-Irish | 120 | 0.7% |
| Scottish | 287 | 1.6% |
| Slovak | 24 | 0.1% |
| Slovene | 7 | 0.0% |
| Somali | 58 | 0.3% |
| South American | 164 | 0.9% |
| Spanish | 149 | 0.8% |
| Sri Lankan | 64 | 0.4% |
| Subsaharan African | 726 | 4.1% |
| Swedish | 1,257 | 7.0% |
| Swiss | 47 | 0.3% |
| Syrian | 9 | 0.1% |
| Ukrainian | 35 | 0.2% |
| Uruguayan | 157 | 0.9% |
| Vietnamese | 19 | 0.1% |
| Welsh | 51 | 0.3% | View All 77 Rows |
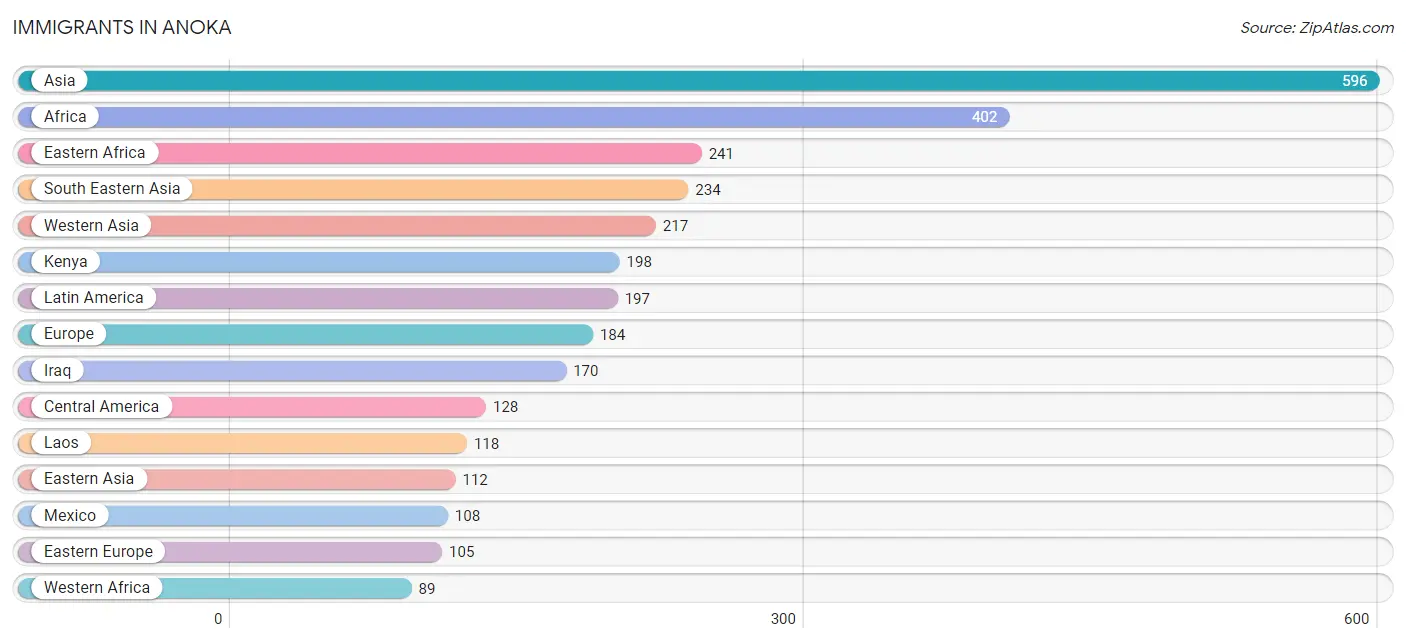
Immigrants in Anoka
The most numerous immigrant groups reported in Anoka came from Asia (596 | 3.3%), Africa (402 | 2.2%), Eastern Africa (241 | 1.3%), South Eastern Asia (234 | 1.3%), and Western Asia (217 | 1.2%), together accounting for 9.5% of all Anoka residents.
| Immigration Origin | # Population | % Population |
| Africa | 402 | 2.2% |
| Asia | 596 | 3.3% |
| Belarus | 5 | 0.0% |
| Brazil | 11 | 0.1% |
| Cameroon | 33 | 0.2% |
| Central America | 128 | 0.7% |
| China | 27 | 0.2% |
| Colombia | 2 | 0.0% |
| Costa Rica | 16 | 0.1% |
| Eastern Africa | 241 | 1.3% |
| Eastern Asia | 112 | 0.6% |
| Eastern Europe | 105 | 0.6% |
| Europe | 184 | 1.0% |
| Germany | 7 | 0.0% |
| Ghana | 6 | 0.0% |
| Guatemala | 3 | 0.0% |
| Guyana | 48 | 0.3% |
| Honduras | 1 | 0.0% |
| India | 33 | 0.2% |
| Iraq | 170 | 0.9% |
| Jordan | 20 | 0.1% |
| Kenya | 198 | 1.1% |
| Korea | 85 | 0.5% |
| Laos | 118 | 0.7% |
| Latin America | 197 | 1.1% |
| Liberia | 83 | 0.5% |
| Lithuania | 26 | 0.2% |
| Mexico | 108 | 0.6% |
| Middle Africa | 33 | 0.2% |
| Moldova | 33 | 0.2% |
| Northern Europe | 72 | 0.4% |
| Philippines | 26 | 0.2% |
| Romania | 6 | 0.0% |
| Russia | 23 | 0.1% |
| Somalia | 43 | 0.2% |
| South America | 69 | 0.4% |
| South Central Asia | 33 | 0.2% |
| South Eastern Asia | 234 | 1.3% |
| Syria | 9 | 0.1% |
| Thailand | 38 | 0.2% |
| Ukraine | 12 | 0.1% |
| Venezuela | 8 | 0.0% |
| Vietnam | 52 | 0.3% |
| Western Africa | 89 | 0.5% |
| Western Asia | 217 | 1.2% |
| Western Europe | 7 | 0.0% | View All 46 Rows |
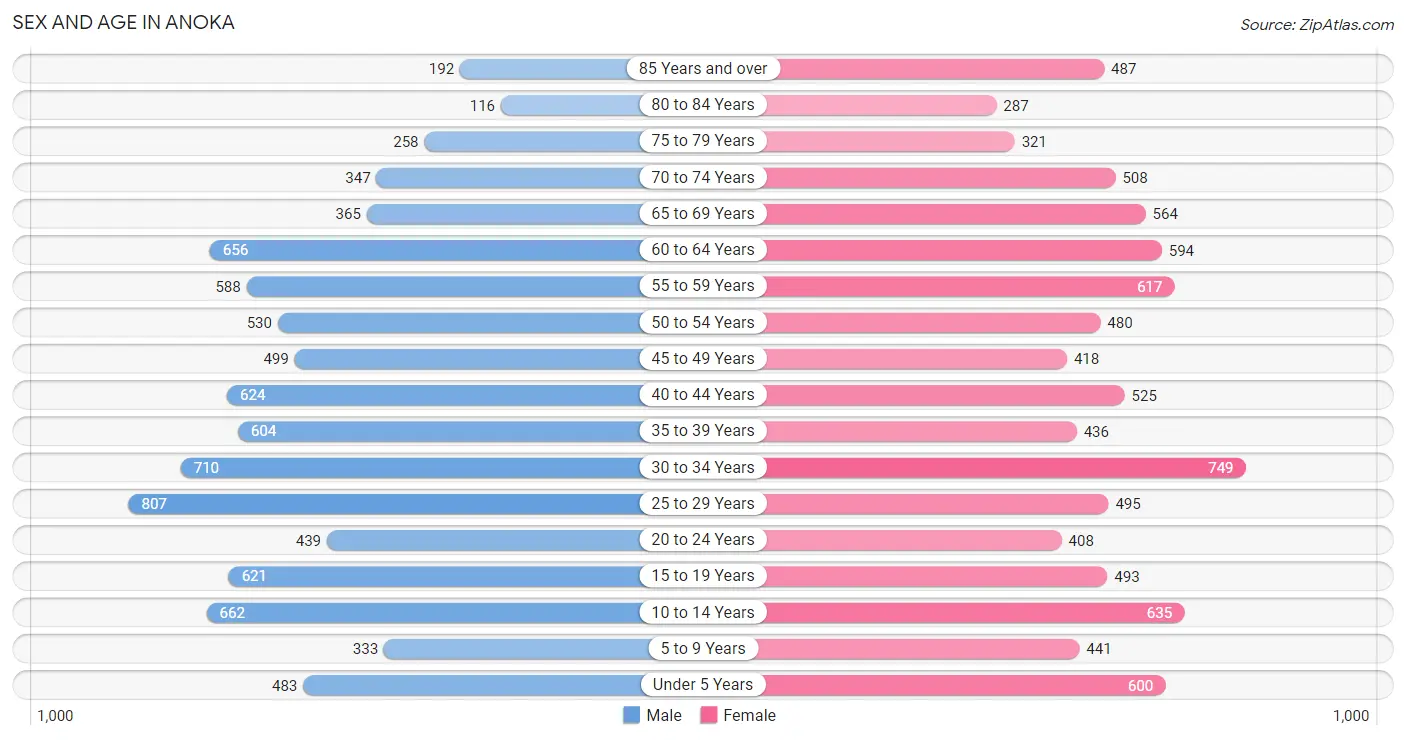
Sex and Age in Anoka
Sex and Age in Anoka
The most populous age groups in Anoka are 25 to 29 Years (807 | 9.1%) for men and 30 to 34 Years (749 | 8.3%) for women.
| Age Bracket | Male | Female |
| Under 5 Years | 483 (5.5%) | 600 (6.6%) |
| 5 to 9 Years | 333 (3.8%) | 441 (4.9%) |
| 10 to 14 Years | 662 (7.5%) | 635 (7.0%) |
| 15 to 19 Years | 621 (7.0%) | 493 (5.4%) |
| 20 to 24 Years | 439 (5.0%) | 408 (4.5%) |
| 25 to 29 Years | 807 (9.1%) | 495 (5.5%) |
| 30 to 34 Years | 710 (8.0%) | 749 (8.3%) |
| 35 to 39 Years | 604 (6.8%) | 436 (4.8%) |
| 40 to 44 Years | 624 (7.1%) | 525 (5.8%) |
| 45 to 49 Years | 499 (5.7%) | 418 (4.6%) |
| 50 to 54 Years | 530 (6.0%) | 480 (5.3%) |
| 55 to 59 Years | 588 (6.7%) | 617 (6.8%) |
| 60 to 64 Years | 656 (7.4%) | 594 (6.6%) |
| 65 to 69 Years | 365 (4.1%) | 564 (6.2%) |
| 70 to 74 Years | 347 (3.9%) | 508 (5.6%) |
| 75 to 79 Years | 258 (2.9%) | 321 (3.5%) |
| 80 to 84 Years | 116 (1.3%) | 287 (3.2%) |
| 85 Years and over | 192 (2.2%) | 487 (5.4%) |
| Total | 8,834 (100.0%) | 9,058 (100.0%) |
Families and Households in Anoka
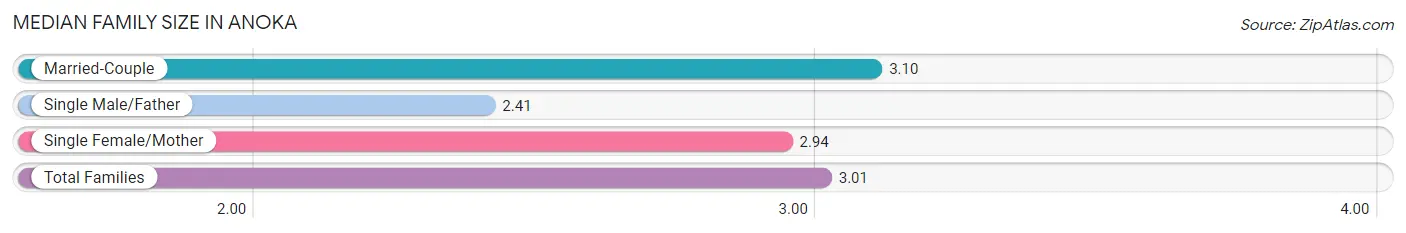
Median Family Size in Anoka
The median family size in Anoka is 3.01 persons per family, with married-couple families (3,204 | 72.1%) accounting for the largest median family size of 3.1 persons per family. On the other hand, single male/father families (408 | 9.2%) represent the smallest median family size with 2.41 persons per family.
| Family Type | # Families | Family Size |
| Married-Couple | 3,204 (72.1%) | 3.10 |
| Single Male/Father | 408 (9.2%) | 2.41 |
| Single Female/Mother | 833 (18.7%) | 2.94 |
| Total Families | 4,445 (100.0%) | 3.01 |
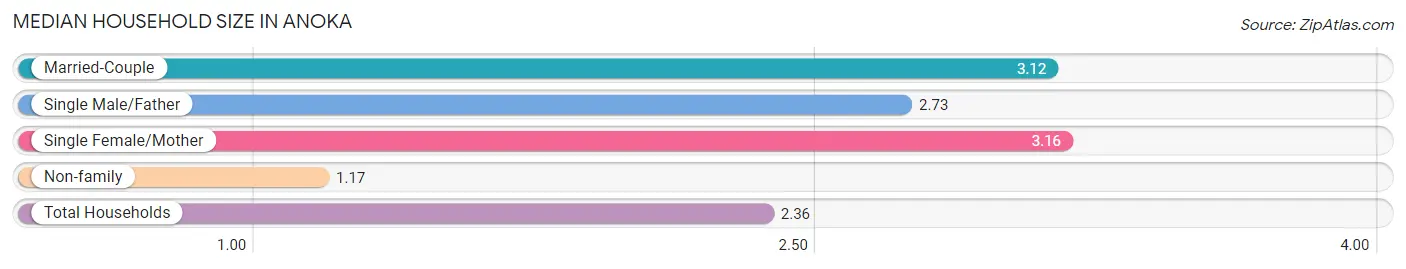
Median Household Size in Anoka
The median household size in Anoka is 2.36 persons per household, with single female/mother households (833 | 11.6%) accounting for the largest median household size of 3.16 persons per household. non-family households (2,721 | 38.0%) represent the smallest median household size with 1.17 persons per household.
| Household Type | # Households | Household Size |
| Married-Couple | 3,204 (44.7%) | 3.12 |
| Single Male/Father | 408 (5.7%) | 2.73 |
| Single Female/Mother | 833 (11.6%) | 3.16 |
| Non-family | 2,721 (38.0%) | 1.17 |
| Total Households | 7,166 (100.0%) | 2.36 |
Household Size by Marriage Status in Anoka
Out of a total of 7,166 households in Anoka, 4,445 (62.0%) are family households, while 2,721 (38.0%) are nonfamily households. The most numerous type of family households are 2-person households, comprising 1,981, and the most common type of nonfamily households are 1-person households, comprising 2,346.
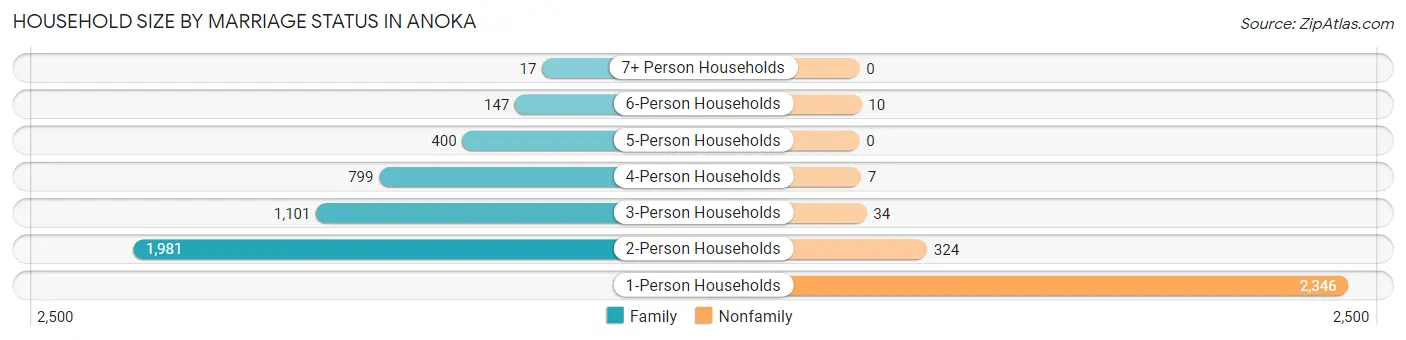
| Household Size | Family Households | Nonfamily Households |
| 1-Person Households | - | 2,346 (32.7%) |
| 2-Person Households | 1,981 (27.6%) | 324 (4.5%) |
| 3-Person Households | 1,101 (15.4%) | 34 (0.5%) |
| 4-Person Households | 799 (11.2%) | 7 (0.1%) |
| 5-Person Households | 400 (5.6%) | 0 (0.0%) |
| 6-Person Households | 147 (2.1%) | 10 (0.1%) |
| 7+ Person Households | 17 (0.2%) | 0 (0.0%) |
| Total | 4,445 (62.0%) | 2,721 (38.0%) |
Female Fertility in Anoka
Fertility by Age in Anoka
Average fertility rate in Anoka is 69.0 births per 1,000 women. Women in the age bracket of 20 to 34 years have the highest fertility rate with 143.0 births per 1,000 women. Women in the age bracket of 20 to 34 years acount for 95.6% of all women with births.
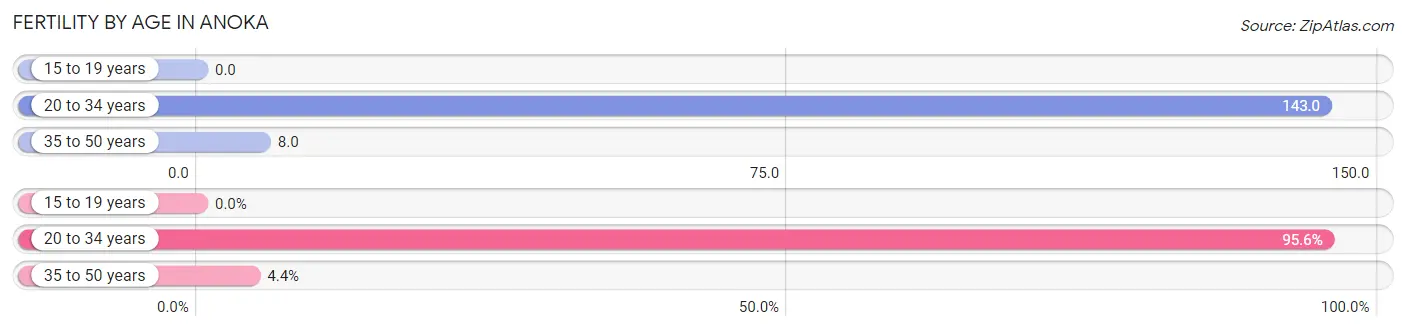
| Age Bracket | Women with Births | Births / 1,000 Women |
| 15 to 19 years | 0 (0.0%) | 0.0 |
| 20 to 34 years | 237 (95.6%) | 143.0 |
| 35 to 50 years | 11 (4.4%) | 8.0 |
| Total | 248 (100.0%) | 69.0 |
Fertility by Age by Marriage Status in Anoka
58.9% of women with births (248) in Anoka are married. The highest percentage of unmarried women with births falls into 35 to 50 years age bracket with 63.6% of them unmarried at the time of birth, while the lowest percentage of unmarried women with births belong to 20 to 34 years age bracket with 40.1% of them unmarried.
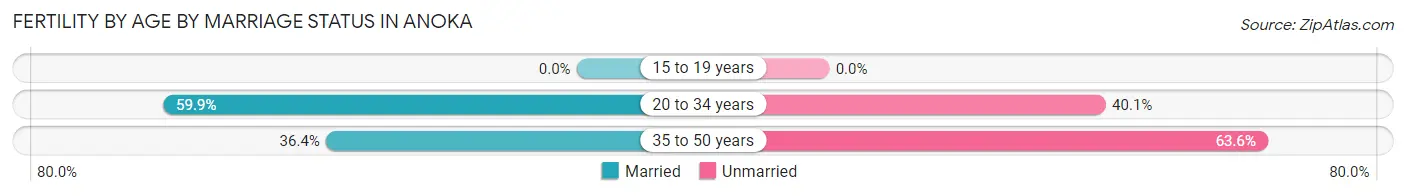
| Age Bracket | Married | Unmarried |
| 15 to 19 years | 0 (0.0%) | 0 (0.0%) |
| 20 to 34 years | 142 (59.9%) | 95 (40.1%) |
| 35 to 50 years | 4 (36.4%) | 7 (63.6%) |
| Total | 146 (58.9%) | 102 (41.1%) |
Fertility by Education in Anoka
Average fertility rate in Anoka is 69.0 births per 1,000 women. Women with the education attainment of graduate degree have the highest fertility rate of 153.0 births per 1,000 women, while women with the education attainment of college or associate's degree have the lowest fertility at 53.0 births per 1,000 women. Women with the education attainment of college or associate's degree represent 25.8% of all women with births.
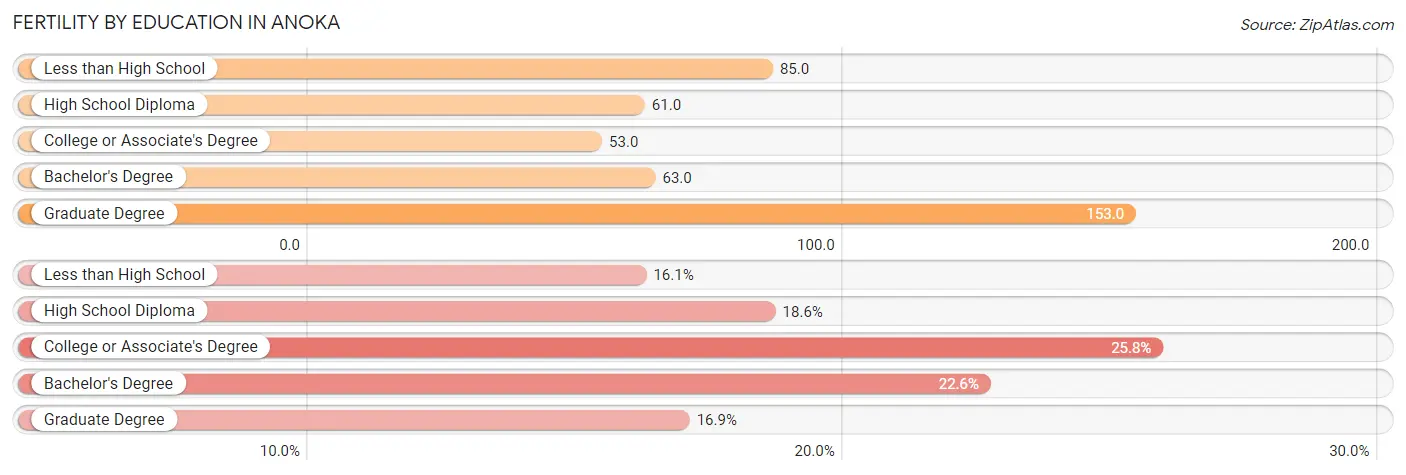
| Educational Attainment | Women with Births | Births / 1,000 Women |
| Less than High School | 40 (16.1%) | 85.0 |
| High School Diploma | 46 (18.5%) | 61.0 |
| College or Associate's Degree | 64 (25.8%) | 53.0 |
| Bachelor's Degree | 56 (22.6%) | 63.0 |
| Graduate Degree | 42 (16.9%) | 153.0 |
| Total | 248 (100.0%) | 69.0 |
Fertility by Education by Marriage Status in Anoka
41.1% of women with births in Anoka are unmarried. Women with the educational attainment of less than high school are most likely to be married with 100.0% of them married at childbirth, while women with the educational attainment of college or associate's degree are least likely to be married with 100.0% of them unmarried at childbirth.
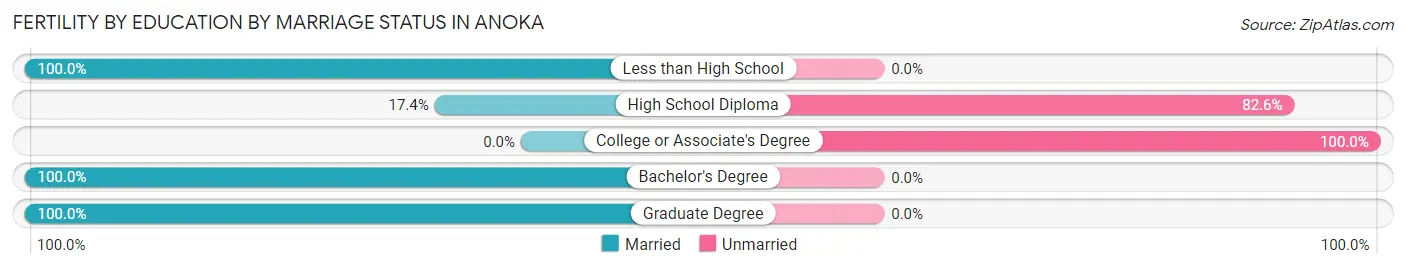
| Educational Attainment | Married | Unmarried |
| Less than High School | 40 (100.0%) | 0 (0.0%) |
| High School Diploma | 8 (17.4%) | 38 (82.6%) |
| College or Associate's Degree | 0 (0.0%) | 64 (100.0%) |
| Bachelor's Degree | 56 (100.0%) | 0 (0.0%) |
| Graduate Degree | 42 (100.0%) | 0 (0.0%) |
| Total | 146 (58.9%) | 102 (41.1%) |
Employment Characteristics in Anoka
Employment by Class of Employer in Anoka
Among the 8,429 employed individuals in Anoka, private company employees (6,334 | 75.1%), local government employees (656 | 7.8%), and not-for-profit organizations (496 | 5.9%) make up the most common classes of employment.
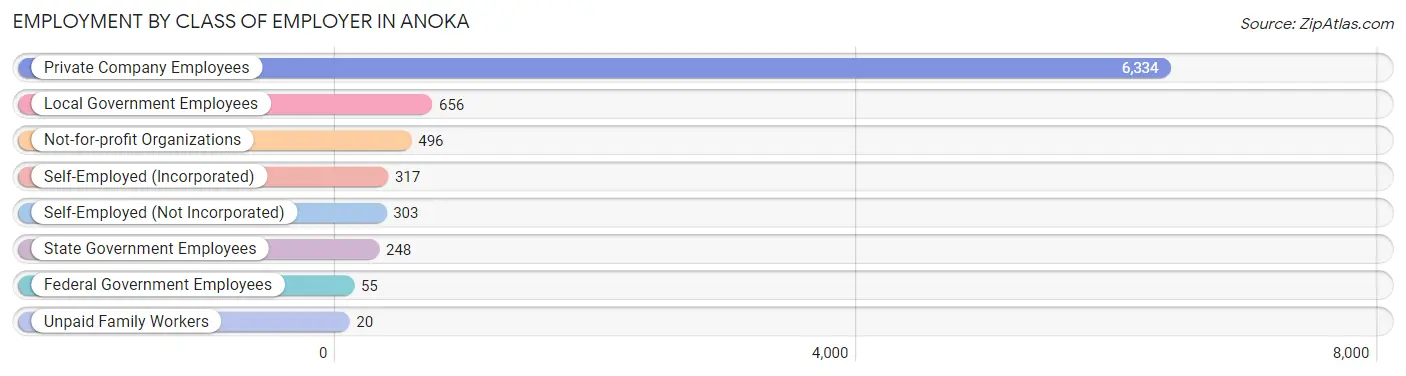
| Employer Class | # Employees | % Employees |
| Private Company Employees | 6,334 | 75.1% |
| Self-Employed (Incorporated) | 317 | 3.8% |
| Self-Employed (Not Incorporated) | 303 | 3.6% |
| Not-for-profit Organizations | 496 | 5.9% |
| Local Government Employees | 656 | 7.8% |
| State Government Employees | 248 | 2.9% |
| Federal Government Employees | 55 | 0.6% |
| Unpaid Family Workers | 20 | 0.2% |
| Total | 8,429 | 100.0% |
Employment Status by Age in Anoka
According to the labor force statistics for Anoka, out of the total population over 16 years of age (14,461), 62.5% or 9,038 individuals are in the labor force, with 5.2% or 470 of them unemployed. The age group with the highest labor force participation rate is 25 to 29 years, with 87.0% or 1,133 individuals in the labor force. Within the labor force, the 75 years and over age range has the highest percentage of unemployed individuals, with 20.5% or 9 of them being unemployed.
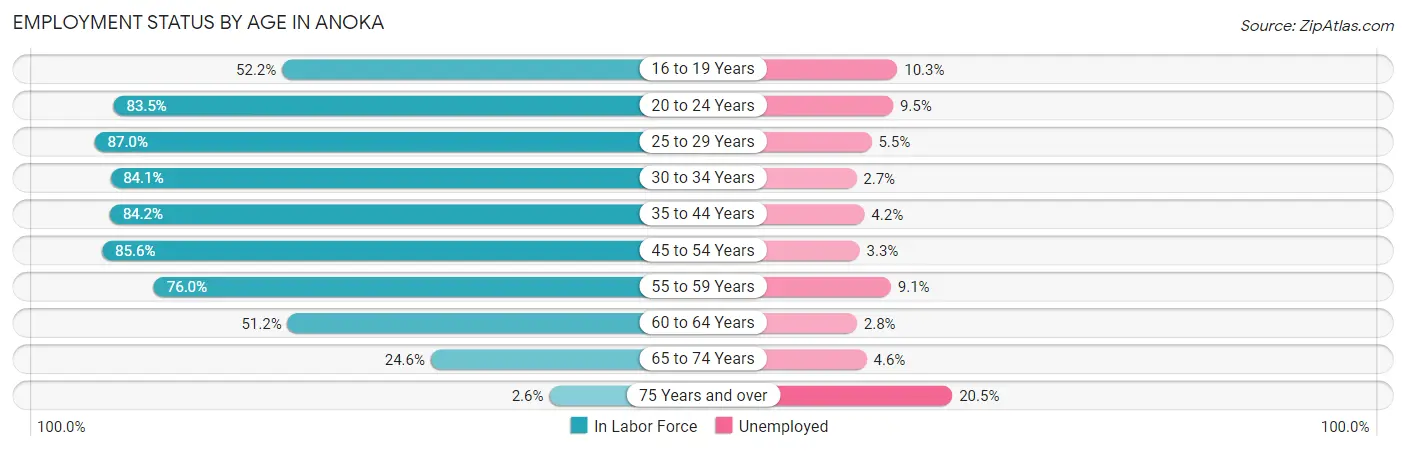
| Age Bracket | In Labor Force | Unemployed |
| 16 to 19 Years | 437 (52.2%) | 45 (10.3%) |
| 20 to 24 Years | 707 (83.5%) | 67 (9.5%) |
| 25 to 29 Years | 1,133 (87.0%) | 62 (5.5%) |
| 30 to 34 Years | 1,227 (84.1%) | 33 (2.7%) |
| 35 to 44 Years | 1,843 (84.2%) | 77 (4.2%) |
| 45 to 54 Years | 1,650 (85.6%) | 54 (3.3%) |
| 55 to 59 Years | 916 (76.0%) | 83 (9.1%) |
| 60 to 64 Years | 640 (51.2%) | 18 (2.8%) |
| 65 to 74 Years | 439 (24.6%) | 20 (4.6%) |
| 75 Years and over | 43 (2.6%) | 9 (20.5%) |
| Total | 9,038 (62.5%) | 470 (5.2%) |
Employment Status by Educational Attainment in Anoka
According to labor force statistics for Anoka, 79.4% of individuals (7,410) out of the total population between 25 and 64 years of age (9,332) are in the labor force, with 4.4% or 326 of them being unemployed. The group with the highest labor force participation rate are those with the educational attainment of bachelor's degree or higher, with 86.2% or 2,343 individuals in the labor force. Within the labor force, individuals with less than high school education have the highest percentage of unemployment, with 12.1% or 40 of them being unemployed.
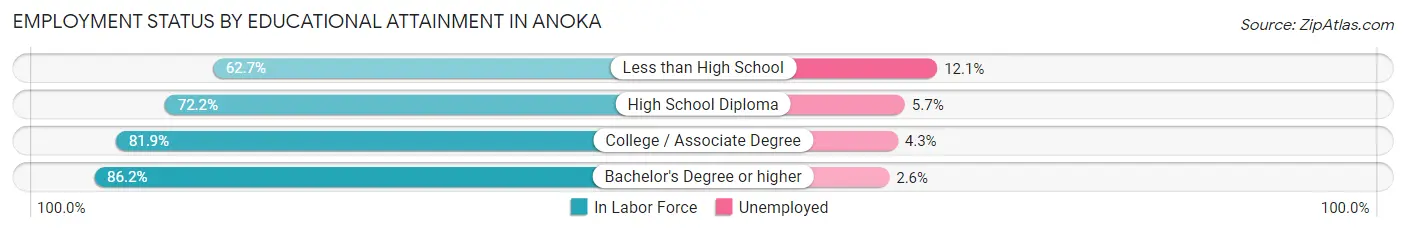
| Educational Attainment | In Labor Force | Unemployed |
| Less than High School | 331 (62.7%) | 64 (12.1%) |
| High School Diploma | 1,828 (72.2%) | 144 (5.7%) |
| College / Associate Degree | 2,911 (81.9%) | 153 (4.3%) |
| Bachelor's Degree or higher | 2,343 (86.2%) | 71 (2.6%) |
| Total | 7,410 (79.4%) | 411 (4.4%) |
Employment Occupations by Sex in Anoka
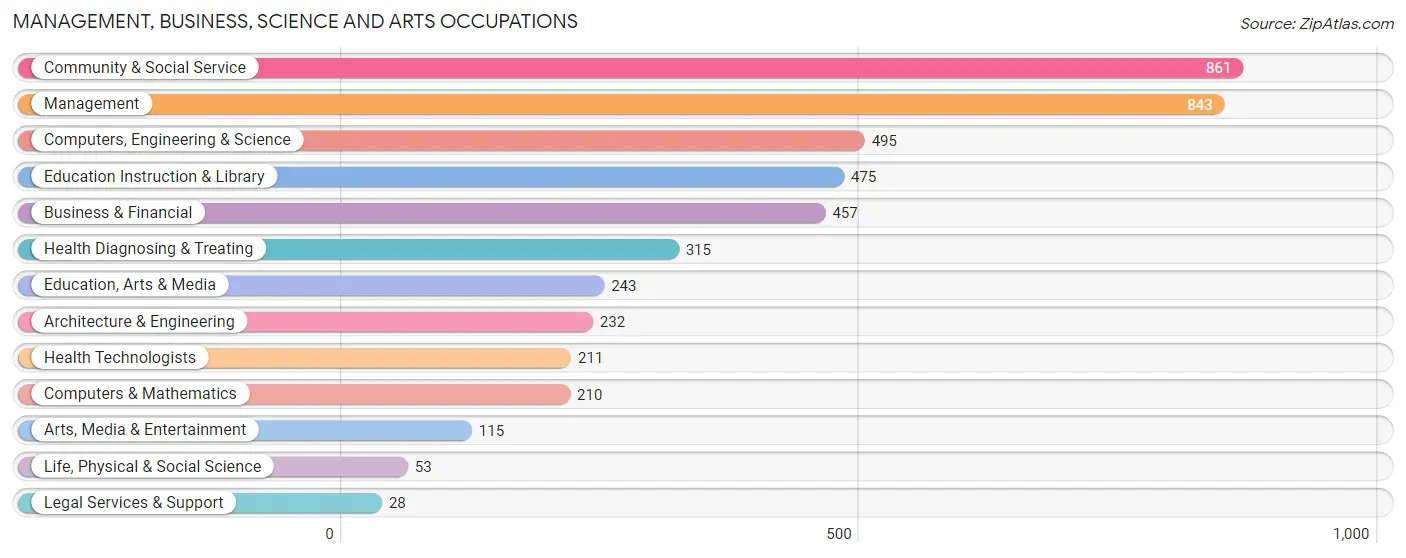
Management, Business, Science and Arts Occupations
The most common Management, Business, Science and Arts occupations in Anoka are Community & Social Service (861 | 10.1%), Management (843 | 9.9%), Computers, Engineering & Science (495 | 5.8%), Education Instruction & Library (475 | 5.6%), and Business & Financial (457 | 5.3%).
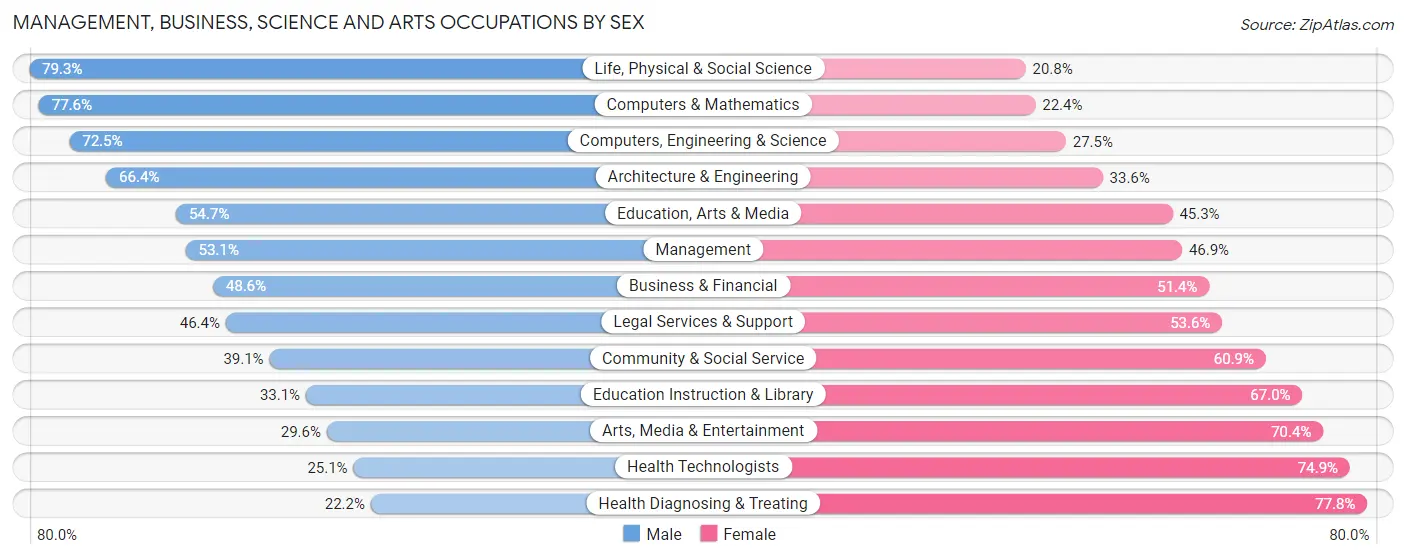
Management, Business, Science and Arts Occupations by Sex
Within the Management, Business, Science and Arts occupations in Anoka, the most male-oriented occupations are Life, Physical & Social Science (79.2%), Computers & Mathematics (77.6%), and Computers, Engineering & Science (72.5%), while the most female-oriented occupations are Health Diagnosing & Treating (77.8%), Health Technologists (74.9%), and Arts, Media & Entertainment (70.4%).
| Occupation | Male | Female |
| Management | 448 (53.1%) | 395 (46.9%) |
| Business & Financial | 222 (48.6%) | 235 (51.4%) |
| Computers, Engineering & Science | 359 (72.5%) | 136 (27.5%) |
| Computers & Mathematics | 163 (77.6%) | 47 (22.4%) |
| Architecture & Engineering | 154 (66.4%) | 78 (33.6%) |
| Life, Physical & Social Science | 42 (79.2%) | 11 (20.7%) |
| Community & Social Service | 337 (39.1%) | 524 (60.9%) |
| Education, Arts & Media | 133 (54.7%) | 110 (45.3%) |
| Legal Services & Support | 13 (46.4%) | 15 (53.6%) |
| Education Instruction & Library | 157 (33.1%) | 318 (66.9%) |
| Arts, Media & Entertainment | 34 (29.6%) | 81 (70.4%) |
| Health Diagnosing & Treating | 70 (22.2%) | 245 (77.8%) |
| Health Technologists | 53 (25.1%) | 158 (74.9%) |
| Total (Category) | 1,436 (48.3%) | 1,535 (51.7%) |
| Total (Overall) | 4,808 (56.2%) | 3,751 (43.8%) |
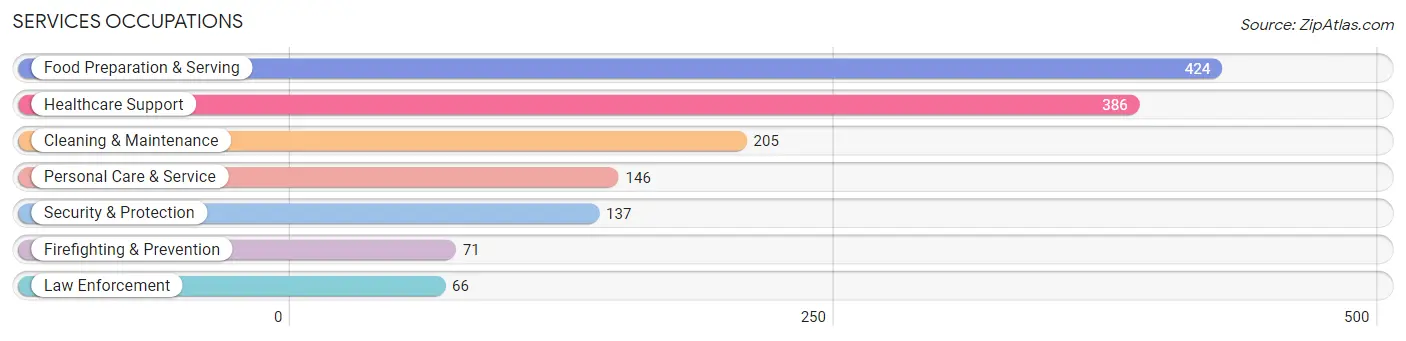
Services Occupations
The most common Services occupations in Anoka are Food Preparation & Serving (424 | 5.0%), Healthcare Support (386 | 4.5%), Cleaning & Maintenance (205 | 2.4%), Personal Care & Service (146 | 1.7%), and Security & Protection (137 | 1.6%).
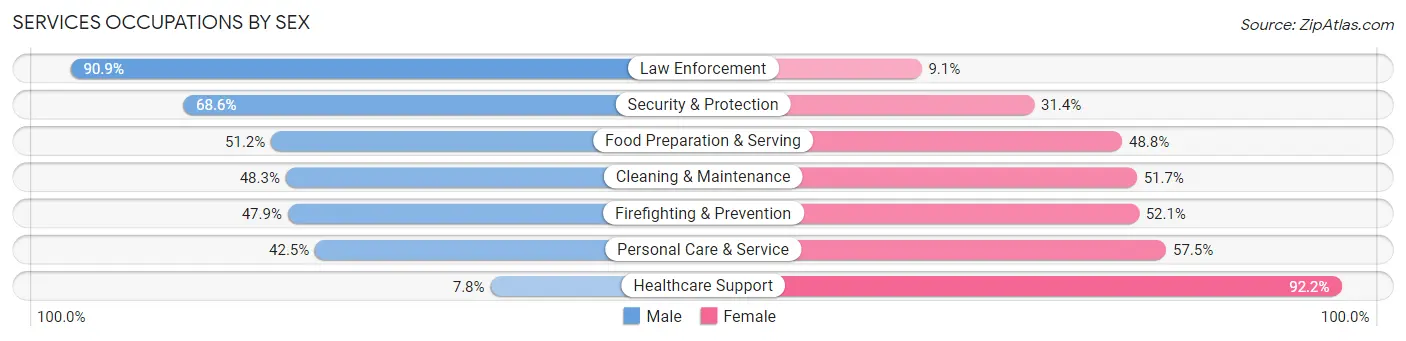
Services Occupations by Sex
Within the Services occupations in Anoka, the most male-oriented occupations are Law Enforcement (90.9%), Security & Protection (68.6%), and Food Preparation & Serving (51.2%), while the most female-oriented occupations are Healthcare Support (92.2%), Personal Care & Service (57.5%), and Firefighting & Prevention (52.1%).
| Occupation | Male | Female |
| Healthcare Support | 30 (7.8%) | 356 (92.2%) |
| Security & Protection | 94 (68.6%) | 43 (31.4%) |
| Firefighting & Prevention | 34 (47.9%) | 37 (52.1%) |
| Law Enforcement | 60 (90.9%) | 6 (9.1%) |
| Food Preparation & Serving | 217 (51.2%) | 207 (48.8%) |
| Cleaning & Maintenance | 99 (48.3%) | 106 (51.7%) |
| Personal Care & Service | 62 (42.5%) | 84 (57.5%) |
| Total (Category) | 502 (38.7%) | 796 (61.3%) |
| Total (Overall) | 4,808 (56.2%) | 3,751 (43.8%) |
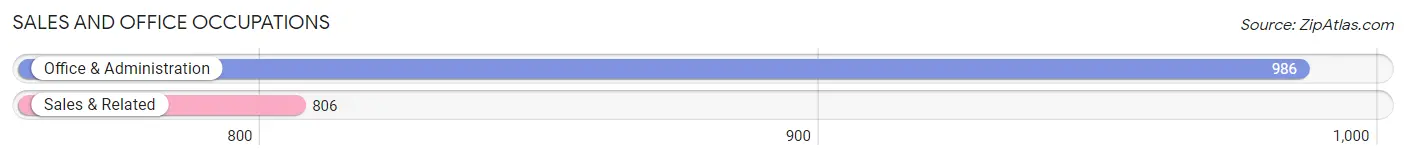
Sales and Office Occupations
The most common Sales and Office occupations in Anoka are Office & Administration (986 | 11.5%), and Sales & Related (806 | 9.4%).
Sales and Office Occupations by Sex
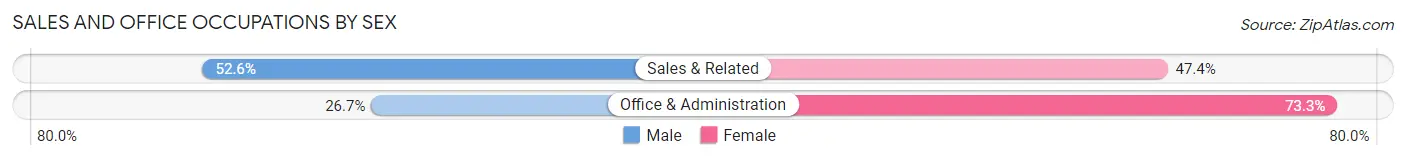
| Occupation | Male | Female |
| Sales & Related | 424 (52.6%) | 382 (47.4%) |
| Office & Administration | 263 (26.7%) | 723 (73.3%) |
| Total (Category) | 687 (38.3%) | 1,105 (61.7%) |
| Total (Overall) | 4,808 (56.2%) | 3,751 (43.8%) |
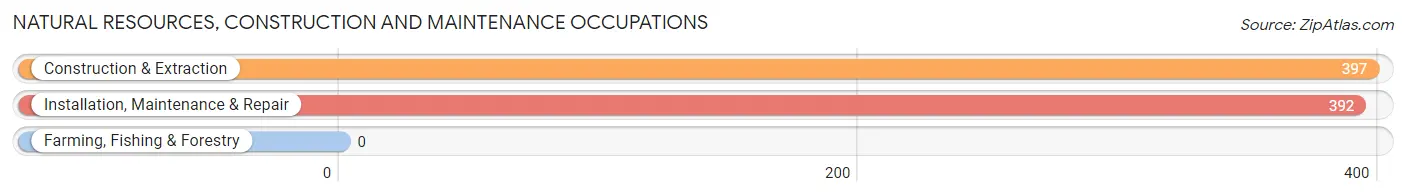
Natural Resources, Construction and Maintenance Occupations
The most common Natural Resources, Construction and Maintenance occupations in Anoka are Construction & Extraction (397 | 4.6%), and Installation, Maintenance & Repair (392 | 4.6%).
Natural Resources, Construction and Maintenance Occupations by Sex
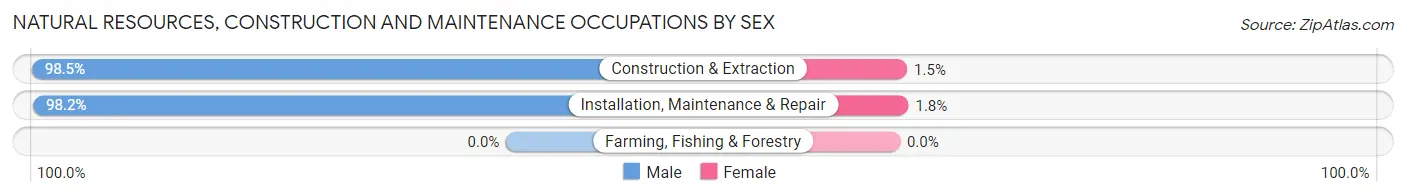
| Occupation | Male | Female |
| Farming, Fishing & Forestry | 0 (0.0%) | 0 (0.0%) |
| Construction & Extraction | 391 (98.5%) | 6 (1.5%) |
| Installation, Maintenance & Repair | 385 (98.2%) | 7 (1.8%) |
| Total (Category) | 776 (98.4%) | 13 (1.7%) |
| Total (Overall) | 4,808 (56.2%) | 3,751 (43.8%) |
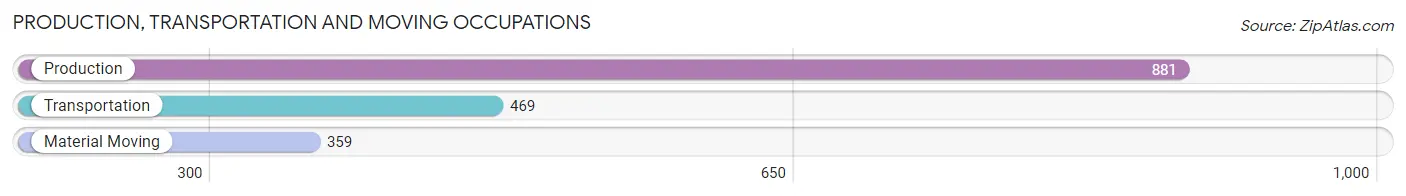
Production, Transportation and Moving Occupations
The most common Production, Transportation and Moving occupations in Anoka are Production (881 | 10.3%), Transportation (469 | 5.5%), and Material Moving (359 | 4.2%).
Production, Transportation and Moving Occupations by Sex
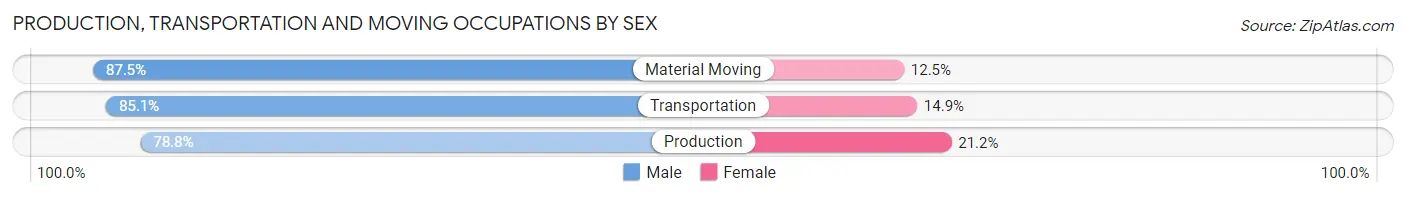
| Occupation | Male | Female |
| Production | 694 (78.8%) | 187 (21.2%) |
| Transportation | 399 (85.1%) | 70 (14.9%) |
| Material Moving | 314 (87.5%) | 45 (12.5%) |
| Total (Category) | 1,407 (82.3%) | 302 (17.7%) |
| Total (Overall) | 4,808 (56.2%) | 3,751 (43.8%) |
Employment Industries by Sex in Anoka
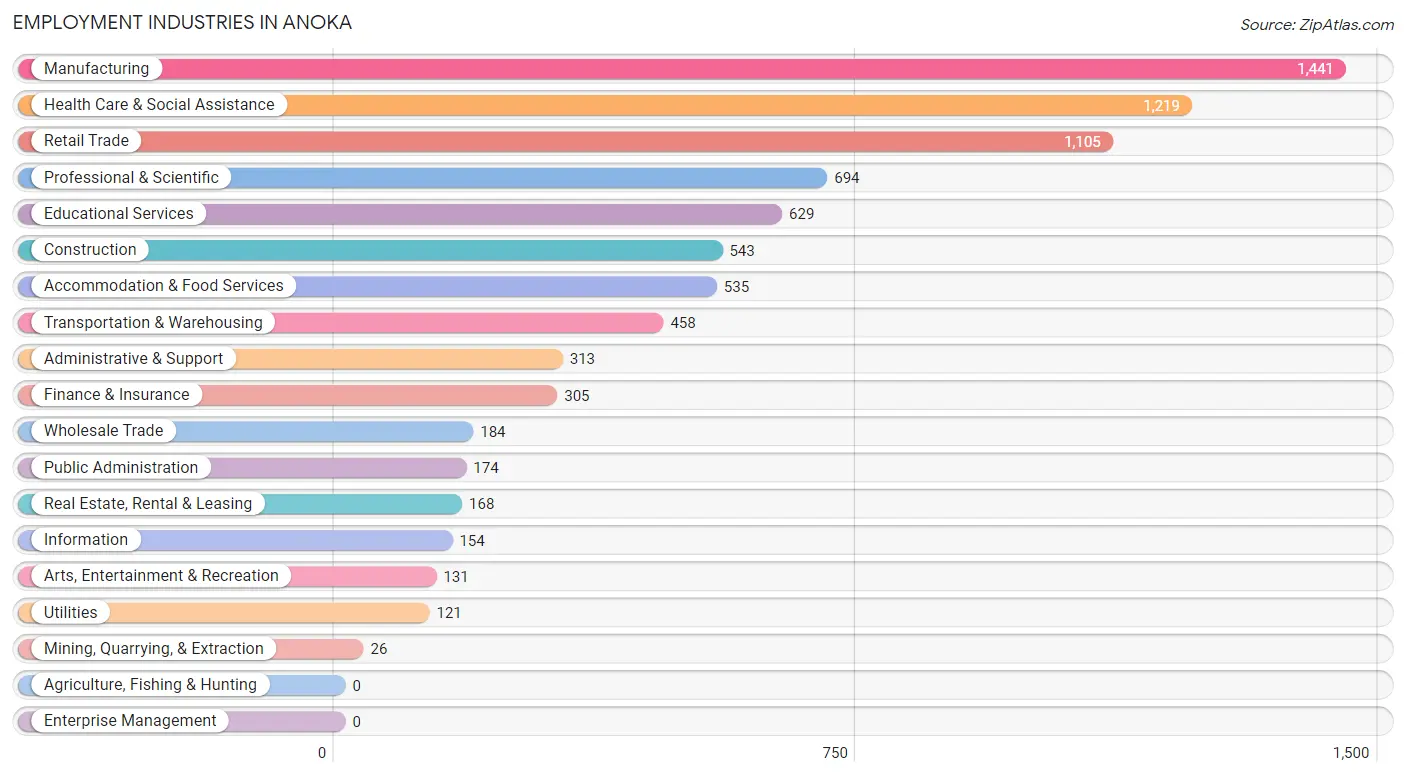
Employment Industries in Anoka
The major employment industries in Anoka include Manufacturing (1,441 | 16.8%), Health Care & Social Assistance (1,219 | 14.2%), Retail Trade (1,105 | 12.9%), Professional & Scientific (694 | 8.1%), and Educational Services (629 | 7.3%).
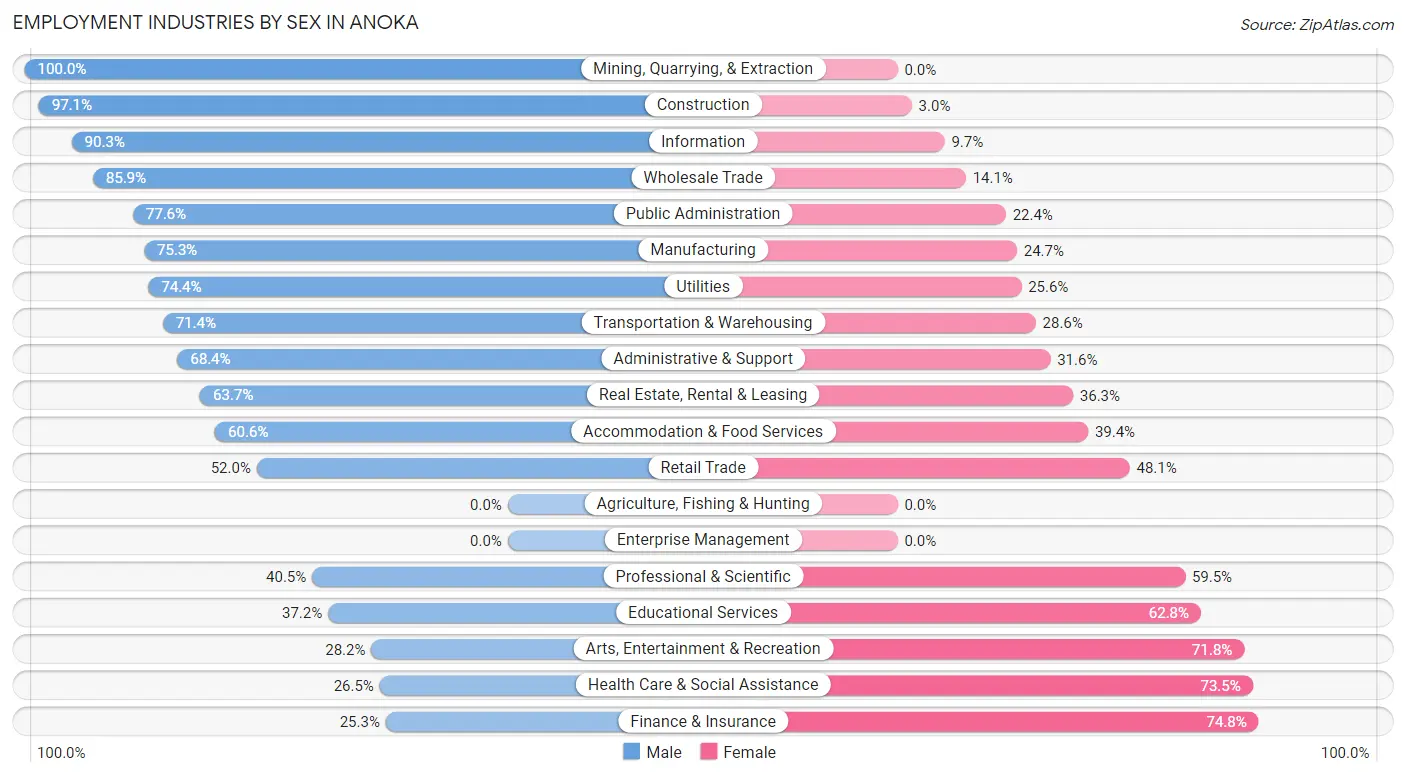
Employment Industries by Sex in Anoka
The Anoka industries that see more men than women are Mining, Quarrying, & Extraction (100.0%), Construction (97.1%), and Information (90.3%), whereas the industries that tend to have a higher number of women are Finance & Insurance (74.8%), Health Care & Social Assistance (73.5%), and Arts, Entertainment & Recreation (71.8%).
| Industry | Male | Female |
| Agriculture, Fishing & Hunting | 0 (0.0%) | 0 (0.0%) |
| Mining, Quarrying, & Extraction | 26 (100.0%) | 0 (0.0%) |
| Construction | 527 (97.1%) | 16 (2.9%) |
| Manufacturing | 1,085 (75.3%) | 356 (24.7%) |
| Wholesale Trade | 158 (85.9%) | 26 (14.1%) |
| Retail Trade | 574 (51.9%) | 531 (48.0%) |
| Transportation & Warehousing | 327 (71.4%) | 131 (28.6%) |
| Utilities | 90 (74.4%) | 31 (25.6%) |
| Information | 139 (90.3%) | 15 (9.7%) |
| Finance & Insurance | 77 (25.3%) | 228 (74.8%) |
| Real Estate, Rental & Leasing | 107 (63.7%) | 61 (36.3%) |
| Professional & Scientific | 281 (40.5%) | 413 (59.5%) |
| Enterprise Management | 0 (0.0%) | 0 (0.0%) |
| Administrative & Support | 214 (68.4%) | 99 (31.6%) |
| Educational Services | 234 (37.2%) | 395 (62.8%) |
| Health Care & Social Assistance | 323 (26.5%) | 896 (73.5%) |
| Arts, Entertainment & Recreation | 37 (28.2%) | 94 (71.8%) |
| Accommodation & Food Services | 324 (60.6%) | 211 (39.4%) |
| Public Administration | 135 (77.6%) | 39 (22.4%) |
| Total | 4,808 (56.2%) | 3,751 (43.8%) |
Education in Anoka
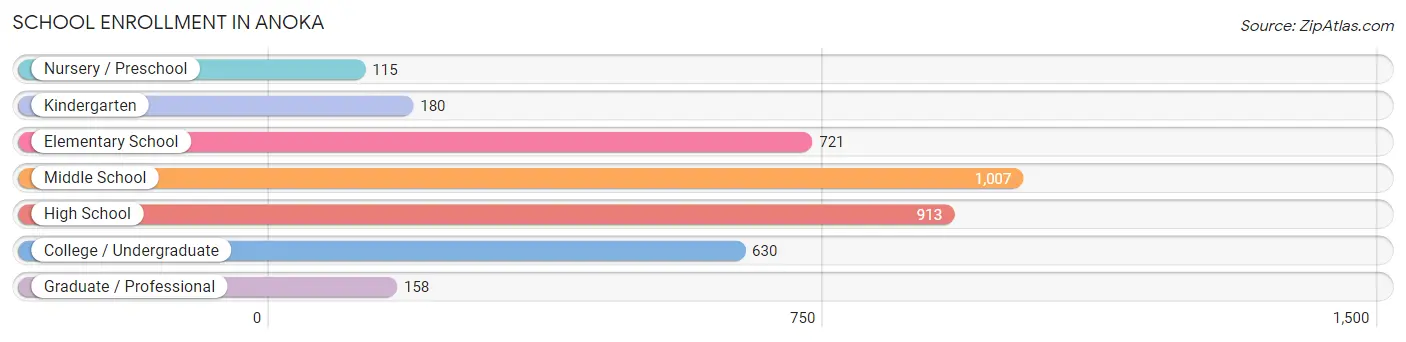
School Enrollment in Anoka
The most common levels of schooling among the 3,724 students in Anoka are middle school (1,007 | 27.0%), high school (913 | 24.5%), and elementary school (721 | 19.4%).
| School Level | # Students | % Students |
| Nursery / Preschool | 115 | 3.1% |
| Kindergarten | 180 | 4.8% |
| Elementary School | 721 | 19.4% |
| Middle School | 1,007 | 27.0% |
| High School | 913 | 24.5% |
| College / Undergraduate | 630 | 16.9% |
| Graduate / Professional | 158 | 4.2% |
| Total | 3,724 | 100.0% |
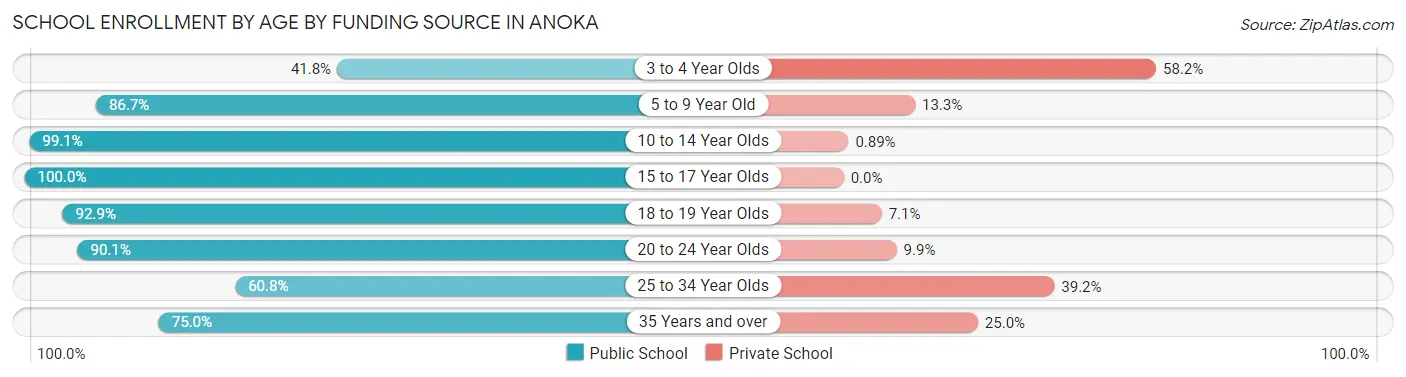
School Enrollment by Age by Funding Source in Anoka
Out of a total of 3,724 students who are enrolled in schools in Anoka, 372 (10.0%) attend a private institution, while the remaining 3,352 (90.0%) are enrolled in public schools. The age group of 3 to 4 year olds has the highest likelihood of being enrolled in private schools, with 64 (58.2% in the age bracket) enrolled. Conversely, the age group of 15 to 17 year olds has the lowest likelihood of being enrolled in a private school, with 679 (100.0% in the age bracket) attending a public institution.
| Age Bracket | Public School | Private School |
| 3 to 4 Year Olds | 46 (41.8%) | 64 (58.2%) |
| 5 to 9 Year Old | 652 (86.7%) | 100 (13.3%) |
| 10 to 14 Year Olds | 1,226 (99.1%) | 11 (0.9%) |
| 15 to 17 Year Olds | 679 (100.0%) | 0 (0.0%) |
| 18 to 19 Year Olds | 197 (92.9%) | 15 (7.1%) |
| 20 to 24 Year Olds | 210 (90.1%) | 23 (9.9%) |
| 25 to 34 Year Olds | 144 (60.8%) | 93 (39.2%) |
| 35 Years and over | 198 (75.0%) | 66 (25.0%) |
| Total | 3,352 (90.0%) | 372 (10.0%) |
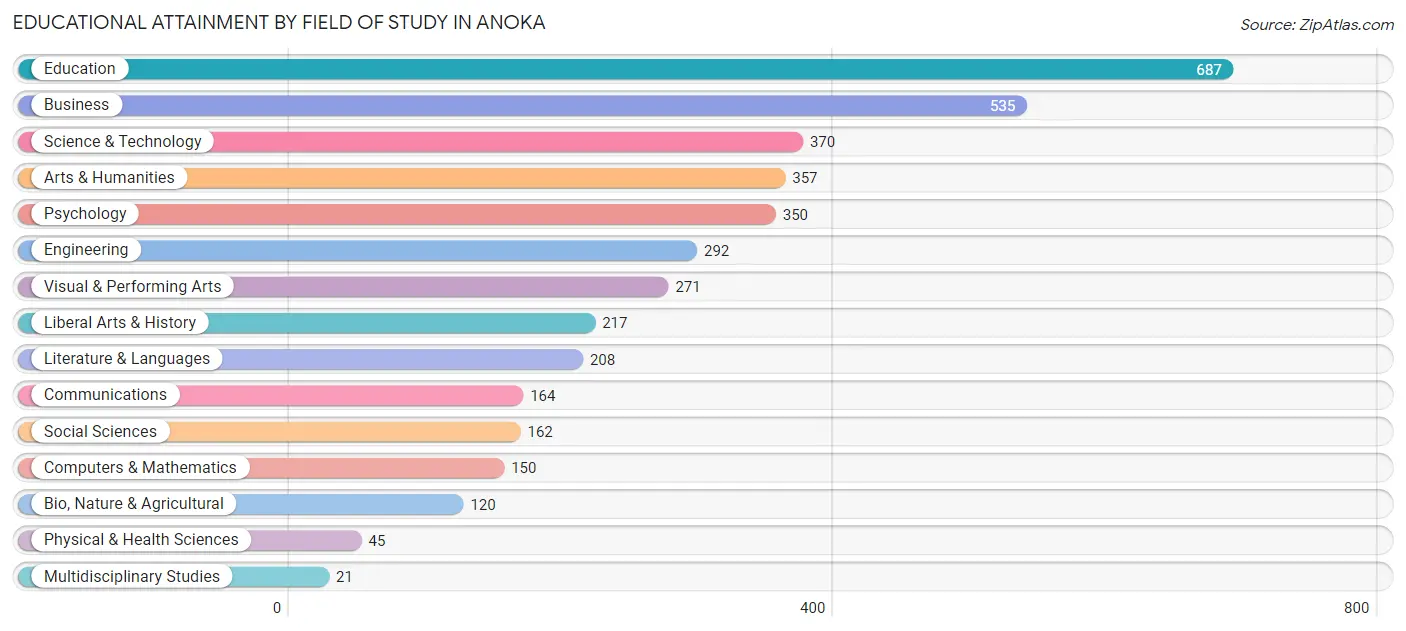
Educational Attainment by Field of Study in Anoka
Education (687 | 17.4%), business (535 | 13.6%), science & technology (370 | 9.4%), arts & humanities (357 | 9.0%), and psychology (350 | 8.9%) are the most common fields of study among 3,949 individuals in Anoka who have obtained a bachelor's degree or higher.
| Field of Study | # Graduates | % Graduates |
| Computers & Mathematics | 150 | 3.8% |
| Bio, Nature & Agricultural | 120 | 3.0% |
| Physical & Health Sciences | 45 | 1.1% |
| Psychology | 350 | 8.9% |
| Social Sciences | 162 | 4.1% |
| Engineering | 292 | 7.4% |
| Multidisciplinary Studies | 21 | 0.5% |
| Science & Technology | 370 | 9.4% |
| Business | 535 | 13.6% |
| Education | 687 | 17.4% |
| Literature & Languages | 208 | 5.3% |
| Liberal Arts & History | 217 | 5.5% |
| Visual & Performing Arts | 271 | 6.9% |
| Communications | 164 | 4.2% |
| Arts & Humanities | 357 | 9.0% |
| Total | 3,949 | 100.0% |
Transportation & Commute in Anoka
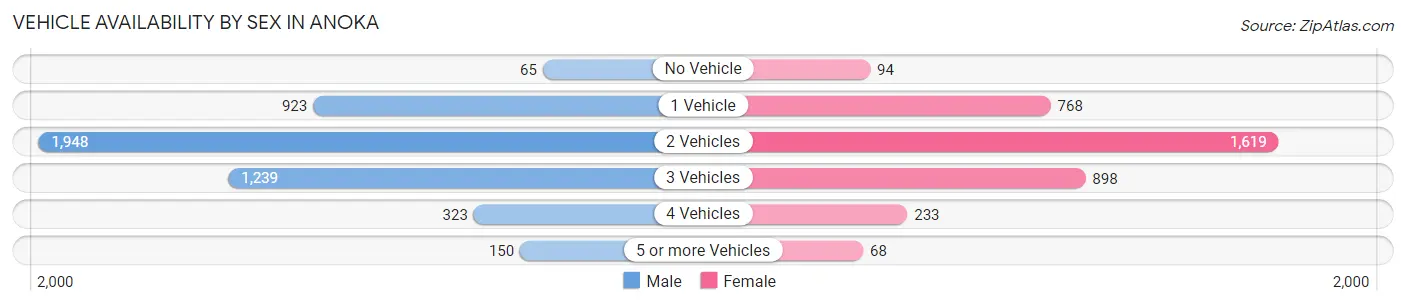
Vehicle Availability by Sex in Anoka
The most prevalent vehicle ownership categories in Anoka are males with 2 vehicles (1,948, accounting for 41.9%) and females with 2 vehicles (1,619, making up 52.9%).
| Vehicles Available | Male | Female |
| No Vehicle | 65 (1.4%) | 94 (2.5%) |
| 1 Vehicle | 923 (19.9%) | 768 (20.9%) |
| 2 Vehicles | 1,948 (41.9%) | 1,619 (44.0%) |
| 3 Vehicles | 1,239 (26.7%) | 898 (24.4%) |
| 4 Vehicles | 323 (7.0%) | 233 (6.3%) |
| 5 or more Vehicles | 150 (3.2%) | 68 (1.8%) |
| Total | 4,648 (100.0%) | 3,680 (100.0%) |
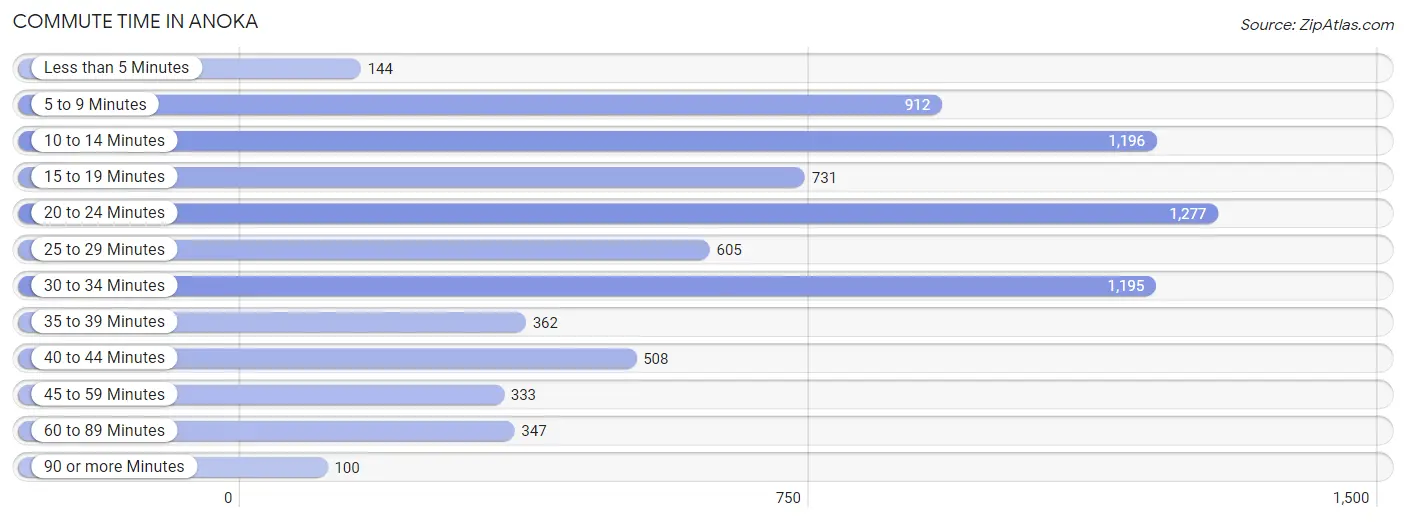
Commute Time in Anoka
The most frequently occuring commute durations in Anoka are 20 to 24 minutes (1,277 commuters, 16.6%), 10 to 14 minutes (1,196 commuters, 15.5%), and 30 to 34 minutes (1,195 commuters, 15.5%).
| Commute Time | # Commuters | % Commuters |
| Less than 5 Minutes | 144 | 1.9% |
| 5 to 9 Minutes | 912 | 11.8% |
| 10 to 14 Minutes | 1,196 | 15.5% |
| 15 to 19 Minutes | 731 | 9.5% |
| 20 to 24 Minutes | 1,277 | 16.6% |
| 25 to 29 Minutes | 605 | 7.9% |
| 30 to 34 Minutes | 1,195 | 15.5% |
| 35 to 39 Minutes | 362 | 4.7% |
| 40 to 44 Minutes | 508 | 6.6% |
| 45 to 59 Minutes | 333 | 4.3% |
| 60 to 89 Minutes | 347 | 4.5% |
| 90 or more Minutes | 100 | 1.3% |
Commute Time by Sex in Anoka
The most common commute times in Anoka are 30 to 34 minutes (802 commuters, 17.9%) for males and 10 to 14 minutes (625 commuters, 19.3%) for females.
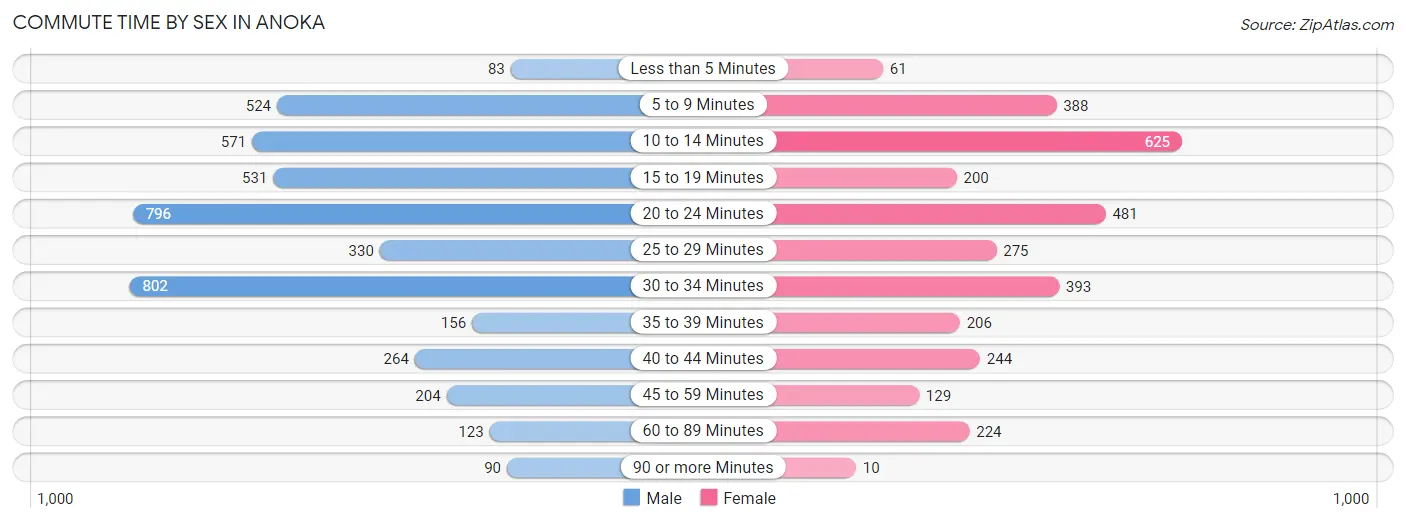
| Commute Time | Male | Female |
| Less than 5 Minutes | 83 (1.9%) | 61 (1.9%) |
| 5 to 9 Minutes | 524 (11.7%) | 388 (12.0%) |
| 10 to 14 Minutes | 571 (12.8%) | 625 (19.3%) |
| 15 to 19 Minutes | 531 (11.9%) | 200 (6.2%) |
| 20 to 24 Minutes | 796 (17.8%) | 481 (14.9%) |
| 25 to 29 Minutes | 330 (7.4%) | 275 (8.5%) |
| 30 to 34 Minutes | 802 (17.9%) | 393 (12.1%) |
| 35 to 39 Minutes | 156 (3.5%) | 206 (6.4%) |
| 40 to 44 Minutes | 264 (5.9%) | 244 (7.5%) |
| 45 to 59 Minutes | 204 (4.6%) | 129 (4.0%) |
| 60 to 89 Minutes | 123 (2.8%) | 224 (6.9%) |
| 90 or more Minutes | 90 (2.0%) | 10 (0.3%) |
Time of Departure to Work by Sex in Anoka
The most frequent times of departure to work in Anoka are 6:00 AM to 6:29 AM (628, 14.0%) for males and 6:30 AM to 6:59 AM (491, 15.2%) for females.
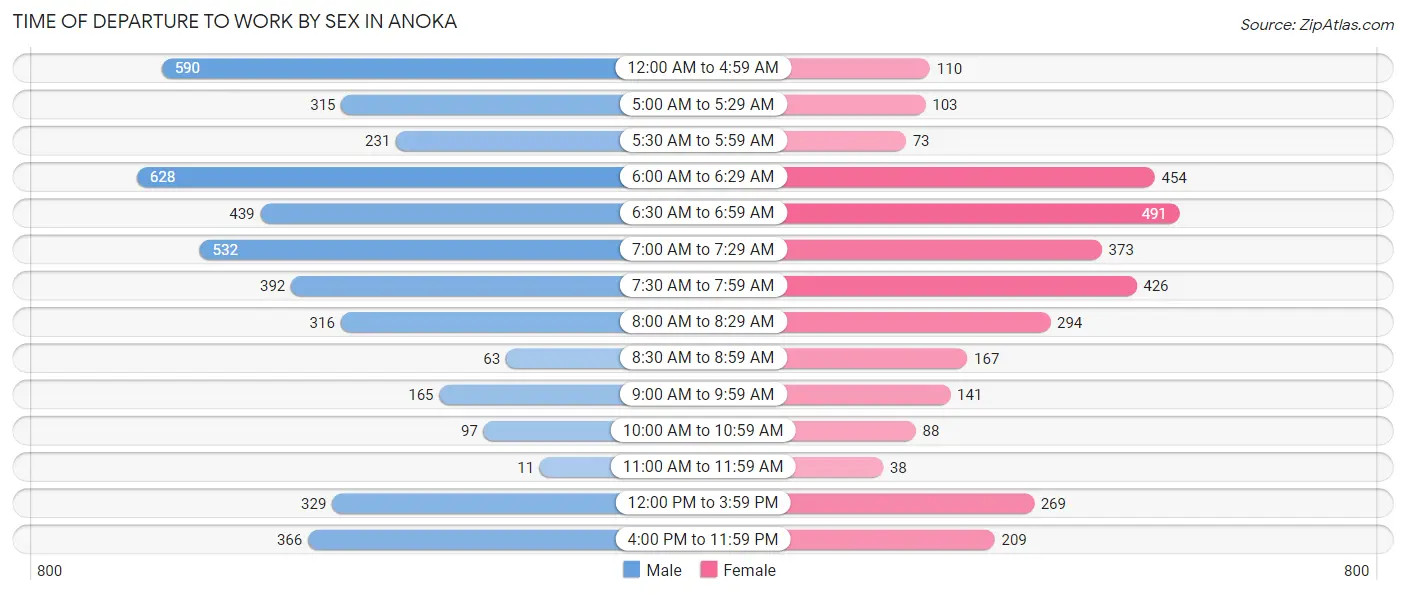
| Time of Departure | Male | Female |
| 12:00 AM to 4:59 AM | 590 (13.2%) | 110 (3.4%) |
| 5:00 AM to 5:29 AM | 315 (7.0%) | 103 (3.2%) |
| 5:30 AM to 5:59 AM | 231 (5.2%) | 73 (2.3%) |
| 6:00 AM to 6:29 AM | 628 (14.0%) | 454 (14.0%) |
| 6:30 AM to 6:59 AM | 439 (9.8%) | 491 (15.2%) |
| 7:00 AM to 7:29 AM | 532 (11.9%) | 373 (11.5%) |
| 7:30 AM to 7:59 AM | 392 (8.8%) | 426 (13.2%) |
| 8:00 AM to 8:29 AM | 316 (7.1%) | 294 (9.1%) |
| 8:30 AM to 8:59 AM | 63 (1.4%) | 167 (5.2%) |
| 9:00 AM to 9:59 AM | 165 (3.7%) | 141 (4.4%) |
| 10:00 AM to 10:59 AM | 97 (2.2%) | 88 (2.7%) |
| 11:00 AM to 11:59 AM | 11 (0.3%) | 38 (1.2%) |
| 12:00 PM to 3:59 PM | 329 (7.3%) | 269 (8.3%) |
| 4:00 PM to 11:59 PM | 366 (8.2%) | 209 (6.5%) |
| Total | 4,474 (100.0%) | 3,236 (100.0%) |
Housing Occupancy in Anoka
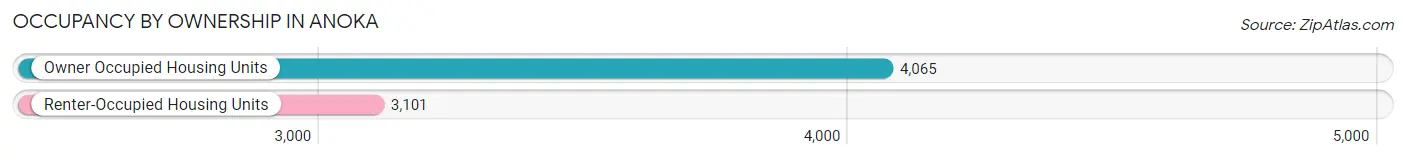
Occupancy by Ownership in Anoka
Of the total 7,166 dwellings in Anoka, owner-occupied units account for 4,065 (56.7%), while renter-occupied units make up 3,101 (43.3%).
| Occupancy | # Housing Units | % Housing Units |
| Owner Occupied Housing Units | 4,065 | 56.7% |
| Renter-Occupied Housing Units | 3,101 | 43.3% |
| Total Occupied Housing Units | 7,166 | 100.0% |
Occupancy by Household Size in Anoka
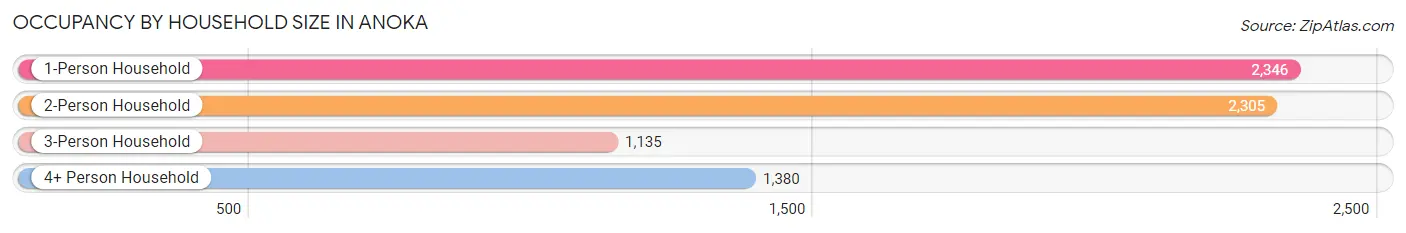
| Household Size | # Housing Units | % Housing Units |
| 1-Person Household | 2,346 | 32.7% |
| 2-Person Household | 2,305 | 32.2% |
| 3-Person Household | 1,135 | 15.8% |
| 4+ Person Household | 1,380 | 19.3% |
| Total Housing Units | 7,166 | 100.0% |
Occupancy by Ownership by Household Size in Anoka
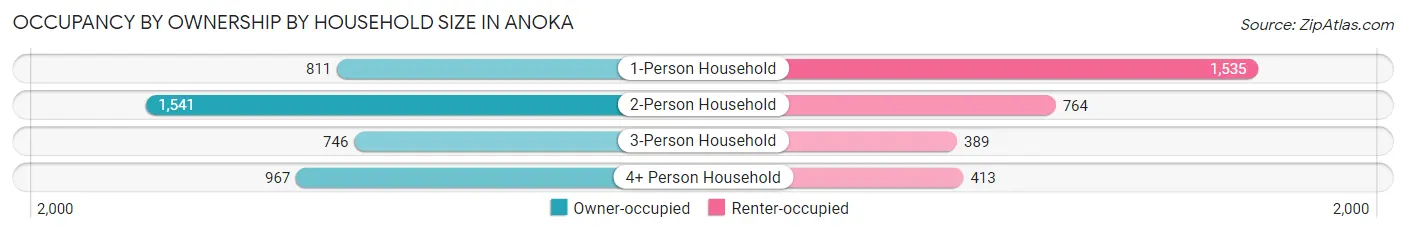
| Household Size | Owner-occupied | Renter-occupied |
| 1-Person Household | 811 (34.6%) | 1,535 (65.4%) |
| 2-Person Household | 1,541 (66.8%) | 764 (33.2%) |
| 3-Person Household | 746 (65.7%) | 389 (34.3%) |
| 4+ Person Household | 967 (70.1%) | 413 (29.9%) |
| Total Housing Units | 4,065 (56.7%) | 3,101 (43.3%) |
Occupancy by Educational Attainment in Anoka
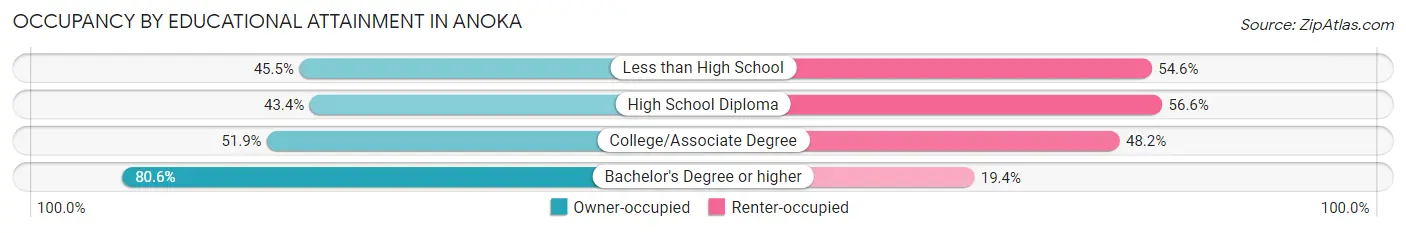
| Household Size | Owner-occupied | Renter-occupied |
| Less than High School | 165 (45.5%) | 198 (54.5%) |
| High School Diploma | 859 (43.4%) | 1,120 (56.6%) |
| College/Associate Degree | 1,529 (51.8%) | 1,420 (48.1%) |
| Bachelor's Degree or higher | 1,512 (80.6%) | 363 (19.4%) |
Occupancy by Age of Householder in Anoka
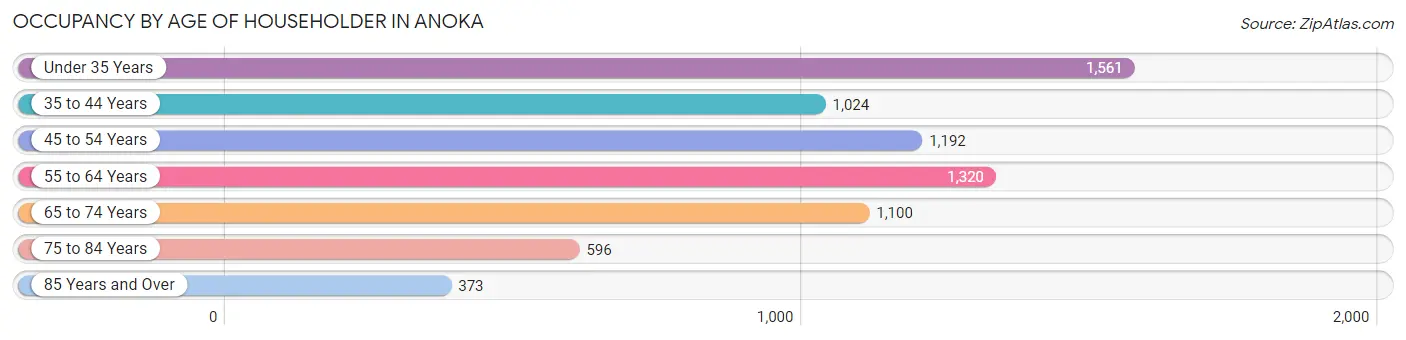
| Age Bracket | # Households | % Households |
| Under 35 Years | 1,561 | 21.8% |
| 35 to 44 Years | 1,024 | 14.3% |
| 45 to 54 Years | 1,192 | 16.6% |
| 55 to 64 Years | 1,320 | 18.4% |
| 65 to 74 Years | 1,100 | 15.3% |
| 75 to 84 Years | 596 | 8.3% |
| 85 Years and Over | 373 | 5.2% |
| Total | 7,166 | 100.0% |
Housing Finances in Anoka
Median Income by Occupancy in Anoka
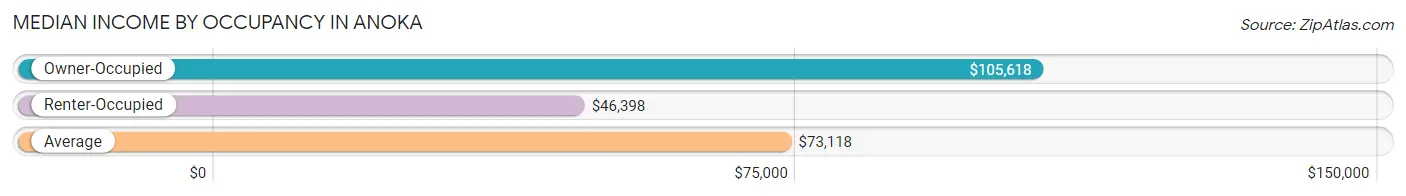
| Occupancy Type | # Households | Median Income |
| Owner-Occupied | 4,065 (56.7%) | $105,618 |
| Renter-Occupied | 3,101 (43.3%) | $46,398 |
| Average | 7,166 (100.0%) | $73,118 |
Occupancy by Householder Income Bracket in Anoka
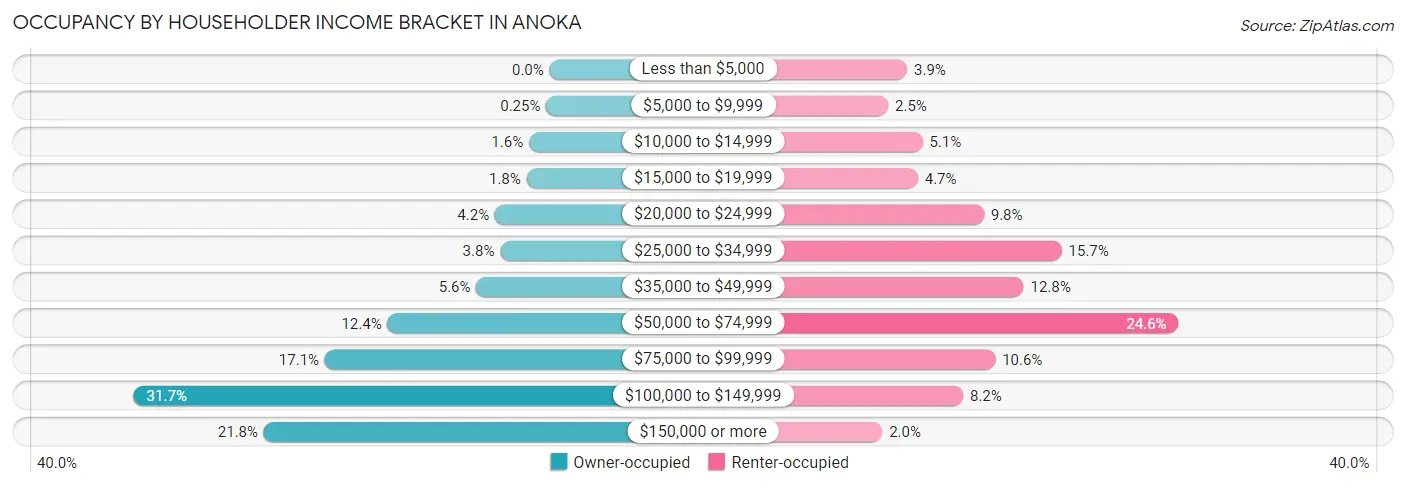
| Income Bracket | Owner-occupied | Renter-occupied |
| Less than $5,000 | 0 (0.0%) | 122 (3.9%) |
| $5,000 to $9,999 | 10 (0.3%) | 77 (2.5%) |
| $10,000 to $14,999 | 64 (1.6%) | 158 (5.1%) |
| $15,000 to $19,999 | 71 (1.8%) | 147 (4.7%) |
| $20,000 to $24,999 | 169 (4.2%) | 303 (9.8%) |
| $25,000 to $34,999 | 153 (3.8%) | 487 (15.7%) |
| $35,000 to $49,999 | 227 (5.6%) | 397 (12.8%) |
| $50,000 to $74,999 | 502 (12.3%) | 763 (24.6%) |
| $75,000 to $99,999 | 696 (17.1%) | 330 (10.6%) |
| $100,000 to $149,999 | 1,288 (31.7%) | 254 (8.2%) |
| $150,000 or more | 885 (21.8%) | 63 (2.0%) |
| Total | 4,065 (100.0%) | 3,101 (100.0%) |
Monthly Housing Cost Tiers in Anoka
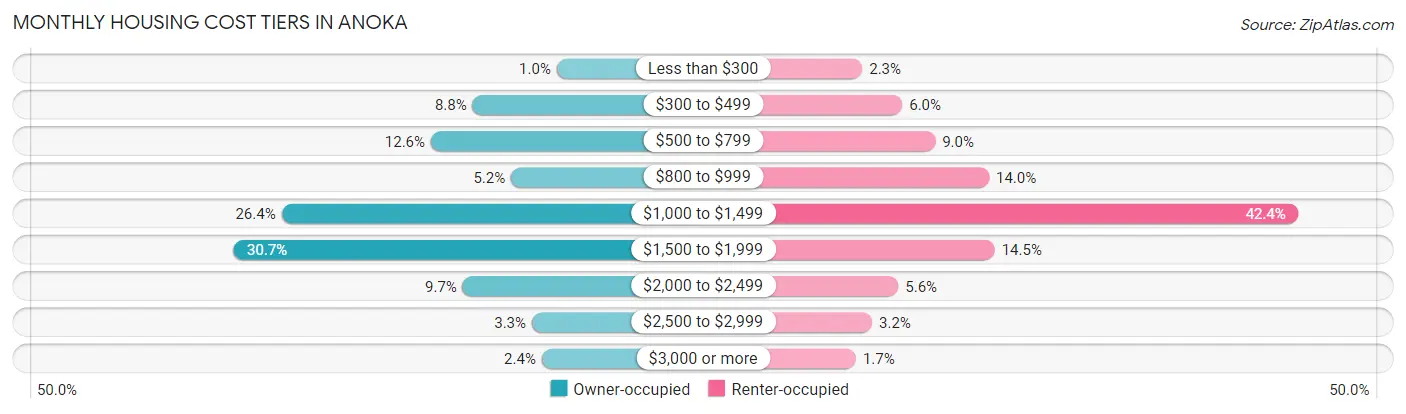
| Monthly Cost | Owner-occupied | Renter-occupied |
| Less than $300 | 41 (1.0%) | 71 (2.3%) |
| $300 to $499 | 356 (8.8%) | 185 (6.0%) |
| $500 to $799 | 512 (12.6%) | 279 (9.0%) |
| $800 to $999 | 212 (5.2%) | 433 (14.0%) |
| $1,000 to $1,499 | 1,071 (26.4%) | 1,314 (42.4%) |
| $1,500 to $1,999 | 1,249 (30.7%) | 449 (14.5%) |
| $2,000 to $2,499 | 393 (9.7%) | 174 (5.6%) |
| $2,500 to $2,999 | 134 (3.3%) | 99 (3.2%) |
| $3,000 or more | 97 (2.4%) | 53 (1.7%) |
| Total | 4,065 (100.0%) | 3,101 (100.0%) |
Physical Housing Characteristics in Anoka
Housing Structures in Anoka
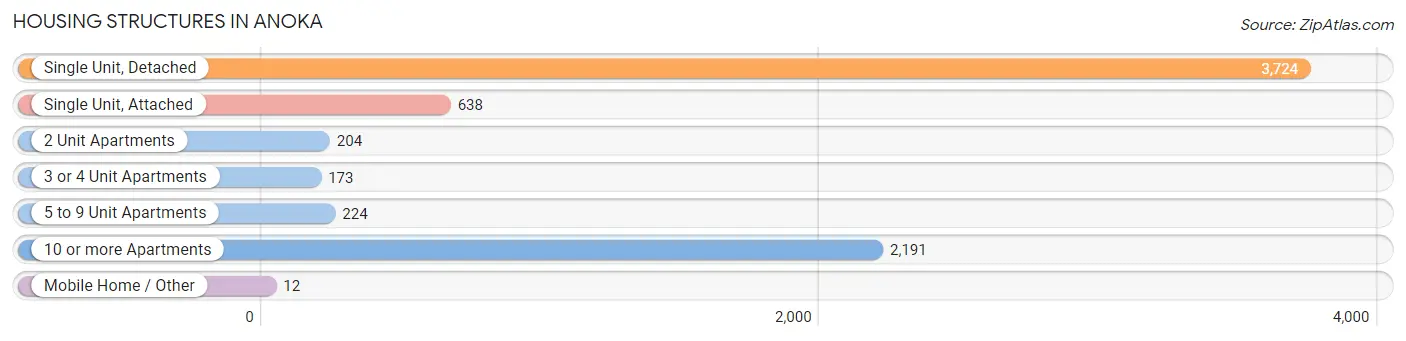
| Structure Type | # Housing Units | % Housing Units |
| Single Unit, Detached | 3,724 | 52.0% |
| Single Unit, Attached | 638 | 8.9% |
| 2 Unit Apartments | 204 | 2.9% |
| 3 or 4 Unit Apartments | 173 | 2.4% |
| 5 to 9 Unit Apartments | 224 | 3.1% |
| 10 or more Apartments | 2,191 | 30.6% |
| Mobile Home / Other | 12 | 0.2% |
| Total | 7,166 | 100.0% |
Housing Structures by Occupancy in Anoka
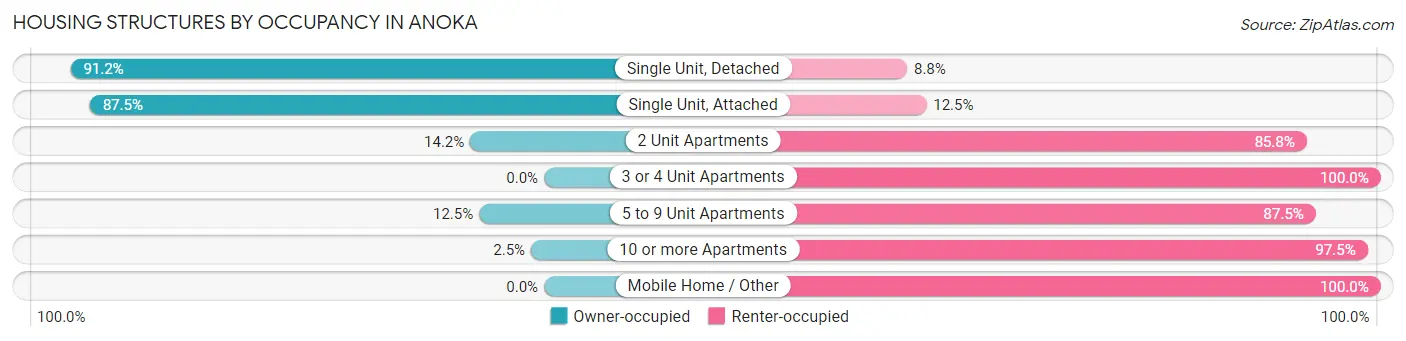
| Structure Type | Owner-occupied | Renter-occupied |
| Single Unit, Detached | 3,395 (91.2%) | 329 (8.8%) |
| Single Unit, Attached | 558 (87.5%) | 80 (12.5%) |
| 2 Unit Apartments | 29 (14.2%) | 175 (85.8%) |
| 3 or 4 Unit Apartments | 0 (0.0%) | 173 (100.0%) |
| 5 to 9 Unit Apartments | 28 (12.5%) | 196 (87.5%) |
| 10 or more Apartments | 55 (2.5%) | 2,136 (97.5%) |
| Mobile Home / Other | 0 (0.0%) | 12 (100.0%) |
| Total | 4,065 (56.7%) | 3,101 (43.3%) |
Housing Structures by Number of Rooms in Anoka
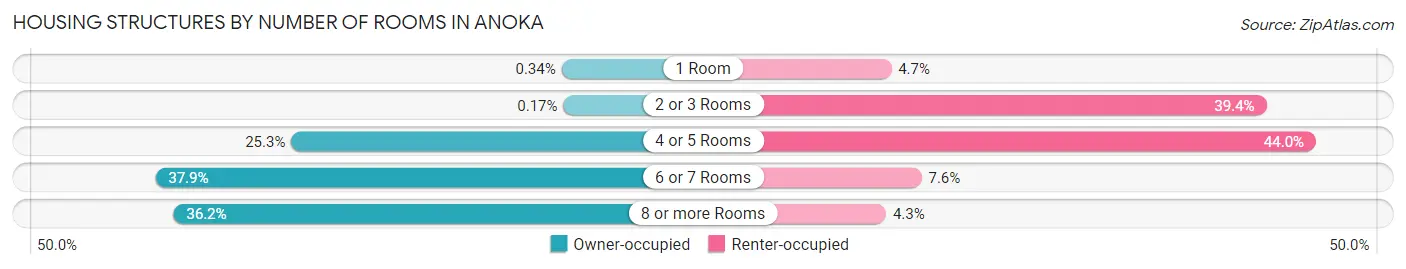
| Number of Rooms | Owner-occupied | Renter-occupied |
| 1 Room | 14 (0.3%) | 147 (4.7%) |
| 2 or 3 Rooms | 7 (0.2%) | 1,223 (39.4%) |
| 4 or 5 Rooms | 1,030 (25.3%) | 1,365 (44.0%) |
| 6 or 7 Rooms | 1,541 (37.9%) | 234 (7.5%) |
| 8 or more Rooms | 1,473 (36.2%) | 132 (4.3%) |
| Total | 4,065 (100.0%) | 3,101 (100.0%) |
Housing Structure by Heating Type in Anoka
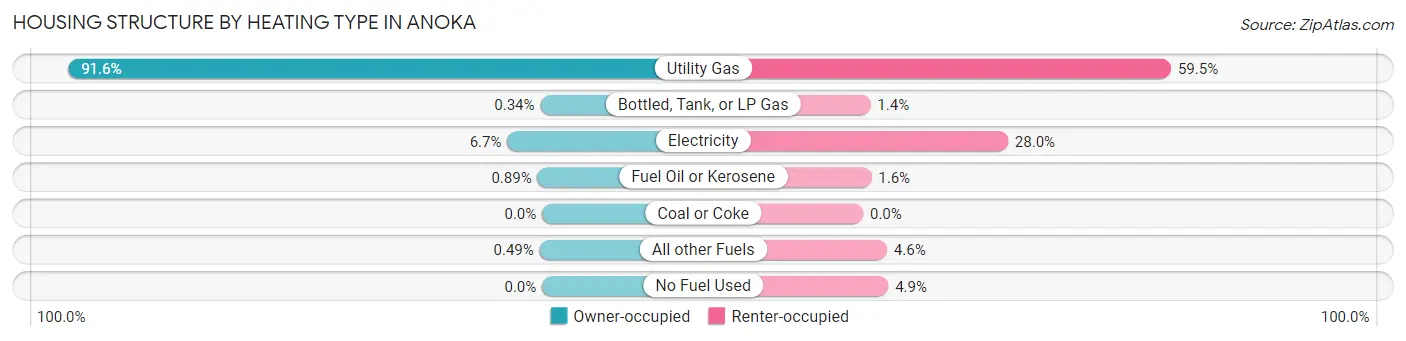
| Heating Type | Owner-occupied | Renter-occupied |
| Utility Gas | 3,722 (91.6%) | 1,845 (59.5%) |
| Bottled, Tank, or LP Gas | 14 (0.3%) | 44 (1.4%) |
| Electricity | 273 (6.7%) | 868 (28.0%) |
| Fuel Oil or Kerosene | 36 (0.9%) | 50 (1.6%) |
| Coal or Coke | 0 (0.0%) | 0 (0.0%) |
| All other Fuels | 20 (0.5%) | 143 (4.6%) |
| No Fuel Used | 0 (0.0%) | 151 (4.9%) |
| Total | 4,065 (100.0%) | 3,101 (100.0%) |
Household Vehicle Usage in Anoka
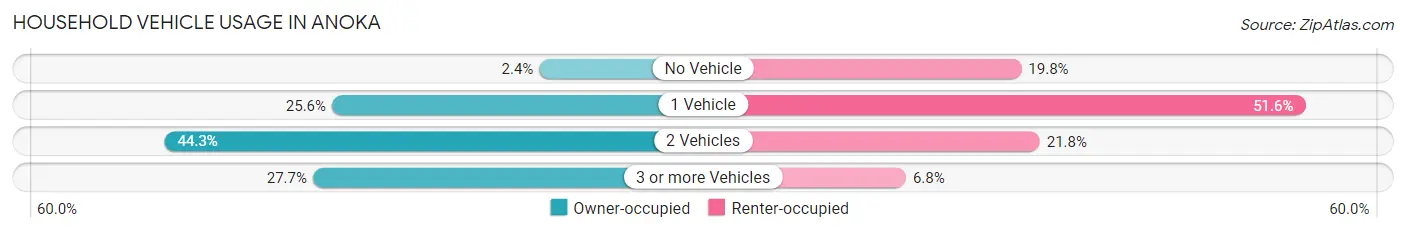
| Vehicles per Household | Owner-occupied | Renter-occupied |
| No Vehicle | 96 (2.4%) | 613 (19.8%) |
| 1 Vehicle | 1,040 (25.6%) | 1,599 (51.6%) |
| 2 Vehicles | 1,802 (44.3%) | 677 (21.8%) |
| 3 or more Vehicles | 1,127 (27.7%) | 212 (6.8%) |
| Total | 4,065 (100.0%) | 3,101 (100.0%) |
Real Estate & Mortgages in Anoka
Real Estate and Mortgage Overview in Anoka
| Characteristic | Without Mortgage | With Mortgage |
| Housing Units | 1,033 | 3,032 |
| Median Property Value | $266,000 | $275,100 |
| Median Household Income | $76,354 | $789 |
| Monthly Housing Costs | $560 | $97 |
| Real Estate Taxes | $2,626 | $114 |
Property Value by Mortgage Status in Anoka
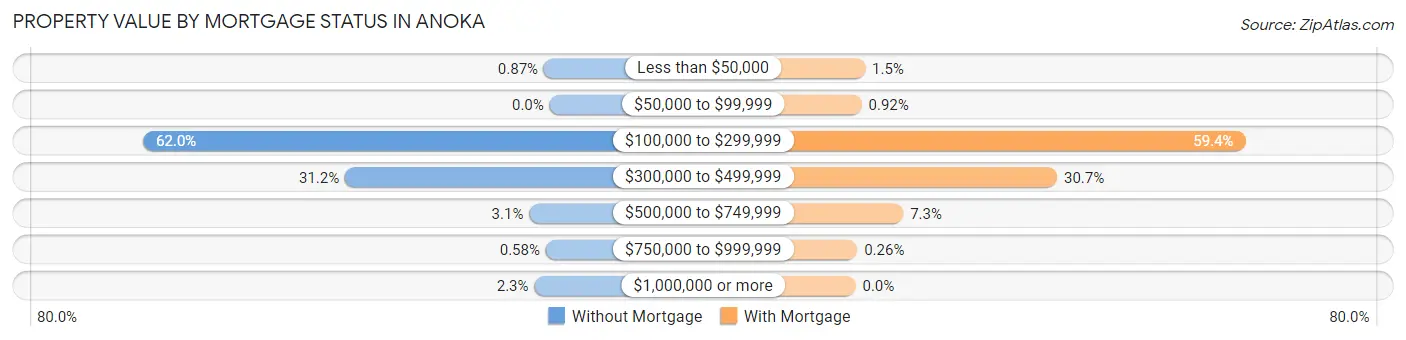
| Property Value | Without Mortgage | With Mortgage |
| Less than $50,000 | 9 (0.9%) | 44 (1.5%) |
| $50,000 to $99,999 | 0 (0.0%) | 28 (0.9%) |
| $100,000 to $299,999 | 640 (62.0%) | 1,801 (59.4%) |
| $300,000 to $499,999 | 322 (31.2%) | 931 (30.7%) |
| $500,000 to $749,999 | 32 (3.1%) | 220 (7.3%) |
| $750,000 to $999,999 | 6 (0.6%) | 8 (0.3%) |
| $1,000,000 or more | 24 (2.3%) | 0 (0.0%) |
| Total | 1,033 (100.0%) | 3,032 (100.0%) |
Household Income by Mortgage Status in Anoka
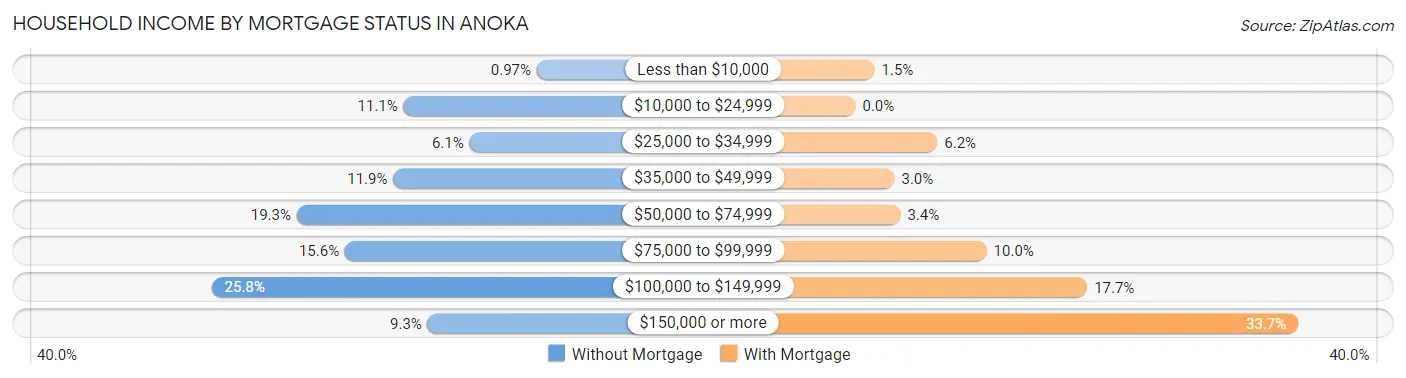
| Household Income | Without Mortgage | With Mortgage |
| Less than $10,000 | 10 (1.0%) | 44 (1.5%) |
| $10,000 to $24,999 | 115 (11.1%) | 0 (0.0%) |
| $25,000 to $34,999 | 63 (6.1%) | 189 (6.2%) |
| $35,000 to $49,999 | 123 (11.9%) | 90 (3.0%) |
| $50,000 to $74,999 | 199 (19.3%) | 104 (3.4%) |
| $75,000 to $99,999 | 161 (15.6%) | 303 (10.0%) |
| $100,000 to $149,999 | 266 (25.8%) | 535 (17.6%) |
| $150,000 or more | 96 (9.3%) | 1,022 (33.7%) |
| Total | 1,033 (100.0%) | 3,032 (100.0%) |
Property Value to Household Income Ratio in Anoka
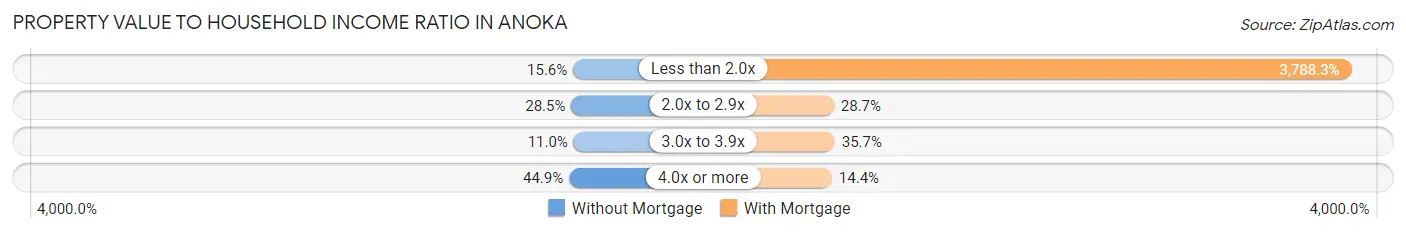
| Value-to-Income Ratio | Without Mortgage | With Mortgage |
| Less than 2.0x | 161 (15.6%) | 114,861 (3,788.3%) |
| 2.0x to 2.9x | 294 (28.5%) | 869 (28.7%) |
| 3.0x to 3.9x | 114 (11.0%) | 1,083 (35.7%) |
| 4.0x or more | 464 (44.9%) | 436 (14.4%) |
| Total | 1,033 (100.0%) | 3,032 (100.0%) |
Real Estate Taxes by Mortgage Status in Anoka
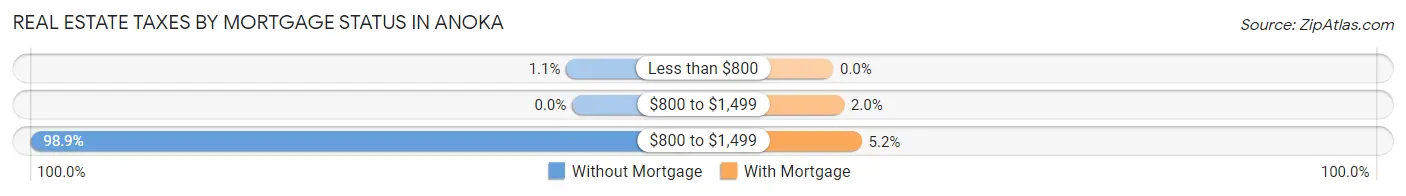
| Property Taxes | Without Mortgage | With Mortgage |
| Less than $800 | 11 (1.1%) | 0 (0.0%) |
| $800 to $1,499 | 0 (0.0%) | 60 (2.0%) |
| $800 to $1,499 | 1,022 (98.9%) | 158 (5.2%) |
| Total | 1,033 (100.0%) | 3,032 (100.0%) |
Health & Disability in Anoka
Health Insurance Coverage by Age in Anoka
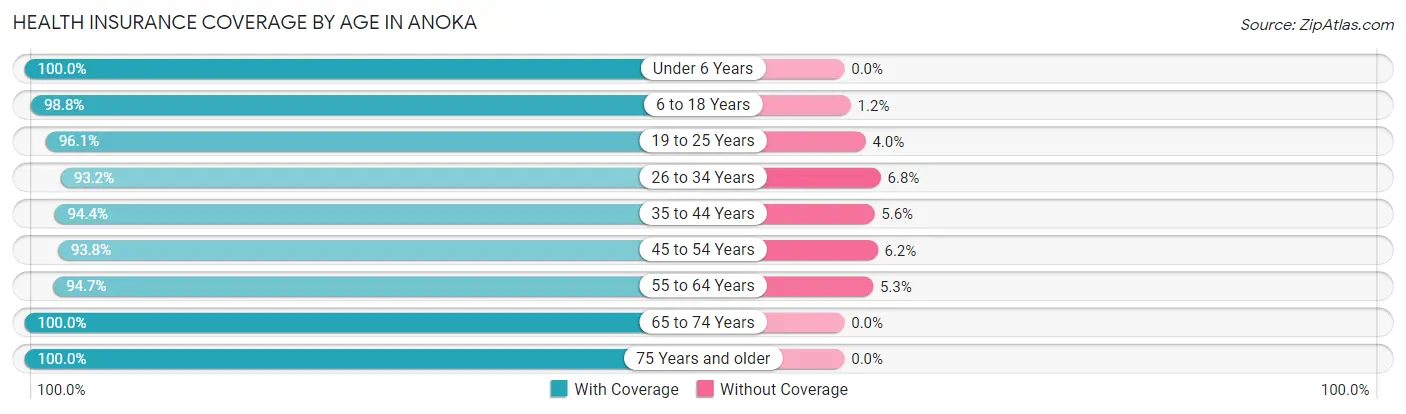
| Age Bracket | With Coverage | Without Coverage |
| Under 6 Years | 1,165 (100.0%) | 0 (0.0%) |
| 6 to 18 Years | 2,833 (98.8%) | 34 (1.2%) |
| 19 to 25 Years | 1,191 (96.1%) | 49 (4.0%) |
| 26 to 34 Years | 2,340 (93.2%) | 170 (6.8%) |
| 35 to 44 Years | 2,003 (94.4%) | 119 (5.6%) |
| 45 to 54 Years | 1,771 (93.8%) | 117 (6.2%) |
| 55 to 64 Years | 2,270 (94.7%) | 128 (5.3%) |
| 65 to 74 Years | 1,731 (100.0%) | 0 (0.0%) |
| 75 Years and older | 1,344 (100.0%) | 0 (0.0%) |
| Total | 16,648 (96.4%) | 617 (3.6%) |
Health Insurance Coverage by Citizenship Status in Anoka
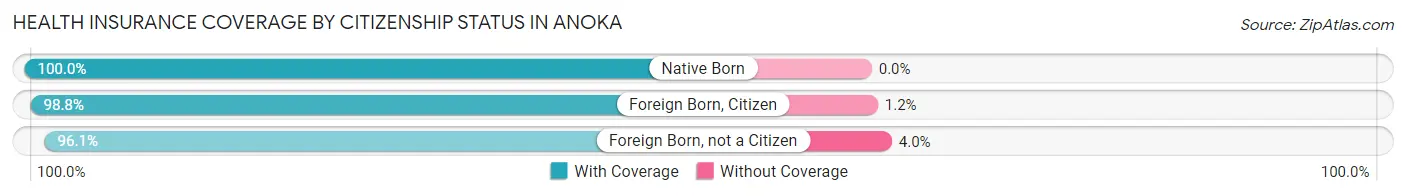
| Citizenship Status | With Coverage | Without Coverage |
| Native Born | 1,165 (100.0%) | 0 (0.0%) |
| Foreign Born, Citizen | 2,833 (98.8%) | 34 (1.2%) |
| Foreign Born, not a Citizen | 1,191 (96.1%) | 49 (4.0%) |
Health Insurance Coverage by Household Income in Anoka
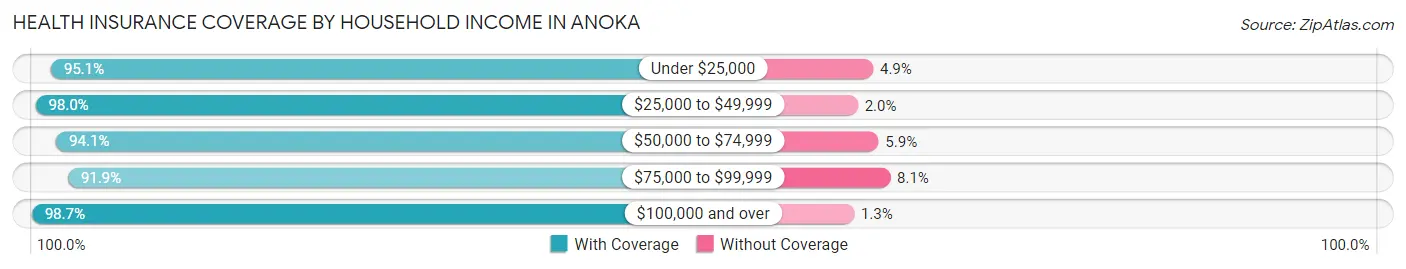
| Household Income | With Coverage | Without Coverage |
| Under $25,000 | 1,527 (95.1%) | 79 (4.9%) |
| $25,000 to $49,999 | 2,407 (98.0%) | 50 (2.0%) |
| $50,000 to $74,999 | 2,495 (94.1%) | 157 (5.9%) |
| $75,000 to $99,999 | 2,346 (91.9%) | 207 (8.1%) |
| $100,000 and over | 7,556 (98.7%) | 103 (1.3%) |
Public vs Private Health Insurance Coverage by Age in Anoka
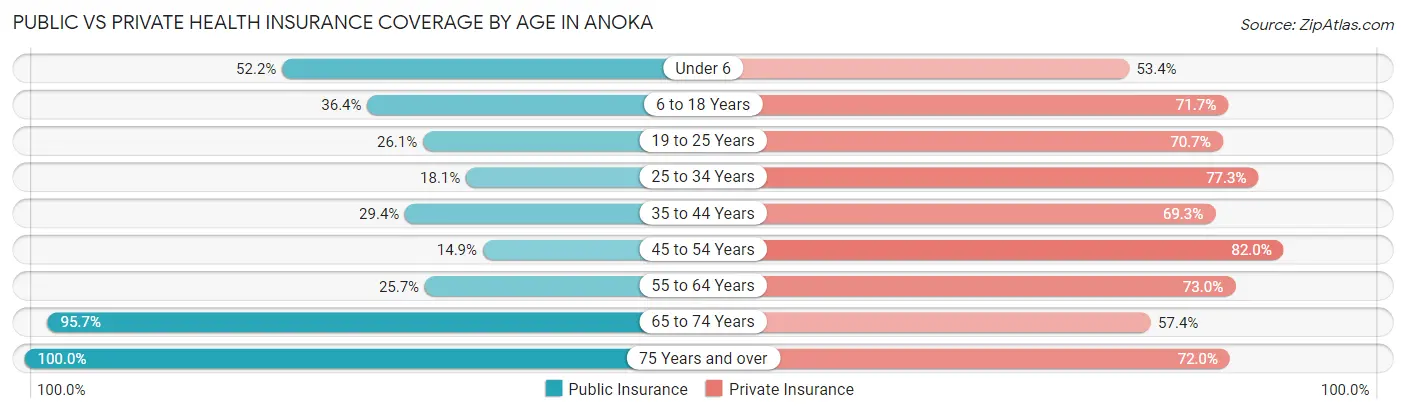
| Age Bracket | Public Insurance | Private Insurance |
| Under 6 | 608 (52.2%) | 622 (53.4%) |
| 6 to 18 Years | 1,043 (36.4%) | 2,055 (71.7%) |
| 19 to 25 Years | 323 (26.1%) | 876 (70.7%) |
| 25 to 34 Years | 453 (18.0%) | 1,940 (77.3%) |
| 35 to 44 Years | 623 (29.4%) | 1,470 (69.3%) |
| 45 to 54 Years | 282 (14.9%) | 1,548 (82.0%) |
| 55 to 64 Years | 616 (25.7%) | 1,750 (73.0%) |
| 65 to 74 Years | 1,657 (95.7%) | 994 (57.4%) |
| 75 Years and over | 1,344 (100.0%) | 968 (72.0%) |
| Total | 6,949 (40.3%) | 12,223 (70.8%) |
Disability Status by Sex by Age in Anoka
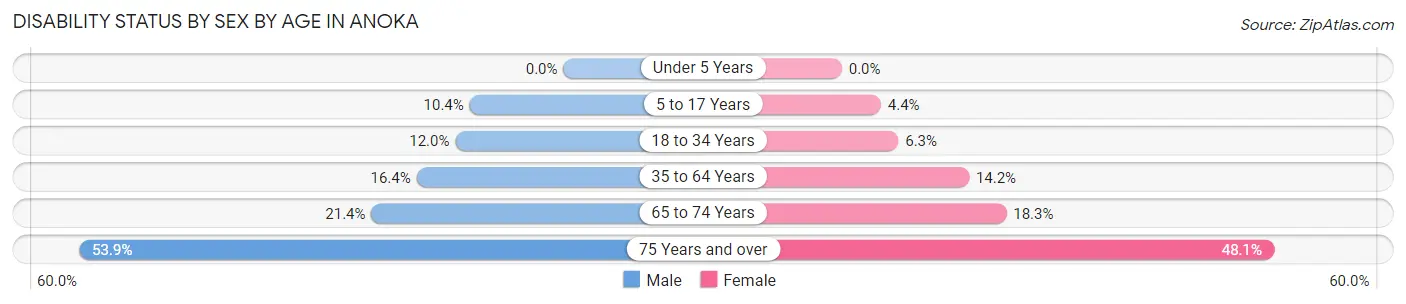
| Age Bracket | Male | Female |
| Under 5 Years | 0 (0.0%) | 0 (0.0%) |
| 5 to 17 Years | 149 (10.4%) | 58 (4.3%) |
| 18 to 34 Years | 248 (12.0%) | 118 (6.3%) |
| 35 to 64 Years | 549 (16.4%) | 432 (14.2%) |
| 65 to 74 Years | 146 (21.4%) | 192 (18.3%) |
| 75 Years and over | 226 (53.9%) | 445 (48.1%) |
Disability Class by Sex by Age in Anoka
Disability Class: Hearing Difficulty
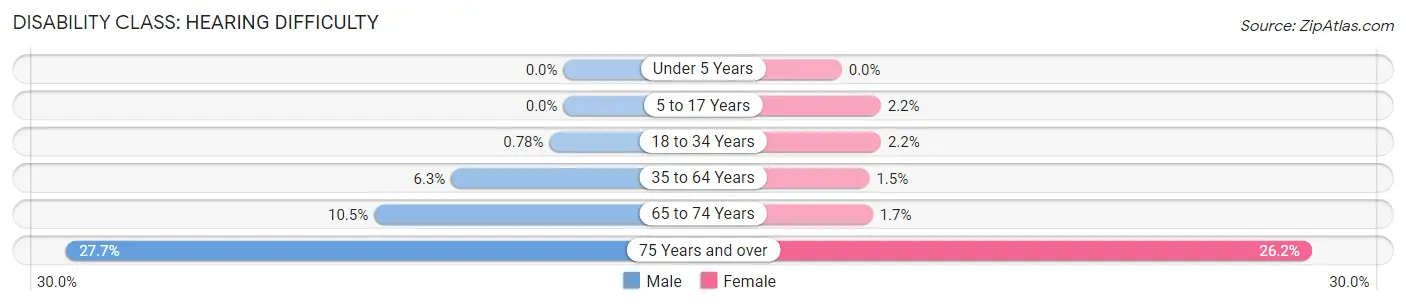
| Age Bracket | Male | Female |
| Under 5 Years | 0 (0.0%) | 0 (0.0%) |
| 5 to 17 Years | 0 (0.0%) | 29 (2.2%) |
| 18 to 34 Years | 16 (0.8%) | 41 (2.2%) |
| 35 to 64 Years | 210 (6.2%) | 47 (1.5%) |
| 65 to 74 Years | 72 (10.5%) | 18 (1.7%) |
| 75 Years and over | 116 (27.7%) | 242 (26.2%) |
Disability Class: Vision Difficulty
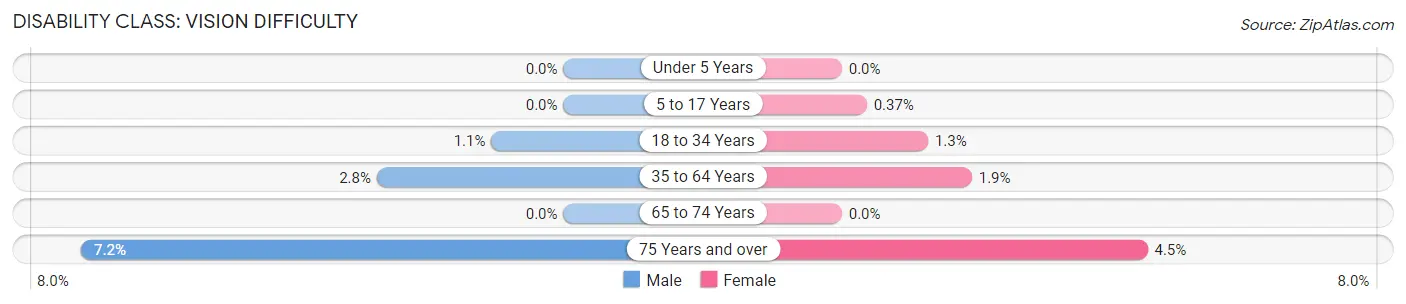
| Age Bracket | Male | Female |
| Under 5 Years | 0 (0.0%) | 0 (0.0%) |
| 5 to 17 Years | 0 (0.0%) | 5 (0.4%) |
| 18 to 34 Years | 22 (1.1%) | 24 (1.3%) |
| 35 to 64 Years | 93 (2.8%) | 59 (1.9%) |
| 65 to 74 Years | 0 (0.0%) | 0 (0.0%) |
| 75 Years and over | 30 (7.2%) | 42 (4.5%) |
Disability Class: Cognitive Difficulty
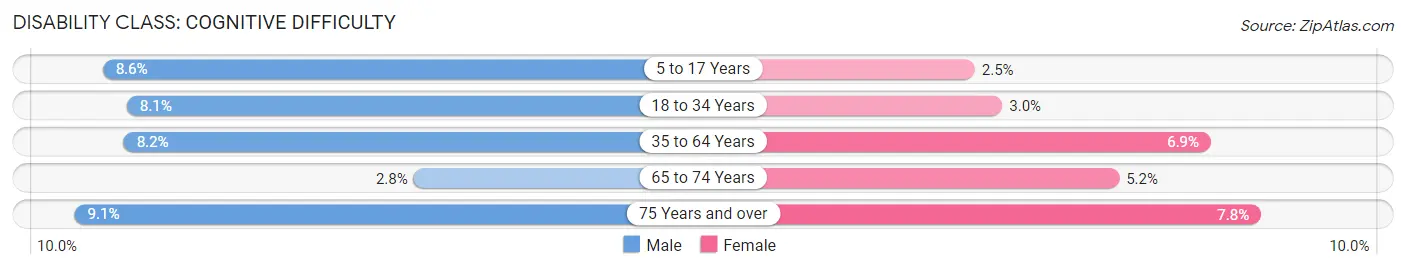
| Age Bracket | Male | Female |
| 5 to 17 Years | 122 (8.6%) | 33 (2.5%) |
| 18 to 34 Years | 167 (8.1%) | 56 (3.0%) |
| 35 to 64 Years | 274 (8.2%) | 209 (6.9%) |
| 65 to 74 Years | 19 (2.8%) | 54 (5.1%) |
| 75 Years and over | 38 (9.1%) | 72 (7.8%) |
Disability Class: Ambulatory Difficulty
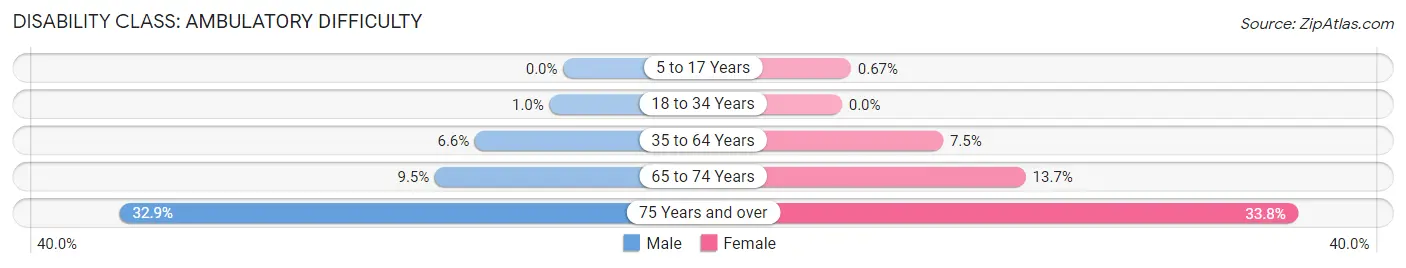
| Age Bracket | Male | Female |
| 5 to 17 Years | 0 (0.0%) | 9 (0.7%) |
| 18 to 34 Years | 21 (1.0%) | 0 (0.0%) |
| 35 to 64 Years | 220 (6.6%) | 229 (7.5%) |
| 65 to 74 Years | 65 (9.5%) | 143 (13.7%) |
| 75 Years and over | 138 (32.9%) | 313 (33.8%) |
Disability Class: Self-Care Difficulty
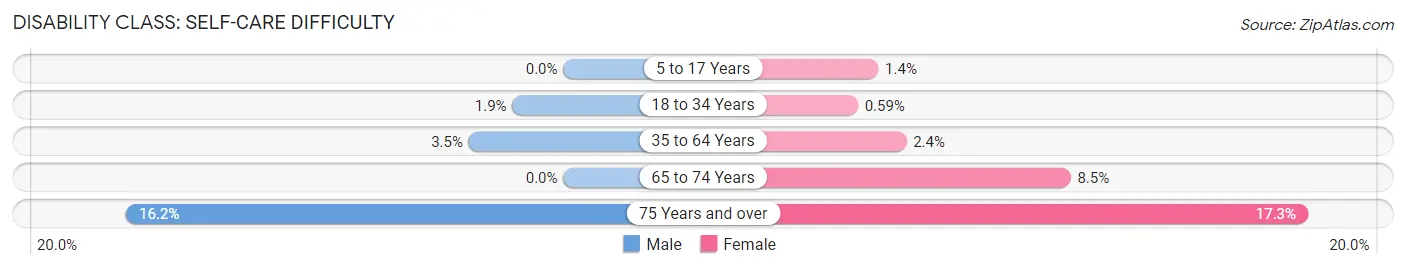
| Age Bracket | Male | Female |
| 5 to 17 Years | 0 (0.0%) | 18 (1.3%) |
| 18 to 34 Years | 39 (1.9%) | 11 (0.6%) |
| 35 to 64 Years | 118 (3.5%) | 73 (2.4%) |
| 65 to 74 Years | 0 (0.0%) | 89 (8.5%) |
| 75 Years and over | 68 (16.2%) | 160 (17.3%) |
Technology Access in Anoka
Computing Device Access in Anoka
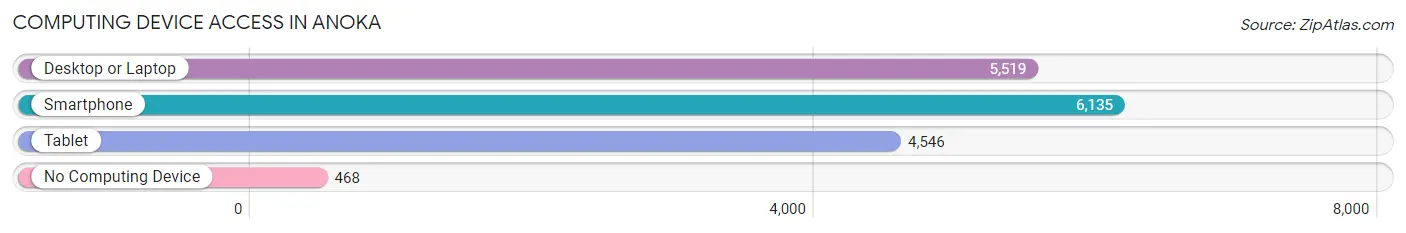
| Device Type | # Households | % Households |
| Desktop or Laptop | 5,519 | 77.0% |
| Smartphone | 6,135 | 85.6% |
| Tablet | 4,546 | 63.4% |
| No Computing Device | 468 | 6.5% |
| Total | 7,166 | 100.0% |
Internet Access in Anoka
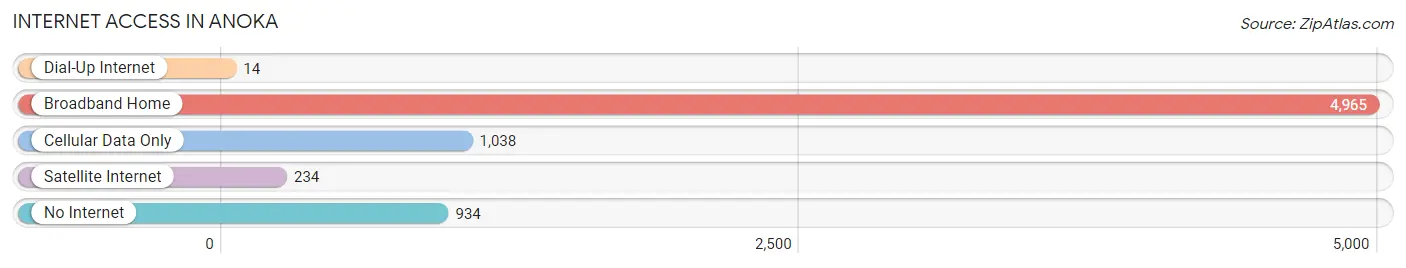
| Internet Type | # Households | % Households |
| Dial-Up Internet | 14 | 0.2% |
| Broadband Home | 4,965 | 69.3% |
| Cellular Data Only | 1,038 | 14.5% |
| Satellite Internet | 234 | 3.3% |
| No Internet | 934 | 13.0% |
| Total | 7,166 | 100.0% |
Anoka Summary
Anoka, Minnesota is a city located in Anoka County, Minnesota, United States. It is situated on the banks of the Rum River, approximately 25 miles north of Minneapolis. As of the 2010 census, the city had a population of 17,142. Anoka is the county seat of Anoka County and is part of the Twin Cities metropolitan area.
History
The area that is now Anoka was first settled by European immigrants in the early 1800s. The first settlers were mostly of German and Swedish descent. The city was officially incorporated in 1872 and was named after the Dakota word for “on both sides”, referring to its location on both sides of the Rum River.
Anoka quickly became a thriving industrial center, with a number of mills and factories being built along the river. The city was also home to a number of lumber yards and sawmills. In the late 1800s, Anoka was a major center for the production of flour and other grain products.
In the early 1900s, Anoka was a popular destination for tourists, with a number of resorts and hotels being built in the area. The city was also home to a number of amusement parks, including the Anoka Amusement Park, which opened in 1906 and closed in the late 1950s.
Geography
Anoka is located in Anoka County, Minnesota, approximately 25 miles north of Minneapolis. The city is situated on the banks of the Rum River, which flows through the city from east to west. The city is surrounded by a number of lakes, including Lake George, Lake George, and Lake George.
The city has a total area of 8.7 square miles, of which 8.3 square miles is land and 0.4 square miles is water. The city has a number of parks and trails, including the Anoka Nature Preserve, which is a popular destination for hikers and nature lovers.
Economy
Anoka’s economy is largely based on manufacturing and retail. The city is home to a number of manufacturing companies, including Anoka Tool & Die, Anoka Machine Works, and Anoka Manufacturing. The city is also home to a number of retail stores, including Target, Walmart, and Kohl’s.
The city is also home to a number of medical facilities, including Mercy Hospital and the Anoka County Medical Center. The city is also home to a number of educational institutions, including Anoka Technical College and Anoka-Ramsey Community College.
Demographics
As of the 2010 census, the city had a population of 17,142. The racial makeup of the city was 87.3% White, 5.2% African American, 0.7% Native American, 2.2% Asian, 0.1% Pacific Islander, 1.7% from other races, and 2.8% from two or more races. Hispanic or Latino of any race were 4.3% of the population.
The median income for a household in the city was $50,945, and the median income for a family was $62,917. The per capita income for the city was $25,845. About 6.2% of families and 8.7% of the population were below the poverty line, including 11.2% of those under age 18 and 6.2% of those age 65 or over.
Common Questions
What is Per Capita Income in Anoka?
Per Capita income in Anoka is $38,815.
What is the Median Family Income in Anoka?
Median Family Income in Anoka is $90,219.
What is the Median Household income in Anoka?
Median Household Income in Anoka is $73,118.
What is Income or Wage Gap in Anoka?
Income or Wage Gap in Anoka is 24.6%.
Women in Anoka earn 75.4 cents for every dollar earned by a man.
What is Family Income Deficit in Anoka?
Family Income Deficit in Anoka is $5,408.
Families that are below poverty line in Anoka earn $5,408 less on average than the poverty threshold level.
What is Inequality or Gini Index in Anoka?
Inequality or Gini Index in Anoka is 0.43.
What is the Total Population of Anoka?
Total Population of Anoka is 17,892.
What is the Total Male Population of Anoka?
Total Male Population of Anoka is 8,834.
What is the Total Female Population of Anoka?
Total Female Population of Anoka is 9,058.
What is the Ratio of Males per 100 Females in Anoka?
There are 97.53 Males per 100 Females in Anoka.
What is the Ratio of Females per 100 Males in Anoka?
There are 102.54 Females per 100 Males in Anoka.
What is the Median Population Age in Anoka?
Median Population Age in Anoka is 40.1 Years.
What is the Average Family Size in Anoka
Average Family Size in Anoka is 3.0 People.
What is the Average Household Size in Anoka
Average Household Size in Anoka is 2.4 People.
How Large is the Labor Force in Anoka?
There are 9,038 People in the Labor Forcein in Anoka.
What is the Percentage of People in the Labor Force in Anoka?
62.5% of People are in the Labor Force in Anoka.
What is the Unemployment Rate in Anoka?
Unemployment Rate in Anoka is 5.2%.