Fairburn, GA Map & Demographics
Fairburn Map
Fairburn Overview
$29,859
PER CAPITA INCOME
$65,724
AVG FAMILY INCOME
$67,245
AVG HOUSEHOLD INCOME
9.0%
WAGE / INCOME GAP [ % ]
91.0¢/ $1
WAGE / INCOME GAP [ $ ]
0.39
INEQUALITY / GINI INDEX
16,469
TOTAL POPULATION
7,582
MALE POPULATION
8,887
FEMALE POPULATION
85.32
MALES / 100 FEMALES
117.21
FEMALES / 100 MALES
30.9
MEDIAN AGE
3.6
AVG FAMILY SIZE
2.9
AVG HOUSEHOLD SIZE
8,592
LABOR FORCE [ PEOPLE ]
75.1%
PERCENT IN LABOR FORCE
5.2%
UNEMPLOYMENT RATE
Fairburn Zip Codes
Fairburn Area Codes
Income in Fairburn
Income Overview in Fairburn
Per Capita Income in Fairburn is $29,859, while median incomes of families and households are $65,724 and $67,245 respectively.
| Characteristic | Number | Measure |
| Per Capita Income | 16,469 | $29,859 |
| Median Family Income | 3,771 | $65,724 |
| Mean Family Income | 3,771 | $87,256 |
| Median Household Income | 5,697 | $67,245 |
| Mean Household Income | 5,697 | $83,502 |
| Income Deficit | 3,771 | $0 |
| Wage / Income Gap (%) | 16,469 | 9.05% |
| Wage / Income Gap ($) | 16,469 | 90.95¢ per $1 |
| Gini / Inequality Index | 16,469 | 0.39 |
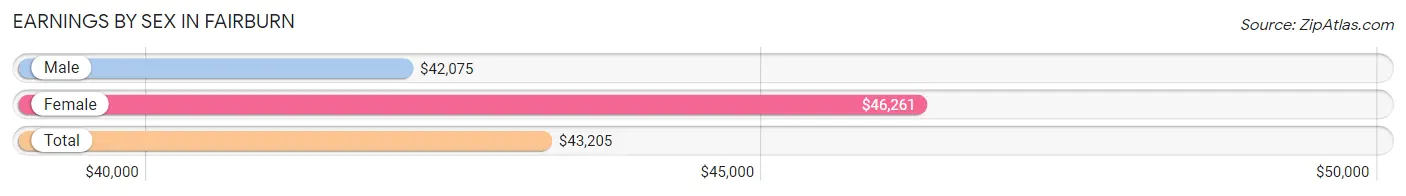
Earnings by Sex in Fairburn
Average Earnings in Fairburn are $43,205, $42,075 for men and $46,261 for women, a difference of 9.0%.
| Sex | Number | Average Earnings |
| Male | 4,004 (45.5%) | $42,075 |
| Female | 4,800 (54.5%) | $46,261 |
| Total | 8,804 (100.0%) | $43,205 |
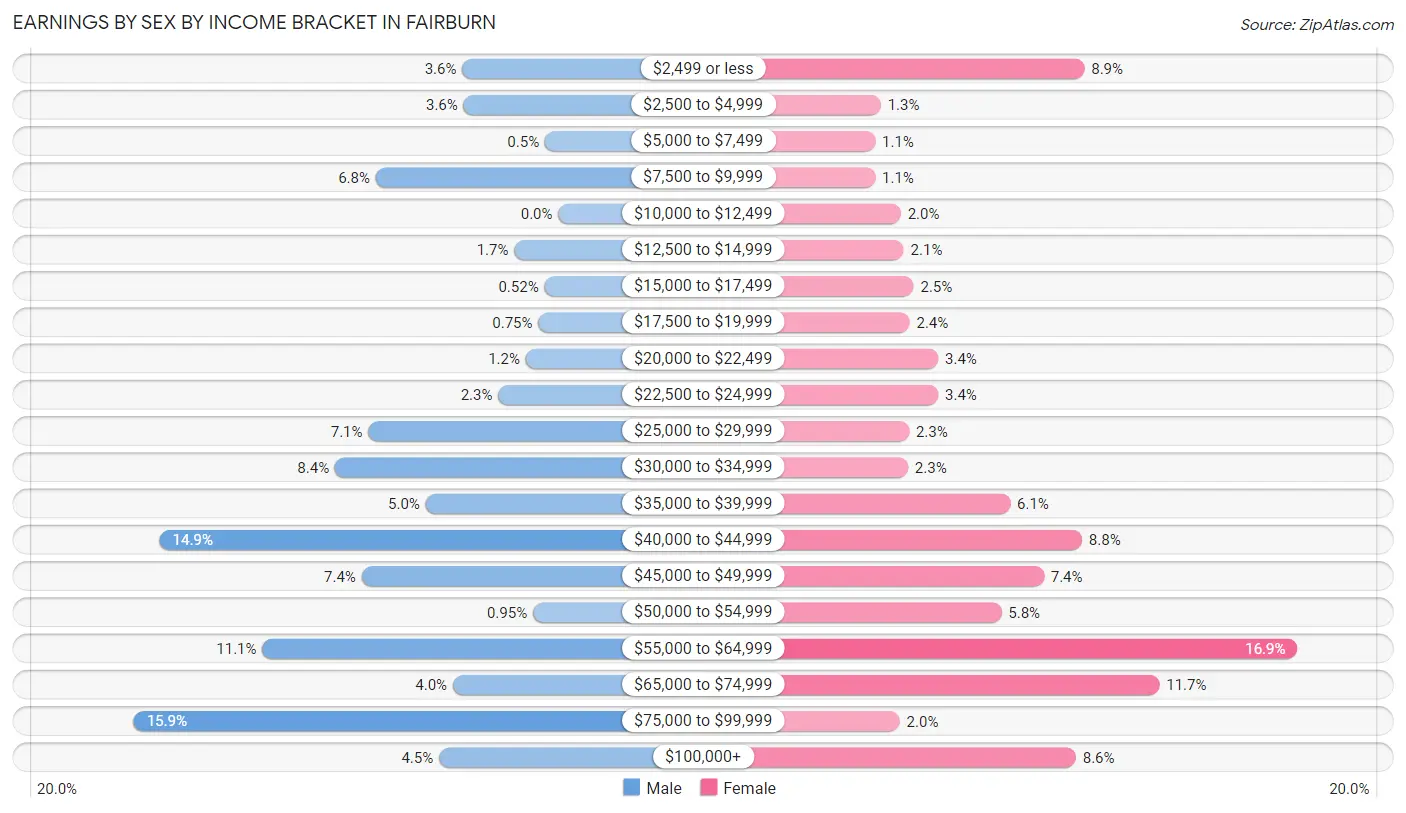
Earnings by Sex by Income Bracket in Fairburn
The most common earnings brackets in Fairburn are $75,000 to $99,999 for men (637 | 15.9%) and $55,000 to $64,999 for women (810 | 16.9%).
| Income | Male | Female |
| $2,499 or less | 144 (3.6%) | 427 (8.9%) |
| $2,500 to $4,999 | 142 (3.5%) | 61 (1.3%) |
| $5,000 to $7,499 | 20 (0.5%) | 51 (1.1%) |
| $7,500 to $9,999 | 274 (6.8%) | 51 (1.1%) |
| $10,000 to $12,499 | 0 (0.0%) | 97 (2.0%) |
| $12,500 to $14,999 | 66 (1.7%) | 102 (2.1%) |
| $15,000 to $17,499 | 21 (0.5%) | 120 (2.5%) |
| $17,500 to $19,999 | 30 (0.7%) | 113 (2.4%) |
| $20,000 to $22,499 | 49 (1.2%) | 164 (3.4%) |
| $22,500 to $24,999 | 90 (2.2%) | 164 (3.4%) |
| $25,000 to $29,999 | 285 (7.1%) | 112 (2.3%) |
| $30,000 to $34,999 | 335 (8.4%) | 110 (2.3%) |
| $35,000 to $39,999 | 199 (5.0%) | 294 (6.1%) |
| $40,000 to $44,999 | 598 (14.9%) | 423 (8.8%) |
| $45,000 to $49,999 | 295 (7.4%) | 354 (7.4%) |
| $50,000 to $54,999 | 38 (0.9%) | 278 (5.8%) |
| $55,000 to $64,999 | 444 (11.1%) | 810 (16.9%) |
| $65,000 to $74,999 | 158 (4.0%) | 562 (11.7%) |
| $75,000 to $99,999 | 637 (15.9%) | 95 (2.0%) |
| $100,000+ | 179 (4.5%) | 412 (8.6%) |
| Total | 4,004 (100.0%) | 4,800 (100.0%) |
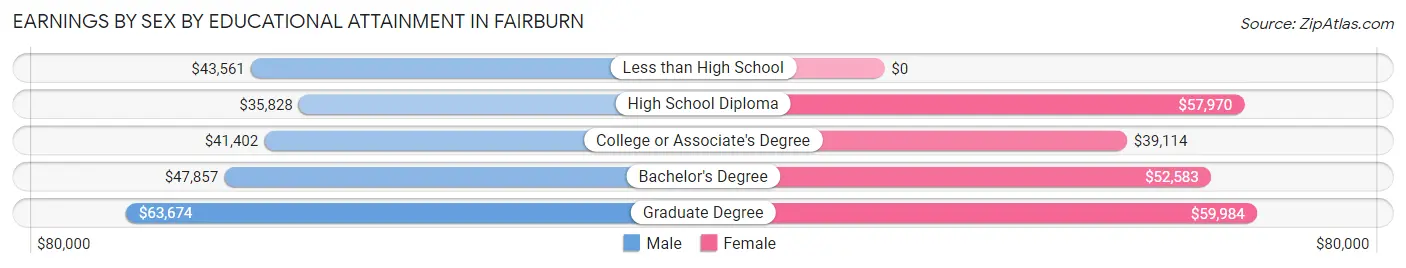
Earnings by Sex by Educational Attainment in Fairburn
Average earnings in Fairburn are $43,910 for men and $48,675 for women, a difference of 9.8%. Men with an educational attainment of graduate degree enjoy the highest average annual earnings of $63,674, while those with high school diploma education earn the least with $35,828. Women with an educational attainment of graduate degree earn the most with the average annual earnings of $59,984, while those with college or associate's degree education have the smallest earnings of $39,114.
| Educational Attainment | Male Income | Female Income |
| Less than High School | $43,561 | $0 |
| High School Diploma | $35,828 | $57,970 |
| College or Associate's Degree | $41,402 | $39,114 |
| Bachelor's Degree | $47,857 | $52,583 |
| Graduate Degree | $63,674 | $59,984 |
| Total | $43,910 | $48,675 |
Family Income in Fairburn
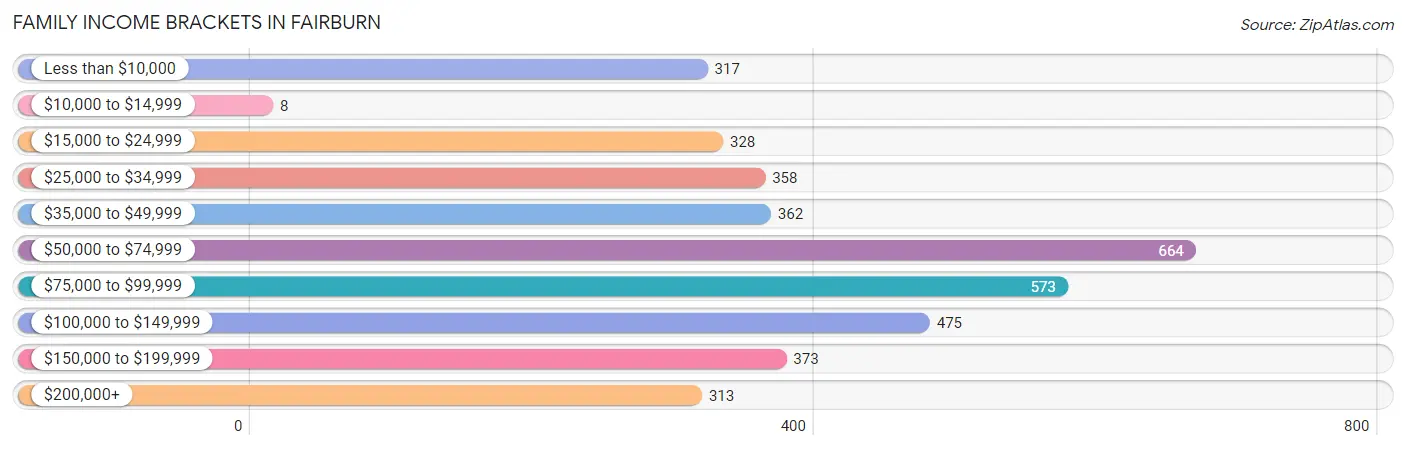
Family Income Brackets in Fairburn
According to the Fairburn family income data, there are 664 families falling into the $50,000 to $74,999 income range, which is the most common income bracket and makes up 17.6% of all families. Conversely, the $10,000 to $14,999 income bracket is the least frequent group with only 8 families (0.2%) belonging to this category.
| Income Bracket | # Families | % Families |
| Less than $10,000 | 317 | 8.4% |
| $10,000 to $14,999 | 8 | 0.2% |
| $15,000 to $24,999 | 328 | 8.7% |
| $25,000 to $34,999 | 358 | 9.5% |
| $35,000 to $49,999 | 362 | 9.6% |
| $50,000 to $74,999 | 664 | 17.6% |
| $75,000 to $99,999 | 573 | 15.2% |
| $100,000 to $149,999 | 475 | 12.6% |
| $150,000 to $199,999 | 373 | 9.9% |
| $200,000+ | 313 | 8.3% |
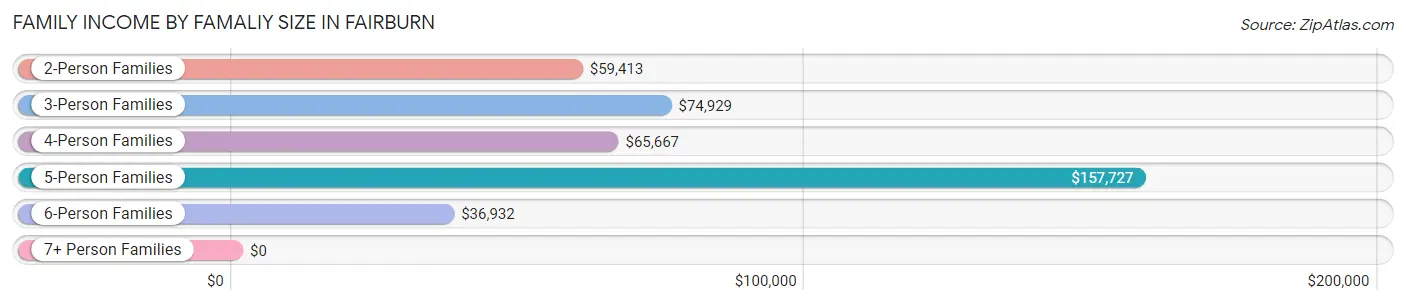
Family Income by Famaliy Size in Fairburn
5-person families (200 | 5.3%) account for the highest median family income in Fairburn with $157,727 per family, while 5-person families (200 | 5.3%) have the highest median income of $31,545 per family member.
| Income Bracket | # Families | Median Income |
| 2-Person Families | 1,519 (40.3%) | $59,413 |
| 3-Person Families | 1,181 (31.3%) | $74,929 |
| 4-Person Families | 522 (13.8%) | $65,667 |
| 5-Person Families | 200 (5.3%) | $157,727 |
| 6-Person Families | 319 (8.5%) | $36,932 |
| 7+ Person Families | 30 (0.8%) | $0 |
| Total | 3,771 (100.0%) | $65,724 |
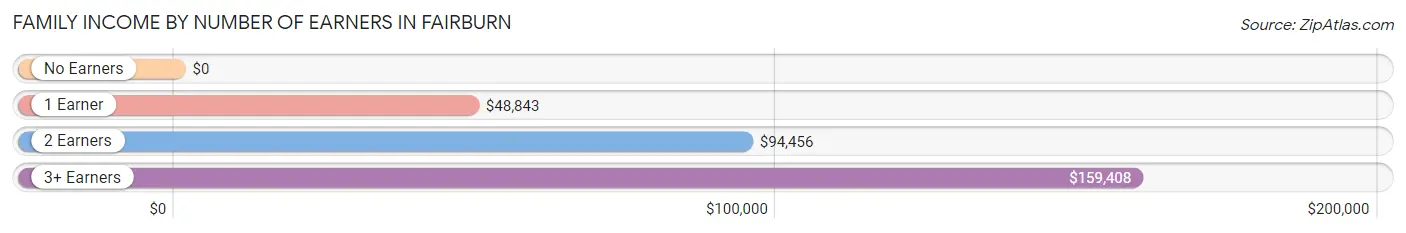
Family Income by Number of Earners in Fairburn
| Number of Earners | # Families | Median Income |
| No Earners | 120 (3.2%) | $0 |
| 1 Earner | 1,851 (49.1%) | $48,843 |
| 2 Earners | 1,381 (36.6%) | $94,456 |
| 3+ Earners | 419 (11.1%) | $159,408 |
| Total | 3,771 (100.0%) | $65,724 |
Household Income in Fairburn
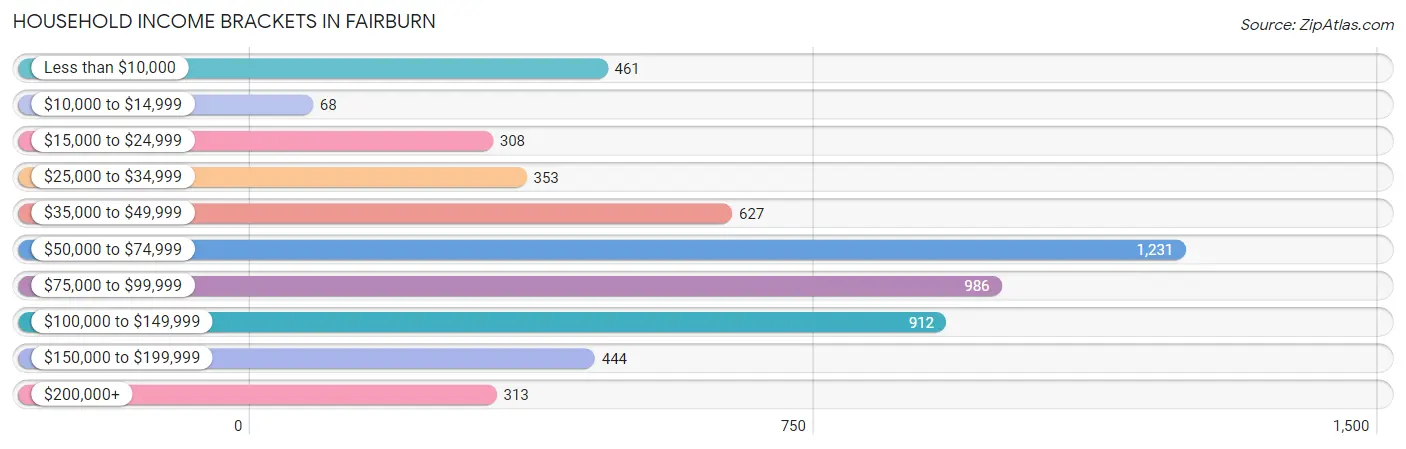
Household Income Brackets in Fairburn
With 1,231 households falling in the category, the $50,000 to $74,999 income range is the most frequent in Fairburn, accounting for 21.6% of all households. In contrast, only 68 households (1.2%) fall into the $10,000 to $14,999 income bracket, making it the least populous group.
| Income Bracket | # Households | % Households |
| Less than $10,000 | 461 | 8.1% |
| $10,000 to $14,999 | 68 | 1.2% |
| $15,000 to $24,999 | 308 | 5.4% |
| $25,000 to $34,999 | 353 | 6.2% |
| $35,000 to $49,999 | 627 | 11.0% |
| $50,000 to $74,999 | 1,231 | 21.6% |
| $75,000 to $99,999 | 986 | 17.3% |
| $100,000 to $149,999 | 912 | 16.0% |
| $150,000 to $199,999 | 444 | 7.8% |
| $200,000+ | 313 | 5.5% |
Household Income by Householder Age in Fairburn
The median household income in Fairburn is $67,245, with the highest median household income of $75,195 found in the 45 to 64 years age bracket for the primary householder. A total of 2,707 households (47.5%) fall into this category. Meanwhile, the 15 to 24 years age bracket for the primary householder has the lowest median household income of $0, with 81 households (1.4%) in this group.
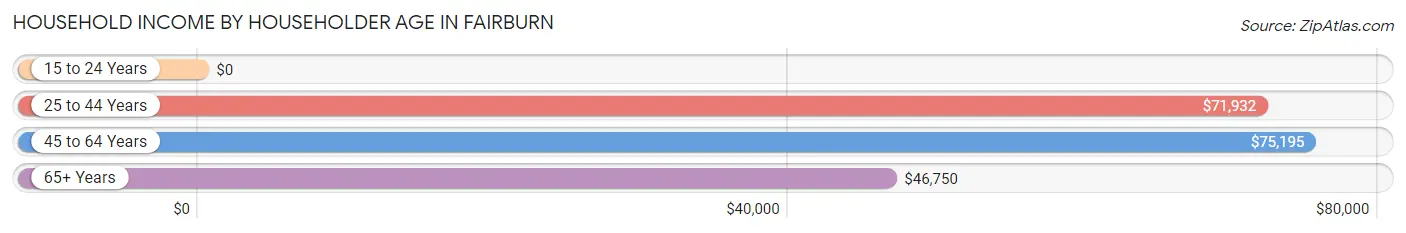
| Income Bracket | # Households | Median Income |
| 15 to 24 Years | 81 (1.4%) | $0 |
| 25 to 44 Years | 2,261 (39.7%) | $71,932 |
| 45 to 64 Years | 2,707 (47.5%) | $75,195 |
| 65+ Years | 648 (11.4%) | $46,750 |
| Total | 5,697 (100.0%) | $67,245 |
Poverty in Fairburn
Income Below Poverty by Sex and Age in Fairburn
With 27.4% poverty level for males and 20.0% for females among the residents of Fairburn, under 5 year old males and 65 to 74 year old females are the most vulnerable to poverty, with 792 males (71.4%) and 178 females (47.3%) in their respective age groups living below the poverty level.
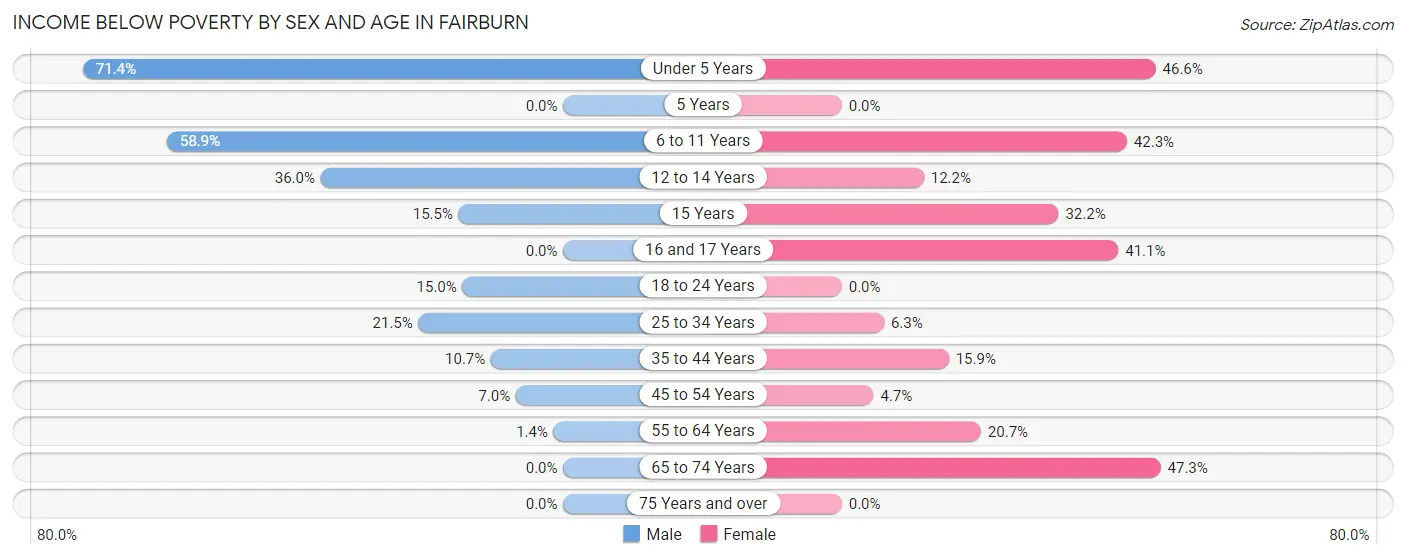
| Age Bracket | Male | Female |
| Under 5 Years | 792 (71.4%) | 528 (46.6%) |
| 5 Years | 0 (0.0%) | 0 (0.0%) |
| 6 to 11 Years | 494 (58.9%) | 246 (42.3%) |
| 12 to 14 Years | 210 (36.0%) | 56 (12.2%) |
| 15 Years | 9 (15.5%) | 65 (32.2%) |
| 16 and 17 Years | 0 (0.0%) | 124 (41.1%) |
| 18 to 24 Years | 118 (15.0%) | 0 (0.0%) |
| 25 to 34 Years | 274 (21.5%) | 91 (6.3%) |
| 35 to 44 Years | 103 (10.7%) | 175 (15.9%) |
| 45 to 54 Years | 59 (7.0%) | 66 (4.7%) |
| 55 to 64 Years | 8 (1.4%) | 238 (20.7%) |
| 65 to 74 Years | 0 (0.0%) | 178 (47.3%) |
| 75 Years and over | 0 (0.0%) | 0 (0.0%) |
| Total | 2,067 (27.4%) | 1,767 (20.0%) |
Income Above Poverty by Sex and Age in Fairburn
According to the poverty statistics in Fairburn, males aged 5 years and females aged 5 years are the age groups that are most secure financially, with 100.0% of males and 100.0% of females in these age groups living above the poverty line.
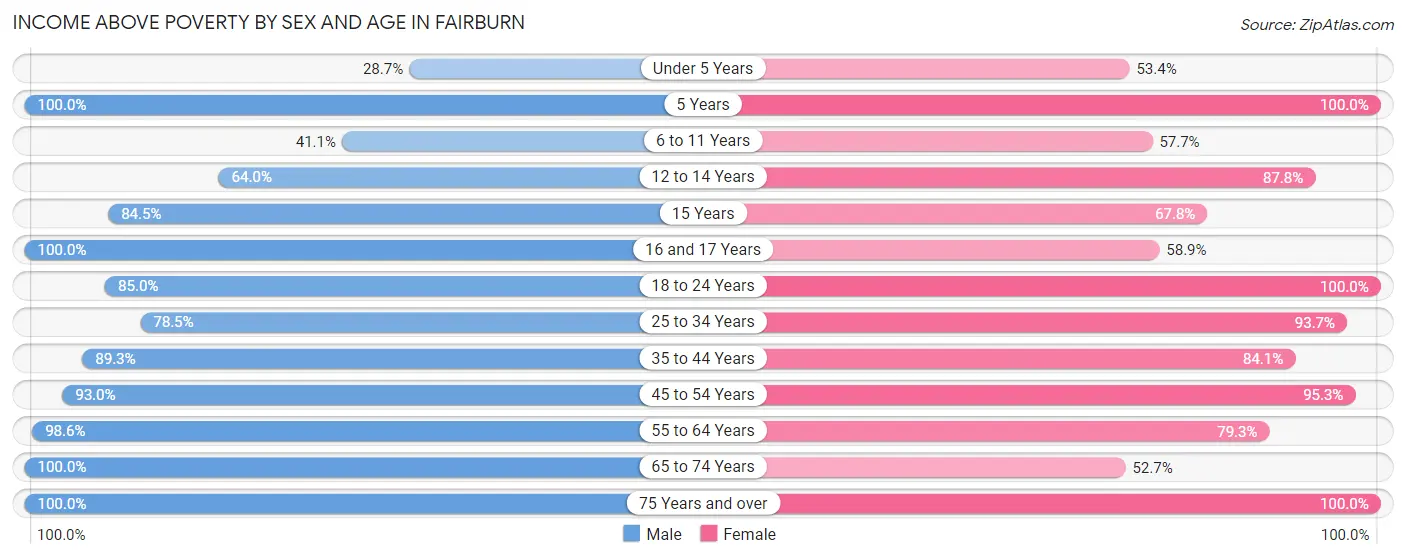
| Age Bracket | Male | Female |
| Under 5 Years | 318 (28.6%) | 605 (53.4%) |
| 5 Years | 30 (100.0%) | 32 (100.0%) |
| 6 to 11 Years | 345 (41.1%) | 335 (57.7%) |
| 12 to 14 Years | 373 (64.0%) | 404 (87.8%) |
| 15 Years | 49 (84.5%) | 137 (67.8%) |
| 16 and 17 Years | 151 (100.0%) | 178 (58.9%) |
| 18 to 24 Years | 671 (85.0%) | 499 (100.0%) |
| 25 to 34 Years | 1,001 (78.5%) | 1,363 (93.7%) |
| 35 to 44 Years | 857 (89.3%) | 927 (84.1%) |
| 45 to 54 Years | 783 (93.0%) | 1,334 (95.3%) |
| 55 to 64 Years | 554 (98.6%) | 914 (79.3%) |
| 65 to 74 Years | 318 (100.0%) | 198 (52.7%) |
| 75 Years and over | 31 (100.0%) | 125 (100.0%) |
| Total | 5,481 (72.6%) | 7,051 (80.0%) |
Income Below Poverty Among Married-Couple Families in Fairburn
The poverty statistics for married-couple families in Fairburn show that 6.4% or 106 of the total 1,670 families live below the poverty line. Families with 3 or 4 children have the highest poverty rate of 46.9%, comprising of 98 families. On the other hand, families with no children have the lowest poverty rate of 0.0%, which includes 0 families.
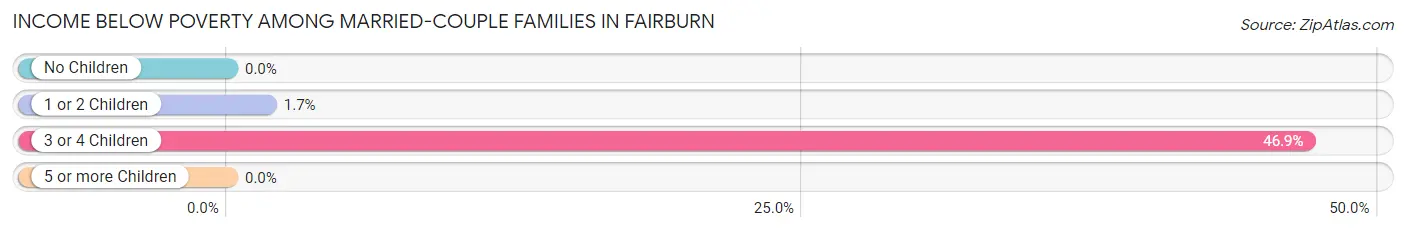
| Children | Above Poverty | Below Poverty |
| No Children | 959 (100.0%) | 0 (0.0%) |
| 1 or 2 Children | 464 (98.3%) | 8 (1.7%) |
| 3 or 4 Children | 111 (53.1%) | 98 (46.9%) |
| 5 or more Children | 30 (100.0%) | 0 (0.0%) |
| Total | 1,564 (93.6%) | 106 (6.4%) |
Income Below Poverty Among Single-Parent Households in Fairburn
According to the poverty data in Fairburn, 50.4% or 273 single-father households and 20.2% or 315 single-mother households are living below the poverty line. Among single-father households, those with 1 or 2 children have the highest poverty rate, with 273 households (67.4%) experiencing poverty. Likewise, among single-mother households, those with 3 or 4 children have the highest poverty rate, with 151 households (100.0%) falling below the poverty line.
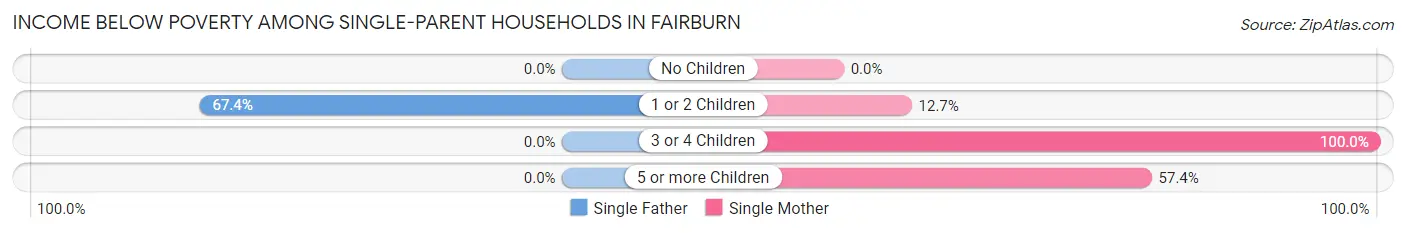
| Children | Single Father | Single Mother |
| No Children | 0 (0.0%) | 0 (0.0%) |
| 1 or 2 Children | 273 (67.4%) | 90 (12.7%) |
| 3 or 4 Children | 0 (0.0%) | 151 (100.0%) |
| 5 or more Children | 0 (0.0%) | 74 (57.4%) |
| Total | 273 (50.4%) | 315 (20.2%) |
Income Below Poverty Among Married-Couple vs Single-Parent Households in Fairburn
The poverty data for Fairburn shows that 106 of the married-couple family households (6.4%) and 588 of the single-parent households (28.0%) are living below the poverty level. Within the married-couple family households, those with 3 or 4 children have the highest poverty rate, with 98 households (46.9%) falling below the poverty line. Among the single-parent households, those with 3 or 4 children have the highest poverty rate, with 151 household (100.0%) living below poverty.
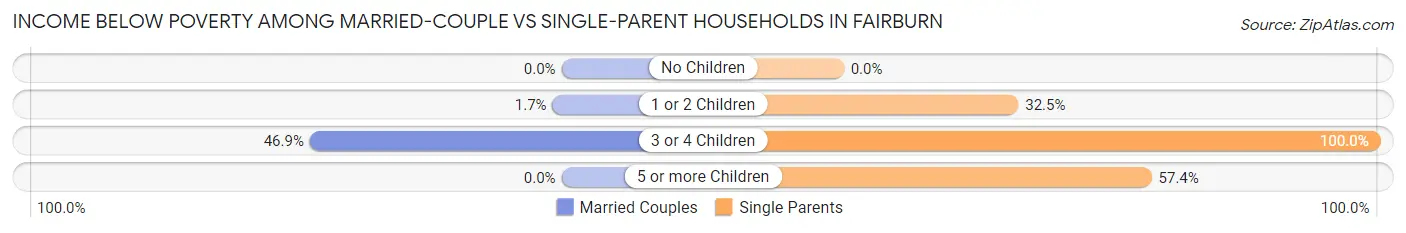
| Children | Married-Couple Families | Single-Parent Households |
| No Children | 0 (0.0%) | 0 (0.0%) |
| 1 or 2 Children | 8 (1.7%) | 363 (32.5%) |
| 3 or 4 Children | 98 (46.9%) | 151 (100.0%) |
| 5 or more Children | 0 (0.0%) | 74 (57.4%) |
| Total | 106 (6.4%) | 588 (28.0%) |
Race in Fairburn
The most populous races in Fairburn are Black / African American (12,400 | 75.3%), White / Caucasian (2,489 | 15.1%), and Hispanic or Latino (2,044 | 12.4%).
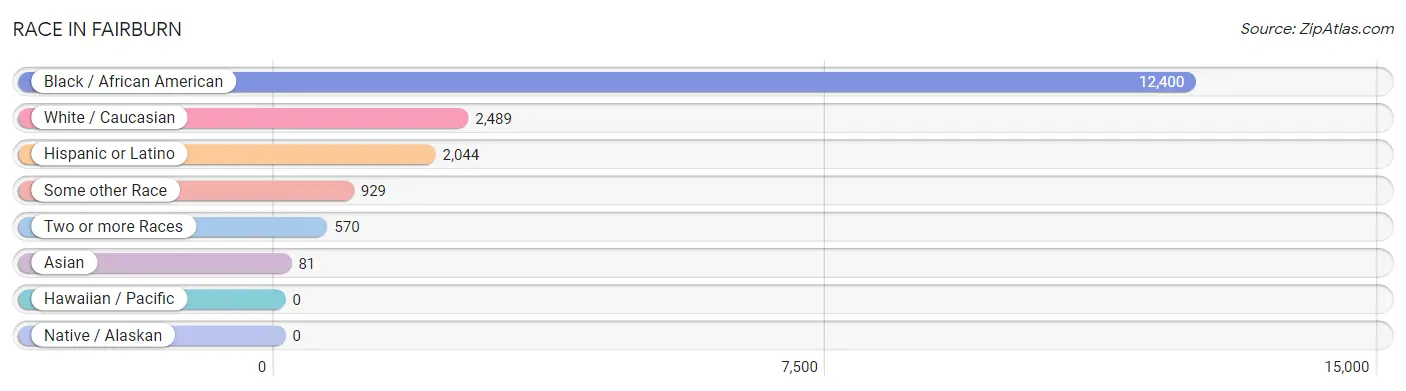
| Race | # Population | % Population |
| Asian | 81 | 0.5% |
| Black / African American | 12,400 | 75.3% |
| Hawaiian / Pacific | 0 | 0.0% |
| Hispanic or Latino | 2,044 | 12.4% |
| Native / Alaskan | 0 | 0.0% |
| White / Caucasian | 2,489 | 15.1% |
| Two or more Races | 570 | 3.5% |
| Some other Race | 929 | 5.6% |
| Total | 16,469 | 100.0% |
Ancestry in Fairburn
The most populous ancestries reported in Fairburn are Mexican (1,696 | 10.3%), American (687 | 4.2%), Arab (601 | 3.6%), Iraqi (583 | 3.5%), and German (542 | 3.3%), together accounting for 24.9% of all Fairburn residents.
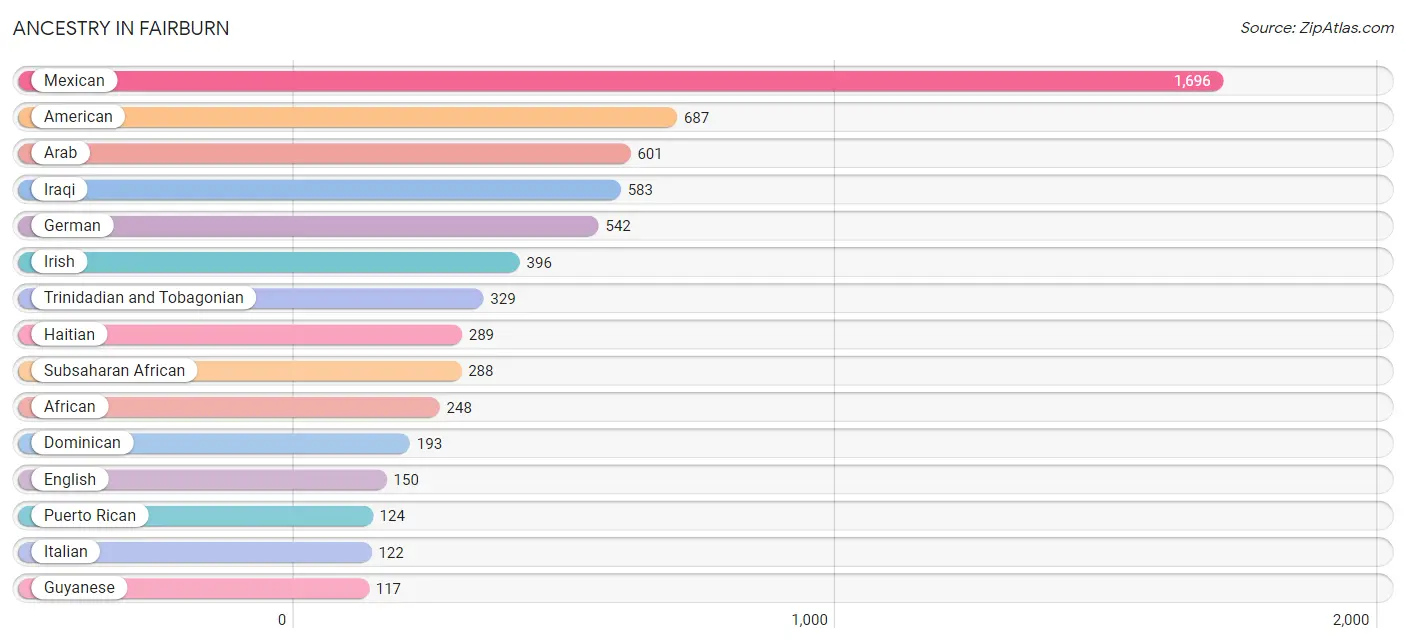
| Ancestry | # Population | % Population |
| African | 248 | 1.5% |
| American | 687 | 4.2% |
| Arab | 601 | 3.6% |
| Bahamian | 7 | 0.0% |
| Belgian | 10 | 0.1% |
| Bhutanese | 8 | 0.1% |
| Cherokee | 8 | 0.1% |
| Colombian | 8 | 0.1% |
| Dominican | 193 | 1.2% |
| English | 150 | 0.9% |
| Finnish | 10 | 0.1% |
| French | 98 | 0.6% |
| French Canadian | 10 | 0.1% |
| German | 542 | 3.3% |
| Guyanese | 117 | 0.7% |
| Haitian | 289 | 1.8% |
| Indian (Asian) | 35 | 0.2% |
| Iraqi | 583 | 3.5% |
| Irish | 396 | 2.4% |
| Italian | 122 | 0.7% |
| Jamaican | 52 | 0.3% |
| Mexican | 1,696 | 10.3% |
| Moroccan | 18 | 0.1% |
| Norwegian | 12 | 0.1% |
| Polish | 57 | 0.4% |
| Puerto Rican | 124 | 0.7% |
| Scotch-Irish | 39 | 0.2% |
| Scottish | 17 | 0.1% |
| South American | 8 | 0.1% |
| Spaniard | 23 | 0.1% |
| Subsaharan African | 288 | 1.8% |
| Trinidadian and Tobagonian | 329 | 2.0% |
| Welsh | 22 | 0.1% |
| Zimbabwean | 24 | 0.2% | View All 34 Rows |
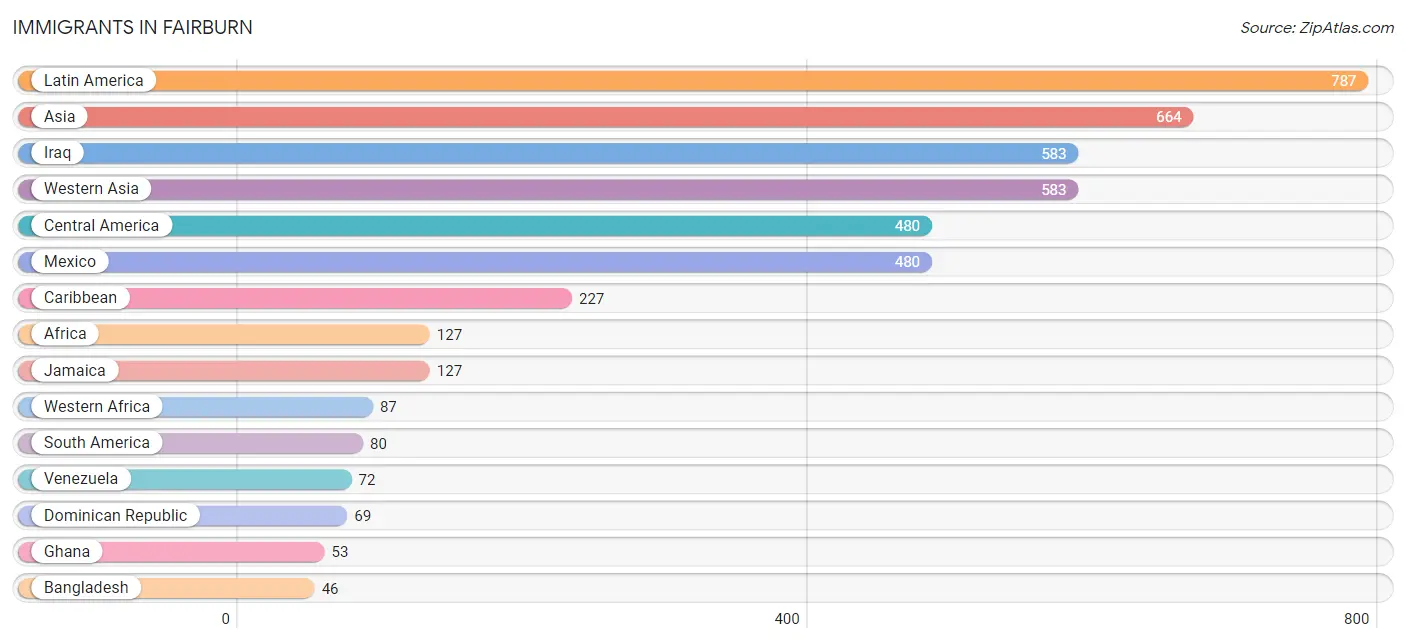
Immigrants in Fairburn
The most numerous immigrant groups reported in Fairburn came from Latin America (787 | 4.8%), Asia (664 | 4.0%), Iraq (583 | 3.5%), Western Asia (583 | 3.5%), and Central America (480 | 2.9%), together accounting for 18.8% of all Fairburn residents.
| Immigration Origin | # Population | % Population |
| Africa | 127 | 0.8% |
| Asia | 664 | 4.0% |
| Bahamas | 7 | 0.0% |
| Bangladesh | 46 | 0.3% |
| Belgium | 10 | 0.1% |
| Caribbean | 227 | 1.4% |
| Central America | 480 | 2.9% |
| China | 35 | 0.2% |
| Colombia | 8 | 0.1% |
| Dominican Republic | 69 | 0.4% |
| Eastern Africa | 40 | 0.2% |
| Eastern Asia | 35 | 0.2% |
| Europe | 10 | 0.1% |
| Ghana | 53 | 0.3% |
| Iraq | 583 | 3.5% |
| Jamaica | 127 | 0.8% |
| Latin America | 787 | 4.8% |
| Mexico | 480 | 2.9% |
| Senegal | 18 | 0.1% |
| South America | 80 | 0.5% |
| South Central Asia | 46 | 0.3% |
| Trinidad and Tobago | 19 | 0.1% |
| Venezuela | 72 | 0.4% |
| Western Africa | 87 | 0.5% |
| Western Asia | 583 | 3.5% |
| Western Europe | 10 | 0.1% |
| Zimbabwe | 24 | 0.2% | View All 27 Rows |
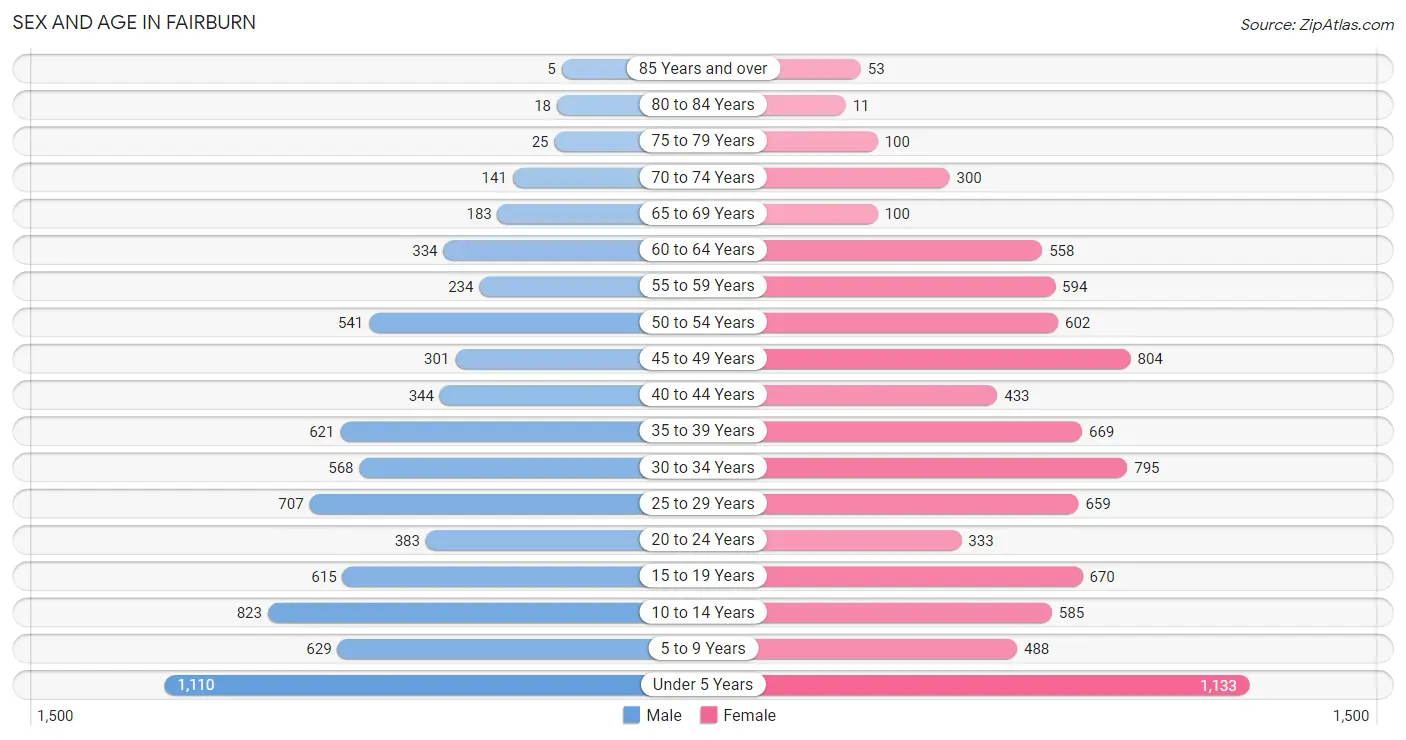
Sex and Age in Fairburn
Sex and Age in Fairburn
The most populous age groups in Fairburn are Under 5 Years (1,110 | 14.6%) for men and Under 5 Years (1,133 | 12.8%) for women.
| Age Bracket | Male | Female |
| Under 5 Years | 1,110 (14.6%) | 1,133 (12.8%) |
| 5 to 9 Years | 629 (8.3%) | 488 (5.5%) |
| 10 to 14 Years | 823 (10.8%) | 585 (6.6%) |
| 15 to 19 Years | 615 (8.1%) | 670 (7.5%) |
| 20 to 24 Years | 383 (5.1%) | 333 (3.7%) |
| 25 to 29 Years | 707 (9.3%) | 659 (7.4%) |
| 30 to 34 Years | 568 (7.5%) | 795 (8.9%) |
| 35 to 39 Years | 621 (8.2%) | 669 (7.5%) |
| 40 to 44 Years | 344 (4.5%) | 433 (4.9%) |
| 45 to 49 Years | 301 (4.0%) | 804 (9.0%) |
| 50 to 54 Years | 541 (7.1%) | 602 (6.8%) |
| 55 to 59 Years | 234 (3.1%) | 594 (6.7%) |
| 60 to 64 Years | 334 (4.4%) | 558 (6.3%) |
| 65 to 69 Years | 183 (2.4%) | 100 (1.1%) |
| 70 to 74 Years | 141 (1.9%) | 300 (3.4%) |
| 75 to 79 Years | 25 (0.3%) | 100 (1.1%) |
| 80 to 84 Years | 18 (0.2%) | 11 (0.1%) |
| 85 Years and over | 5 (0.1%) | 53 (0.6%) |
| Total | 7,582 (100.0%) | 8,887 (100.0%) |
Families and Households in Fairburn
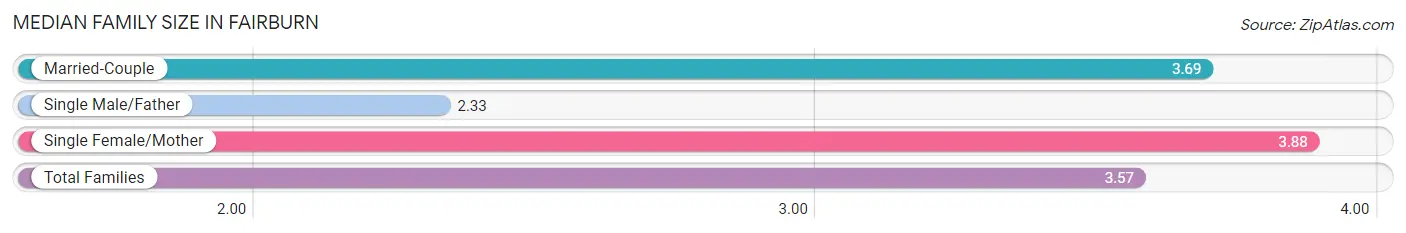
Median Family Size in Fairburn
The median family size in Fairburn is 3.57 persons per family, with single female/mother families (1,559 | 41.3%) accounting for the largest median family size of 3.88 persons per family. On the other hand, single male/father families (542 | 14.4%) represent the smallest median family size with 2.33 persons per family.
| Family Type | # Families | Family Size |
| Married-Couple | 1,670 (44.3%) | 3.69 |
| Single Male/Father | 542 (14.4%) | 2.33 |
| Single Female/Mother | 1,559 (41.3%) | 3.88 |
| Total Families | 3,771 (100.0%) | 3.57 |
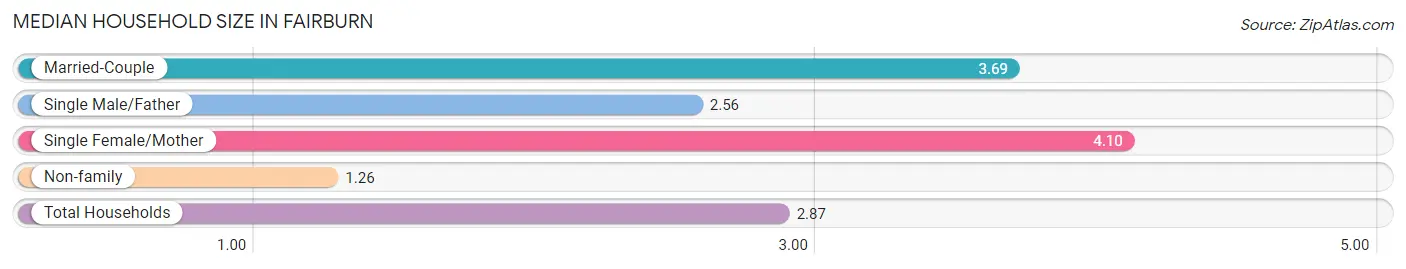
Median Household Size in Fairburn
The median household size in Fairburn is 2.87 persons per household, with single female/mother households (1,559 | 27.4%) accounting for the largest median household size of 4.1 persons per household. non-family households (1,926 | 33.8%) represent the smallest median household size with 1.26 persons per household.
| Household Type | # Households | Household Size |
| Married-Couple | 1,670 (29.3%) | 3.69 |
| Single Male/Father | 542 (9.5%) | 2.56 |
| Single Female/Mother | 1,559 (27.4%) | 4.10 |
| Non-family | 1,926 (33.8%) | 1.26 |
| Total Households | 5,697 (100.0%) | 2.87 |
Household Size by Marriage Status in Fairburn
Out of a total of 5,697 households in Fairburn, 3,771 (66.2%) are family households, while 1,926 (33.8%) are nonfamily households. The most numerous type of family households are 2-person households, comprising 1,380, and the most common type of nonfamily households are 1-person households, comprising 1,486.
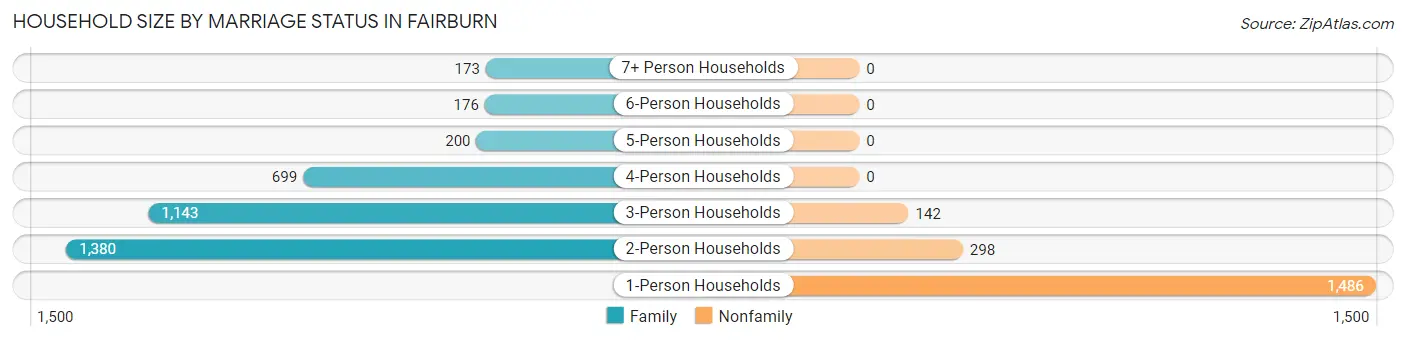
| Household Size | Family Households | Nonfamily Households |
| 1-Person Households | - | 1,486 (26.1%) |
| 2-Person Households | 1,380 (24.2%) | 298 (5.2%) |
| 3-Person Households | 1,143 (20.1%) | 142 (2.5%) |
| 4-Person Households | 699 (12.3%) | 0 (0.0%) |
| 5-Person Households | 200 (3.5%) | 0 (0.0%) |
| 6-Person Households | 176 (3.1%) | 0 (0.0%) |
| 7+ Person Households | 173 (3.0%) | 0 (0.0%) |
| Total | 3,771 (66.2%) | 1,926 (33.8%) |
Female Fertility in Fairburn
Fertility by Age in Fairburn
Average fertility rate in Fairburn is 54.0 births per 1,000 women. Women in the age bracket of 20 to 34 years have the highest fertility rate with 89.0 births per 1,000 women. Women in the age bracket of 20 to 34 years acount for 65.4% of all women with births.
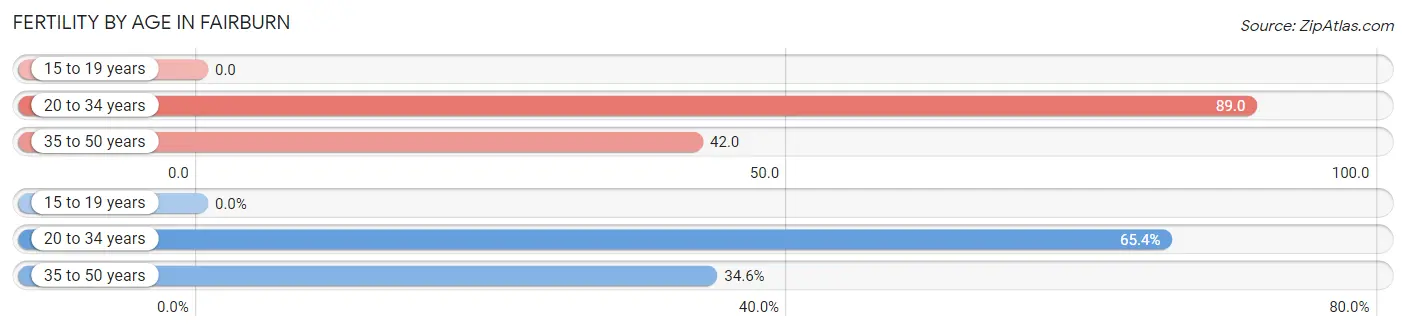
| Age Bracket | Women with Births | Births / 1,000 Women |
| 15 to 19 years | 0 (0.0%) | 0.0 |
| 20 to 34 years | 159 (65.4%) | 89.0 |
| 35 to 50 years | 84 (34.6%) | 42.0 |
| Total | 243 (100.0%) | 54.0 |
Fertility by Age by Marriage Status in Fairburn
65.4% of women with births (243) in Fairburn are married. The highest percentage of unmarried women with births falls into 35 to 50 years age bracket with 100.0% of them unmarried at the time of birth, while the lowest percentage of unmarried women with births belong to 20 to 34 years age bracket with 0.0% of them unmarried.
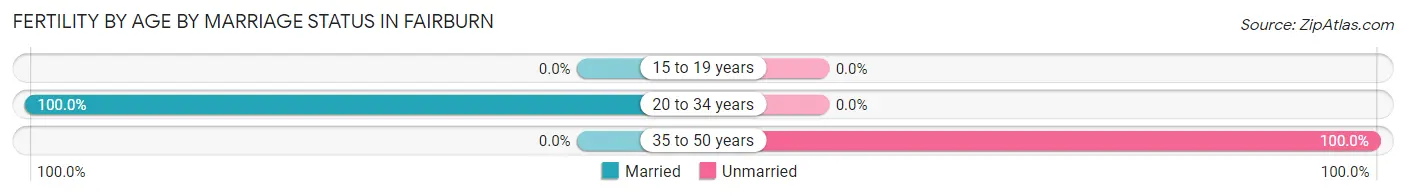
| Age Bracket | Married | Unmarried |
| 15 to 19 years | 0 (0.0%) | 0 (0.0%) |
| 20 to 34 years | 159 (100.0%) | 0 (0.0%) |
| 35 to 50 years | 0 (0.0%) | 84 (100.0%) |
| Total | 159 (65.4%) | 84 (34.6%) |
Fertility by Education in Fairburn
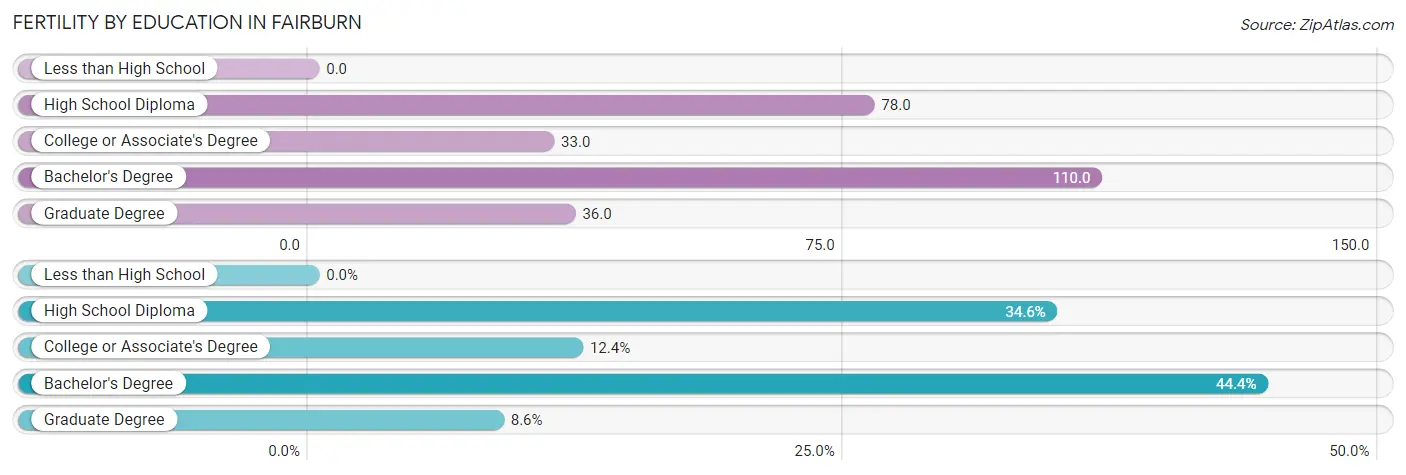
| Educational Attainment | Women with Births | Births / 1,000 Women |
| Less than High School | 0 (0.0%) | 0.0 |
| High School Diploma | 84 (34.6%) | 78.0 |
| College or Associate's Degree | 30 (12.3%) | 33.0 |
| Bachelor's Degree | 108 (44.4%) | 110.0 |
| Graduate Degree | 21 (8.6%) | 36.0 |
| Total | 243 (100.0%) | 54.0 |
Fertility by Education by Marriage Status in Fairburn
34.6% of women with births in Fairburn are unmarried. Women with the educational attainment of college or associate's degree are most likely to be married with 100.0% of them married at childbirth, while women with the educational attainment of high school diploma are least likely to be married with 100.0% of them unmarried at childbirth.
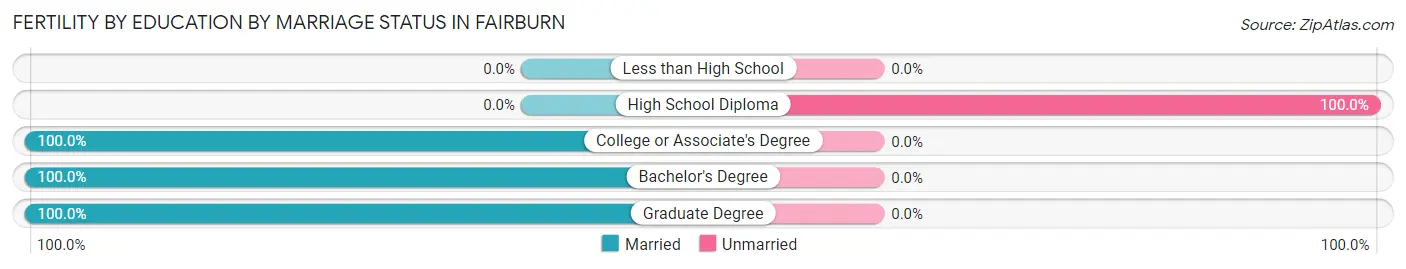
| Educational Attainment | Married | Unmarried |
| Less than High School | 0 (0.0%) | 0 (0.0%) |
| High School Diploma | 0 (0.0%) | 84 (100.0%) |
| College or Associate's Degree | 30 (100.0%) | 0 (0.0%) |
| Bachelor's Degree | 108 (100.0%) | 0 (0.0%) |
| Graduate Degree | 21 (100.0%) | 0 (0.0%) |
| Total | 159 (65.4%) | 84 (34.6%) |
Employment Characteristics in Fairburn
Employment by Class of Employer in Fairburn
Among the 8,055 employed individuals in Fairburn, private company employees (5,342 | 66.3%), local government employees (914 | 11.4%), and state government employees (734 | 9.1%) make up the most common classes of employment.
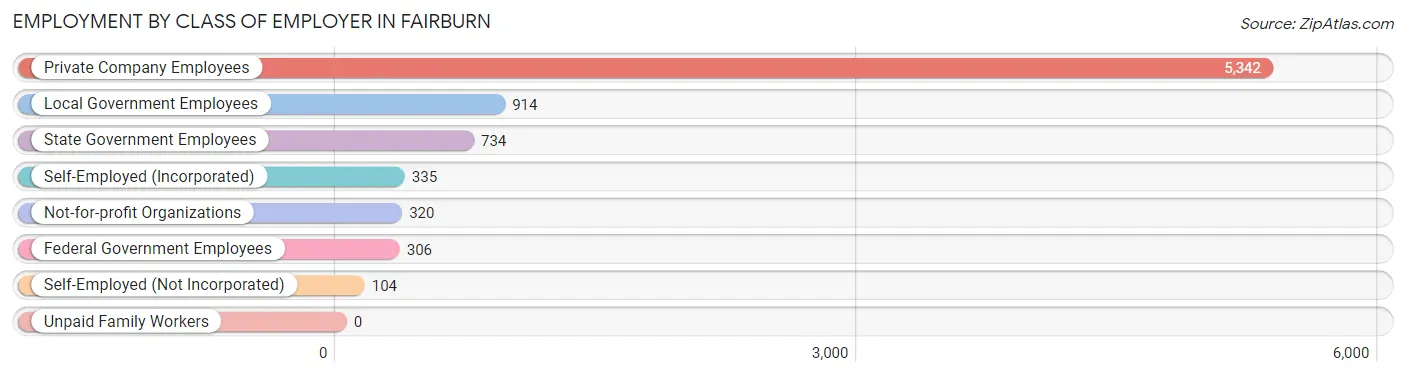
| Employer Class | # Employees | % Employees |
| Private Company Employees | 5,342 | 66.3% |
| Self-Employed (Incorporated) | 335 | 4.2% |
| Self-Employed (Not Incorporated) | 104 | 1.3% |
| Not-for-profit Organizations | 320 | 4.0% |
| Local Government Employees | 914 | 11.4% |
| State Government Employees | 734 | 9.1% |
| Federal Government Employees | 306 | 3.8% |
| Unpaid Family Workers | 0 | 0.0% |
| Total | 8,055 | 100.0% |
Employment Status by Age in Fairburn
According to the labor force statistics for Fairburn, out of the total population over 16 years of age (11,441), 75.1% or 8,592 individuals are in the labor force, with 5.2% or 447 of them unemployed. The age group with the highest labor force participation rate is 45 to 54 years, with 94.0% or 2,113 individuals in the labor force. Within the labor force, the 25 to 29 years age range has the highest percentage of unemployed individuals, with 20.3% or 204 of them being unemployed.
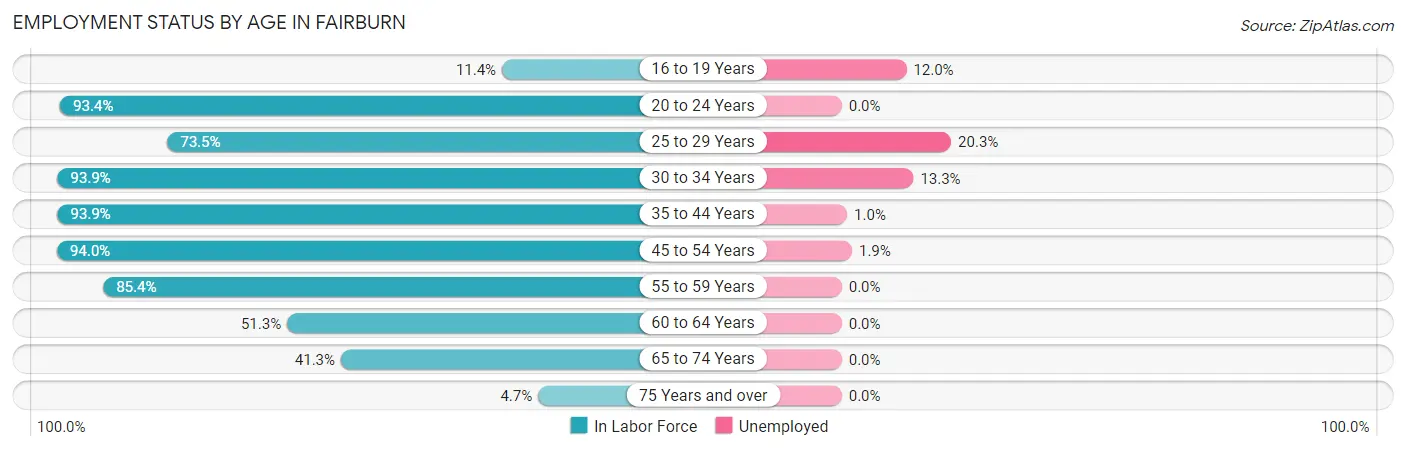
| Age Bracket | In Labor Force | Unemployed |
| 16 to 19 Years | 117 (11.4%) | 14 (12.0%) |
| 20 to 24 Years | 669 (93.4%) | 0 (0.0%) |
| 25 to 29 Years | 1,004 (73.5%) | 204 (20.3%) |
| 30 to 34 Years | 1,280 (93.9%) | 170 (13.3%) |
| 35 to 44 Years | 1,941 (93.9%) | 19 (1.0%) |
| 45 to 54 Years | 2,113 (94.0%) | 40 (1.9%) |
| 55 to 59 Years | 707 (85.4%) | 0 (0.0%) |
| 60 to 64 Years | 458 (51.3%) | 0 (0.0%) |
| 65 to 74 Years | 299 (41.3%) | 0 (0.0%) |
| 75 Years and over | 10 (4.7%) | 0 (0.0%) |
| Total | 8,592 (75.1%) | 447 (5.2%) |
Employment Status by Educational Attainment in Fairburn
According to labor force statistics for Fairburn, 85.6% of individuals (7,502) out of the total population between 25 and 64 years of age (8,764) are in the labor force, with 5.8% or 435 of them being unemployed. The group with the highest labor force participation rate are those with the educational attainment of bachelor's degree or higher, with 97.0% or 3,224 individuals in the labor force. Within the labor force, individuals with college / associate degree education have the highest percentage of unemployment, with 10.0% or 231 of them being unemployed.
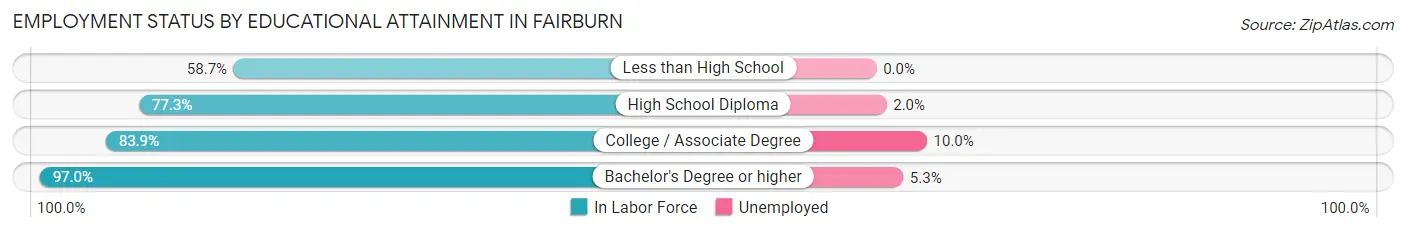
| Educational Attainment | In Labor Force | Unemployed |
| Less than High School | 344 (58.7%) | 0 (0.0%) |
| High School Diploma | 1,626 (77.3%) | 42 (2.0%) |
| College / Associate Degree | 2,307 (83.9%) | 275 (10.0%) |
| Bachelor's Degree or higher | 3,224 (97.0%) | 176 (5.3%) |
| Total | 7,502 (85.6%) | 508 (5.8%) |
Employment Occupations by Sex in Fairburn
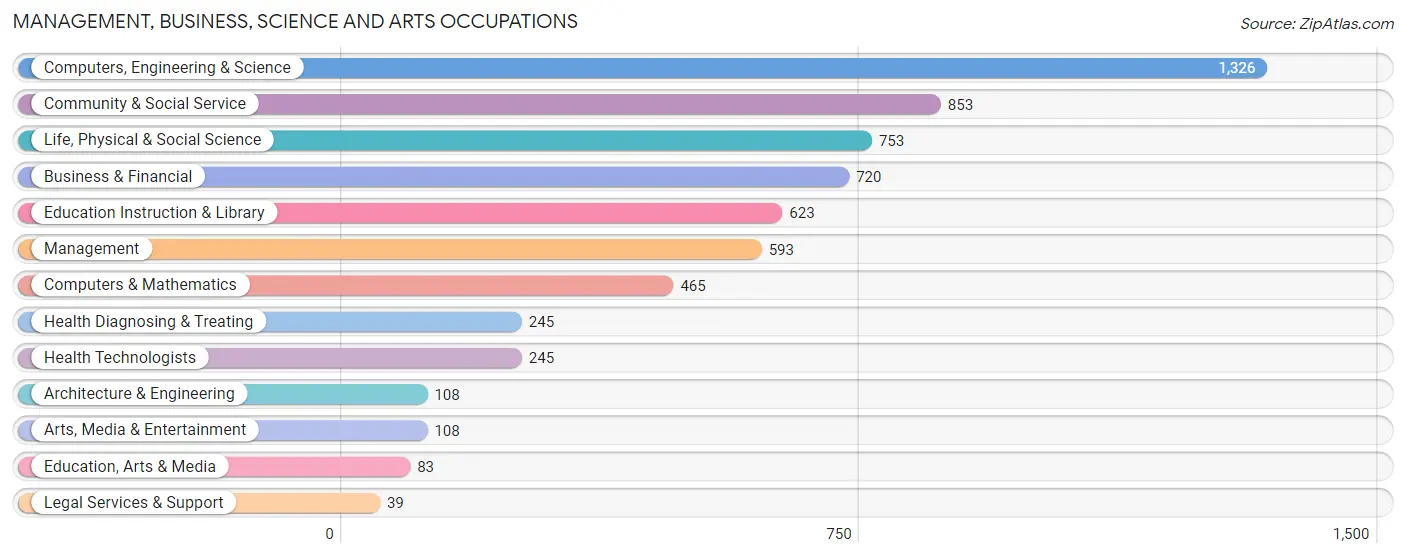
Management, Business, Science and Arts Occupations
The most common Management, Business, Science and Arts occupations in Fairburn are Computers, Engineering & Science (1,326 | 16.3%), Community & Social Service (853 | 10.5%), Life, Physical & Social Science (753 | 9.2%), Business & Financial (720 | 8.8%), and Education Instruction & Library (623 | 7.6%).
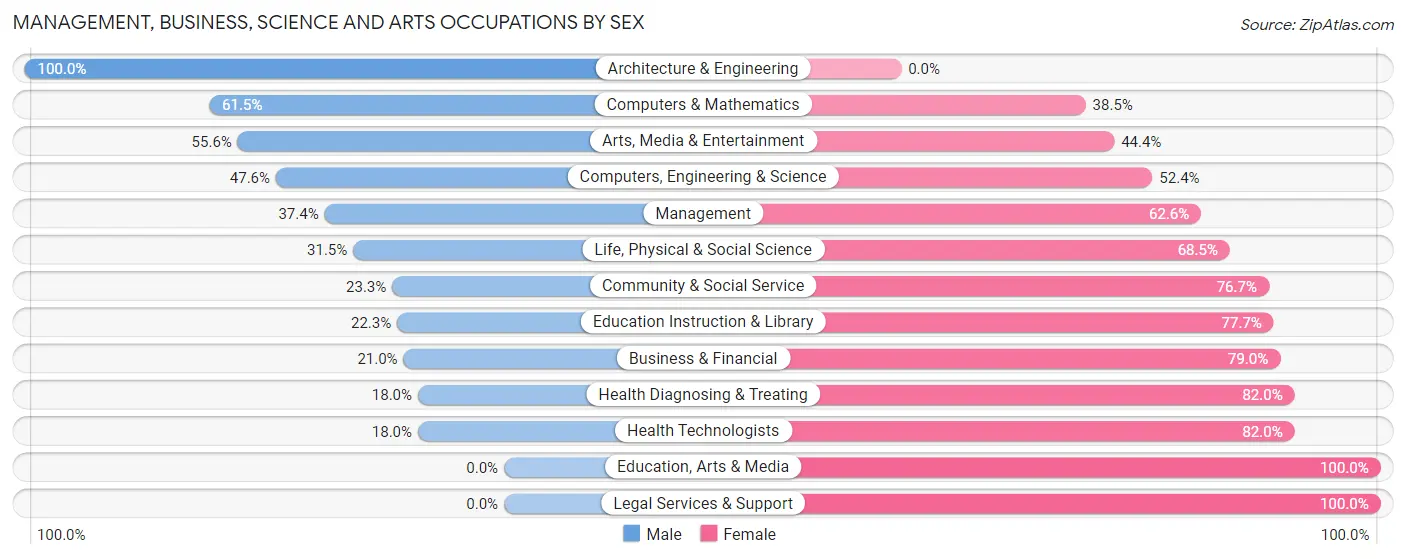
Management, Business, Science and Arts Occupations by Sex
Within the Management, Business, Science and Arts occupations in Fairburn, the most male-oriented occupations are Architecture & Engineering (100.0%), Computers & Mathematics (61.5%), and Arts, Media & Entertainment (55.6%), while the most female-oriented occupations are Education, Arts & Media (100.0%), Legal Services & Support (100.0%), and Health Diagnosing & Treating (82.0%).
| Occupation | Male | Female |
| Management | 222 (37.4%) | 371 (62.6%) |
| Business & Financial | 151 (21.0%) | 569 (79.0%) |
| Computers, Engineering & Science | 631 (47.6%) | 695 (52.4%) |
| Computers & Mathematics | 286 (61.5%) | 179 (38.5%) |
| Architecture & Engineering | 108 (100.0%) | 0 (0.0%) |
| Life, Physical & Social Science | 237 (31.5%) | 516 (68.5%) |
| Community & Social Service | 199 (23.3%) | 654 (76.7%) |
| Education, Arts & Media | 0 (0.0%) | 83 (100.0%) |
| Legal Services & Support | 0 (0.0%) | 39 (100.0%) |
| Education Instruction & Library | 139 (22.3%) | 484 (77.7%) |
| Arts, Media & Entertainment | 60 (55.6%) | 48 (44.4%) |
| Health Diagnosing & Treating | 44 (18.0%) | 201 (82.0%) |
| Health Technologists | 44 (18.0%) | 201 (82.0%) |
| Total (Category) | 1,247 (33.4%) | 2,490 (66.6%) |
| Total (Overall) | 3,595 (44.1%) | 4,554 (55.9%) |
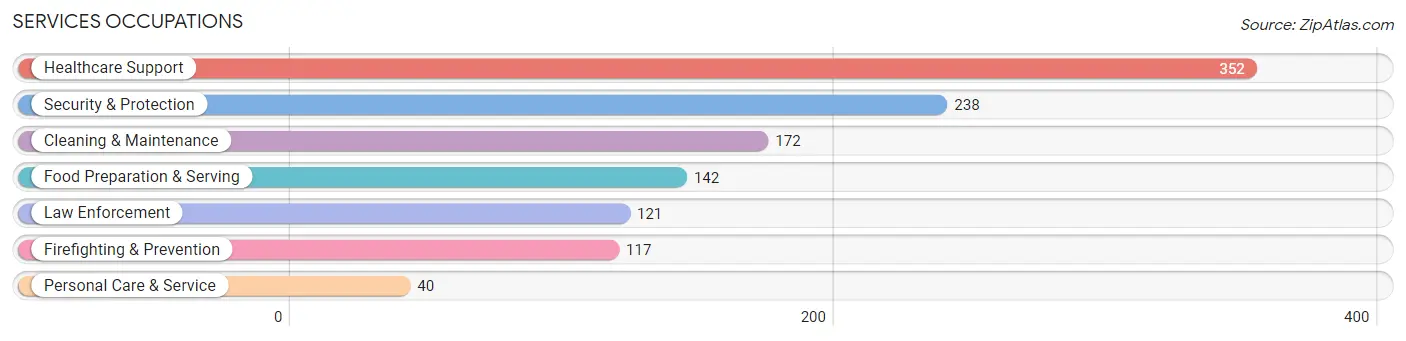
Services Occupations
The most common Services occupations in Fairburn are Healthcare Support (352 | 4.3%), Security & Protection (238 | 2.9%), Cleaning & Maintenance (172 | 2.1%), Food Preparation & Serving (142 | 1.7%), and Law Enforcement (121 | 1.5%).
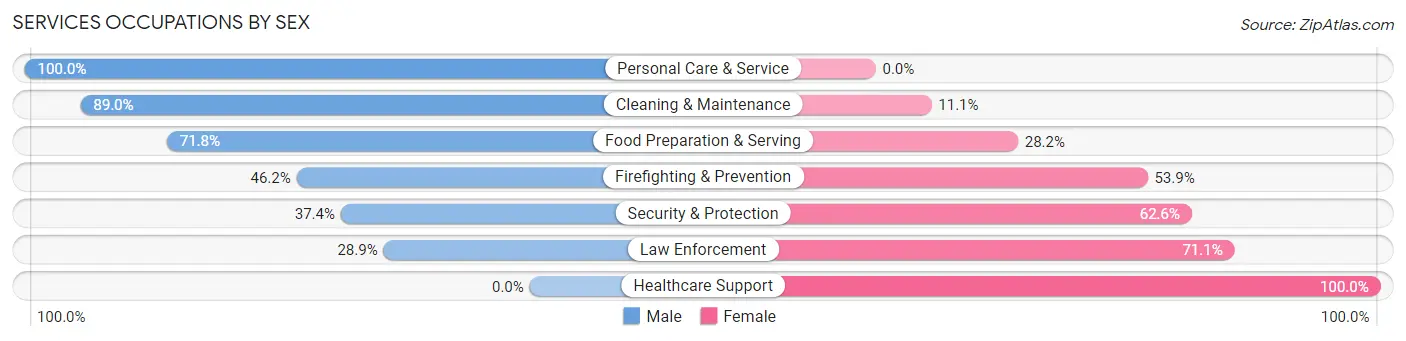
Services Occupations by Sex
Within the Services occupations in Fairburn, the most male-oriented occupations are Personal Care & Service (100.0%), Cleaning & Maintenance (88.9%), and Food Preparation & Serving (71.8%), while the most female-oriented occupations are Healthcare Support (100.0%), Law Enforcement (71.1%), and Security & Protection (62.6%).
| Occupation | Male | Female |
| Healthcare Support | 0 (0.0%) | 352 (100.0%) |
| Security & Protection | 89 (37.4%) | 149 (62.6%) |
| Firefighting & Prevention | 54 (46.2%) | 63 (53.8%) |
| Law Enforcement | 35 (28.9%) | 86 (71.1%) |
| Food Preparation & Serving | 102 (71.8%) | 40 (28.2%) |
| Cleaning & Maintenance | 153 (88.9%) | 19 (11.1%) |
| Personal Care & Service | 40 (100.0%) | 0 (0.0%) |
| Total (Category) | 384 (40.7%) | 560 (59.3%) |
| Total (Overall) | 3,595 (44.1%) | 4,554 (55.9%) |
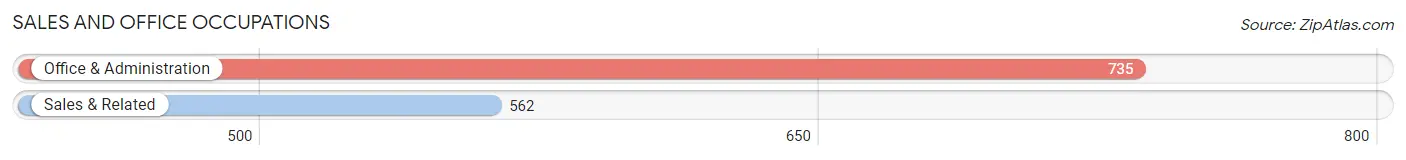
Sales and Office Occupations
The most common Sales and Office occupations in Fairburn are Office & Administration (735 | 9.0%), and Sales & Related (562 | 6.9%).
Sales and Office Occupations by Sex
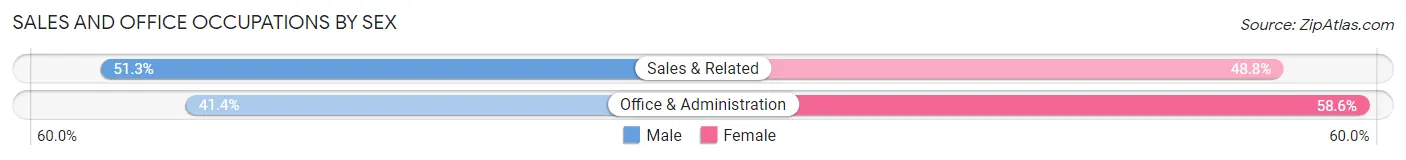
| Occupation | Male | Female |
| Sales & Related | 288 (51.2%) | 274 (48.7%) |
| Office & Administration | 304 (41.4%) | 431 (58.6%) |
| Total (Category) | 592 (45.6%) | 705 (54.4%) |
| Total (Overall) | 3,595 (44.1%) | 4,554 (55.9%) |
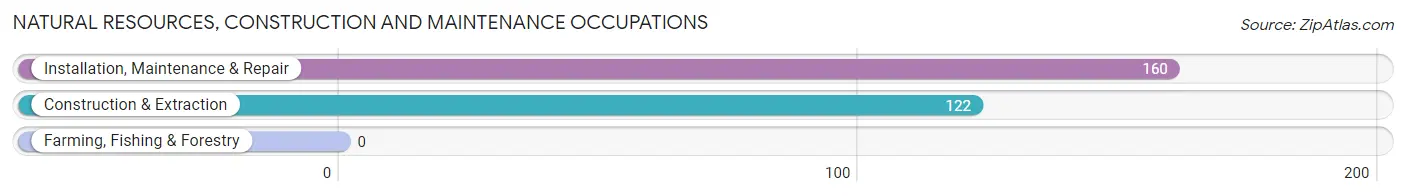
Natural Resources, Construction and Maintenance Occupations
The most common Natural Resources, Construction and Maintenance occupations in Fairburn are Installation, Maintenance & Repair (160 | 2.0%), and Construction & Extraction (122 | 1.5%).
Natural Resources, Construction and Maintenance Occupations by Sex
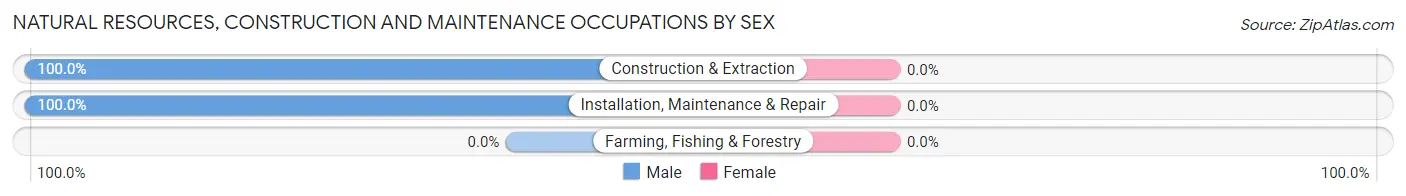
| Occupation | Male | Female |
| Farming, Fishing & Forestry | 0 (0.0%) | 0 (0.0%) |
| Construction & Extraction | 122 (100.0%) | 0 (0.0%) |
| Installation, Maintenance & Repair | 160 (100.0%) | 0 (0.0%) |
| Total (Category) | 282 (100.0%) | 0 (0.0%) |
| Total (Overall) | 3,595 (44.1%) | 4,554 (55.9%) |
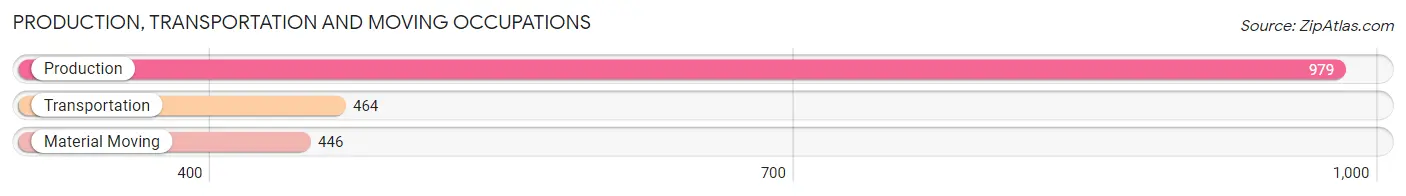
Production, Transportation and Moving Occupations
The most common Production, Transportation and Moving occupations in Fairburn are Production (979 | 12.0%), Transportation (464 | 5.7%), and Material Moving (446 | 5.5%).
Production, Transportation and Moving Occupations by Sex
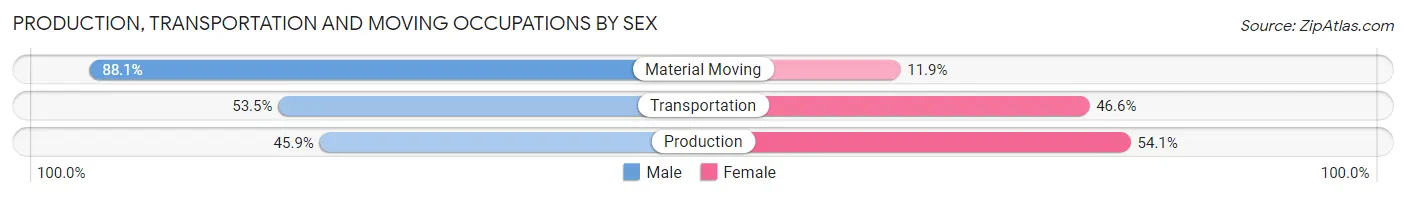
| Occupation | Male | Female |
| Production | 449 (45.9%) | 530 (54.1%) |
| Transportation | 248 (53.4%) | 216 (46.6%) |
| Material Moving | 393 (88.1%) | 53 (11.9%) |
| Total (Category) | 1,090 (57.7%) | 799 (42.3%) |
| Total (Overall) | 3,595 (44.1%) | 4,554 (55.9%) |
Employment Industries by Sex in Fairburn
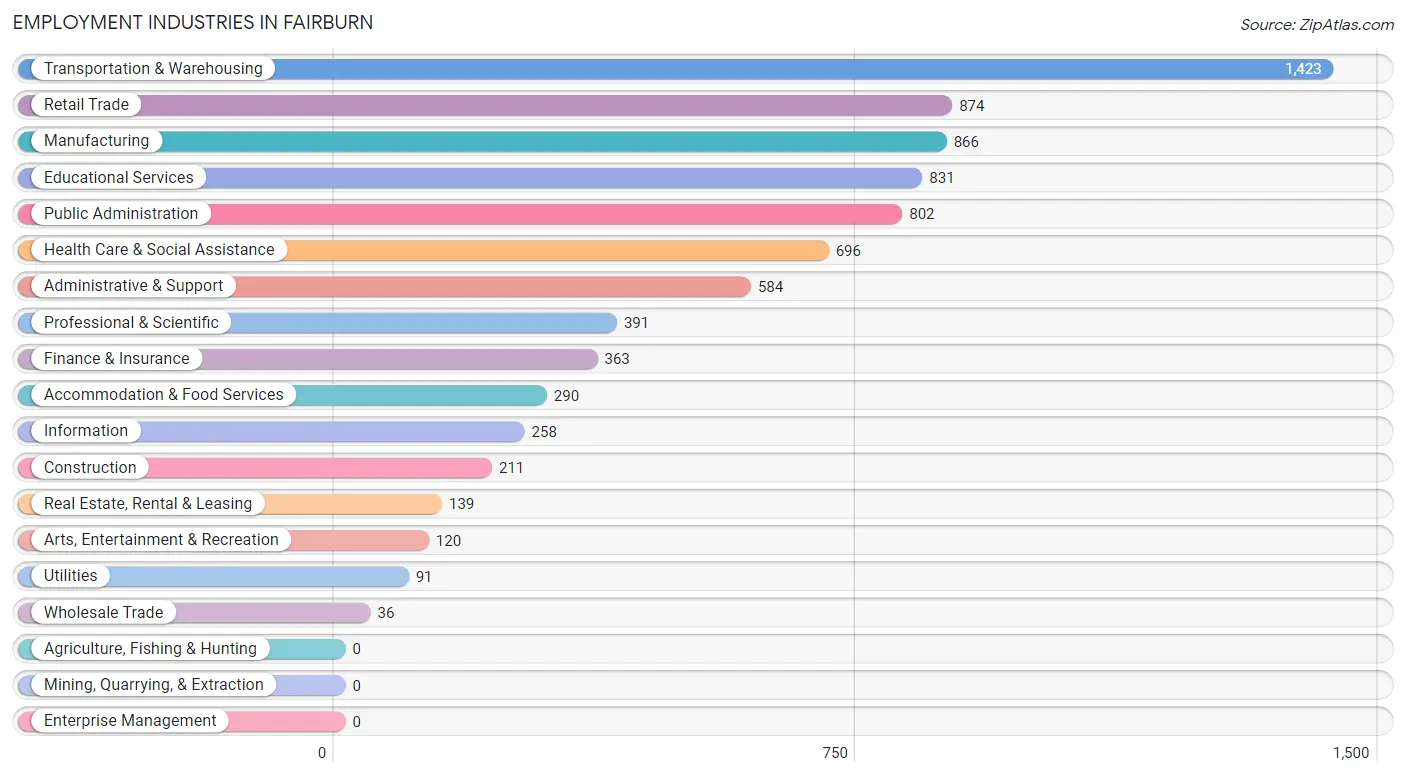
Employment Industries in Fairburn
The major employment industries in Fairburn include Transportation & Warehousing (1,423 | 17.5%), Retail Trade (874 | 10.7%), Manufacturing (866 | 10.6%), Educational Services (831 | 10.2%), and Public Administration (802 | 9.8%).
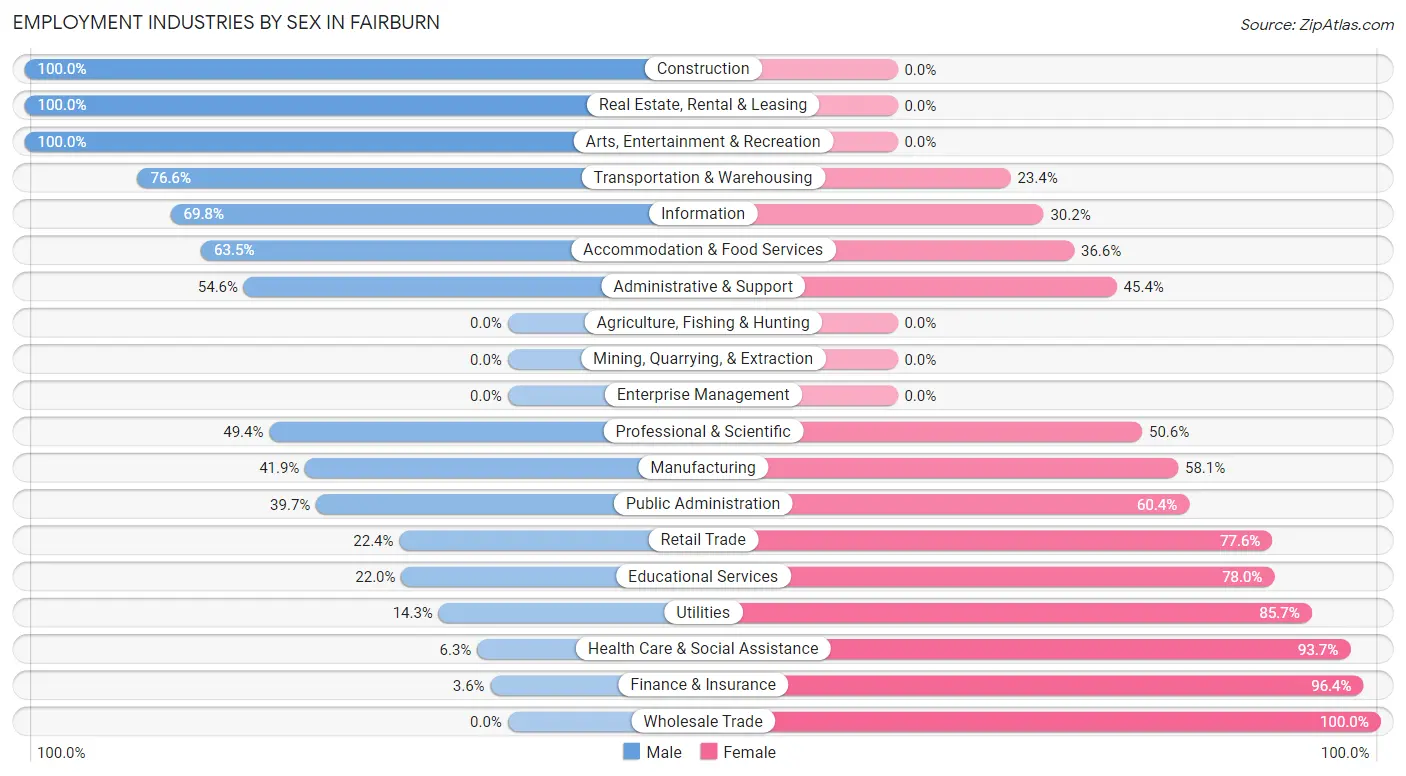
Employment Industries by Sex in Fairburn
The Fairburn industries that see more men than women are Construction (100.0%), Real Estate, Rental & Leasing (100.0%), and Arts, Entertainment & Recreation (100.0%), whereas the industries that tend to have a higher number of women are Wholesale Trade (100.0%), Finance & Insurance (96.4%), and Health Care & Social Assistance (93.7%).
| Industry | Male | Female |
| Agriculture, Fishing & Hunting | 0 (0.0%) | 0 (0.0%) |
| Mining, Quarrying, & Extraction | 0 (0.0%) | 0 (0.0%) |
| Construction | 211 (100.0%) | 0 (0.0%) |
| Manufacturing | 363 (41.9%) | 503 (58.1%) |
| Wholesale Trade | 0 (0.0%) | 36 (100.0%) |
| Retail Trade | 196 (22.4%) | 678 (77.6%) |
| Transportation & Warehousing | 1,090 (76.6%) | 333 (23.4%) |
| Utilities | 13 (14.3%) | 78 (85.7%) |
| Information | 180 (69.8%) | 78 (30.2%) |
| Finance & Insurance | 13 (3.6%) | 350 (96.4%) |
| Real Estate, Rental & Leasing | 139 (100.0%) | 0 (0.0%) |
| Professional & Scientific | 193 (49.4%) | 198 (50.6%) |
| Enterprise Management | 0 (0.0%) | 0 (0.0%) |
| Administrative & Support | 319 (54.6%) | 265 (45.4%) |
| Educational Services | 183 (22.0%) | 648 (78.0%) |
| Health Care & Social Assistance | 44 (6.3%) | 652 (93.7%) |
| Arts, Entertainment & Recreation | 120 (100.0%) | 0 (0.0%) |
| Accommodation & Food Services | 184 (63.4%) | 106 (36.5%) |
| Public Administration | 318 (39.7%) | 484 (60.4%) |
| Total | 3,595 (44.1%) | 4,554 (55.9%) |
Education in Fairburn
School Enrollment in Fairburn
The most common levels of schooling among the 4,628 students in Fairburn are middle school (1,064 | 23.0%), high school (1,058 | 22.9%), and elementary school (974 | 21.0%).
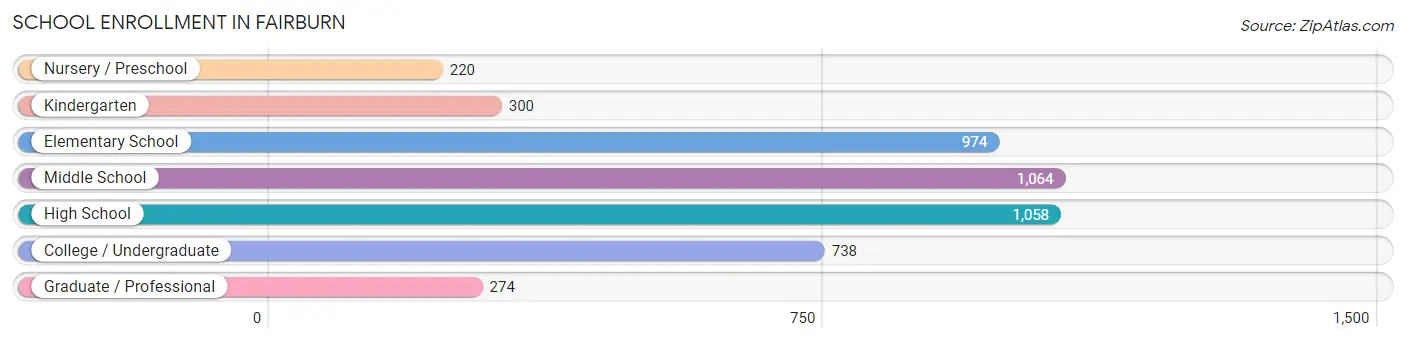
| School Level | # Students | % Students |
| Nursery / Preschool | 220 | 4.8% |
| Kindergarten | 300 | 6.5% |
| Elementary School | 974 | 21.0% |
| Middle School | 1,064 | 23.0% |
| High School | 1,058 | 22.9% |
| College / Undergraduate | 738 | 16.0% |
| Graduate / Professional | 274 | 5.9% |
| Total | 4,628 | 100.0% |
School Enrollment by Age by Funding Source in Fairburn
Out of a total of 4,628 students who are enrolled in schools in Fairburn, 625 (13.5%) attend a private institution, while the remaining 4,003 (86.5%) are enrolled in public schools. The age group of 3 to 4 year olds has the highest likelihood of being enrolled in private schools, with 274 (78.7% in the age bracket) enrolled. Conversely, the age group of 18 to 19 year olds has the lowest likelihood of being enrolled in a private school, with 166 (100.0% in the age bracket) attending a public institution.
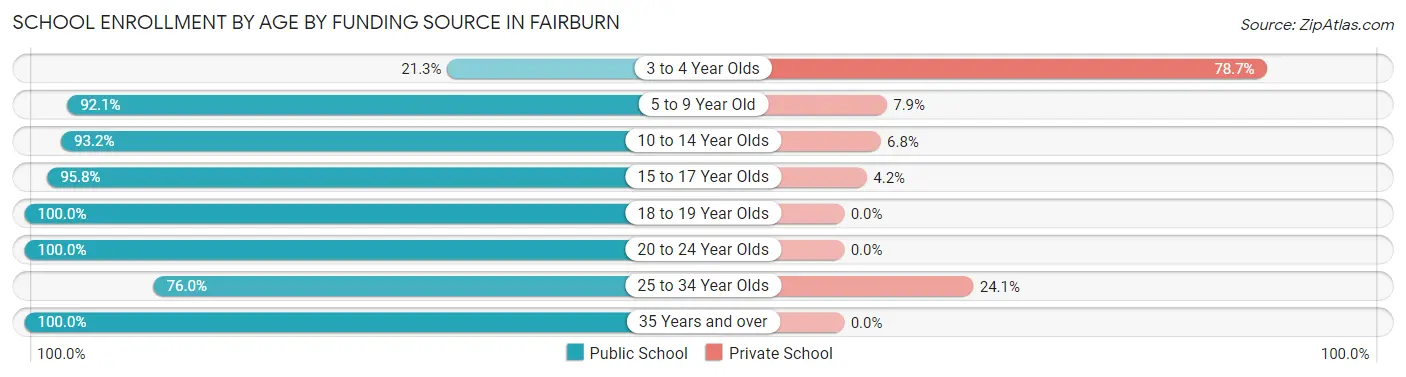
| Age Bracket | Public School | Private School |
| 3 to 4 Year Olds | 74 (21.3%) | 274 (78.7%) |
| 5 to 9 Year Old | 1,020 (92.1%) | 88 (7.9%) |
| 10 to 14 Year Olds | 1,305 (93.2%) | 95 (6.8%) |
| 15 to 17 Year Olds | 636 (95.8%) | 28 (4.2%) |
| 18 to 19 Year Olds | 166 (100.0%) | 0 (0.0%) |
| 20 to 24 Year Olds | 164 (100.0%) | 0 (0.0%) |
| 25 to 34 Year Olds | 439 (75.9%) | 139 (24.0%) |
| 35 Years and over | 200 (100.0%) | 0 (0.0%) |
| Total | 4,003 (86.5%) | 625 (13.5%) |
Educational Attainment by Field of Study in Fairburn
Business (866 | 22.0%), arts & humanities (566 | 14.4%), social sciences (492 | 12.5%), science & technology (459 | 11.7%), and bio, nature & agricultural (347 | 8.8%) are the most common fields of study among 3,932 individuals in Fairburn who have obtained a bachelor's degree or higher.
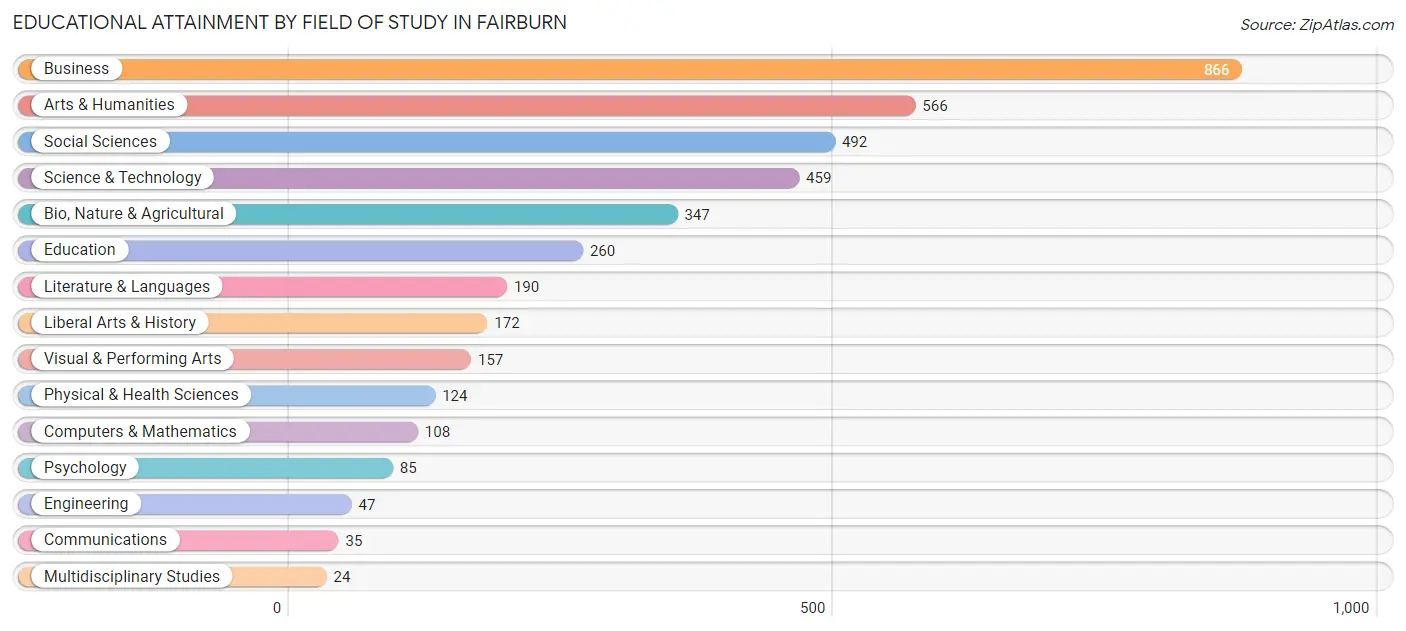
| Field of Study | # Graduates | % Graduates |
| Computers & Mathematics | 108 | 2.8% |
| Bio, Nature & Agricultural | 347 | 8.8% |
| Physical & Health Sciences | 124 | 3.2% |
| Psychology | 85 | 2.2% |
| Social Sciences | 492 | 12.5% |
| Engineering | 47 | 1.2% |
| Multidisciplinary Studies | 24 | 0.6% |
| Science & Technology | 459 | 11.7% |
| Business | 866 | 22.0% |
| Education | 260 | 6.6% |
| Literature & Languages | 190 | 4.8% |
| Liberal Arts & History | 172 | 4.4% |
| Visual & Performing Arts | 157 | 4.0% |
| Communications | 35 | 0.9% |
| Arts & Humanities | 566 | 14.4% |
| Total | 3,932 | 100.0% |
Transportation & Commute in Fairburn
Vehicle Availability by Sex in Fairburn
The most prevalent vehicle ownership categories in Fairburn are males with 2 vehicles (1,351, accounting for 37.8%) and females with 2 vehicles (1,438, making up 30.1%).
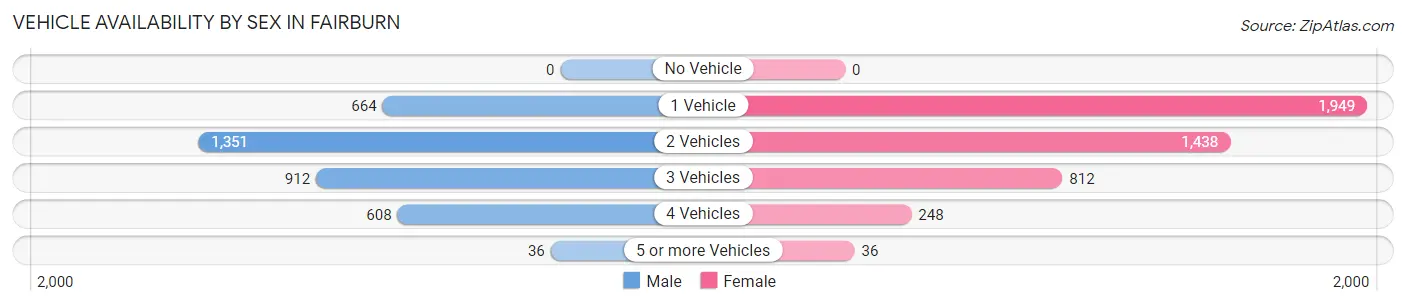
| Vehicles Available | Male | Female |
| No Vehicle | 0 (0.0%) | 0 (0.0%) |
| 1 Vehicle | 664 (18.6%) | 1,949 (43.5%) |
| 2 Vehicles | 1,351 (37.8%) | 1,438 (32.1%) |
| 3 Vehicles | 912 (25.5%) | 812 (18.1%) |
| 4 Vehicles | 608 (17.0%) | 248 (5.5%) |
| 5 or more Vehicles | 36 (1.0%) | 36 (0.8%) |
| Total | 3,571 (100.0%) | 4,483 (100.0%) |
Commute Time in Fairburn
The most frequently occuring commute durations in Fairburn are 20 to 24 minutes (1,130 commuters, 17.1%), 15 to 19 minutes (963 commuters, 14.6%), and 30 to 34 minutes (818 commuters, 12.4%).
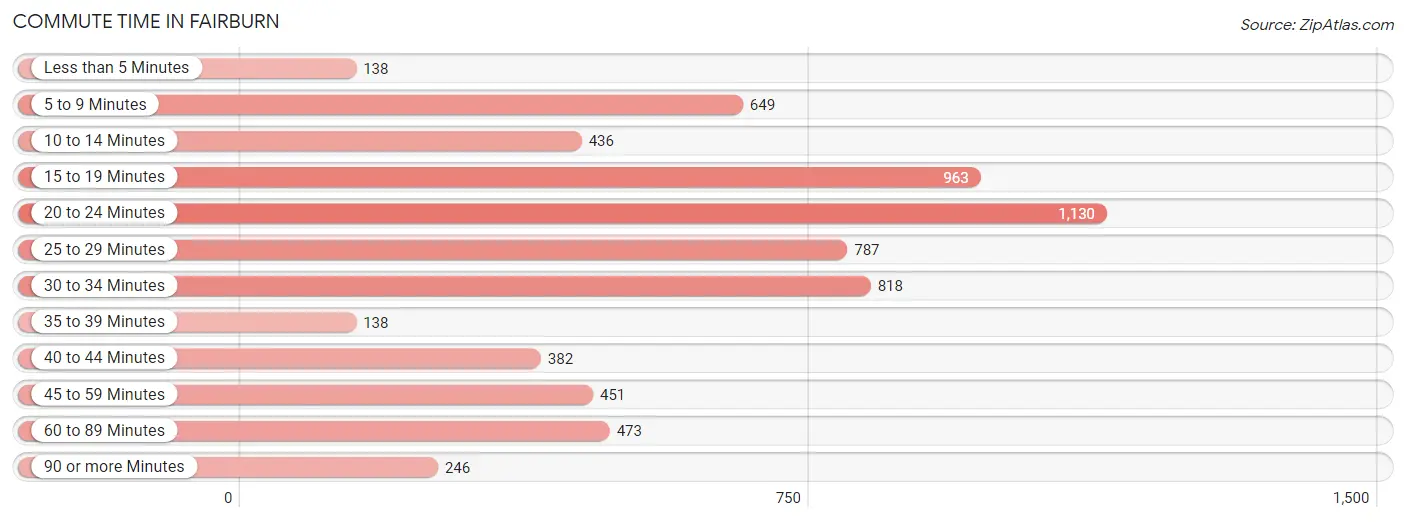
| Commute Time | # Commuters | % Commuters |
| Less than 5 Minutes | 138 | 2.1% |
| 5 to 9 Minutes | 649 | 9.8% |
| 10 to 14 Minutes | 436 | 6.6% |
| 15 to 19 Minutes | 963 | 14.6% |
| 20 to 24 Minutes | 1,130 | 17.1% |
| 25 to 29 Minutes | 787 | 11.9% |
| 30 to 34 Minutes | 818 | 12.4% |
| 35 to 39 Minutes | 138 | 2.1% |
| 40 to 44 Minutes | 382 | 5.8% |
| 45 to 59 Minutes | 451 | 6.8% |
| 60 to 89 Minutes | 473 | 7.1% |
| 90 or more Minutes | 246 | 3.7% |
Commute Time by Sex in Fairburn
The most common commute times in Fairburn are 20 to 24 minutes (518 commuters, 16.3%) for males and 20 to 24 minutes (612 commuters, 17.9%) for females.
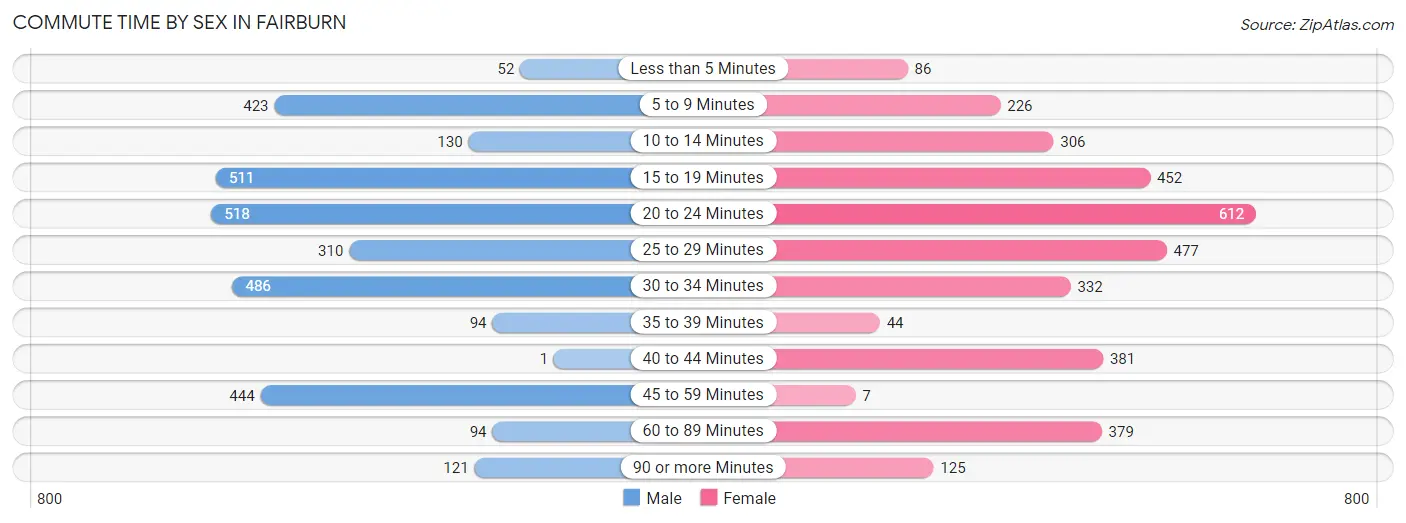
| Commute Time | Male | Female |
| Less than 5 Minutes | 52 (1.6%) | 86 (2.5%) |
| 5 to 9 Minutes | 423 (13.3%) | 226 (6.6%) |
| 10 to 14 Minutes | 130 (4.1%) | 306 (8.9%) |
| 15 to 19 Minutes | 511 (16.1%) | 452 (13.2%) |
| 20 to 24 Minutes | 518 (16.3%) | 612 (17.9%) |
| 25 to 29 Minutes | 310 (9.7%) | 477 (13.9%) |
| 30 to 34 Minutes | 486 (15.3%) | 332 (9.7%) |
| 35 to 39 Minutes | 94 (2.9%) | 44 (1.3%) |
| 40 to 44 Minutes | 1 (0.0%) | 381 (11.1%) |
| 45 to 59 Minutes | 444 (13.9%) | 7 (0.2%) |
| 60 to 89 Minutes | 94 (2.9%) | 379 (11.1%) |
| 90 or more Minutes | 121 (3.8%) | 125 (3.6%) |
Time of Departure to Work by Sex in Fairburn
The most frequent times of departure to work in Fairburn are 12:00 PM to 3:59 PM (700, 22.0%) for males and 7:30 AM to 7:59 AM (566, 16.5%) for females.
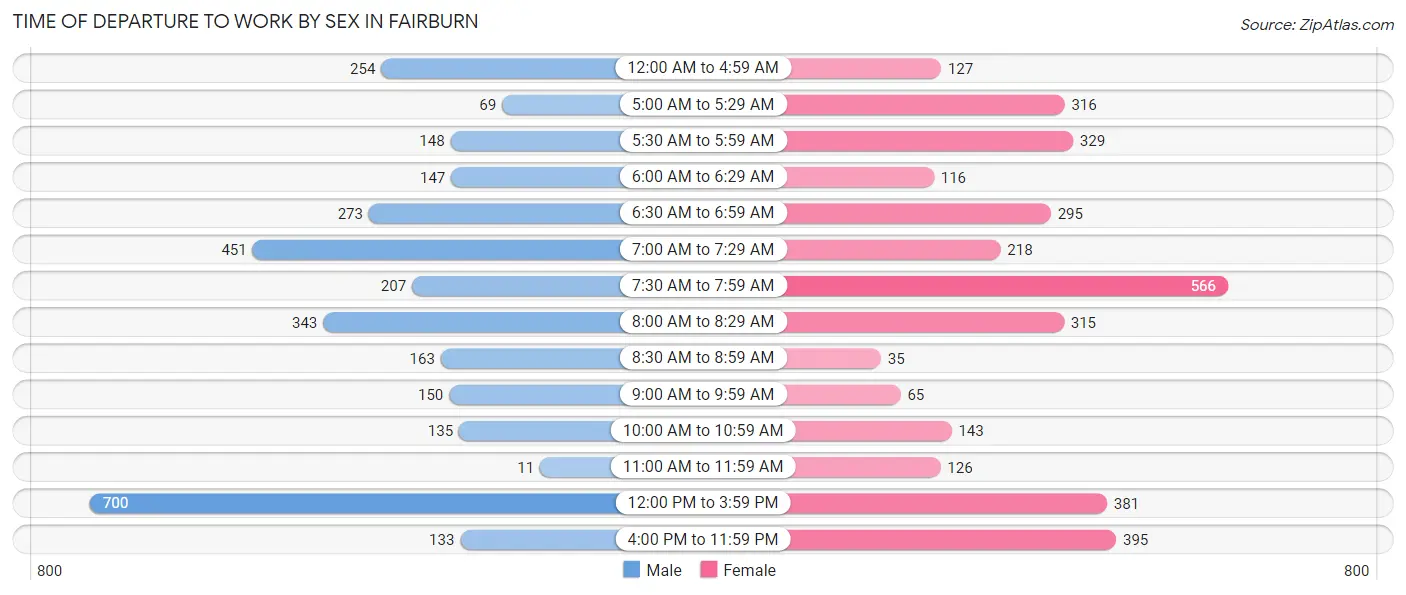
| Time of Departure | Male | Female |
| 12:00 AM to 4:59 AM | 254 (8.0%) | 127 (3.7%) |
| 5:00 AM to 5:29 AM | 69 (2.2%) | 316 (9.2%) |
| 5:30 AM to 5:59 AM | 148 (4.6%) | 329 (9.6%) |
| 6:00 AM to 6:29 AM | 147 (4.6%) | 116 (3.4%) |
| 6:30 AM to 6:59 AM | 273 (8.6%) | 295 (8.6%) |
| 7:00 AM to 7:29 AM | 451 (14.2%) | 218 (6.4%) |
| 7:30 AM to 7:59 AM | 207 (6.5%) | 566 (16.5%) |
| 8:00 AM to 8:29 AM | 343 (10.8%) | 315 (9.2%) |
| 8:30 AM to 8:59 AM | 163 (5.1%) | 35 (1.0%) |
| 9:00 AM to 9:59 AM | 150 (4.7%) | 65 (1.9%) |
| 10:00 AM to 10:59 AM | 135 (4.2%) | 143 (4.2%) |
| 11:00 AM to 11:59 AM | 11 (0.4%) | 126 (3.7%) |
| 12:00 PM to 3:59 PM | 700 (22.0%) | 381 (11.1%) |
| 4:00 PM to 11:59 PM | 133 (4.2%) | 395 (11.5%) |
| Total | 3,184 (100.0%) | 3,427 (100.0%) |
Housing Occupancy in Fairburn
Occupancy by Ownership in Fairburn
Of the total 5,697 dwellings in Fairburn, owner-occupied units account for 3,225 (56.6%), while renter-occupied units make up 2,472 (43.4%).
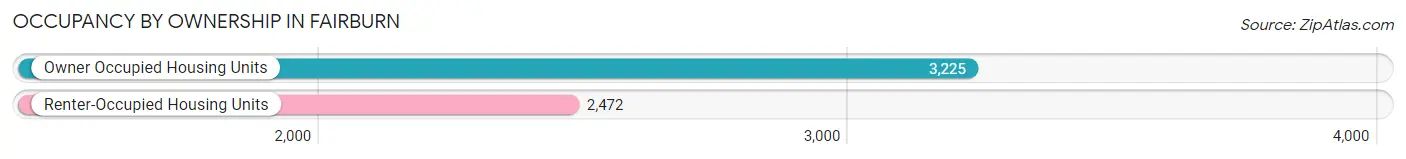
| Occupancy | # Housing Units | % Housing Units |
| Owner Occupied Housing Units | 3,225 | 56.6% |
| Renter-Occupied Housing Units | 2,472 | 43.4% |
| Total Occupied Housing Units | 5,697 | 100.0% |
Occupancy by Household Size in Fairburn
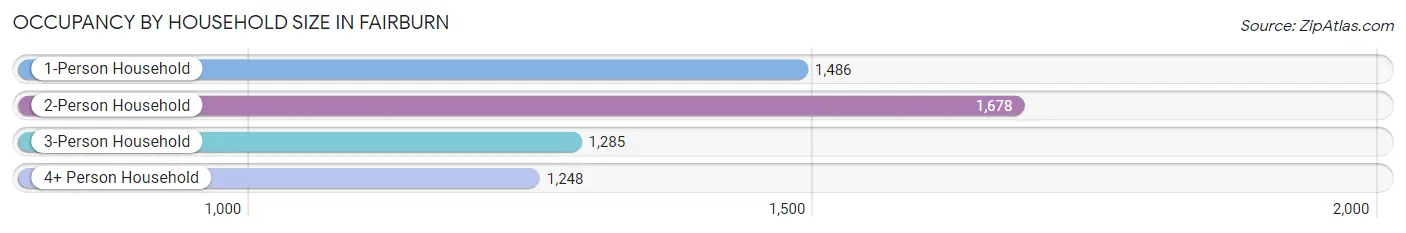
| Household Size | # Housing Units | % Housing Units |
| 1-Person Household | 1,486 | 26.1% |
| 2-Person Household | 1,678 | 29.4% |
| 3-Person Household | 1,285 | 22.6% |
| 4+ Person Household | 1,248 | 21.9% |
| Total Housing Units | 5,697 | 100.0% |
Occupancy by Ownership by Household Size in Fairburn
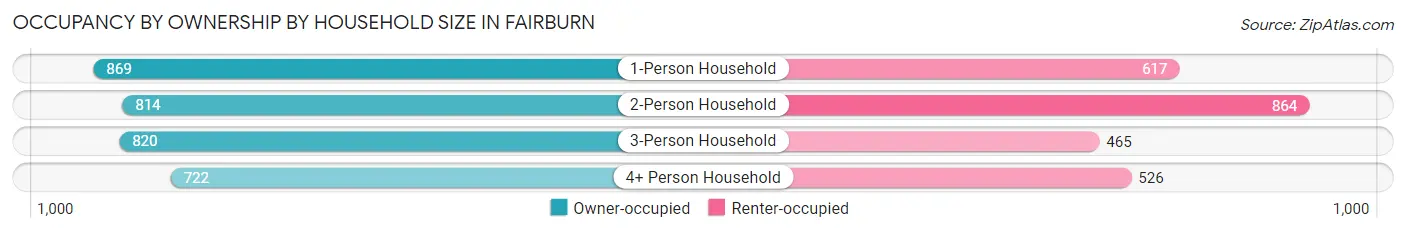
| Household Size | Owner-occupied | Renter-occupied |
| 1-Person Household | 869 (58.5%) | 617 (41.5%) |
| 2-Person Household | 814 (48.5%) | 864 (51.5%) |
| 3-Person Household | 820 (63.8%) | 465 (36.2%) |
| 4+ Person Household | 722 (57.9%) | 526 (42.1%) |
| Total Housing Units | 3,225 (56.6%) | 2,472 (43.4%) |
Occupancy by Educational Attainment in Fairburn
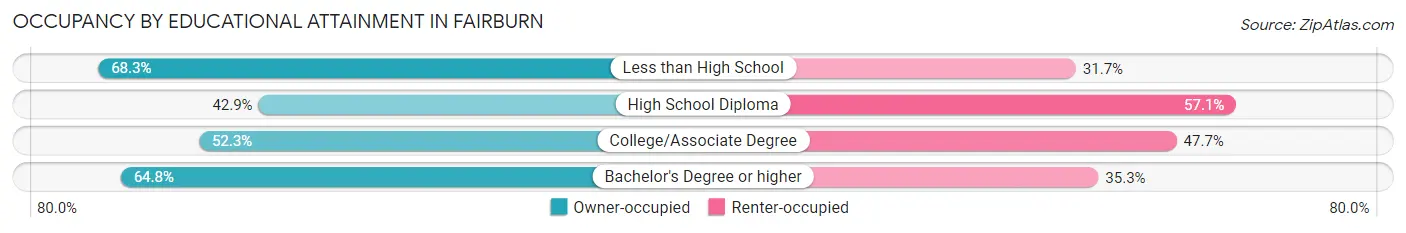
| Household Size | Owner-occupied | Renter-occupied |
| Less than High School | 220 (68.3%) | 102 (31.7%) |
| High School Diploma | 481 (42.9%) | 640 (57.1%) |
| College/Associate Degree | 972 (52.3%) | 885 (47.7%) |
| Bachelor's Degree or higher | 1,552 (64.7%) | 845 (35.2%) |
Occupancy by Age of Householder in Fairburn
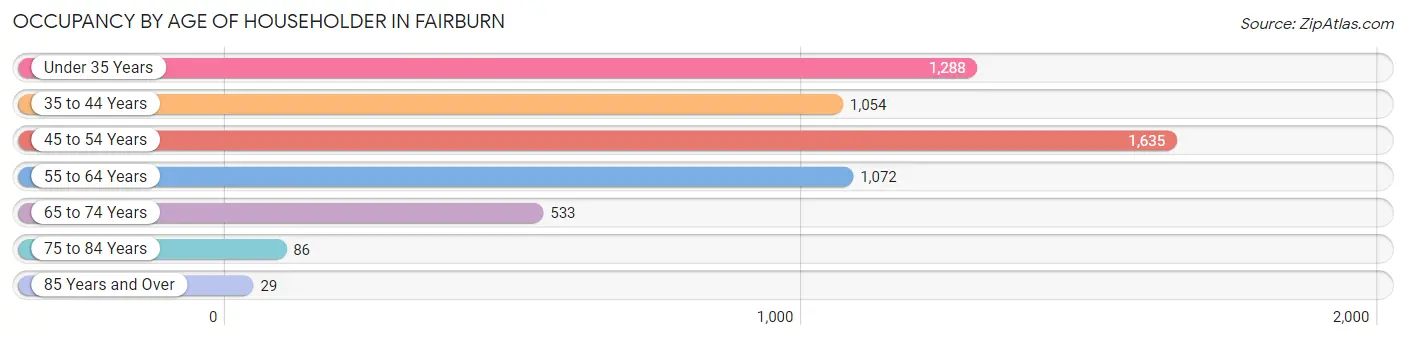
| Age Bracket | # Households | % Households |
| Under 35 Years | 1,288 | 22.6% |
| 35 to 44 Years | 1,054 | 18.5% |
| 45 to 54 Years | 1,635 | 28.7% |
| 55 to 64 Years | 1,072 | 18.8% |
| 65 to 74 Years | 533 | 9.4% |
| 75 to 84 Years | 86 | 1.5% |
| 85 Years and Over | 29 | 0.5% |
| Total | 5,697 | 100.0% |
Housing Finances in Fairburn
Median Income by Occupancy in Fairburn
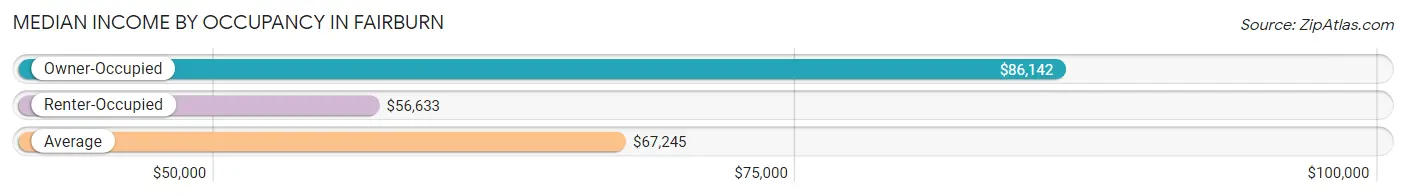
| Occupancy Type | # Households | Median Income |
| Owner-Occupied | 3,225 (56.6%) | $86,142 |
| Renter-Occupied | 2,472 (43.4%) | $56,633 |
| Average | 5,697 (100.0%) | $67,245 |
Occupancy by Householder Income Bracket in Fairburn
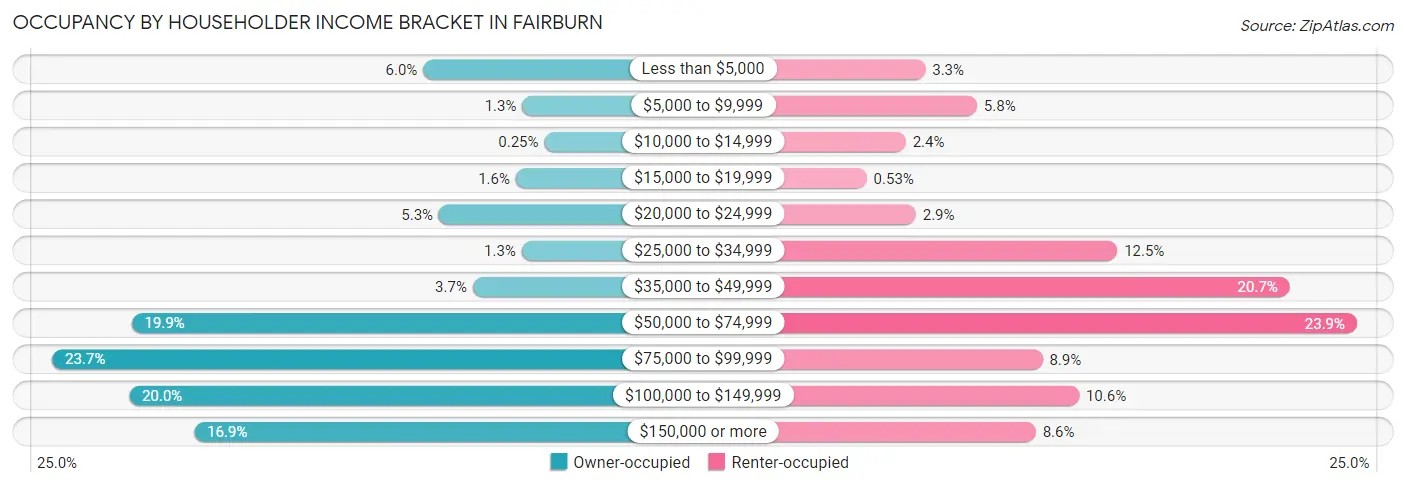
| Income Bracket | Owner-occupied | Renter-occupied |
| Less than $5,000 | 194 (6.0%) | 82 (3.3%) |
| $5,000 to $9,999 | 42 (1.3%) | 143 (5.8%) |
| $10,000 to $14,999 | 8 (0.3%) | 59 (2.4%) |
| $15,000 to $19,999 | 52 (1.6%) | 13 (0.5%) |
| $20,000 to $24,999 | 170 (5.3%) | 71 (2.9%) |
| $25,000 to $34,999 | 43 (1.3%) | 308 (12.5%) |
| $35,000 to $49,999 | 118 (3.7%) | 511 (20.7%) |
| $50,000 to $74,999 | 642 (19.9%) | 590 (23.9%) |
| $75,000 to $99,999 | 764 (23.7%) | 220 (8.9%) |
| $100,000 to $149,999 | 646 (20.0%) | 263 (10.6%) |
| $150,000 or more | 546 (16.9%) | 212 (8.6%) |
| Total | 3,225 (100.0%) | 2,472 (100.0%) |
Monthly Housing Cost Tiers in Fairburn
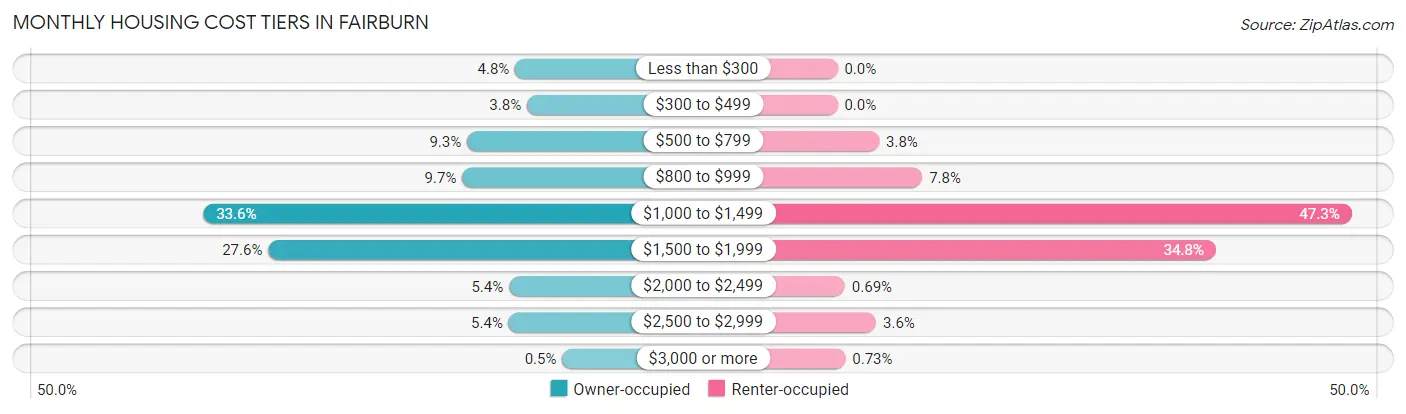
| Monthly Cost | Owner-occupied | Renter-occupied |
| Less than $300 | 156 (4.8%) | 0 (0.0%) |
| $300 to $499 | 121 (3.7%) | 0 (0.0%) |
| $500 to $799 | 299 (9.3%) | 95 (3.8%) |
| $800 to $999 | 313 (9.7%) | 193 (7.8%) |
| $1,000 to $1,499 | 1,082 (33.6%) | 1,170 (47.3%) |
| $1,500 to $1,999 | 889 (27.6%) | 861 (34.8%) |
| $2,000 to $2,499 | 174 (5.4%) | 17 (0.7%) |
| $2,500 to $2,999 | 175 (5.4%) | 88 (3.6%) |
| $3,000 or more | 16 (0.5%) | 18 (0.7%) |
| Total | 3,225 (100.0%) | 2,472 (100.0%) |
Physical Housing Characteristics in Fairburn
Housing Structures in Fairburn
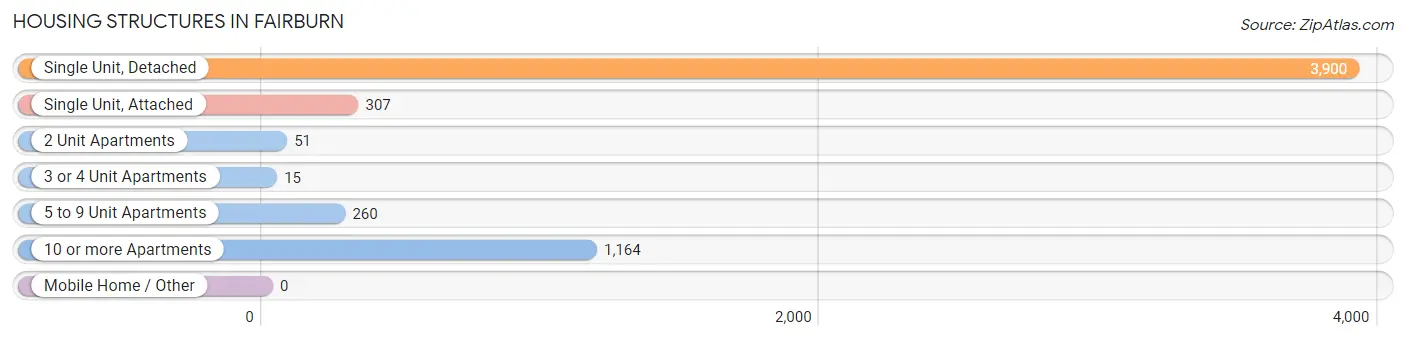
| Structure Type | # Housing Units | % Housing Units |
| Single Unit, Detached | 3,900 | 68.5% |
| Single Unit, Attached | 307 | 5.4% |
| 2 Unit Apartments | 51 | 0.9% |
| 3 or 4 Unit Apartments | 15 | 0.3% |
| 5 to 9 Unit Apartments | 260 | 4.6% |
| 10 or more Apartments | 1,164 | 20.4% |
| Mobile Home / Other | 0 | 0.0% |
| Total | 5,697 | 100.0% |
Housing Structures by Occupancy in Fairburn
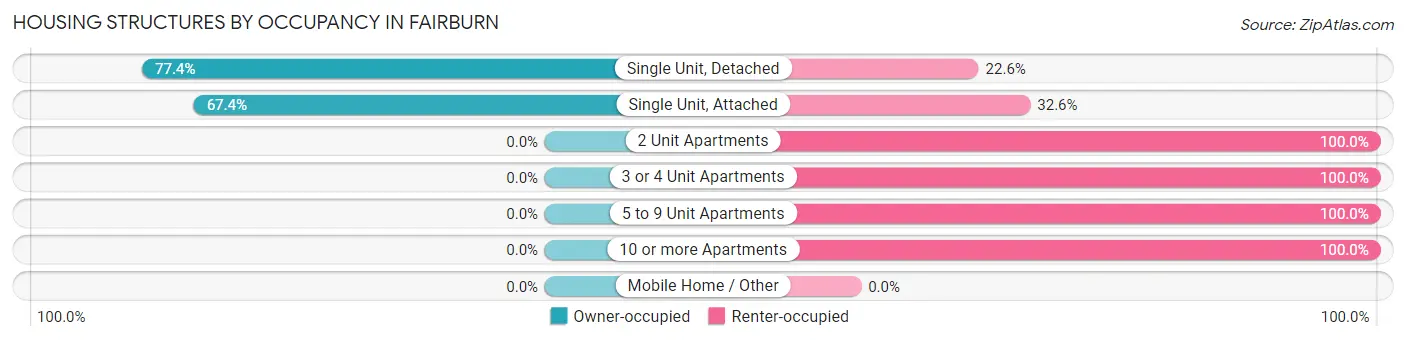
| Structure Type | Owner-occupied | Renter-occupied |
| Single Unit, Detached | 3,018 (77.4%) | 882 (22.6%) |
| Single Unit, Attached | 207 (67.4%) | 100 (32.6%) |
| 2 Unit Apartments | 0 (0.0%) | 51 (100.0%) |
| 3 or 4 Unit Apartments | 0 (0.0%) | 15 (100.0%) |
| 5 to 9 Unit Apartments | 0 (0.0%) | 260 (100.0%) |
| 10 or more Apartments | 0 (0.0%) | 1,164 (100.0%) |
| Mobile Home / Other | 0 (0.0%) | 0 (0.0%) |
| Total | 3,225 (56.6%) | 2,472 (43.4%) |
Housing Structures by Number of Rooms in Fairburn
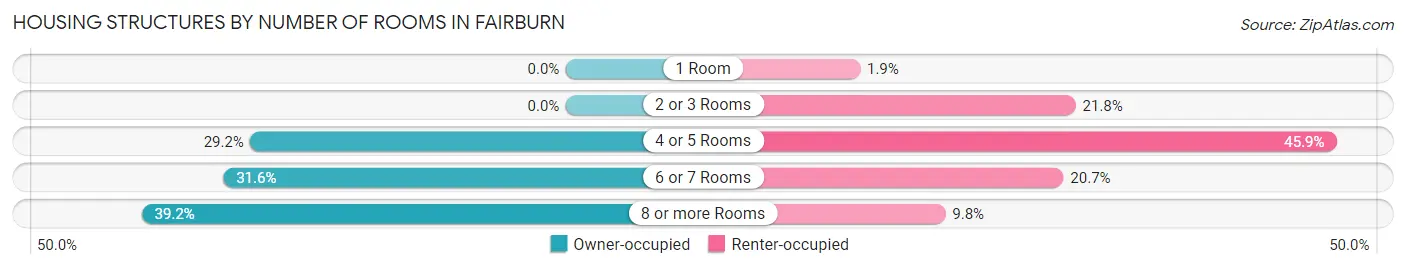
| Number of Rooms | Owner-occupied | Renter-occupied |
| 1 Room | 0 (0.0%) | 46 (1.9%) |
| 2 or 3 Rooms | 0 (0.0%) | 539 (21.8%) |
| 4 or 5 Rooms | 941 (29.2%) | 1,135 (45.9%) |
| 6 or 7 Rooms | 1,020 (31.6%) | 511 (20.7%) |
| 8 or more Rooms | 1,264 (39.2%) | 241 (9.8%) |
| Total | 3,225 (100.0%) | 2,472 (100.0%) |
Housing Structure by Heating Type in Fairburn
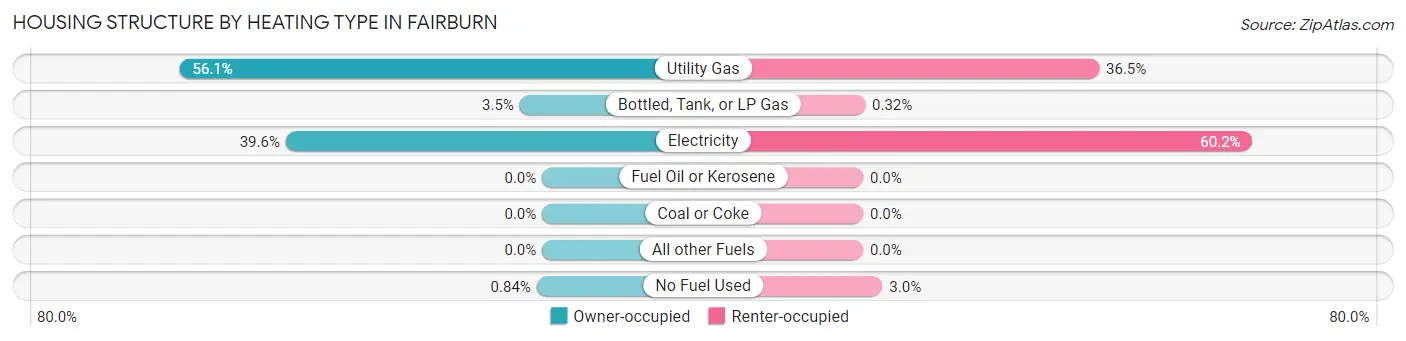
| Heating Type | Owner-occupied | Renter-occupied |
| Utility Gas | 1,808 (56.1%) | 902 (36.5%) |
| Bottled, Tank, or LP Gas | 112 (3.5%) | 8 (0.3%) |
| Electricity | 1,278 (39.6%) | 1,488 (60.2%) |
| Fuel Oil or Kerosene | 0 (0.0%) | 0 (0.0%) |
| Coal or Coke | 0 (0.0%) | 0 (0.0%) |
| All other Fuels | 0 (0.0%) | 0 (0.0%) |
| No Fuel Used | 27 (0.8%) | 74 (3.0%) |
| Total | 3,225 (100.0%) | 2,472 (100.0%) |
Household Vehicle Usage in Fairburn
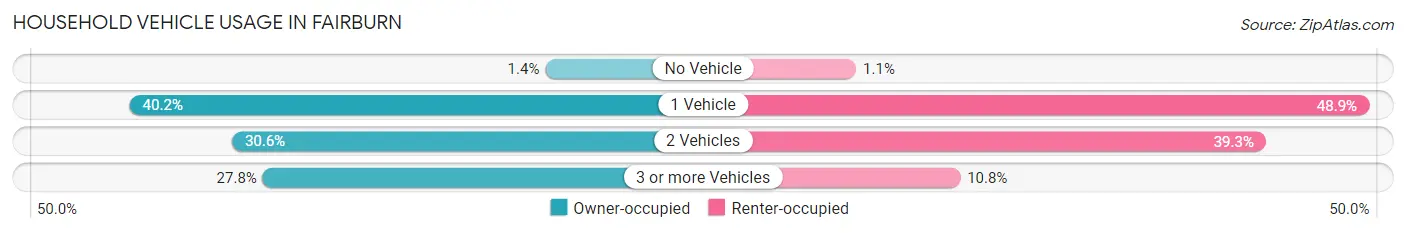
| Vehicles per Household | Owner-occupied | Renter-occupied |
| No Vehicle | 45 (1.4%) | 26 (1.1%) |
| 1 Vehicle | 1,296 (40.2%) | 1,209 (48.9%) |
| 2 Vehicles | 988 (30.6%) | 971 (39.3%) |
| 3 or more Vehicles | 896 (27.8%) | 266 (10.8%) |
| Total | 3,225 (100.0%) | 2,472 (100.0%) |
Real Estate & Mortgages in Fairburn
Real Estate and Mortgage Overview in Fairburn
| Characteristic | Without Mortgage | With Mortgage |
| Housing Units | 464 | 2,761 |
| Median Property Value | $163,000 | $220,400 |
| Median Household Income | $54,821 | $491 |
| Monthly Housing Costs | $443 | $16 |
| Real Estate Taxes | $1,026 | $11 |
Property Value by Mortgage Status in Fairburn
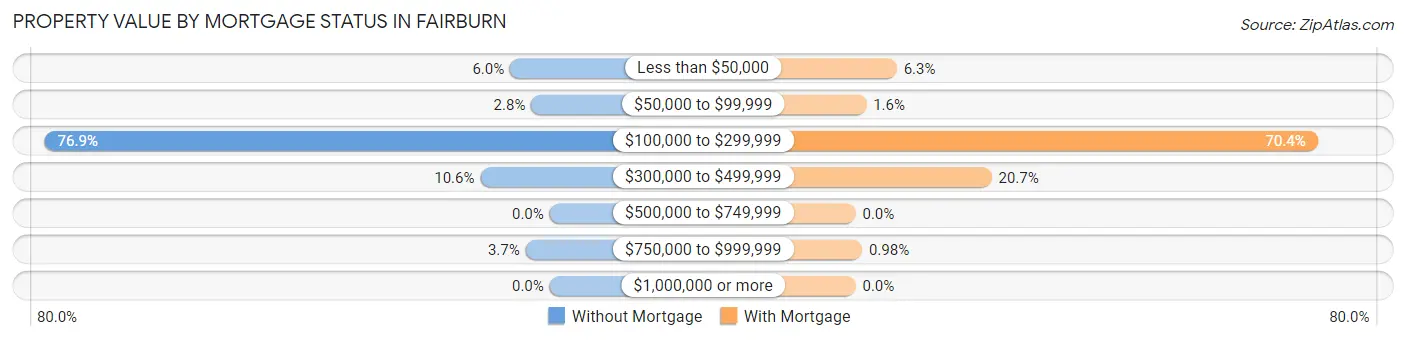
| Property Value | Without Mortgage | With Mortgage |
| Less than $50,000 | 28 (6.0%) | 173 (6.3%) |
| $50,000 to $99,999 | 13 (2.8%) | 45 (1.6%) |
| $100,000 to $299,999 | 357 (76.9%) | 1,944 (70.4%) |
| $300,000 to $499,999 | 49 (10.6%) | 572 (20.7%) |
| $500,000 to $749,999 | 0 (0.0%) | 0 (0.0%) |
| $750,000 to $999,999 | 17 (3.7%) | 27 (1.0%) |
| $1,000,000 or more | 0 (0.0%) | 0 (0.0%) |
| Total | 464 (100.0%) | 2,761 (100.0%) |
Household Income by Mortgage Status in Fairburn
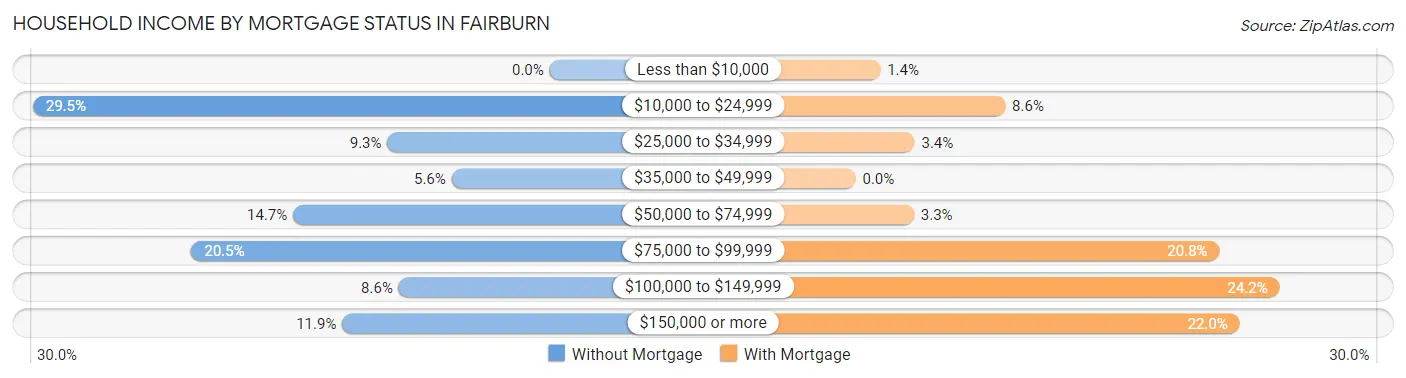
| Household Income | Without Mortgage | With Mortgage |
| Less than $10,000 | 0 (0.0%) | 39 (1.4%) |
| $10,000 to $24,999 | 137 (29.5%) | 236 (8.6%) |
| $25,000 to $34,999 | 43 (9.3%) | 93 (3.4%) |
| $35,000 to $49,999 | 26 (5.6%) | 0 (0.0%) |
| $50,000 to $74,999 | 68 (14.7%) | 92 (3.3%) |
| $75,000 to $99,999 | 95 (20.5%) | 574 (20.8%) |
| $100,000 to $149,999 | 40 (8.6%) | 669 (24.2%) |
| $150,000 or more | 55 (11.8%) | 606 (22.0%) |
| Total | 464 (100.0%) | 2,761 (100.0%) |
Property Value to Household Income Ratio in Fairburn
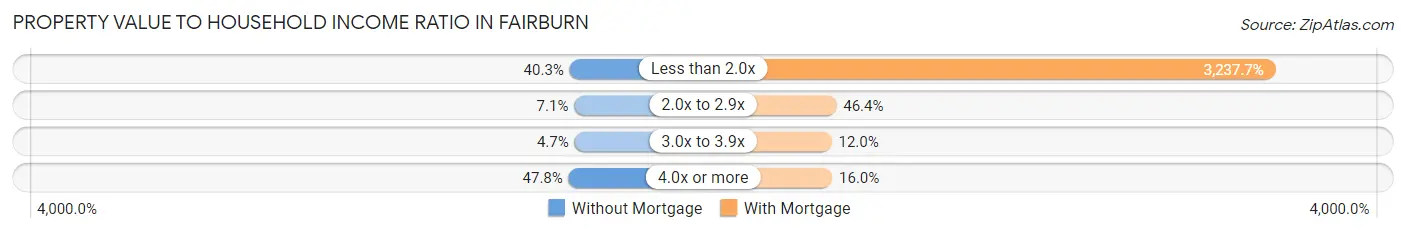
| Value-to-Income Ratio | Without Mortgage | With Mortgage |
| Less than 2.0x | 187 (40.3%) | 89,394 (3,237.7%) |
| 2.0x to 2.9x | 33 (7.1%) | 1,281 (46.4%) |
| 3.0x to 3.9x | 22 (4.7%) | 332 (12.0%) |
| 4.0x or more | 222 (47.8%) | 441 (16.0%) |
| Total | 464 (100.0%) | 2,761 (100.0%) |
Real Estate Taxes by Mortgage Status in Fairburn
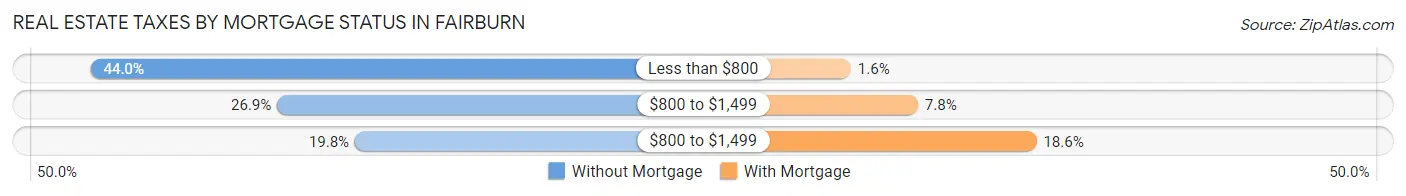
| Property Taxes | Without Mortgage | With Mortgage |
| Less than $800 | 204 (44.0%) | 45 (1.6%) |
| $800 to $1,499 | 125 (26.9%) | 214 (7.7%) |
| $800 to $1,499 | 92 (19.8%) | 513 (18.6%) |
| Total | 464 (100.0%) | 2,761 (100.0%) |
Health & Disability in Fairburn
Health Insurance Coverage by Age in Fairburn
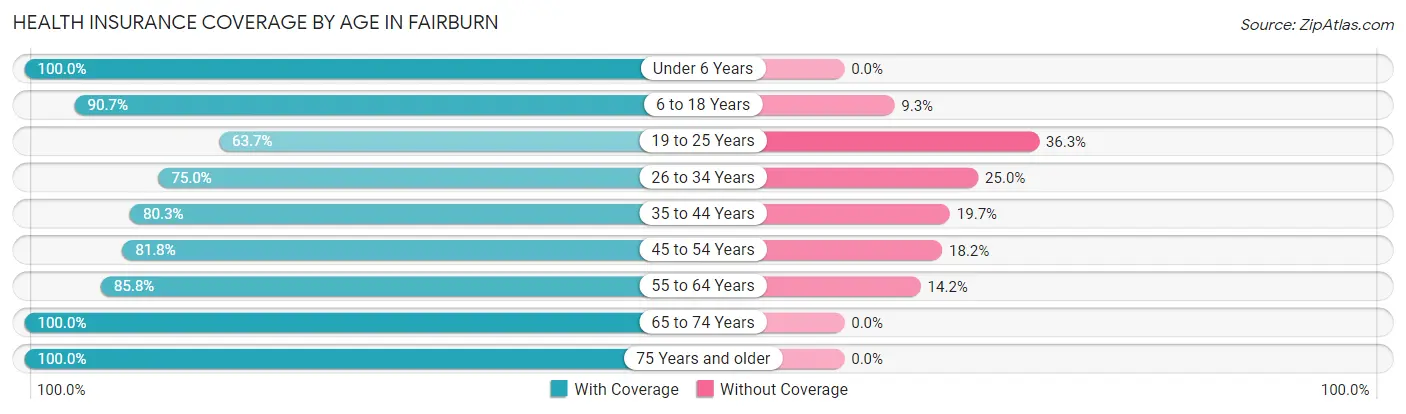
| Age Bracket | With Coverage | Without Coverage |
| Under 6 Years | 2,305 (100.0%) | 0 (0.0%) |
| 6 to 18 Years | 3,335 (90.7%) | 343 (9.3%) |
| 19 to 25 Years | 667 (63.7%) | 380 (36.3%) |
| 26 to 34 Years | 1,852 (75.0%) | 616 (25.0%) |
| 35 to 44 Years | 1,656 (80.3%) | 406 (19.7%) |
| 45 to 54 Years | 1,833 (81.8%) | 409 (18.2%) |
| 55 to 64 Years | 1,470 (85.8%) | 244 (14.2%) |
| 65 to 74 Years | 694 (100.0%) | 0 (0.0%) |
| 75 Years and older | 156 (100.0%) | 0 (0.0%) |
| Total | 13,968 (85.4%) | 2,398 (14.6%) |
Health Insurance Coverage by Citizenship Status in Fairburn
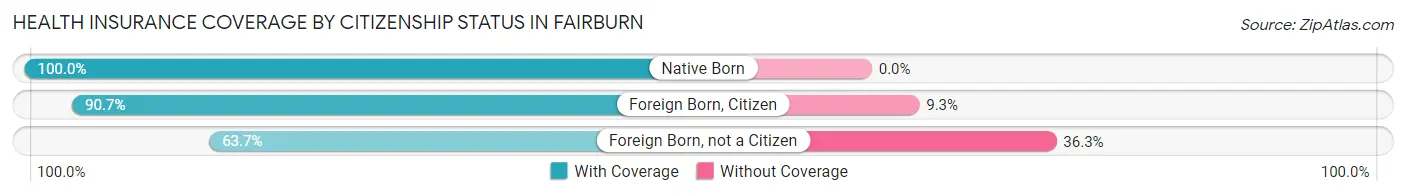
| Citizenship Status | With Coverage | Without Coverage |
| Native Born | 2,305 (100.0%) | 0 (0.0%) |
| Foreign Born, Citizen | 3,335 (90.7%) | 343 (9.3%) |
| Foreign Born, not a Citizen | 667 (63.7%) | 380 (36.3%) |
Health Insurance Coverage by Household Income in Fairburn
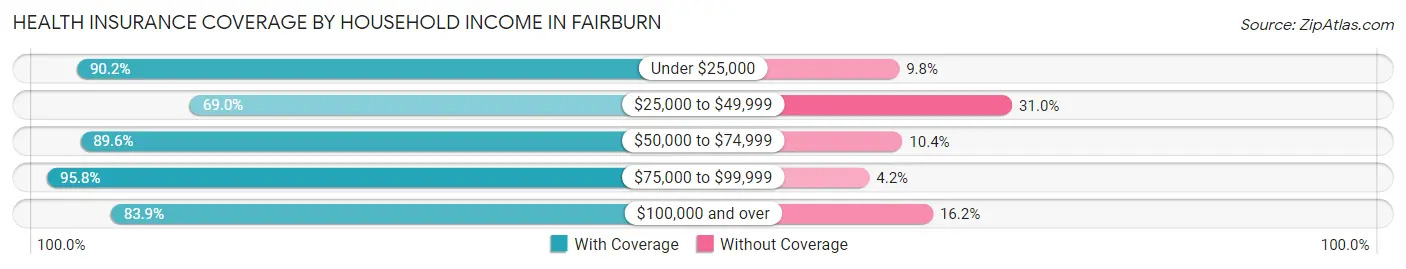
| Household Income | With Coverage | Without Coverage |
| Under $25,000 | 2,113 (90.2%) | 230 (9.8%) |
| $25,000 to $49,999 | 1,965 (69.0%) | 882 (31.0%) |
| $50,000 to $74,999 | 3,284 (89.6%) | 382 (10.4%) |
| $75,000 to $99,999 | 2,491 (95.8%) | 110 (4.2%) |
| $100,000 and over | 4,112 (83.9%) | 792 (16.2%) |
Public vs Private Health Insurance Coverage by Age in Fairburn
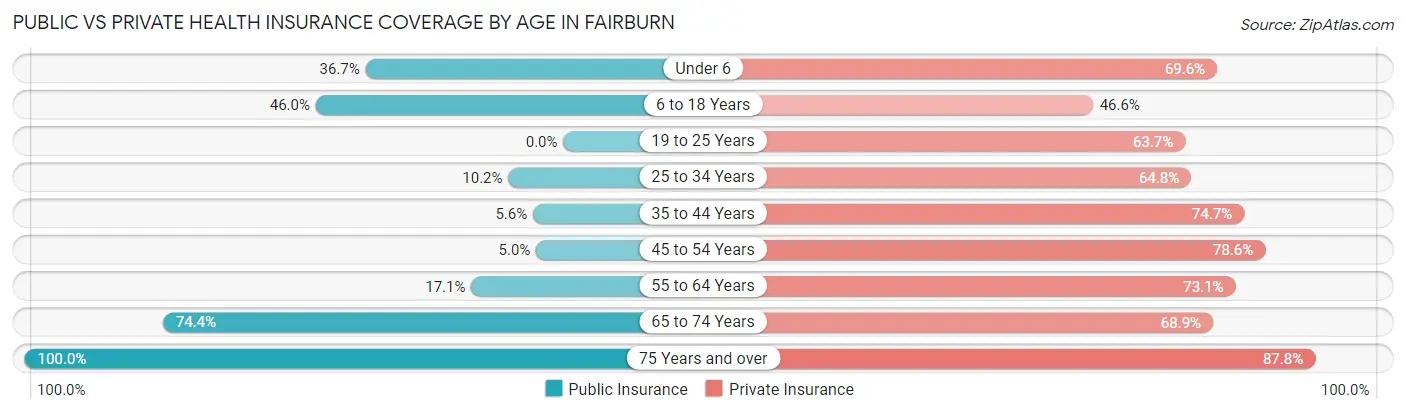
| Age Bracket | Public Insurance | Private Insurance |
| Under 6 | 846 (36.7%) | 1,605 (69.6%) |
| 6 to 18 Years | 1,690 (46.0%) | 1,713 (46.6%) |
| 19 to 25 Years | 0 (0.0%) | 667 (63.7%) |
| 25 to 34 Years | 252 (10.2%) | 1,600 (64.8%) |
| 35 to 44 Years | 116 (5.6%) | 1,540 (74.7%) |
| 45 to 54 Years | 113 (5.0%) | 1,761 (78.5%) |
| 55 to 64 Years | 293 (17.1%) | 1,252 (73.1%) |
| 65 to 74 Years | 516 (74.4%) | 478 (68.9%) |
| 75 Years and over | 156 (100.0%) | 137 (87.8%) |
| Total | 3,982 (24.3%) | 10,753 (65.7%) |
Disability Status by Sex by Age in Fairburn
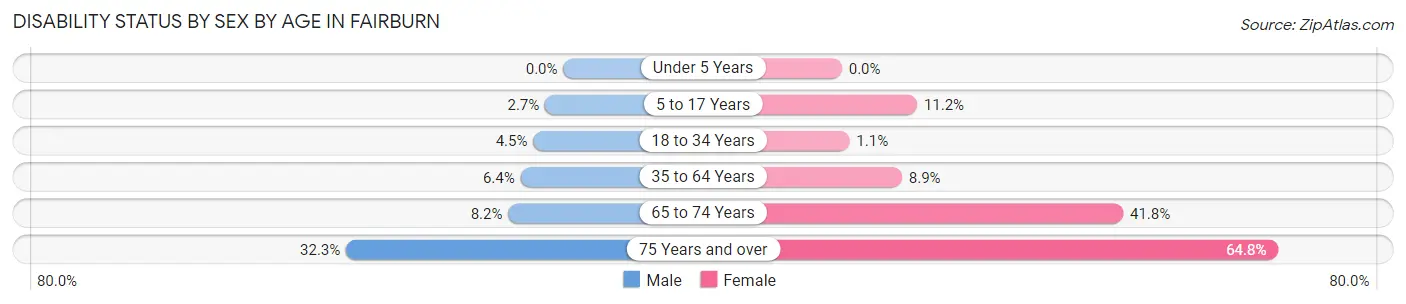
| Age Bracket | Male | Female |
| Under 5 Years | 0 (0.0%) | 0 (0.0%) |
| 5 to 17 Years | 45 (2.7%) | 176 (11.2%) |
| 18 to 34 Years | 92 (4.5%) | 22 (1.1%) |
| 35 to 64 Years | 150 (6.4%) | 326 (8.9%) |
| 65 to 74 Years | 26 (8.2%) | 157 (41.8%) |
| 75 Years and over | 10 (32.3%) | 81 (64.8%) |
Disability Class by Sex by Age in Fairburn
Disability Class: Hearing Difficulty
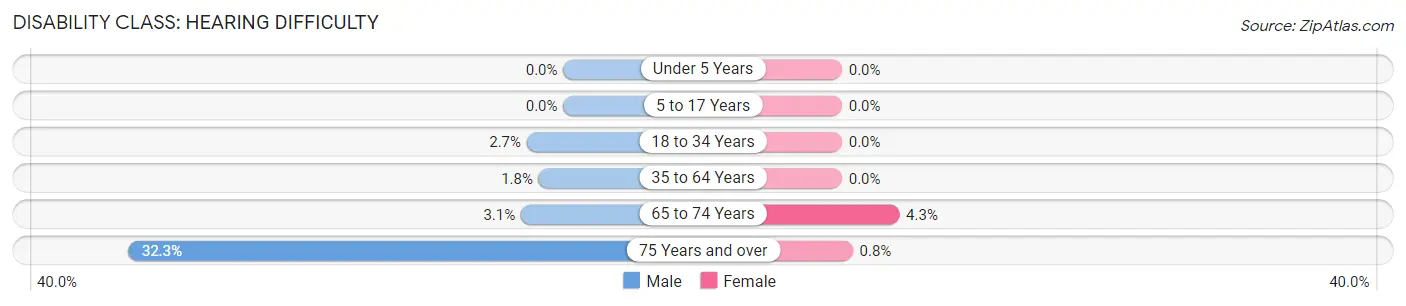
| Age Bracket | Male | Female |
| Under 5 Years | 0 (0.0%) | 0 (0.0%) |
| 5 to 17 Years | 0 (0.0%) | 0 (0.0%) |
| 18 to 34 Years | 56 (2.7%) | 0 (0.0%) |
| 35 to 64 Years | 43 (1.8%) | 0 (0.0%) |
| 65 to 74 Years | 10 (3.1%) | 16 (4.3%) |
| 75 Years and over | 10 (32.3%) | 1 (0.8%) |
Disability Class: Vision Difficulty
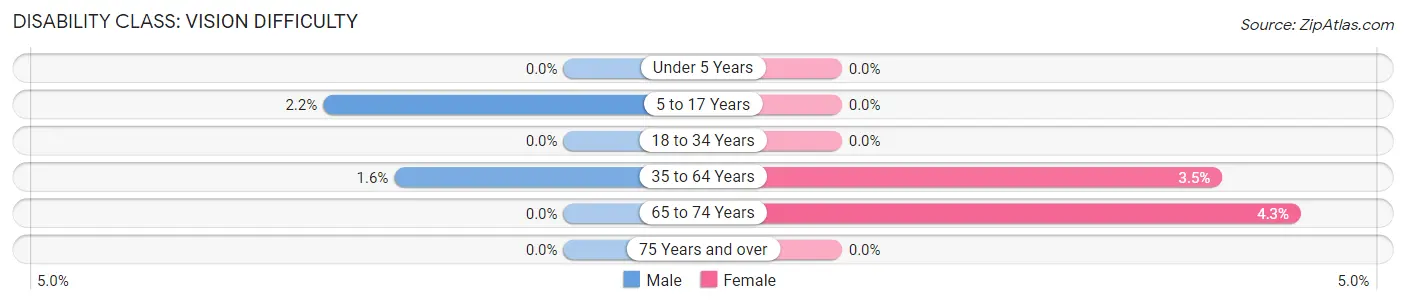
| Age Bracket | Male | Female |
| Under 5 Years | 0 (0.0%) | 0 (0.0%) |
| 5 to 17 Years | 37 (2.2%) | 0 (0.0%) |
| 18 to 34 Years | 0 (0.0%) | 0 (0.0%) |
| 35 to 64 Years | 37 (1.6%) | 129 (3.5%) |
| 65 to 74 Years | 0 (0.0%) | 16 (4.3%) |
| 75 Years and over | 0 (0.0%) | 0 (0.0%) |
Disability Class: Cognitive Difficulty
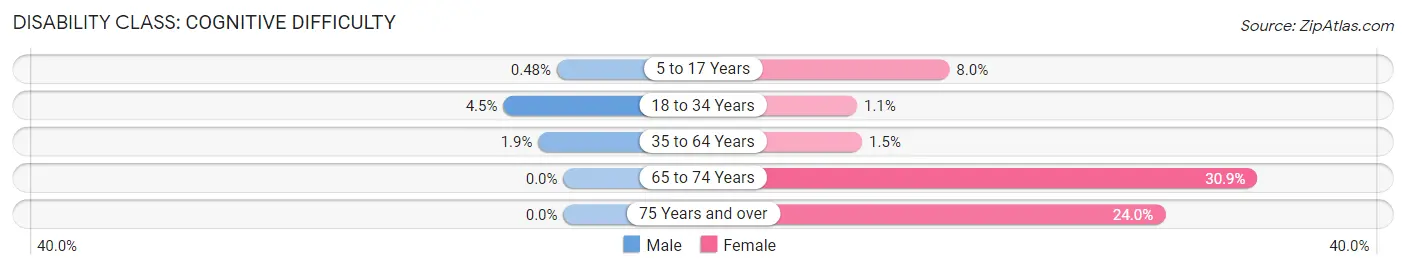
| Age Bracket | Male | Female |
| 5 to 17 Years | 8 (0.5%) | 126 (8.0%) |
| 18 to 34 Years | 92 (4.5%) | 22 (1.1%) |
| 35 to 64 Years | 44 (1.9%) | 55 (1.5%) |
| 65 to 74 Years | 0 (0.0%) | 116 (30.8%) |
| 75 Years and over | 0 (0.0%) | 30 (24.0%) |
Disability Class: Ambulatory Difficulty
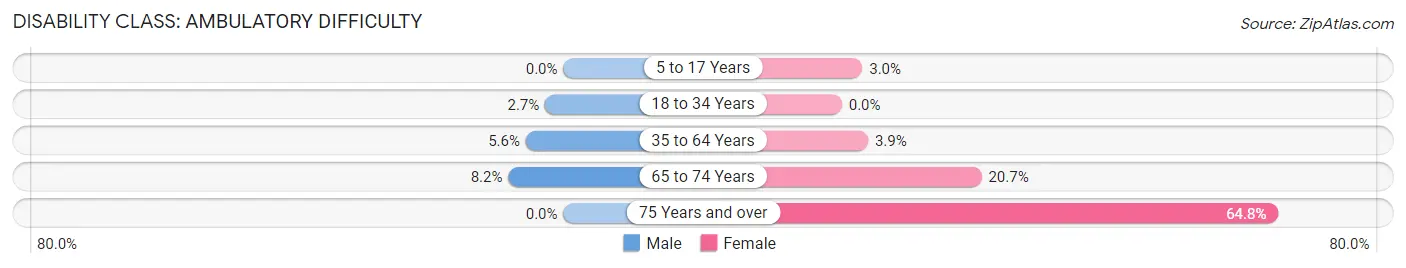
| Age Bracket | Male | Female |
| 5 to 17 Years | 0 (0.0%) | 48 (3.0%) |
| 18 to 34 Years | 56 (2.7%) | 0 (0.0%) |
| 35 to 64 Years | 132 (5.6%) | 142 (3.9%) |
| 65 to 74 Years | 26 (8.2%) | 78 (20.7%) |
| 75 Years and over | 0 (0.0%) | 81 (64.8%) |
Disability Class: Self-Care Difficulty
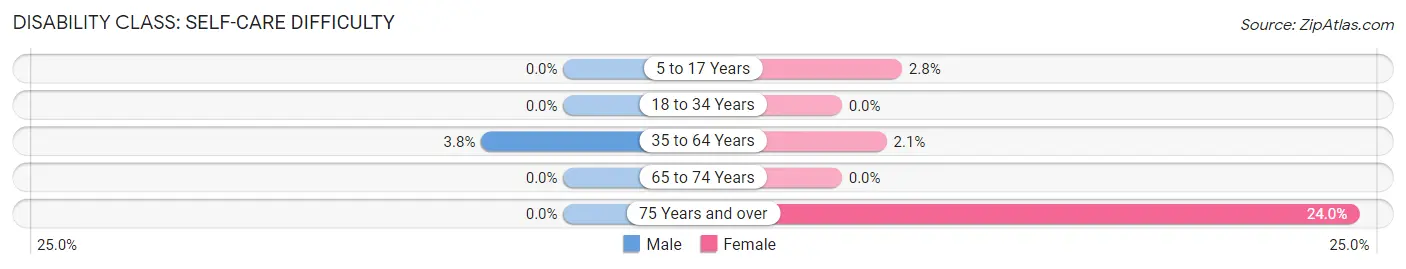
| Age Bracket | Male | Female |
| 5 to 17 Years | 0 (0.0%) | 44 (2.8%) |
| 18 to 34 Years | 0 (0.0%) | 0 (0.0%) |
| 35 to 64 Years | 90 (3.8%) | 76 (2.1%) |
| 65 to 74 Years | 0 (0.0%) | 0 (0.0%) |
| 75 Years and over | 0 (0.0%) | 30 (24.0%) |
Technology Access in Fairburn
Computing Device Access in Fairburn
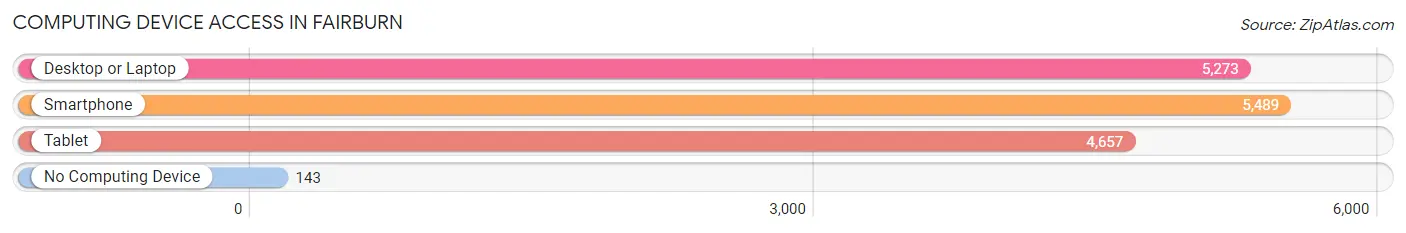
| Device Type | # Households | % Households |
| Desktop or Laptop | 5,273 | 92.6% |
| Smartphone | 5,489 | 96.4% |
| Tablet | 4,657 | 81.7% |
| No Computing Device | 143 | 2.5% |
| Total | 5,697 | 100.0% |
Internet Access in Fairburn
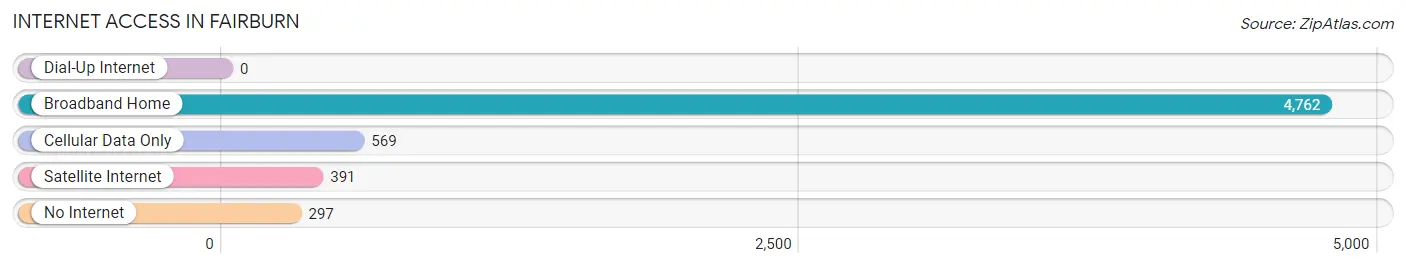
| Internet Type | # Households | % Households |
| Dial-Up Internet | 0 | 0.0% |
| Broadband Home | 4,762 | 83.6% |
| Cellular Data Only | 569 | 10.0% |
| Satellite Internet | 391 | 6.9% |
| No Internet | 297 | 5.2% |
| Total | 5,697 | 100.0% |
Fairburn Summary
Burn, Georgia is a small city located in Fulton County, Georgia, United States. It is situated approximately 20 miles south of Atlanta and is part of the Atlanta metropolitan area. The city has a population of approximately 12,000 people and is known for its small-town charm and friendly atmosphere.
History
The area that is now Fairburn was first settled in the early 1800s by settlers from the Cherokee Nation. The town was originally known as Cross Roads, due to its location at the intersection of two major roads. In 1854, the town was renamed Fairburn after the nearby Fairburn Creek. The town was incorporated in 1887 and was the first city in Fulton County to be incorporated.
In the late 1800s, Fairburn was a thriving agricultural community, with cotton being the main crop. The town was also home to several mills, including a cotton mill, a grist mill, and a sawmill. The town was also home to several churches, schools, and businesses.
In the early 1900s, Fairburn began to experience a period of growth and development. The town was connected to the Atlanta streetcar system in 1910, and the population began to grow. The town was also home to several factories, including a cotton mill, a brick factory, and a furniture factory.
Geography
Fairburn is located in the northwestern corner of Fulton County, Georgia. It is situated approximately 20 miles south of Atlanta and is part of the Atlanta metropolitan area. The city has a total area of 8.3 square miles, all of which is land. The city is located in the Piedmont region of Georgia and is characterized by rolling hills and wooded areas.
Economy
Fairburn’s economy is largely based on the service industry. The city is home to several retail stores, restaurants, and other businesses. The city is also home to several industrial parks, which provide jobs in manufacturing and other industries.
Demographics
As of the 2010 census, Fairburn had a population of 12,005 people. The racial makeup of the city was 57.3% African American, 33.2% White, 0.3% Native American, 1.2% Asian, 0.1% Pacific Islander, 5.2% from other races, and 2.9% from two or more races. Hispanic or Latino of any race were 8.7% of the population.
The median income for a household in Fairburn was $41,945, and the median income for a family was $50,945. The per capita income for the city was $20,945. About 17.2% of families and 20.7% of the population were below the poverty line, including 28.2% of those under age 18 and 11.2% of those age 65 or over.
Conclusion
Fairburn, Georgia is a small city located in Fulton County, Georgia, United States. It is situated approximately 20 miles south of Atlanta and is part of the Atlanta metropolitan area. The city has a population of approximately 12,000 people and is known for its small-town charm and friendly atmosphere. The city’s economy is largely based on the service industry, and the city is home to several retail stores, restaurants, and other businesses. The racial makeup of the city is 57.3% African American, 33.2% White, 0.3% Native American, 1.2% Asian, 0.1% Pacific Islander, 5.2% from other races, and 2.9% from two or more races. The median income for a household in Fairburn was $41,945, and the median income for a family was $50,945.
Common Questions
What is Per Capita Income in Fairburn?
Per Capita income in Fairburn is $29,859.
What is the Median Family Income in Fairburn?
Median Family Income in Fairburn is $65,724.
What is the Median Household income in Fairburn?
Median Household Income in Fairburn is $67,245.
What is Income or Wage Gap in Fairburn?
Income or Wage Gap in Fairburn is 9.0%.
Women in Fairburn earn 91.0 cents for every dollar earned by a man.
What is Inequality or Gini Index in Fairburn?
Inequality or Gini Index in Fairburn is 0.39.
What is the Total Population of Fairburn?
Total Population of Fairburn is 16,469.
What is the Total Male Population of Fairburn?
Total Male Population of Fairburn is 7,582.
What is the Total Female Population of Fairburn?
Total Female Population of Fairburn is 8,887.
What is the Ratio of Males per 100 Females in Fairburn?
There are 85.32 Males per 100 Females in Fairburn.
What is the Ratio of Females per 100 Males in Fairburn?
There are 117.21 Females per 100 Males in Fairburn.
What is the Median Population Age in Fairburn?
Median Population Age in Fairburn is 30.9 Years.
What is the Average Family Size in Fairburn
Average Family Size in Fairburn is 3.6 People.
What is the Average Household Size in Fairburn
Average Household Size in Fairburn is 2.9 People.
How Large is the Labor Force in Fairburn?
There are 8,592 People in the Labor Forcein in Fairburn.
What is the Percentage of People in the Labor Force in Fairburn?
75.1% of People are in the Labor Force in Fairburn.
What is the Unemployment Rate in Fairburn?
Unemployment Rate in Fairburn is 5.2%.