Lake City, CO Map & Demographics
Lake City Map
Lake City Overview
$46,390
PER CAPITA INCOME
$63,750
AVG FAMILY INCOME
$57,548
AVG HOUSEHOLD INCOME
0.44
INEQUALITY / GINI INDEX
465
TOTAL POPULATION
223
MALE POPULATION
242
FEMALE POPULATION
92.15
MALES / 100 FEMALES
108.52
FEMALES / 100 MALES
54.9
MEDIAN AGE
2.2
AVG FAMILY SIZE
1.8
AVG HOUSEHOLD SIZE
216
LABOR FORCE [ PEOPLE ]
52.2%
PERCENT IN LABOR FORCE
1.4%
UNEMPLOYMENT RATE
Lake City Zip Codes
Lake City Area Codes
Income in Lake City
Income Overview in Lake City
Per Capita Income in Lake City is $46,390, while median incomes of families and households are $63,750 and $57,548 respectively.
| Characteristic | Number | Measure |
| Per Capita Income | 465 | $46,390 |
| Median Family Income | 161 | $63,750 |
| Mean Family Income | 161 | $108,839 |
| Median Household Income | 253 | $57,548 |
| Mean Household Income | 253 | $84,840 |
| Income Deficit | 161 | $0 |
| Wage / Income Gap (%) | 465 | 0.00% |
| Wage / Income Gap ($) | 465 | 100.00¢ per $1 |
| Gini / Inequality Index | 465 | 0.44 |
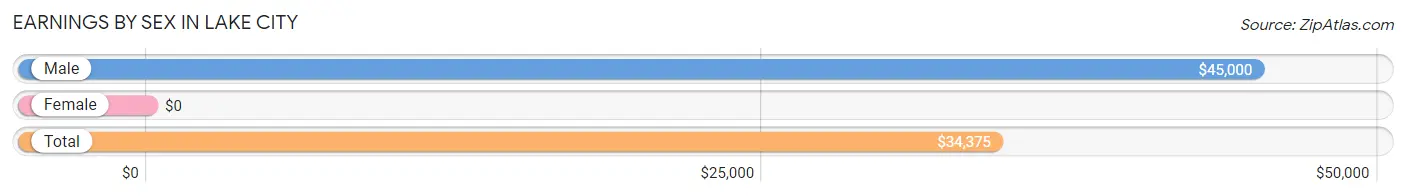
Earnings by Sex in Lake City
| Sex | Number | Average Earnings |
| Male | 132 (52.2%) | $45,000 |
| Female | 121 (47.8%) | $0 |
| Total | 253 (100.0%) | $34,375 |
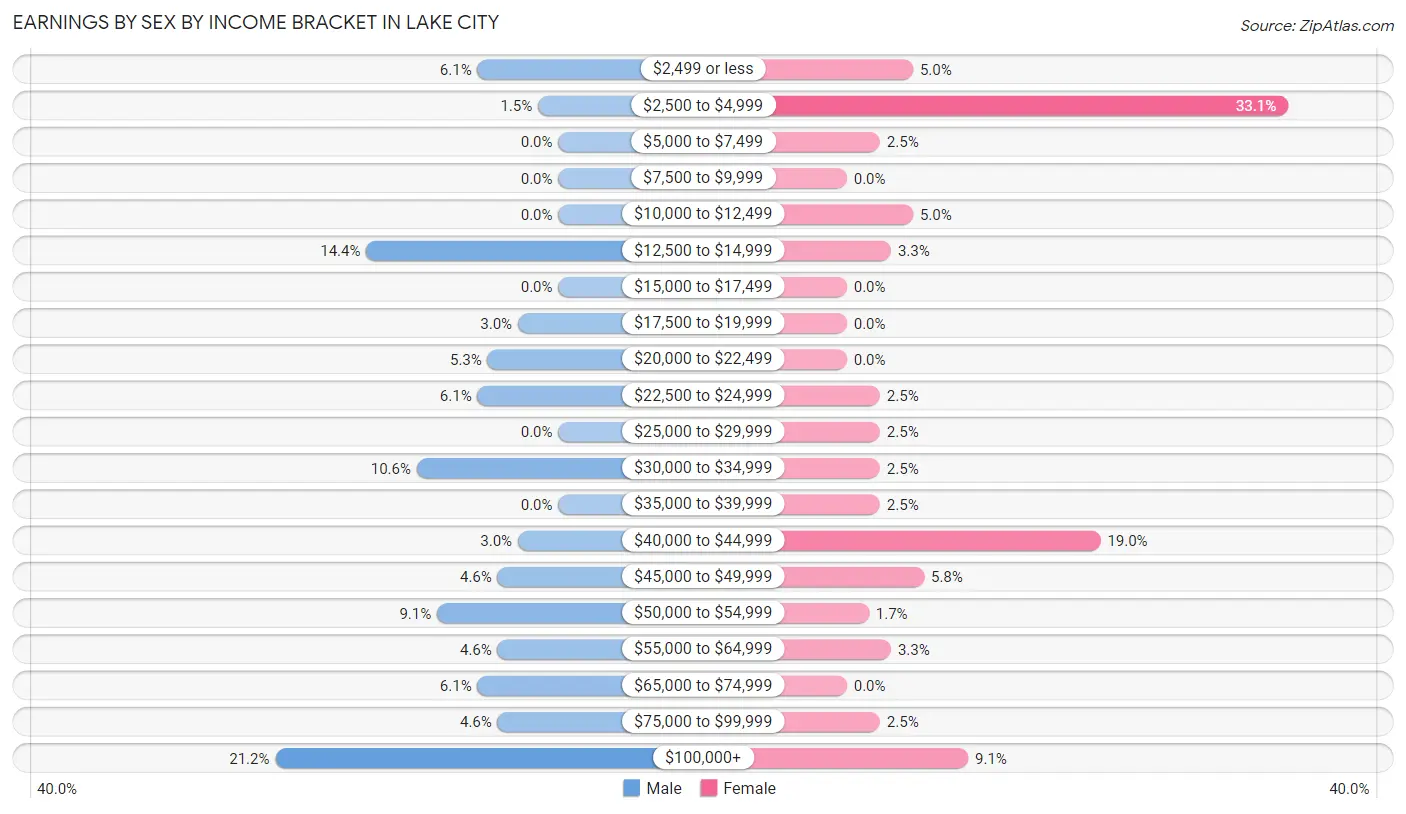
Earnings by Sex by Income Bracket in Lake City
The most common earnings brackets in Lake City are $100,000+ for men (28 | 21.2%) and $2,500 to $4,999 for women (40 | 33.1%).
| Income | Male | Female |
| $2,499 or less | 8 (6.1%) | 6 (5.0%) |
| $2,500 to $4,999 | 2 (1.5%) | 40 (33.1%) |
| $5,000 to $7,499 | 0 (0.0%) | 3 (2.5%) |
| $7,500 to $9,999 | 0 (0.0%) | 0 (0.0%) |
| $10,000 to $12,499 | 0 (0.0%) | 6 (5.0%) |
| $12,500 to $14,999 | 19 (14.4%) | 4 (3.3%) |
| $15,000 to $17,499 | 0 (0.0%) | 0 (0.0%) |
| $17,500 to $19,999 | 4 (3.0%) | 0 (0.0%) |
| $20,000 to $22,499 | 7 (5.3%) | 0 (0.0%) |
| $22,500 to $24,999 | 8 (6.1%) | 3 (2.5%) |
| $25,000 to $29,999 | 0 (0.0%) | 3 (2.5%) |
| $30,000 to $34,999 | 14 (10.6%) | 3 (2.5%) |
| $35,000 to $39,999 | 0 (0.0%) | 3 (2.5%) |
| $40,000 to $44,999 | 4 (3.0%) | 23 (19.0%) |
| $45,000 to $49,999 | 6 (4.5%) | 7 (5.8%) |
| $50,000 to $54,999 | 12 (9.1%) | 2 (1.7%) |
| $55,000 to $64,999 | 6 (4.5%) | 4 (3.3%) |
| $65,000 to $74,999 | 8 (6.1%) | 0 (0.0%) |
| $75,000 to $99,999 | 6 (4.5%) | 3 (2.5%) |
| $100,000+ | 28 (21.2%) | 11 (9.1%) |
| Total | 132 (100.0%) | 121 (100.0%) |
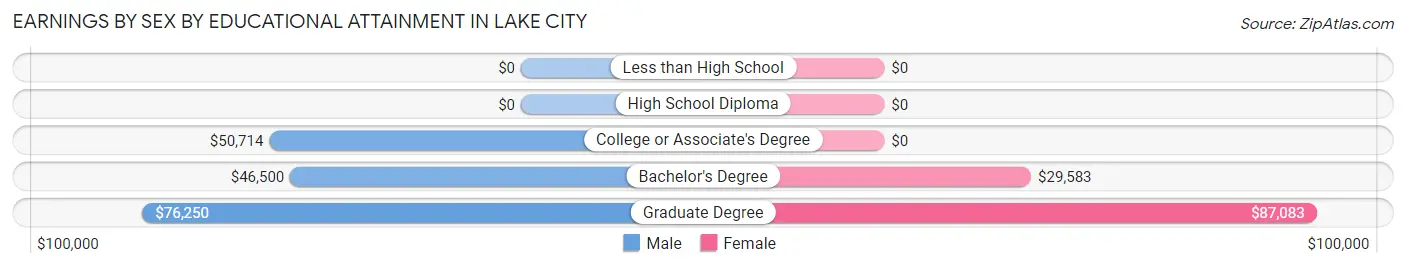
Earnings by Sex by Educational Attainment in Lake City
| Educational Attainment | Male Income | Female Income |
| Less than High School | - | - |
| High School Diploma | - | - |
| College or Associate's Degree | $50,714 | $0 |
| Bachelor's Degree | $46,500 | $29,583 |
| Graduate Degree | $76,250 | $87,083 |
| Total | $50,313 | $0 |
Family Income in Lake City
Family Income Brackets in Lake City
According to the Lake City family income data, there are 69 families falling into the $35,000 to $49,999 income range, which is the most common income bracket and makes up 42.9% of all families.
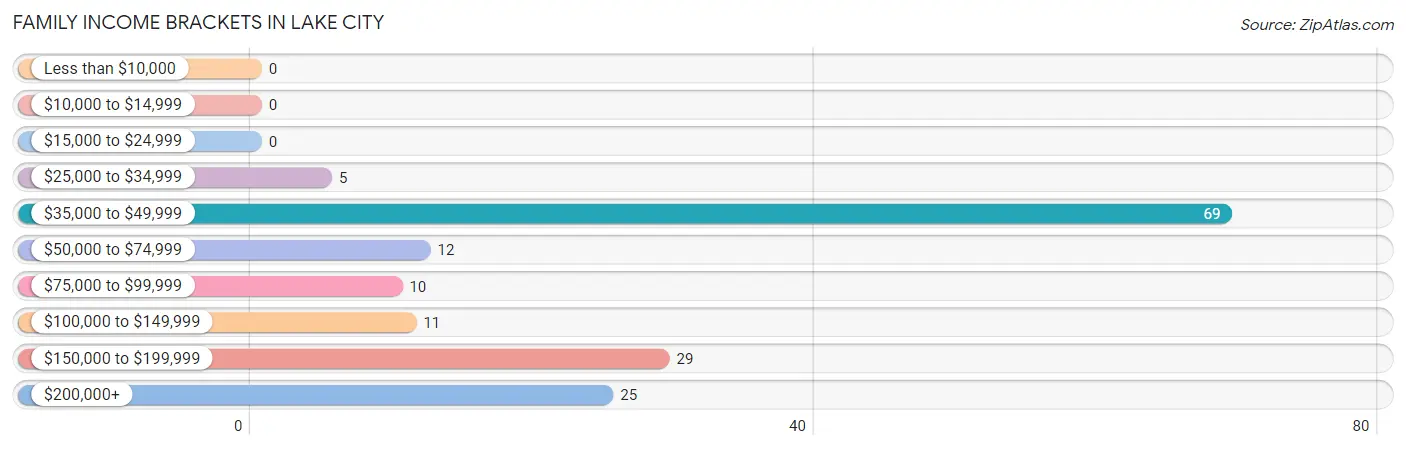
| Income Bracket | # Families | % Families |
| Less than $10,000 | 0 | 0.0% |
| $10,000 to $14,999 | 0 | 0.0% |
| $15,000 to $24,999 | 0 | 0.0% |
| $25,000 to $34,999 | 5 | 3.1% |
| $35,000 to $49,999 | 69 | 42.9% |
| $50,000 to $74,999 | 12 | 7.5% |
| $75,000 to $99,999 | 10 | 6.2% |
| $100,000 to $149,999 | 11 | 6.8% |
| $150,000 to $199,999 | 29 | 18.0% |
| $200,000+ | 25 | 15.5% |
Family Income by Famaliy Size in Lake City
3-person families (13 | 8.1%) account for the highest median family income in Lake City with $207,250 per family, while 3-person families (13 | 8.1%) have the highest median income of $69,083 per family member.
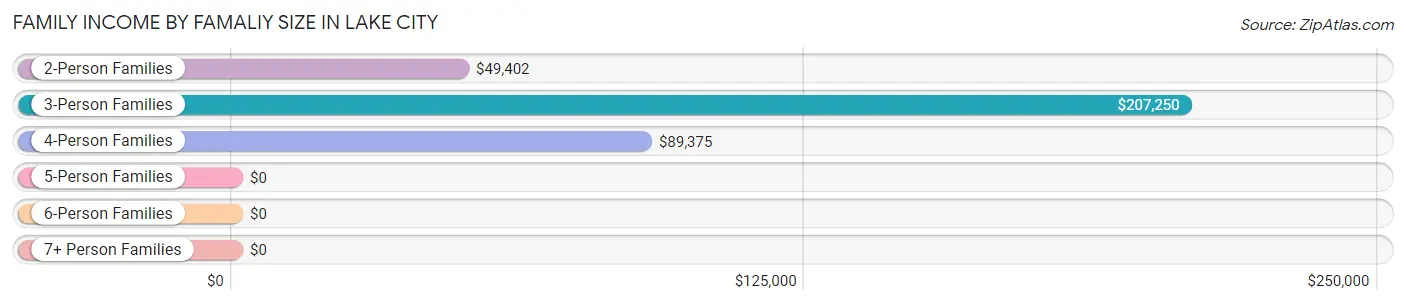
| Income Bracket | # Families | Median Income |
| 2-Person Families | 129 (80.1%) | $49,402 |
| 3-Person Families | 13 (8.1%) | $207,250 |
| 4-Person Families | 19 (11.8%) | $89,375 |
| 5-Person Families | 0 (0.0%) | $0 |
| 6-Person Families | 0 (0.0%) | $0 |
| 7+ Person Families | 0 (0.0%) | $0 |
| Total | 161 (100.0%) | $63,750 |
Family Income by Number of Earners in Lake City
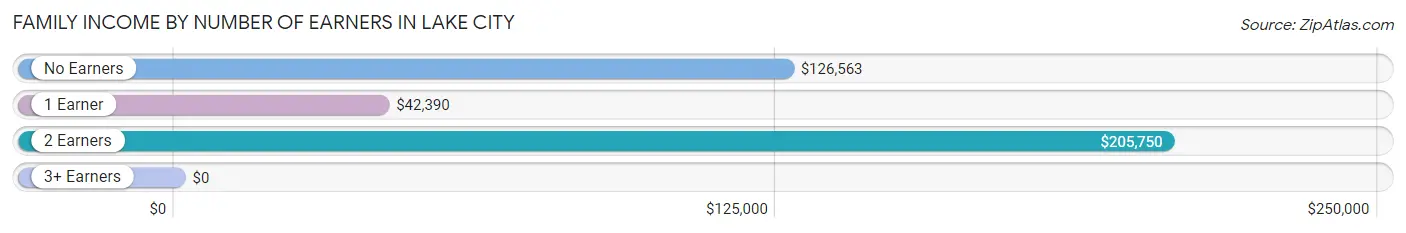
| Number of Earners | # Families | Median Income |
| No Earners | 39 (24.2%) | $126,563 |
| 1 Earner | 75 (46.6%) | $42,390 |
| 2 Earners | 39 (24.2%) | $205,750 |
| 3+ Earners | 8 (5.0%) | $0 |
| Total | 161 (100.0%) | $63,750 |
Household Income in Lake City
Household Income Brackets in Lake City
With 68 households falling in the category, the $35,000 to $49,999 income range is the most frequent in Lake City, accounting for 26.9% of all households. In contrast, only 4 households (1.6%) fall into the $10,000 to $14,999 income bracket, making it the least populous group.
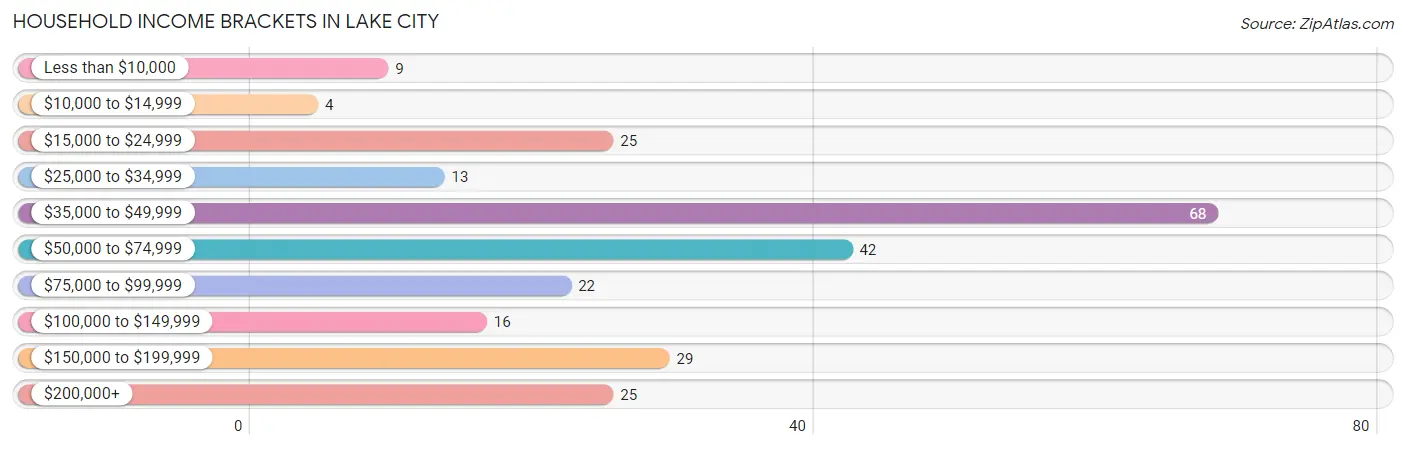
| Income Bracket | # Households | % Households |
| Less than $10,000 | 9 | 3.6% |
| $10,000 to $14,999 | 4 | 1.6% |
| $15,000 to $24,999 | 25 | 9.9% |
| $25,000 to $34,999 | 13 | 5.1% |
| $35,000 to $49,999 | 68 | 26.9% |
| $50,000 to $74,999 | 42 | 16.6% |
| $75,000 to $99,999 | 22 | 8.7% |
| $100,000 to $149,999 | 16 | 6.3% |
| $150,000 to $199,999 | 29 | 11.5% |
| $200,000+ | 25 | 9.9% |
Household Income by Householder Age in Lake City
The median household income in Lake City is $57,548, with the highest median household income of $105,000 found in the 65+ years age bracket for the primary householder. A total of 84 households (33.2%) fall into this category.
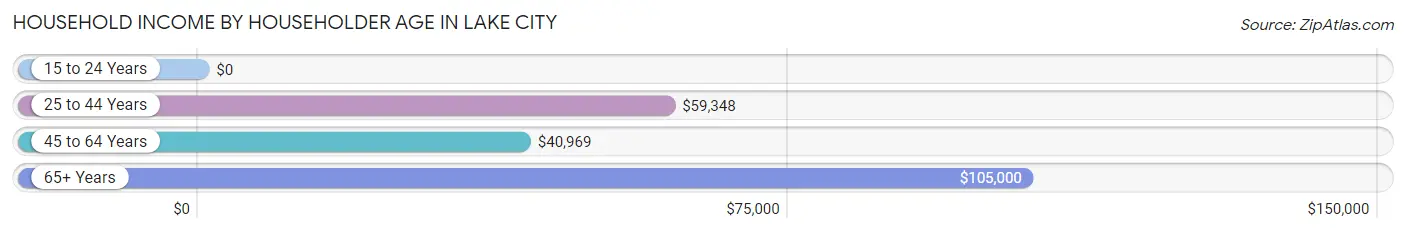
| Income Bracket | # Households | Median Income |
| 15 to 24 Years | 0 (0.0%) | $0 |
| 25 to 44 Years | 50 (19.8%) | $59,348 |
| 45 to 64 Years | 119 (47.0%) | $40,969 |
| 65+ Years | 84 (33.2%) | $105,000 |
| Total | 253 (100.0%) | $57,548 |
Poverty in Lake City
Income Below Poverty by Sex and Age in Lake City
With 7.6% poverty level for males and 3.3% for females among the residents of Lake City, 25 to 34 year old males and 55 to 64 year old females are the most vulnerable to poverty, with 9 males (90.0%) and 4 females (8.3%) in their respective age groups living below the poverty level.
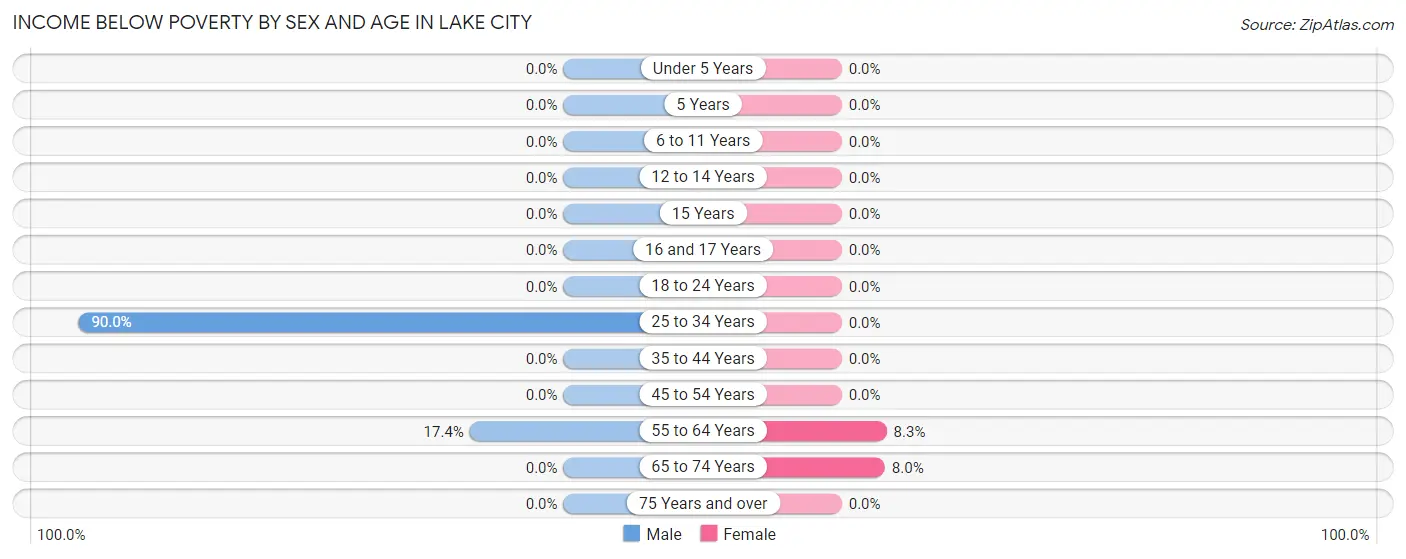
| Age Bracket | Male | Female |
| Under 5 Years | 0 (0.0%) | 0 (0.0%) |
| 5 Years | 0 (0.0%) | 0 (0.0%) |
| 6 to 11 Years | 0 (0.0%) | 0 (0.0%) |
| 12 to 14 Years | 0 (0.0%) | 0 (0.0%) |
| 15 Years | 0 (0.0%) | 0 (0.0%) |
| 16 and 17 Years | 0 (0.0%) | 0 (0.0%) |
| 18 to 24 Years | 0 (0.0%) | 0 (0.0%) |
| 25 to 34 Years | 9 (90.0%) | 0 (0.0%) |
| 35 to 44 Years | 0 (0.0%) | 0 (0.0%) |
| 45 to 54 Years | 0 (0.0%) | 0 (0.0%) |
| 55 to 64 Years | 8 (17.4%) | 4 (8.3%) |
| 65 to 74 Years | 0 (0.0%) | 4 (8.0%) |
| 75 Years and over | 0 (0.0%) | 0 (0.0%) |
| Total | 17 (7.6%) | 8 (3.3%) |
Income Above Poverty by Sex and Age in Lake City
According to the poverty statistics in Lake City, males aged 5 years and females aged under 5 years are the age groups that are most secure financially, with 100.0% of males and 100.0% of females in these age groups living above the poverty line.
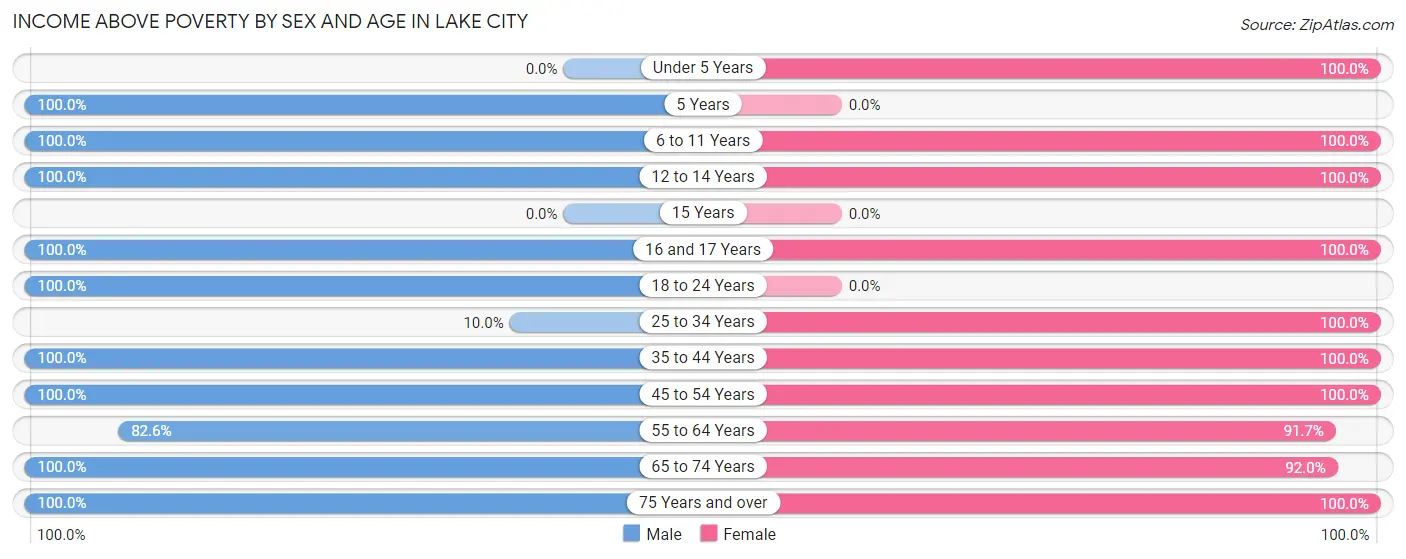
| Age Bracket | Male | Female |
| Under 5 Years | 0 (0.0%) | 10 (100.0%) |
| 5 Years | 18 (100.0%) | 0 (0.0%) |
| 6 to 11 Years | 4 (100.0%) | 3 (100.0%) |
| 12 to 14 Years | 3 (100.0%) | 13 (100.0%) |
| 15 Years | 0 (0.0%) | 0 (0.0%) |
| 16 and 17 Years | 3 (100.0%) | 6 (100.0%) |
| 18 to 24 Years | 16 (100.0%) | 0 (0.0%) |
| 25 to 34 Years | 1 (10.0%) | 25 (100.0%) |
| 35 to 44 Years | 31 (100.0%) | 19 (100.0%) |
| 45 to 54 Years | 20 (100.0%) | 55 (100.0%) |
| 55 to 64 Years | 38 (82.6%) | 44 (91.7%) |
| 65 to 74 Years | 47 (100.0%) | 46 (92.0%) |
| 75 Years and over | 25 (100.0%) | 13 (100.0%) |
| Total | 206 (92.4%) | 234 (96.7%) |
Income Below Poverty Among Married-Couple Families in Lake City
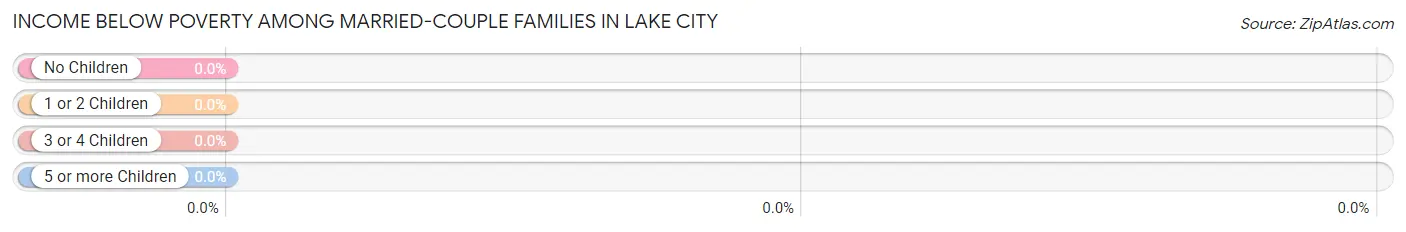
| Children | Above Poverty | Below Poverty |
| No Children | 78 (100.0%) | 0 (0.0%) |
| 1 or 2 Children | 22 (100.0%) | 0 (0.0%) |
| 3 or 4 Children | 0 (0.0%) | 0 (0.0%) |
| 5 or more Children | 0 (0.0%) | 0 (0.0%) |
| Total | 100 (100.0%) | 0 (0.0%) |
Income Below Poverty Among Single-Parent Households in Lake City
| Children | Single Father | Single Mother |
| No Children | 0 (0.0%) | 0 (0.0%) |
| 1 or 2 Children | 0 (0.0%) | 0 (0.0%) |
| 3 or 4 Children | 0 (0.0%) | 0 (0.0%) |
| 5 or more Children | 0 (0.0%) | 0 (0.0%) |
| Total | 0 (0.0%) | 0 (0.0%) |
Income Below Poverty Among Married-Couple vs Single-Parent Households in Lake City
| Children | Married-Couple Families | Single-Parent Households |
| No Children | 0 (0.0%) | 0 (0.0%) |
| 1 or 2 Children | 0 (0.0%) | 0 (0.0%) |
| 3 or 4 Children | 0 (0.0%) | 0 (0.0%) |
| 5 or more Children | 0 (0.0%) | 0 (0.0%) |
| Total | 0 (0.0%) | 0 (0.0%) |
Race in Lake City
The most populous races in Lake City are White / Caucasian (420 | 90.3%), Two or more Races (41 | 8.8%), and Hispanic or Latino (5 | 1.1%).
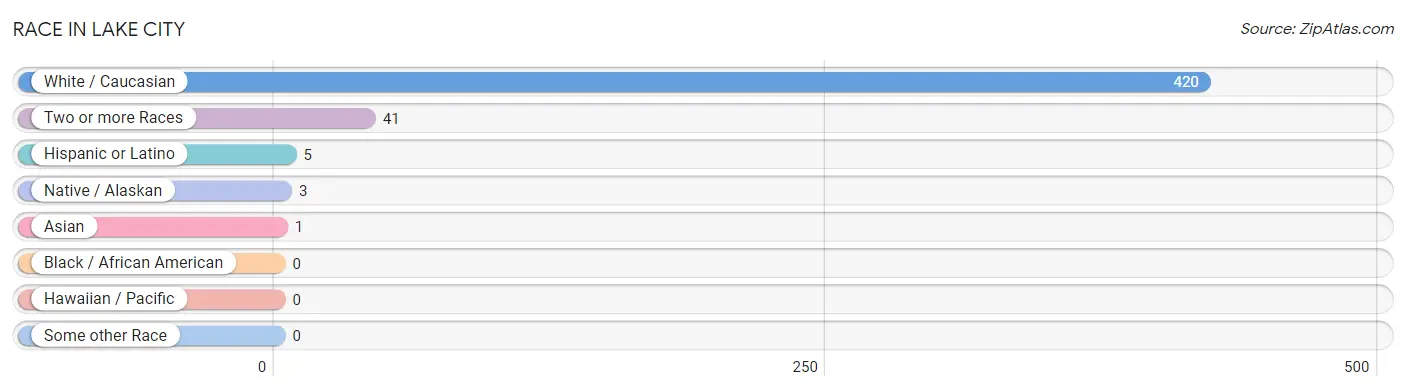
| Race | # Population | % Population |
| Asian | 1 | 0.2% |
| Black / African American | 0 | 0.0% |
| Hawaiian / Pacific | 0 | 0.0% |
| Hispanic or Latino | 5 | 1.1% |
| Native / Alaskan | 3 | 0.6% |
| White / Caucasian | 420 | 90.3% |
| Two or more Races | 41 | 8.8% |
| Some other Race | 0 | 0.0% |
| Total | 465 | 100.0% |
Ancestry in Lake City
The most populous ancestries reported in Lake City are English (144 | 31.0%), German (111 | 23.9%), Irish (65 | 14.0%), Scottish (52 | 11.2%), and French (43 | 9.2%), together accounting for 89.3% of all Lake City residents.
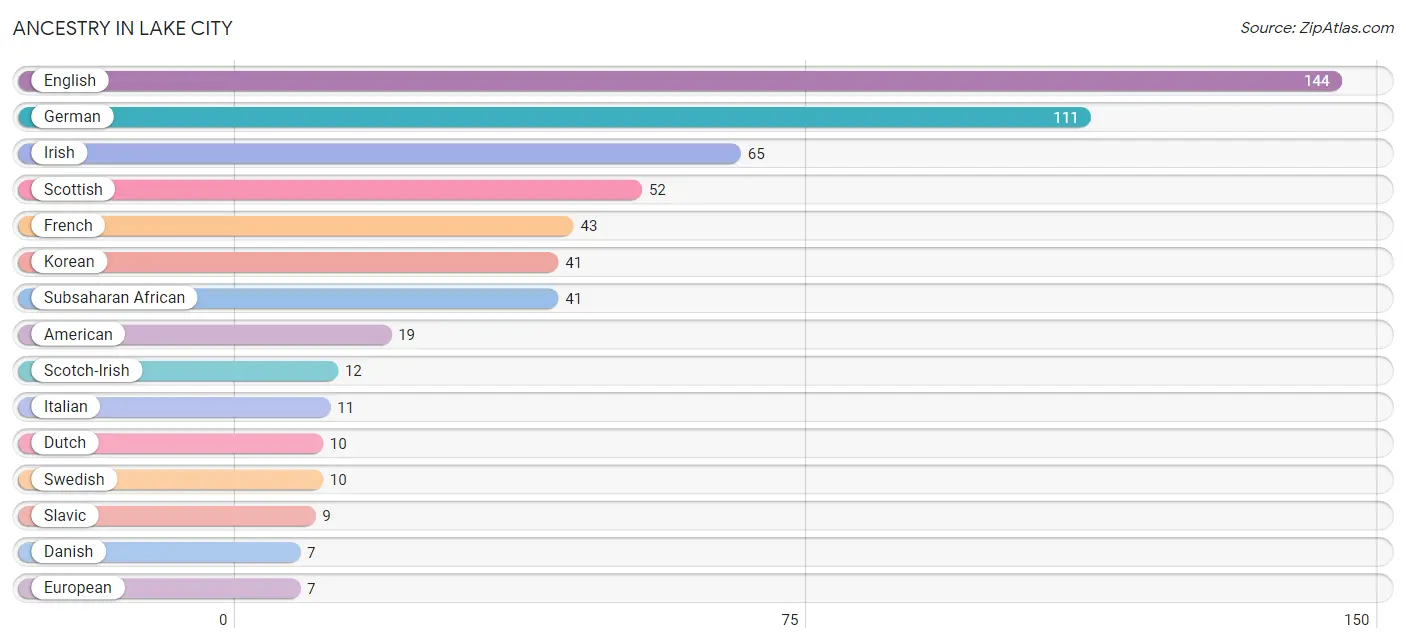
| Ancestry | # Population | % Population |
| American | 19 | 4.1% |
| Arab | 5 | 1.1% |
| Canadian | 6 | 1.3% |
| Cherokee | 3 | 0.6% |
| Czech | 4 | 0.9% |
| Danish | 7 | 1.5% |
| Dutch | 10 | 2.1% |
| English | 144 | 31.0% |
| European | 7 | 1.5% |
| French | 43 | 9.2% |
| French Canadian | 6 | 1.3% |
| German | 111 | 23.9% |
| Iraqi | 5 | 1.1% |
| Irish | 65 | 14.0% |
| Italian | 11 | 2.4% |
| Korean | 41 | 8.8% |
| Mexican | 5 | 1.1% |
| Norwegian | 7 | 1.5% |
| Scandinavian | 2 | 0.4% |
| Scotch-Irish | 12 | 2.6% |
| Scottish | 52 | 11.2% |
| Slavic | 9 | 1.9% |
| Subsaharan African | 41 | 8.8% |
| Swedish | 10 | 2.1% |
| Thai | 1 | 0.2% |
| Welsh | 4 | 0.9% | View All 26 Rows |
Immigrants in Lake City
The most numerous immigrant groups reported in Lake City came from Europe (4 | 0.9%), Ireland (4 | 0.9%), Northern Europe (4 | 0.9%), Asia (1 | 0.2%), and India (1 | 0.2%), together accounting for 3.0% of all Lake City residents.
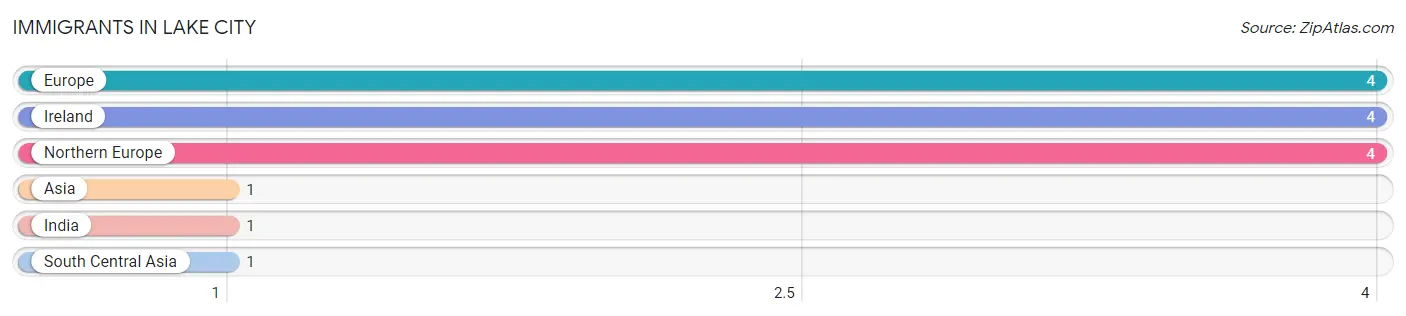
| Immigration Origin | # Population | % Population |
| Asia | 1 | 0.2% |
| Europe | 4 | 0.9% |
| India | 1 | 0.2% |
| Ireland | 4 | 0.9% |
| Northern Europe | 4 | 0.9% |
| South Central Asia | 1 | 0.2% | View All 6 Rows |
Sex and Age in Lake City
Sex and Age in Lake City
The most populous age groups in Lake City are 70 to 74 Years (34 | 15.2%) for men and 50 to 54 Years (47 | 19.4%) for women.
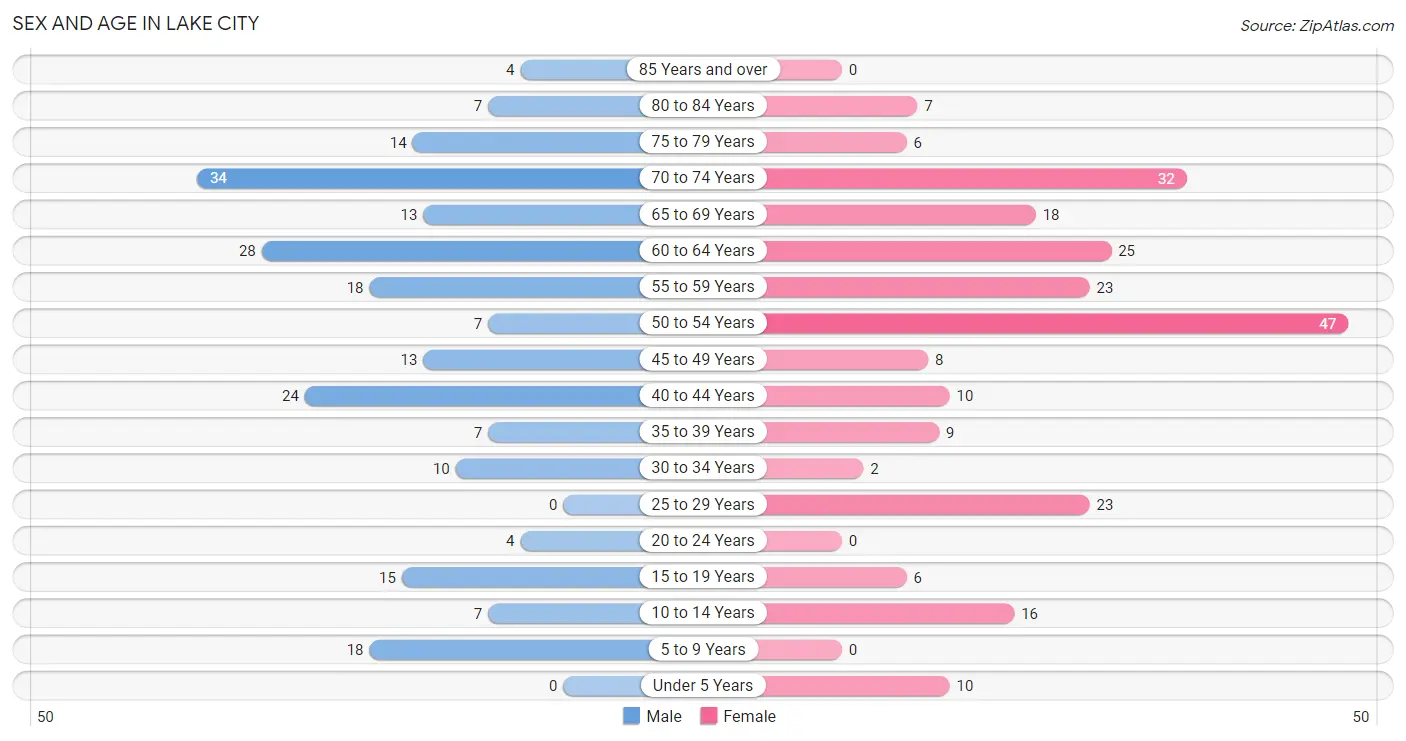
| Age Bracket | Male | Female |
| Under 5 Years | 0 (0.0%) | 10 (4.1%) |
| 5 to 9 Years | 18 (8.1%) | 0 (0.0%) |
| 10 to 14 Years | 7 (3.1%) | 16 (6.6%) |
| 15 to 19 Years | 15 (6.7%) | 6 (2.5%) |
| 20 to 24 Years | 4 (1.8%) | 0 (0.0%) |
| 25 to 29 Years | 0 (0.0%) | 23 (9.5%) |
| 30 to 34 Years | 10 (4.5%) | 2 (0.8%) |
| 35 to 39 Years | 7 (3.1%) | 9 (3.7%) |
| 40 to 44 Years | 24 (10.8%) | 10 (4.1%) |
| 45 to 49 Years | 13 (5.8%) | 8 (3.3%) |
| 50 to 54 Years | 7 (3.1%) | 47 (19.4%) |
| 55 to 59 Years | 18 (8.1%) | 23 (9.5%) |
| 60 to 64 Years | 28 (12.6%) | 25 (10.3%) |
| 65 to 69 Years | 13 (5.8%) | 18 (7.4%) |
| 70 to 74 Years | 34 (15.2%) | 32 (13.2%) |
| 75 to 79 Years | 14 (6.3%) | 6 (2.5%) |
| 80 to 84 Years | 7 (3.1%) | 7 (2.9%) |
| 85 Years and over | 4 (1.8%) | 0 (0.0%) |
| Total | 223 (100.0%) | 242 (100.0%) |
Families and Households in Lake City
Median Family Size in Lake City
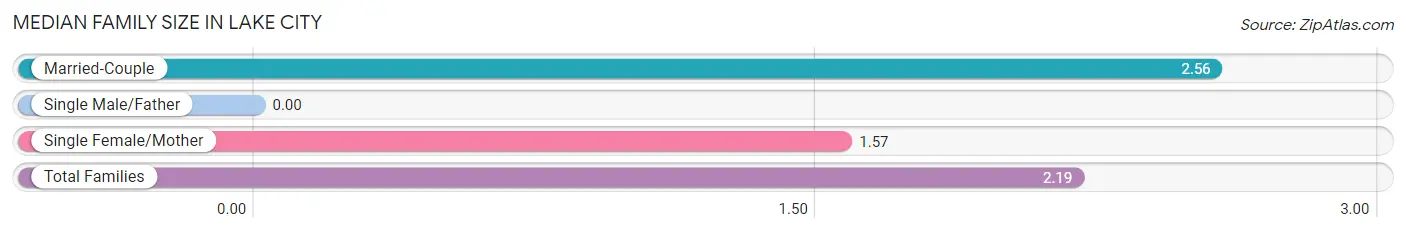
| Family Type | # Families | Family Size |
| Married-Couple | 100 (62.1%) | 2.56 |
| Single Male/Father | 0 (0.0%) | - |
| Single Female/Mother | 61 (37.9%) | 1.57 |
| Total Families | 161 (100.0%) | 2.19 |
Median Household Size in Lake City
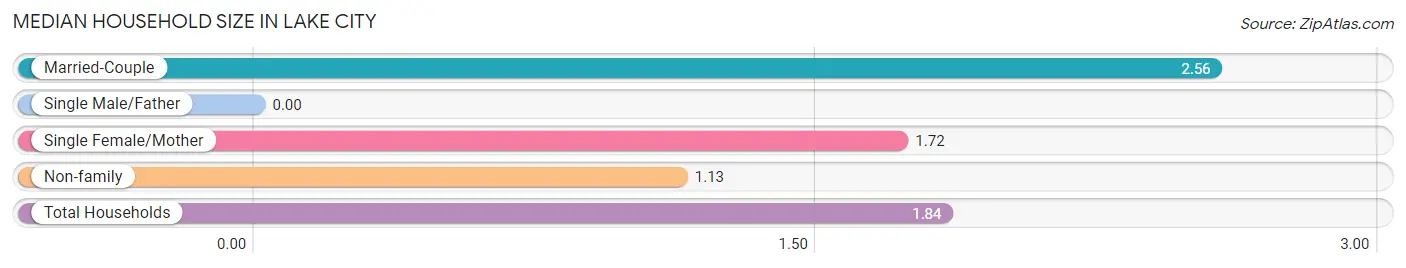
| Household Type | # Households | Household Size |
| Married-Couple | 100 (39.5%) | 2.56 |
| Single Male/Father | 0 (0.0%) | - |
| Single Female/Mother | 61 (24.1%) | 1.72 |
| Non-family | 92 (36.4%) | 1.13 |
| Total Households | 253 (100.0%) | 1.84 |
Household Size by Marriage Status in Lake City
Out of a total of 253 households in Lake City, 161 (63.6%) are family households, while 92 (36.4%) are nonfamily households. The most numerous type of family households are 2-person households, comprising 106, and the most common type of nonfamily households are 1-person households, comprising 76.
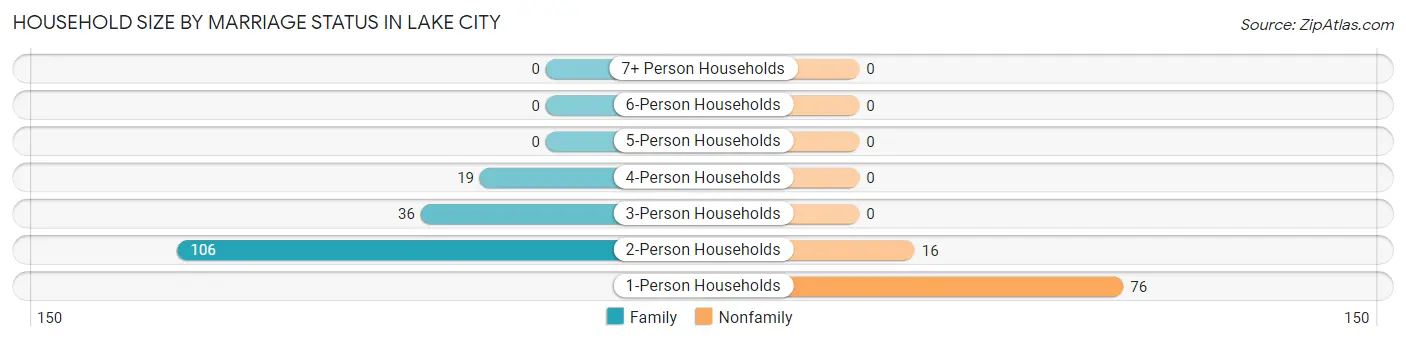
| Household Size | Family Households | Nonfamily Households |
| 1-Person Households | - | 76 (30.0%) |
| 2-Person Households | 106 (41.9%) | 16 (6.3%) |
| 3-Person Households | 36 (14.2%) | 0 (0.0%) |
| 4-Person Households | 19 (7.5%) | 0 (0.0%) |
| 5-Person Households | 0 (0.0%) | 0 (0.0%) |
| 6-Person Households | 0 (0.0%) | 0 (0.0%) |
| 7+ Person Households | 0 (0.0%) | 0 (0.0%) |
| Total | 161 (63.6%) | 92 (36.4%) |
Female Fertility in Lake City
Fertility by Age in Lake City
| Age Bracket | Women with Births | Births / 1,000 Women |
| 15 to 19 years | 0 (0.0%) | 0.0 |
| 20 to 34 years | 0 (0.0%) | 0.0 |
| 35 to 50 years | 0 (0.0%) | 0.0 |
| Total | 0 (0.0%) | 0.0 |
Fertility by Age by Marriage Status in Lake City
| Age Bracket | Married | Unmarried |
| 15 to 19 years | 0 (0.0%) | 0 (0.0%) |
| 20 to 34 years | 0 (0.0%) | 0 (0.0%) |
| 35 to 50 years | 0 (0.0%) | 0 (0.0%) |
| Total | 0 (0.0%) | 0 (0.0%) |
Fertility by Education in Lake City
| Educational Attainment | Women with Births | Births / 1,000 Women |
| Less than High School | 0 (0.0%) | 0.0 |
| High School Diploma | 0 (0.0%) | 0.0 |
| College or Associate's Degree | 0 (0.0%) | 0.0 |
| Bachelor's Degree | 0 (0.0%) | 0.0 |
| Graduate Degree | 0 (0.0%) | 0.0 |
| Total | 0 (0.0%) | 0.0 |
Fertility by Education by Marriage Status in Lake City
| Educational Attainment | Married | Unmarried |
| Less than High School | 0 (0.0%) | 0 (0.0%) |
| High School Diploma | 0 (0.0%) | 0 (0.0%) |
| College or Associate's Degree | 0 (0.0%) | 0 (0.0%) |
| Bachelor's Degree | 0 (0.0%) | 0 (0.0%) |
| Graduate Degree | 0 (0.0%) | 0 (0.0%) |
| Total | 0 (0.0%) | 0 (0.0%) |
Employment Characteristics in Lake City
Employment by Class of Employer in Lake City
Among the 206 employed individuals in Lake City, private company employees (57 | 27.7%), self-employed (incorporated) (48 | 23.3%), and local government employees (35 | 17.0%) make up the most common classes of employment.
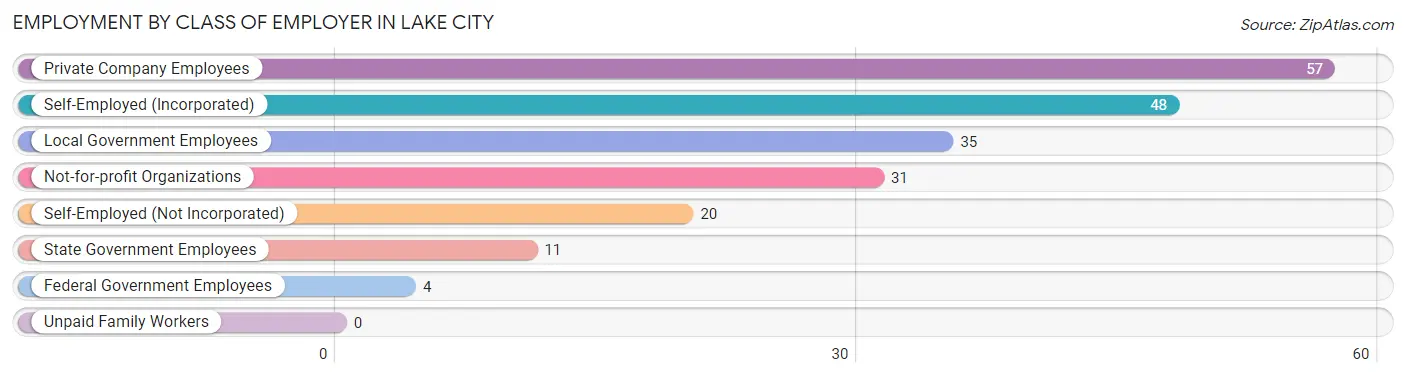
| Employer Class | # Employees | % Employees |
| Private Company Employees | 57 | 27.7% |
| Self-Employed (Incorporated) | 48 | 23.3% |
| Self-Employed (Not Incorporated) | 20 | 9.7% |
| Not-for-profit Organizations | 31 | 15.0% |
| Local Government Employees | 35 | 17.0% |
| State Government Employees | 11 | 5.3% |
| Federal Government Employees | 4 | 1.9% |
| Unpaid Family Workers | 0 | 0.0% |
| Total | 206 | 100.0% |
Employment Status by Age in Lake City
According to the labor force statistics for Lake City, out of the total population over 16 years of age (414), 52.2% or 216 individuals are in the labor force, with 1.4% or 3 of them unemployed. The age group with the highest labor force participation rate is 25 to 29 years, with 100.0% or 23 individuals in the labor force. Within the labor force, the 55 to 59 years age range has the highest percentage of unemployed individuals, with 11.1% or 3 of them being unemployed.
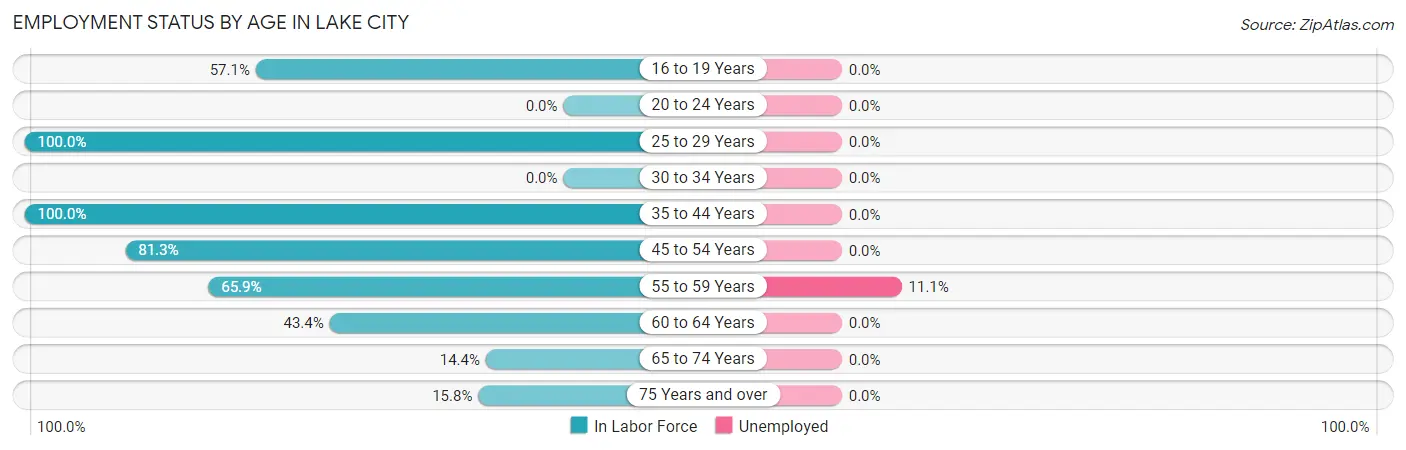
| Age Bracket | In Labor Force | Unemployed |
| 16 to 19 Years | 12 (57.1%) | 0 (0.0%) |
| 20 to 24 Years | 0 (0.0%) | 0 (0.0%) |
| 25 to 29 Years | 23 (100.0%) | 0 (0.0%) |
| 30 to 34 Years | 0 (0.0%) | 0 (0.0%) |
| 35 to 44 Years | 50 (100.0%) | 0 (0.0%) |
| 45 to 54 Years | 61 (81.3%) | 0 (0.0%) |
| 55 to 59 Years | 27 (65.9%) | 3 (11.1%) |
| 60 to 64 Years | 23 (43.4%) | 0 (0.0%) |
| 65 to 74 Years | 14 (14.4%) | 0 (0.0%) |
| 75 Years and over | 6 (15.8%) | 0 (0.0%) |
| Total | 216 (52.2%) | 3 (1.4%) |
Employment Status by Educational Attainment in Lake City
According to labor force statistics for Lake City, 72.4% of individuals (184) out of the total population between 25 and 64 years of age (254) are in the labor force, with 1.6% or 3 of them being unemployed. The group with the highest labor force participation rate are those with the educational attainment of college / associate degree, with 82.9% or 92 individuals in the labor force. Within the labor force, individuals with high school diploma education have the highest percentage of unemployment, with 17.6% or 3 of them being unemployed.
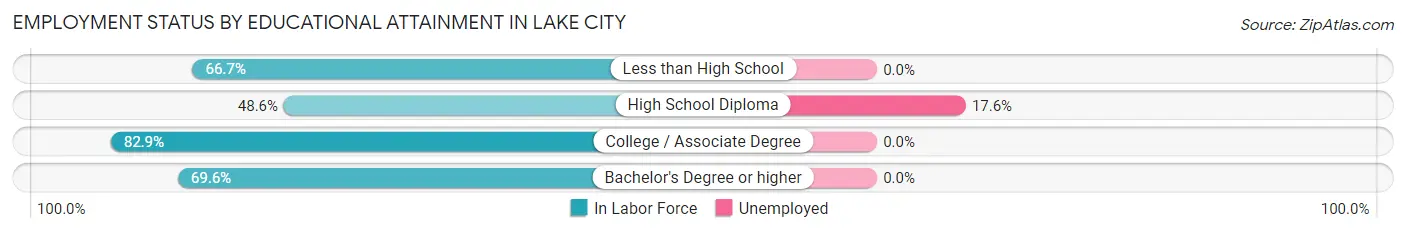
| Educational Attainment | In Labor Force | Unemployed |
| Less than High School | 4 (66.7%) | 0 (0.0%) |
| High School Diploma | 17 (48.6%) | 6 (17.6%) |
| College / Associate Degree | 92 (82.9%) | 0 (0.0%) |
| Bachelor's Degree or higher | 71 (69.6%) | 0 (0.0%) |
| Total | 184 (72.4%) | 4 (1.6%) |
Employment Occupations by Sex in Lake City
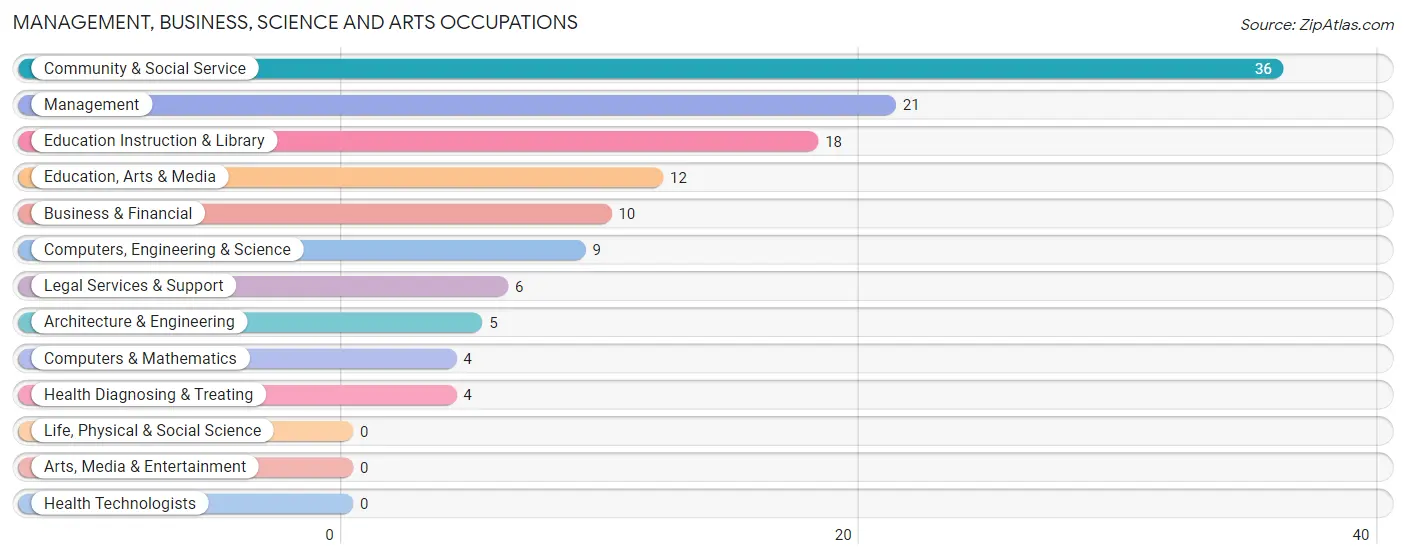
Management, Business, Science and Arts Occupations
The most common Management, Business, Science and Arts occupations in Lake City are Community & Social Service (36 | 16.9%), Management (21 | 9.9%), Education Instruction & Library (18 | 8.5%), Education, Arts & Media (12 | 5.6%), and Business & Financial (10 | 4.7%).
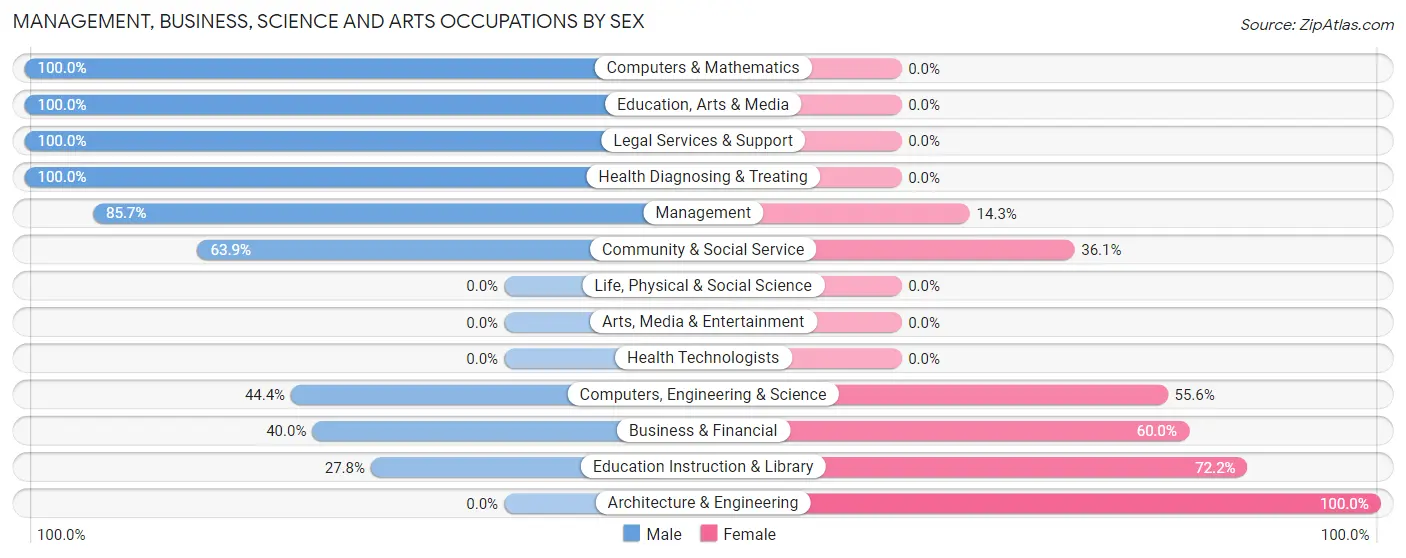
Management, Business, Science and Arts Occupations by Sex
Within the Management, Business, Science and Arts occupations in Lake City, the most male-oriented occupations are Computers & Mathematics (100.0%), Education, Arts & Media (100.0%), and Legal Services & Support (100.0%), while the most female-oriented occupations are Architecture & Engineering (100.0%), Education Instruction & Library (72.2%), and Business & Financial (60.0%).
| Occupation | Male | Female |
| Management | 18 (85.7%) | 3 (14.3%) |
| Business & Financial | 4 (40.0%) | 6 (60.0%) |
| Computers, Engineering & Science | 4 (44.4%) | 5 (55.6%) |
| Computers & Mathematics | 4 (100.0%) | 0 (0.0%) |
| Architecture & Engineering | 0 (0.0%) | 5 (100.0%) |
| Life, Physical & Social Science | 0 (0.0%) | 0 (0.0%) |
| Community & Social Service | 23 (63.9%) | 13 (36.1%) |
| Education, Arts & Media | 12 (100.0%) | 0 (0.0%) |
| Legal Services & Support | 6 (100.0%) | 0 (0.0%) |
| Education Instruction & Library | 5 (27.8%) | 13 (72.2%) |
| Arts, Media & Entertainment | 0 (0.0%) | 0 (0.0%) |
| Health Diagnosing & Treating | 4 (100.0%) | 0 (0.0%) |
| Health Technologists | 0 (0.0%) | 0 (0.0%) |
| Total (Category) | 53 (66.2%) | 27 (33.8%) |
| Total (Overall) | 113 (53.0%) | 100 (46.9%) |
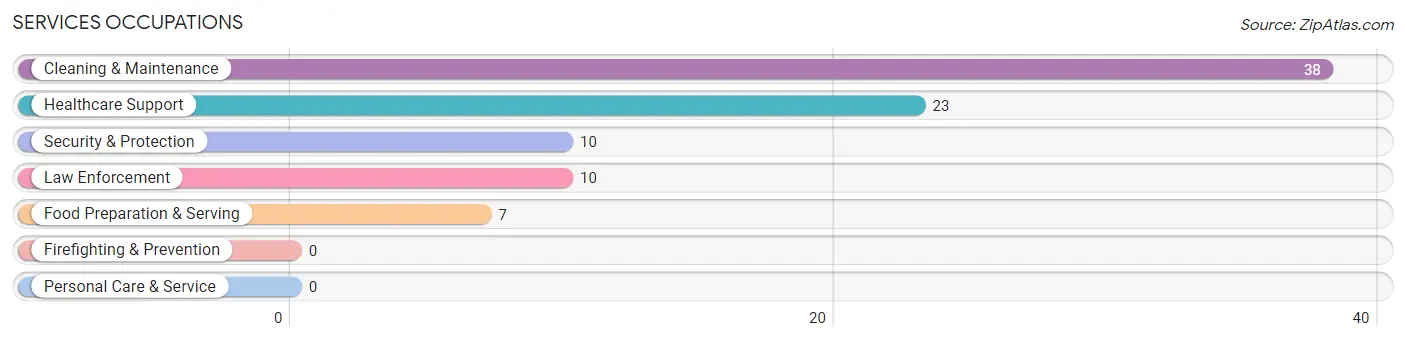
Services Occupations
The most common Services occupations in Lake City are Cleaning & Maintenance (38 | 17.8%), Healthcare Support (23 | 10.8%), Security & Protection (10 | 4.7%), Law Enforcement (10 | 4.7%), and Food Preparation & Serving (7 | 3.3%).
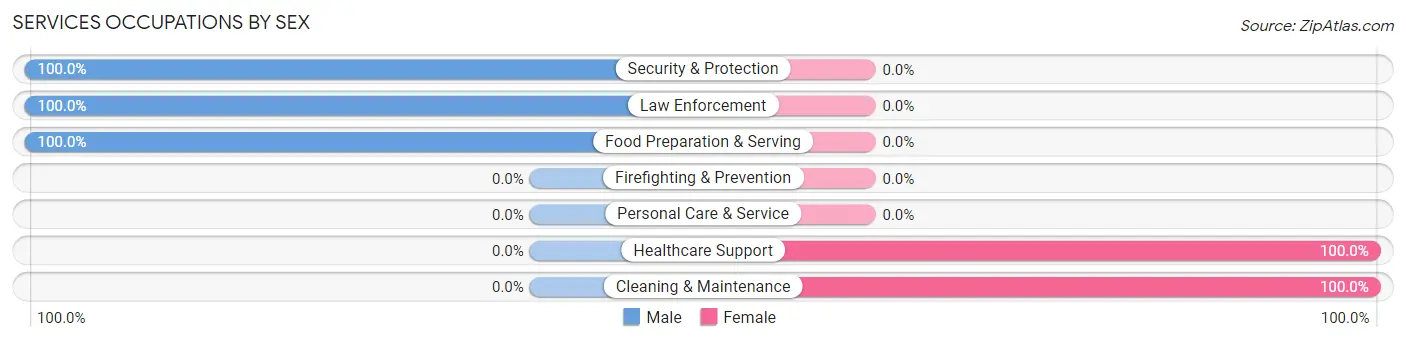
Services Occupations by Sex
Within the Services occupations in Lake City, the most male-oriented occupations are Security & Protection (100.0%), Law Enforcement (100.0%), and Food Preparation & Serving (100.0%), while the most female-oriented occupations are Healthcare Support (100.0%), and Cleaning & Maintenance (100.0%).
| Occupation | Male | Female |
| Healthcare Support | 0 (0.0%) | 23 (100.0%) |
| Security & Protection | 10 (100.0%) | 0 (0.0%) |
| Firefighting & Prevention | 0 (0.0%) | 0 (0.0%) |
| Law Enforcement | 10 (100.0%) | 0 (0.0%) |
| Food Preparation & Serving | 7 (100.0%) | 0 (0.0%) |
| Cleaning & Maintenance | 0 (0.0%) | 38 (100.0%) |
| Personal Care & Service | 0 (0.0%) | 0 (0.0%) |
| Total (Category) | 17 (21.8%) | 61 (78.2%) |
| Total (Overall) | 113 (53.0%) | 100 (46.9%) |
Sales and Office Occupations
The most common Sales and Office occupations in Lake City are Office & Administration (17 | 8.0%), and Sales & Related (12 | 5.6%).
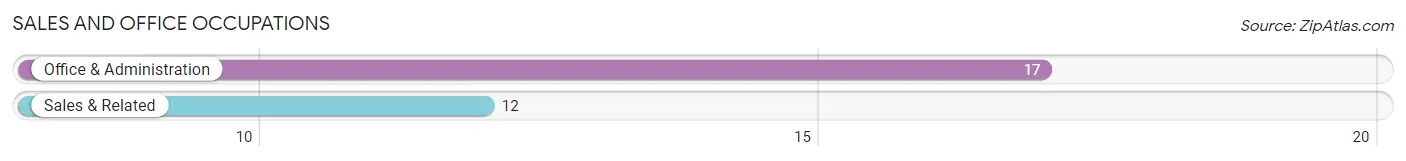
Sales and Office Occupations by Sex

| Occupation | Male | Female |
| Sales & Related | 12 (100.0%) | 0 (0.0%) |
| Office & Administration | 6 (35.3%) | 11 (64.7%) |
| Total (Category) | 18 (62.1%) | 11 (37.9%) |
| Total (Overall) | 113 (53.0%) | 100 (46.9%) |
Natural Resources, Construction and Maintenance Occupations
The most common Natural Resources, Construction and Maintenance occupations in Lake City are , and Construction & Extraction (17 | 8.0%).
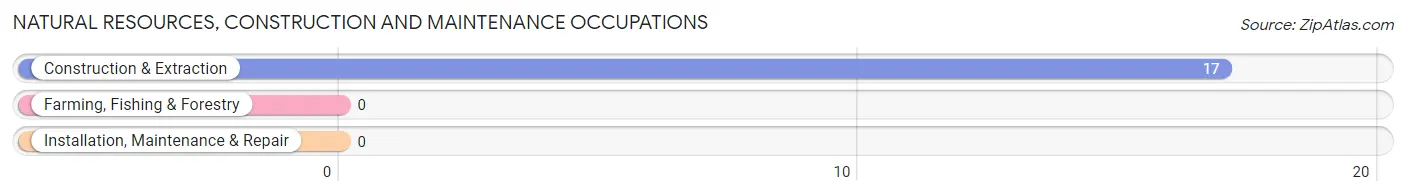
Natural Resources, Construction and Maintenance Occupations by Sex
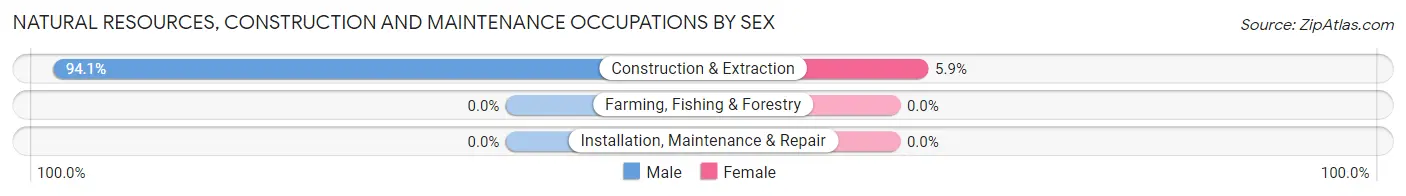
| Occupation | Male | Female |
| Farming, Fishing & Forestry | 0 (0.0%) | 0 (0.0%) |
| Construction & Extraction | 16 (94.1%) | 1 (5.9%) |
| Installation, Maintenance & Repair | 0 (0.0%) | 0 (0.0%) |
| Total (Category) | 16 (94.1%) | 1 (5.9%) |
| Total (Overall) | 113 (53.0%) | 100 (46.9%) |
Production, Transportation and Moving Occupations
The most common Production, Transportation and Moving occupations in Lake City are , and Transportation (9 | 4.2%).
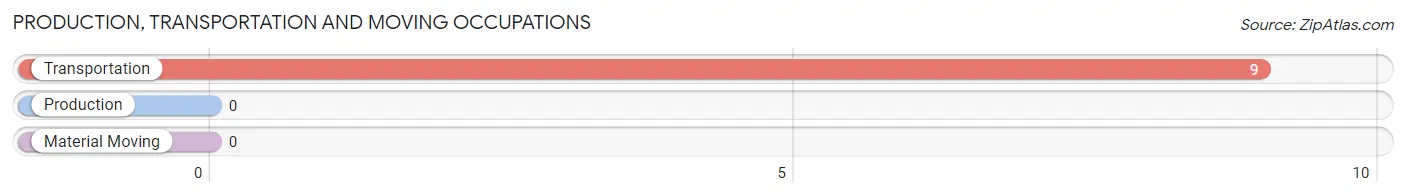
Production, Transportation and Moving Occupations by Sex
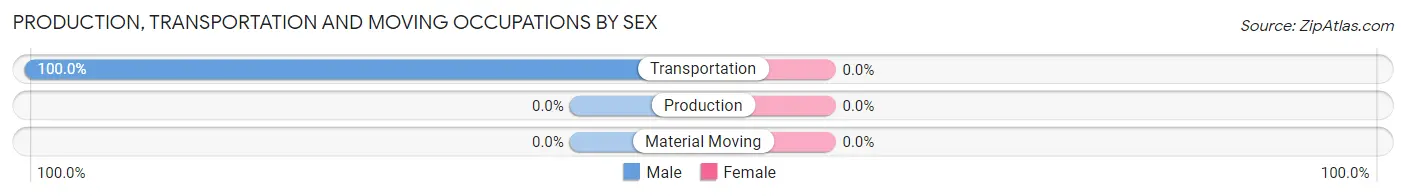
| Occupation | Male | Female |
| Production | 0 (0.0%) | 0 (0.0%) |
| Transportation | 9 (100.0%) | 0 (0.0%) |
| Material Moving | 0 (0.0%) | 0 (0.0%) |
| Total (Category) | 9 (100.0%) | 0 (0.0%) |
| Total (Overall) | 113 (53.0%) | 100 (46.9%) |
Employment Industries by Sex in Lake City
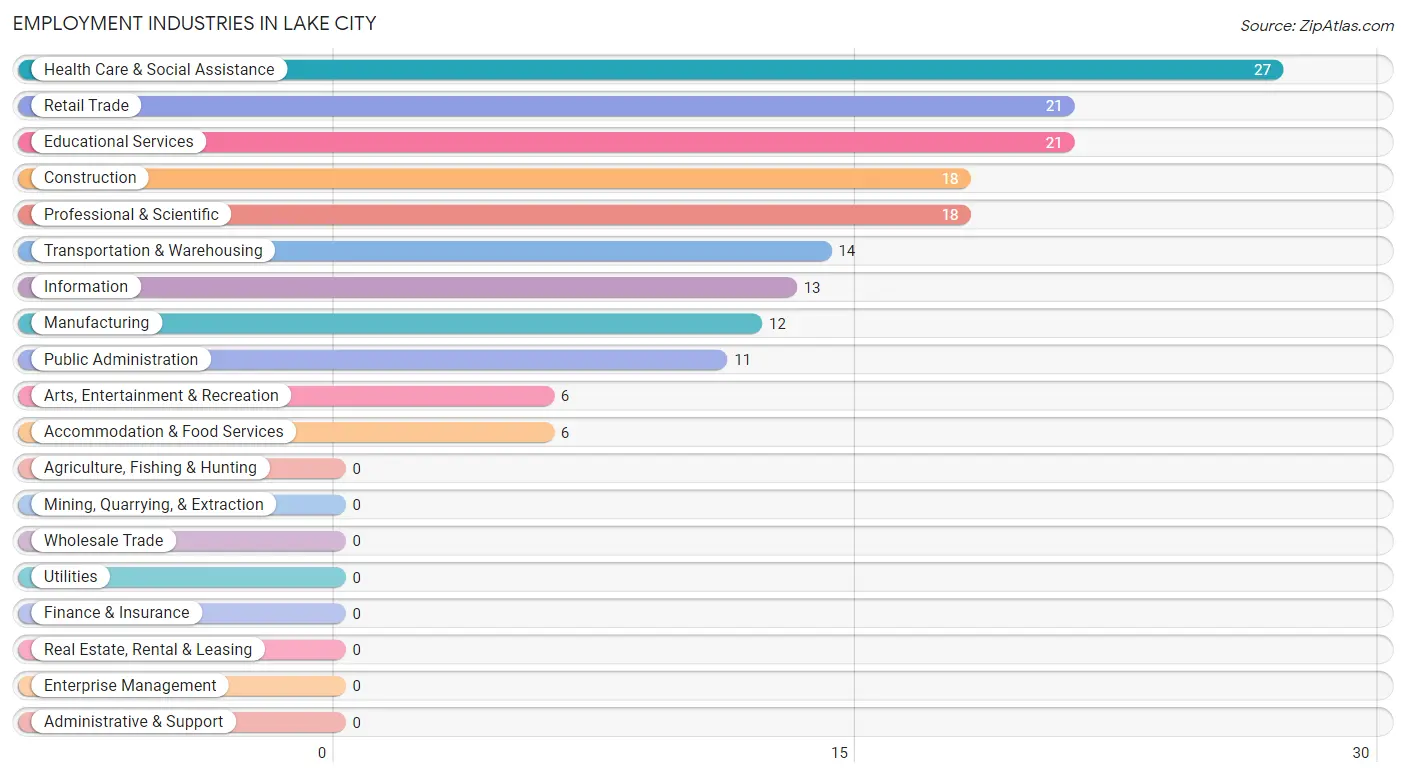
Employment Industries in Lake City
The major employment industries in Lake City include Health Care & Social Assistance (27 | 12.7%), Retail Trade (21 | 9.9%), Educational Services (21 | 9.9%), Construction (18 | 8.5%), and Professional & Scientific (18 | 8.5%).
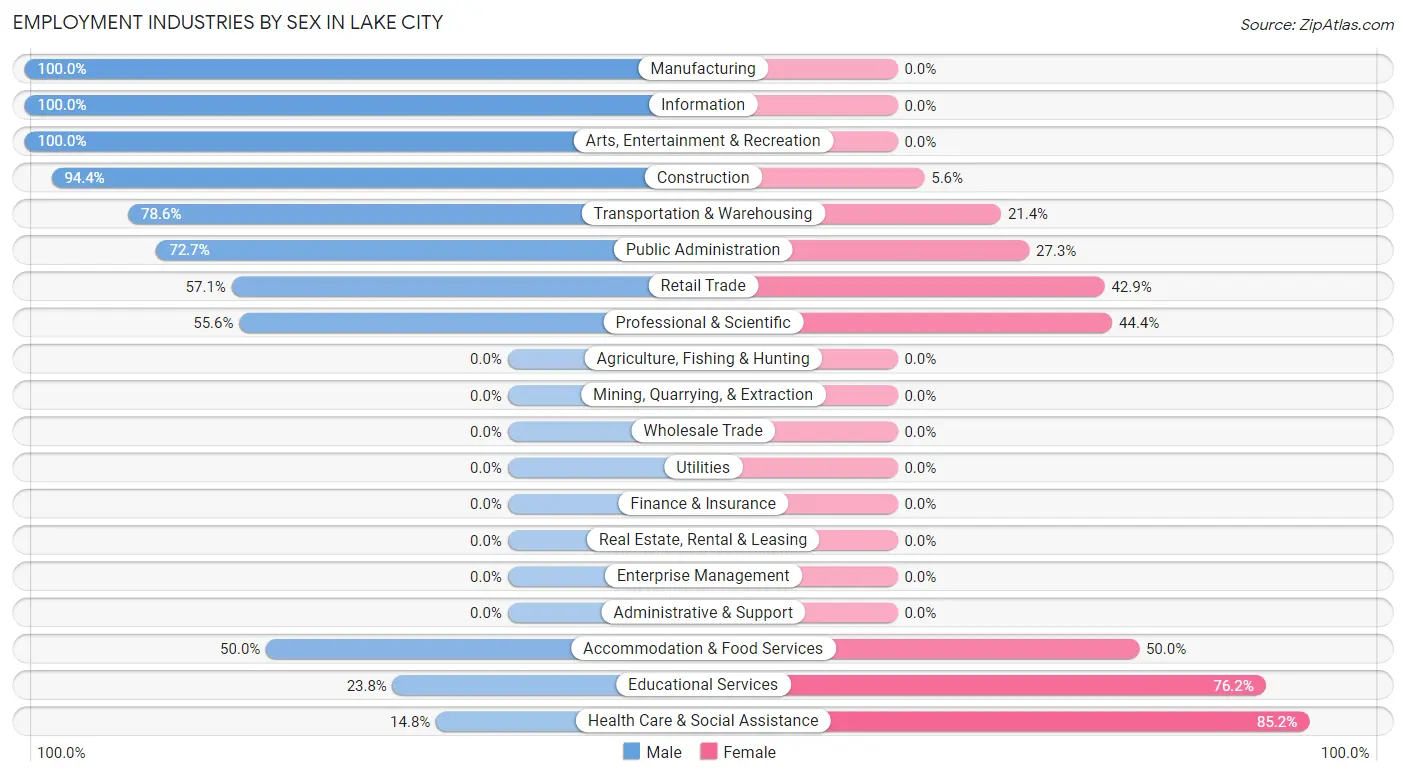
Employment Industries by Sex in Lake City
The Lake City industries that see more men than women are Manufacturing (100.0%), Information (100.0%), and Arts, Entertainment & Recreation (100.0%), whereas the industries that tend to have a higher number of women are Health Care & Social Assistance (85.2%), Educational Services (76.2%), and Accommodation & Food Services (50.0%).
| Industry | Male | Female |
| Agriculture, Fishing & Hunting | 0 (0.0%) | 0 (0.0%) |
| Mining, Quarrying, & Extraction | 0 (0.0%) | 0 (0.0%) |
| Construction | 17 (94.4%) | 1 (5.6%) |
| Manufacturing | 12 (100.0%) | 0 (0.0%) |
| Wholesale Trade | 0 (0.0%) | 0 (0.0%) |
| Retail Trade | 12 (57.1%) | 9 (42.9%) |
| Transportation & Warehousing | 11 (78.6%) | 3 (21.4%) |
| Utilities | 0 (0.0%) | 0 (0.0%) |
| Information | 13 (100.0%) | 0 (0.0%) |
| Finance & Insurance | 0 (0.0%) | 0 (0.0%) |
| Real Estate, Rental & Leasing | 0 (0.0%) | 0 (0.0%) |
| Professional & Scientific | 10 (55.6%) | 8 (44.4%) |
| Enterprise Management | 0 (0.0%) | 0 (0.0%) |
| Administrative & Support | 0 (0.0%) | 0 (0.0%) |
| Educational Services | 5 (23.8%) | 16 (76.2%) |
| Health Care & Social Assistance | 4 (14.8%) | 23 (85.2%) |
| Arts, Entertainment & Recreation | 6 (100.0%) | 0 (0.0%) |
| Accommodation & Food Services | 3 (50.0%) | 3 (50.0%) |
| Public Administration | 8 (72.7%) | 3 (27.3%) |
| Total | 113 (53.0%) | 100 (46.9%) |
Education in Lake City
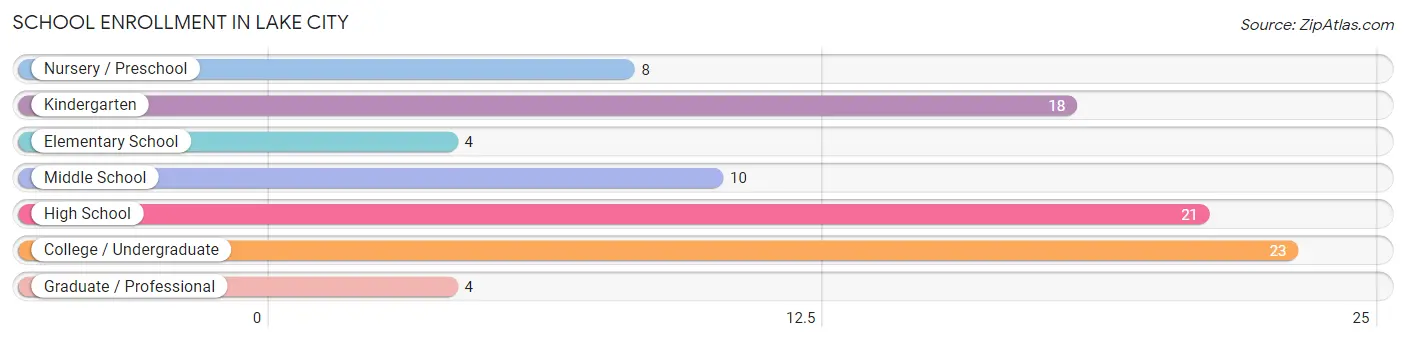
School Enrollment in Lake City
The most common levels of schooling among the 88 students in Lake City are college / undergraduate (23 | 26.1%), high school (21 | 23.9%), and kindergarten (18 | 20.4%).
| School Level | # Students | % Students |
| Nursery / Preschool | 8 | 9.1% |
| Kindergarten | 18 | 20.4% |
| Elementary School | 4 | 4.5% |
| Middle School | 10 | 11.4% |
| High School | 21 | 23.9% |
| College / Undergraduate | 23 | 26.1% |
| Graduate / Professional | 4 | 4.5% |
| Total | 88 | 100.0% |
School Enrollment by Age by Funding Source in Lake City
Out of a total of 88 students who are enrolled in schools in Lake City, 35 (39.8%) attend a private institution, while the remaining 53 (60.2%) are enrolled in public schools. The age group of 18 to 19 year olds has the highest likelihood of being enrolled in private schools, with 12 (100.0% in the age bracket) enrolled. Conversely, the age group of 3 to 4 year olds has the lowest likelihood of being enrolled in a private school, with 8 (100.0% in the age bracket) attending a public institution.
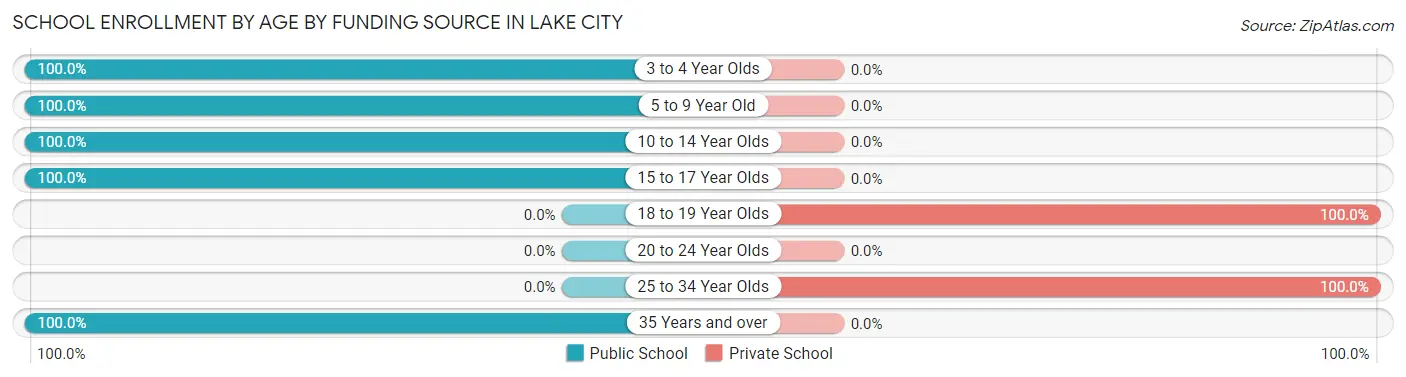
| Age Bracket | Public School | Private School |
| 3 to 4 Year Olds | 8 (100.0%) | 0 (0.0%) |
| 5 to 9 Year Old | 18 (100.0%) | 0 (0.0%) |
| 10 to 14 Year Olds | 14 (100.0%) | 0 (0.0%) |
| 15 to 17 Year Olds | 9 (100.0%) | 0 (0.0%) |
| 18 to 19 Year Olds | 0 (0.0%) | 12 (100.0%) |
| 20 to 24 Year Olds | 0 (0.0%) | 0 (0.0%) |
| 25 to 34 Year Olds | 0 (0.0%) | 23 (100.0%) |
| 35 Years and over | 4 (100.0%) | 0 (0.0%) |
| Total | 53 (60.2%) | 35 (39.8%) |
Educational Attainment by Field of Study in Lake City
Business (29 | 17.1%), education (28 | 16.5%), social sciences (20 | 11.8%), engineering (18 | 10.6%), and liberal arts & history (16 | 9.4%) are the most common fields of study among 170 individuals in Lake City who have obtained a bachelor's degree or higher.
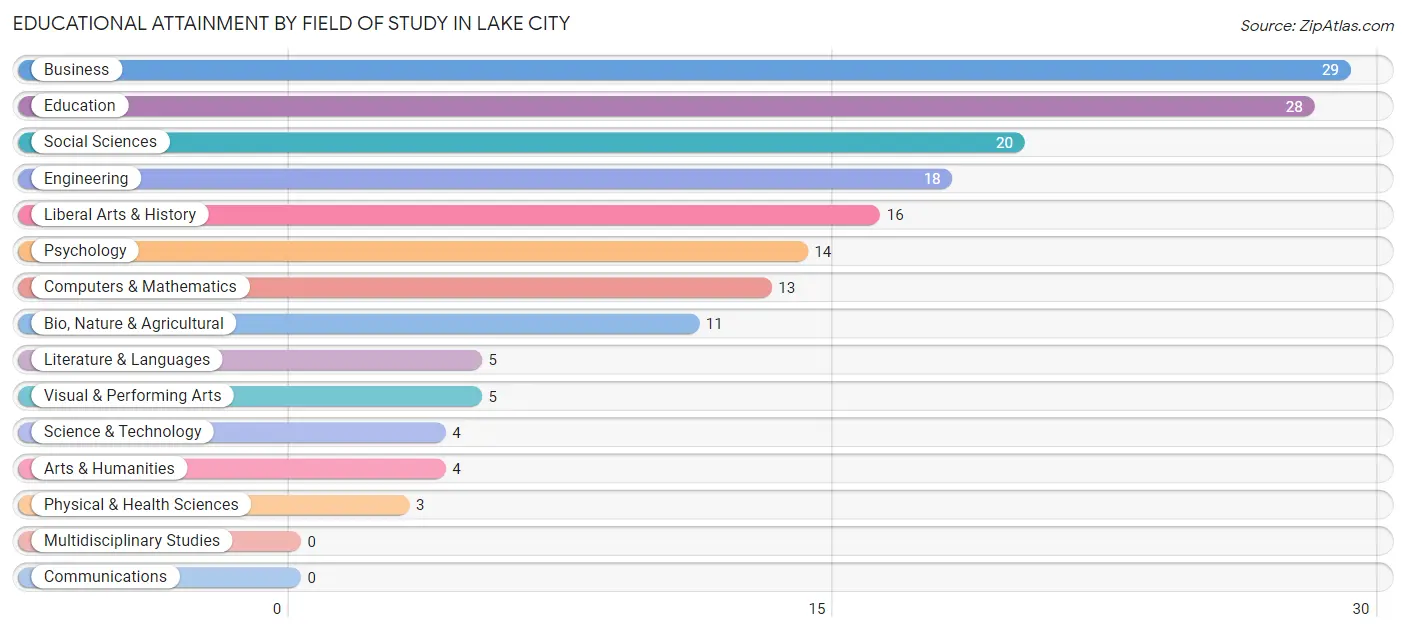
| Field of Study | # Graduates | % Graduates |
| Computers & Mathematics | 13 | 7.6% |
| Bio, Nature & Agricultural | 11 | 6.5% |
| Physical & Health Sciences | 3 | 1.8% |
| Psychology | 14 | 8.2% |
| Social Sciences | 20 | 11.8% |
| Engineering | 18 | 10.6% |
| Multidisciplinary Studies | 0 | 0.0% |
| Science & Technology | 4 | 2.4% |
| Business | 29 | 17.1% |
| Education | 28 | 16.5% |
| Literature & Languages | 5 | 2.9% |
| Liberal Arts & History | 16 | 9.4% |
| Visual & Performing Arts | 5 | 2.9% |
| Communications | 0 | 0.0% |
| Arts & Humanities | 4 | 2.4% |
| Total | 170 | 100.0% |
Transportation & Commute in Lake City
Vehicle Availability by Sex in Lake City
The most prevalent vehicle ownership categories in Lake City are males with 2 vehicles (58, accounting for 51.3%) and females with 2 vehicles (5, making up 62.4%).
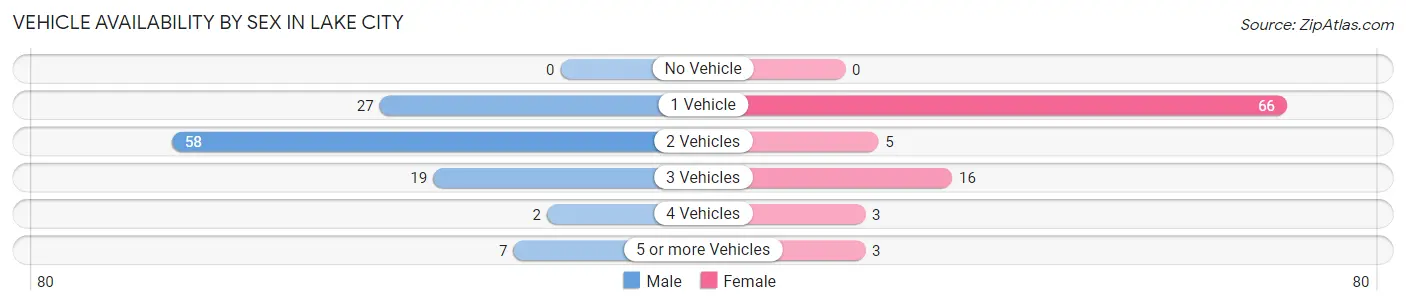
| Vehicles Available | Male | Female |
| No Vehicle | 0 (0.0%) | 0 (0.0%) |
| 1 Vehicle | 27 (23.9%) | 66 (71.0%) |
| 2 Vehicles | 58 (51.3%) | 5 (5.4%) |
| 3 Vehicles | 19 (16.8%) | 16 (17.2%) |
| 4 Vehicles | 2 (1.8%) | 3 (3.2%) |
| 5 or more Vehicles | 7 (6.2%) | 3 (3.2%) |
| Total | 113 (100.0%) | 93 (100.0%) |
Commute Time in Lake City
The most frequently occuring commute durations in Lake City are 5 to 9 minutes (97 commuters, 50.5%), less than 5 minutes (49 commuters, 25.5%), and 20 to 24 minutes (34 commuters, 17.7%).
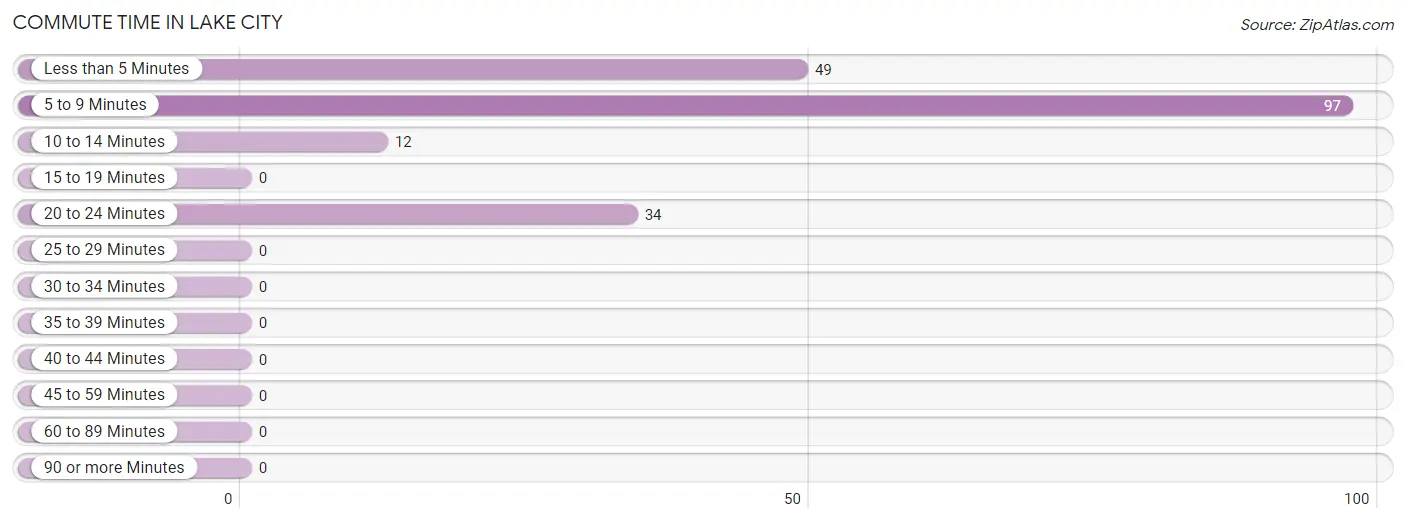
| Commute Time | # Commuters | % Commuters |
| Less than 5 Minutes | 49 | 25.5% |
| 5 to 9 Minutes | 97 | 50.5% |
| 10 to 14 Minutes | 12 | 6.2% |
| 15 to 19 Minutes | 0 | 0.0% |
| 20 to 24 Minutes | 34 | 17.7% |
| 25 to 29 Minutes | 0 | 0.0% |
| 30 to 34 Minutes | 0 | 0.0% |
| 35 to 39 Minutes | 0 | 0.0% |
| 40 to 44 Minutes | 0 | 0.0% |
| 45 to 59 Minutes | 0 | 0.0% |
| 60 to 89 Minutes | 0 | 0.0% |
| 90 or more Minutes | 0 | 0.0% |
Commute Time by Sex in Lake City
The most common commute times in Lake City are 5 to 9 minutes (56 commuters, 56.6%) for males and 5 to 9 minutes (41 commuters, 44.1%) for females.
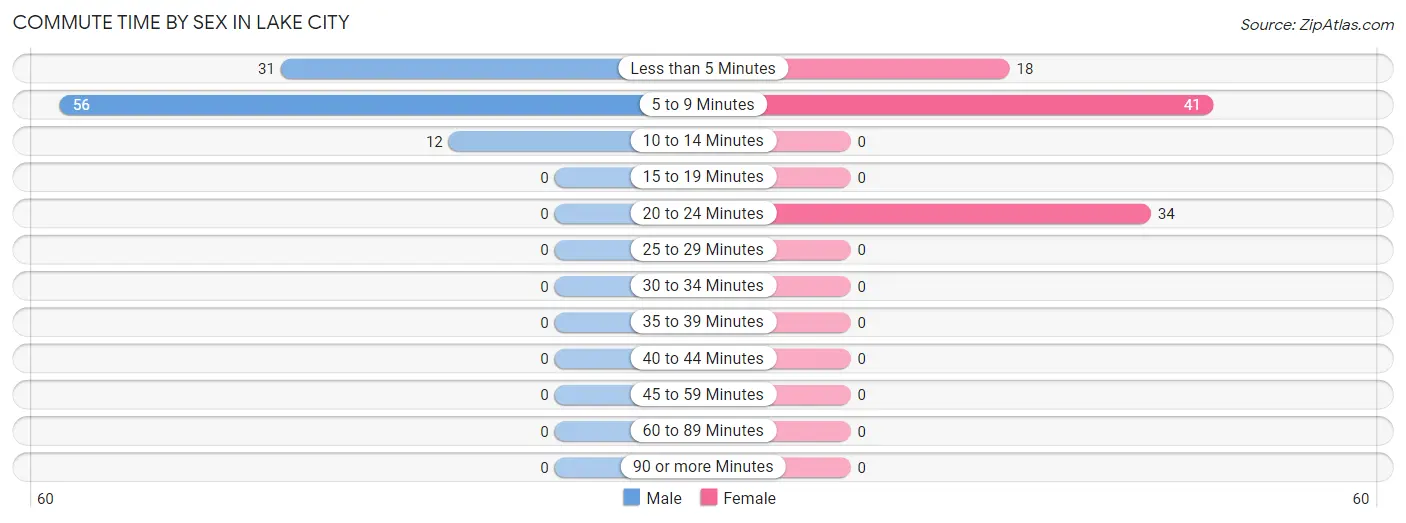
| Commute Time | Male | Female |
| Less than 5 Minutes | 31 (31.3%) | 18 (19.4%) |
| 5 to 9 Minutes | 56 (56.6%) | 41 (44.1%) |
| 10 to 14 Minutes | 12 (12.1%) | 0 (0.0%) |
| 15 to 19 Minutes | 0 (0.0%) | 0 (0.0%) |
| 20 to 24 Minutes | 0 (0.0%) | 34 (36.6%) |
| 25 to 29 Minutes | 0 (0.0%) | 0 (0.0%) |
| 30 to 34 Minutes | 0 (0.0%) | 0 (0.0%) |
| 35 to 39 Minutes | 0 (0.0%) | 0 (0.0%) |
| 40 to 44 Minutes | 0 (0.0%) | 0 (0.0%) |
| 45 to 59 Minutes | 0 (0.0%) | 0 (0.0%) |
| 60 to 89 Minutes | 0 (0.0%) | 0 (0.0%) |
| 90 or more Minutes | 0 (0.0%) | 0 (0.0%) |
Time of Departure to Work by Sex in Lake City
The most frequent times of departure to work in Lake City are 8:00 AM to 8:29 AM (25, 25.3%) for males and 9:00 AM to 9:59 AM (34, 36.6%) for females.
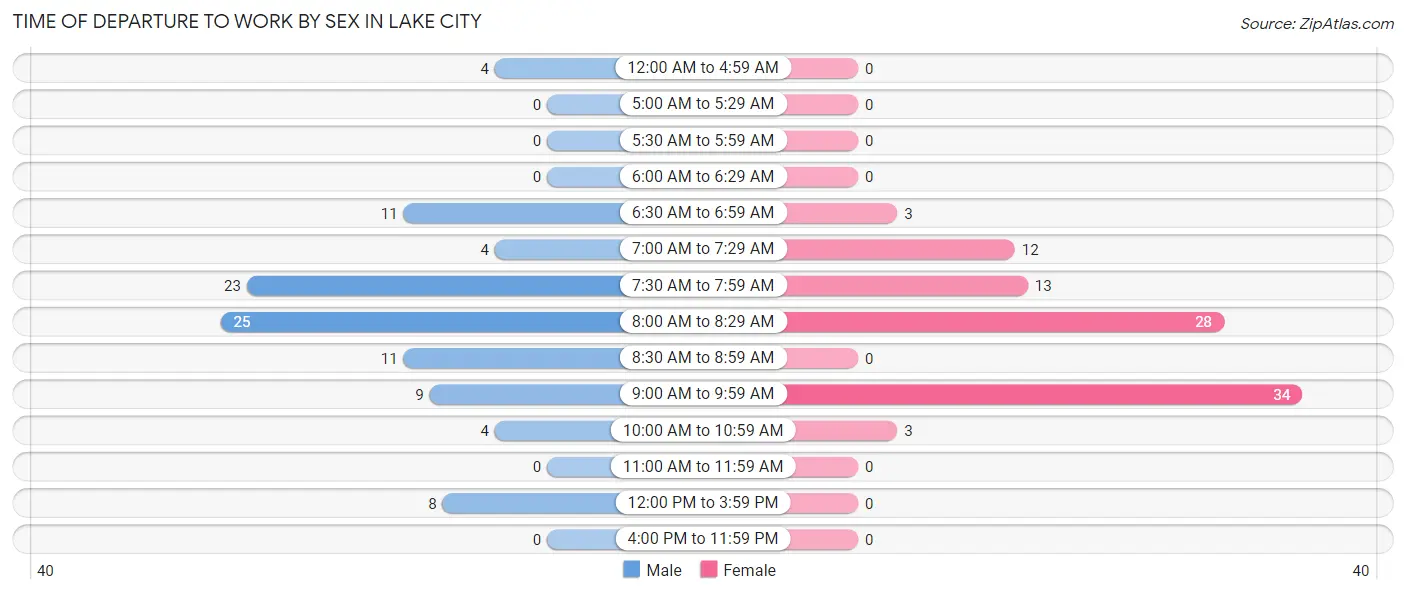
| Time of Departure | Male | Female |
| 12:00 AM to 4:59 AM | 4 (4.0%) | 0 (0.0%) |
| 5:00 AM to 5:29 AM | 0 (0.0%) | 0 (0.0%) |
| 5:30 AM to 5:59 AM | 0 (0.0%) | 0 (0.0%) |
| 6:00 AM to 6:29 AM | 0 (0.0%) | 0 (0.0%) |
| 6:30 AM to 6:59 AM | 11 (11.1%) | 3 (3.2%) |
| 7:00 AM to 7:29 AM | 4 (4.0%) | 12 (12.9%) |
| 7:30 AM to 7:59 AM | 23 (23.2%) | 13 (14.0%) |
| 8:00 AM to 8:29 AM | 25 (25.3%) | 28 (30.1%) |
| 8:30 AM to 8:59 AM | 11 (11.1%) | 0 (0.0%) |
| 9:00 AM to 9:59 AM | 9 (9.1%) | 34 (36.6%) |
| 10:00 AM to 10:59 AM | 4 (4.0%) | 3 (3.2%) |
| 11:00 AM to 11:59 AM | 0 (0.0%) | 0 (0.0%) |
| 12:00 PM to 3:59 PM | 8 (8.1%) | 0 (0.0%) |
| 4:00 PM to 11:59 PM | 0 (0.0%) | 0 (0.0%) |
| Total | 99 (100.0%) | 93 (100.0%) |
Housing Occupancy in Lake City
Occupancy by Ownership in Lake City
Of the total 253 dwellings in Lake City, owner-occupied units account for 197 (77.9%), while renter-occupied units make up 56 (22.1%).
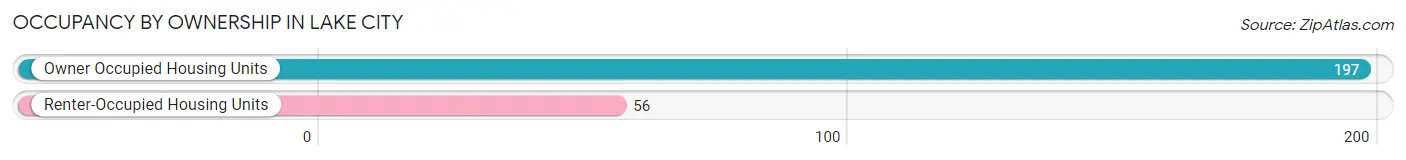
| Occupancy | # Housing Units | % Housing Units |
| Owner Occupied Housing Units | 197 | 77.9% |
| Renter-Occupied Housing Units | 56 | 22.1% |
| Total Occupied Housing Units | 253 | 100.0% |
Occupancy by Household Size in Lake City
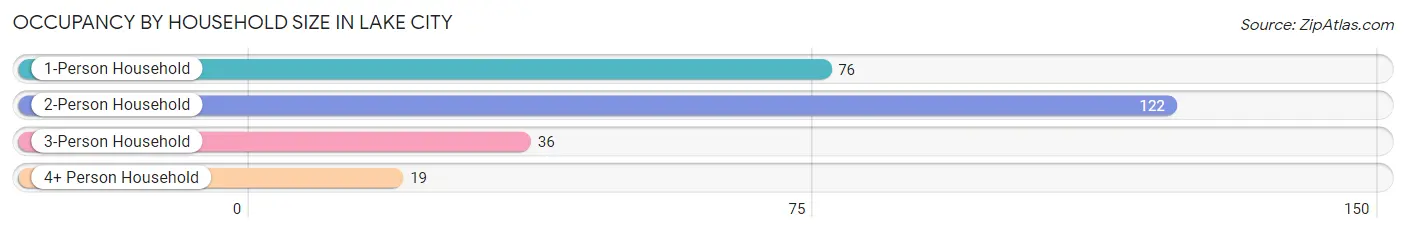
| Household Size | # Housing Units | % Housing Units |
| 1-Person Household | 76 | 30.0% |
| 2-Person Household | 122 | 48.2% |
| 3-Person Household | 36 | 14.2% |
| 4+ Person Household | 19 | 7.5% |
| Total Housing Units | 253 | 100.0% |
Occupancy by Ownership by Household Size in Lake City
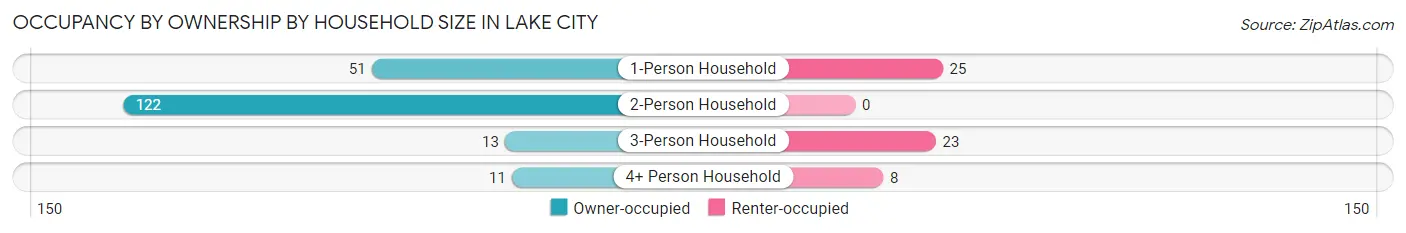
| Household Size | Owner-occupied | Renter-occupied |
| 1-Person Household | 51 (67.1%) | 25 (32.9%) |
| 2-Person Household | 122 (100.0%) | 0 (0.0%) |
| 3-Person Household | 13 (36.1%) | 23 (63.9%) |
| 4+ Person Household | 11 (57.9%) | 8 (42.1%) |
| Total Housing Units | 197 (77.9%) | 56 (22.1%) |
Occupancy by Educational Attainment in Lake City
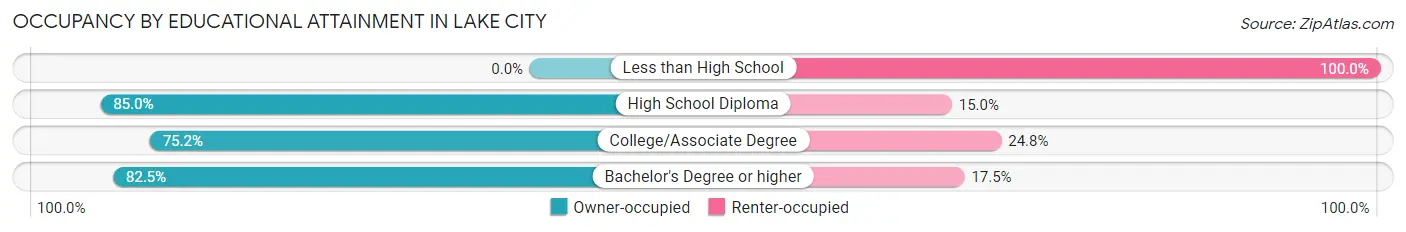
| Household Size | Owner-occupied | Renter-occupied |
| Less than High School | 0 (0.0%) | 4 (100.0%) |
| High School Diploma | 34 (85.0%) | 6 (15.0%) |
| College/Associate Degree | 97 (75.2%) | 32 (24.8%) |
| Bachelor's Degree or higher | 66 (82.5%) | 14 (17.5%) |
Occupancy by Age of Householder in Lake City
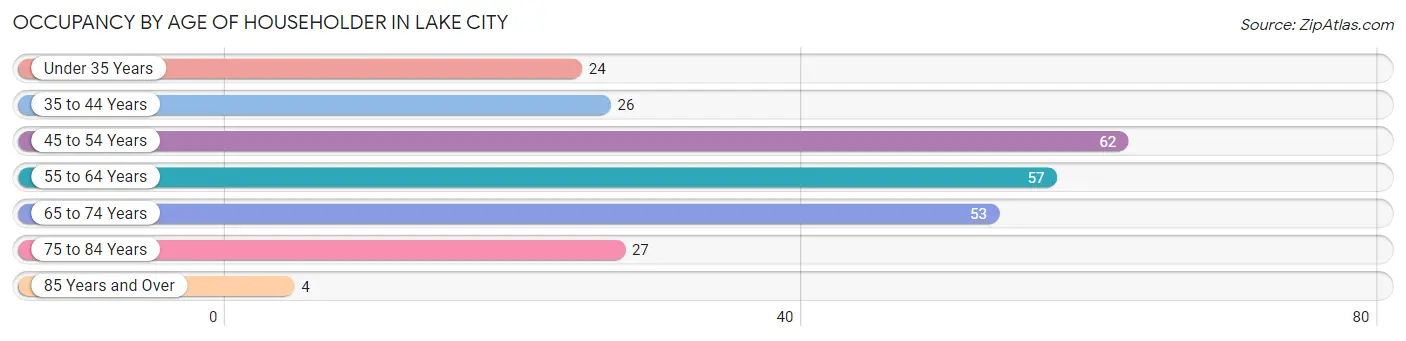
| Age Bracket | # Households | % Households |
| Under 35 Years | 24 | 9.5% |
| 35 to 44 Years | 26 | 10.3% |
| 45 to 54 Years | 62 | 24.5% |
| 55 to 64 Years | 57 | 22.5% |
| 65 to 74 Years | 53 | 20.9% |
| 75 to 84 Years | 27 | 10.7% |
| 85 Years and Over | 4 | 1.6% |
| Total | 253 | 100.0% |
Housing Finances in Lake City
Median Income by Occupancy in Lake City
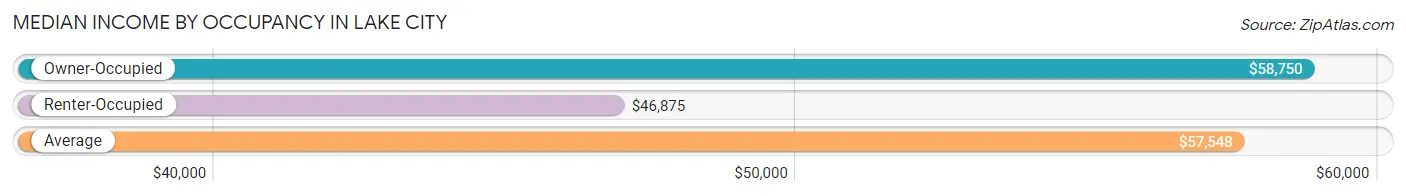
| Occupancy Type | # Households | Median Income |
| Owner-Occupied | 197 (77.9%) | $58,750 |
| Renter-Occupied | 56 (22.1%) | $46,875 |
| Average | 253 (100.0%) | $57,548 |
Occupancy by Householder Income Bracket in Lake City
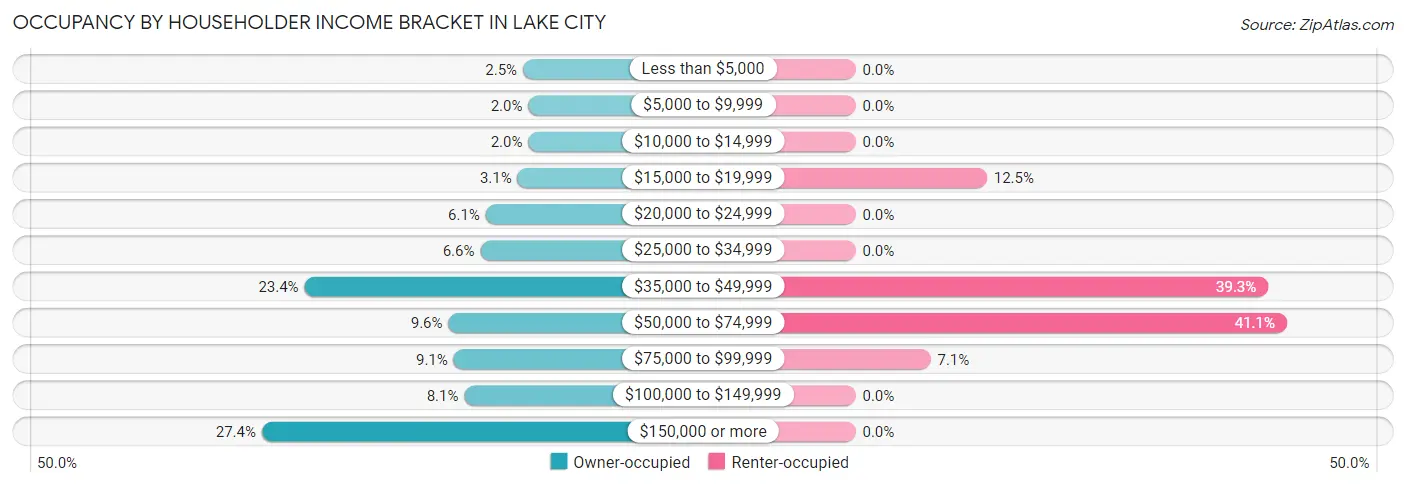
| Income Bracket | Owner-occupied | Renter-occupied |
| Less than $5,000 | 5 (2.5%) | 0 (0.0%) |
| $5,000 to $9,999 | 4 (2.0%) | 0 (0.0%) |
| $10,000 to $14,999 | 4 (2.0%) | 0 (0.0%) |
| $15,000 to $19,999 | 6 (3.0%) | 7 (12.5%) |
| $20,000 to $24,999 | 12 (6.1%) | 0 (0.0%) |
| $25,000 to $34,999 | 13 (6.6%) | 0 (0.0%) |
| $35,000 to $49,999 | 46 (23.4%) | 22 (39.3%) |
| $50,000 to $74,999 | 19 (9.6%) | 23 (41.1%) |
| $75,000 to $99,999 | 18 (9.1%) | 4 (7.1%) |
| $100,000 to $149,999 | 16 (8.1%) | 0 (0.0%) |
| $150,000 or more | 54 (27.4%) | 0 (0.0%) |
| Total | 197 (100.0%) | 56 (100.0%) |
Monthly Housing Cost Tiers in Lake City
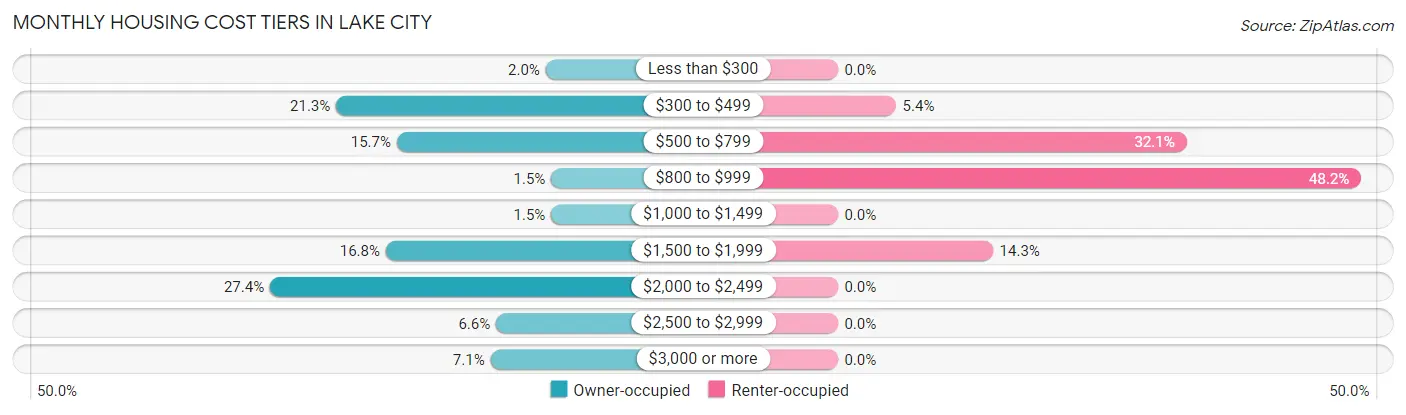
| Monthly Cost | Owner-occupied | Renter-occupied |
| Less than $300 | 4 (2.0%) | 0 (0.0%) |
| $300 to $499 | 42 (21.3%) | 3 (5.4%) |
| $500 to $799 | 31 (15.7%) | 18 (32.1%) |
| $800 to $999 | 3 (1.5%) | 27 (48.2%) |
| $1,000 to $1,499 | 3 (1.5%) | 0 (0.0%) |
| $1,500 to $1,999 | 33 (16.8%) | 8 (14.3%) |
| $2,000 to $2,499 | 54 (27.4%) | 0 (0.0%) |
| $2,500 to $2,999 | 13 (6.6%) | 0 (0.0%) |
| $3,000 or more | 14 (7.1%) | 0 (0.0%) |
| Total | 197 (100.0%) | 56 (100.0%) |
Physical Housing Characteristics in Lake City
Housing Structures in Lake City
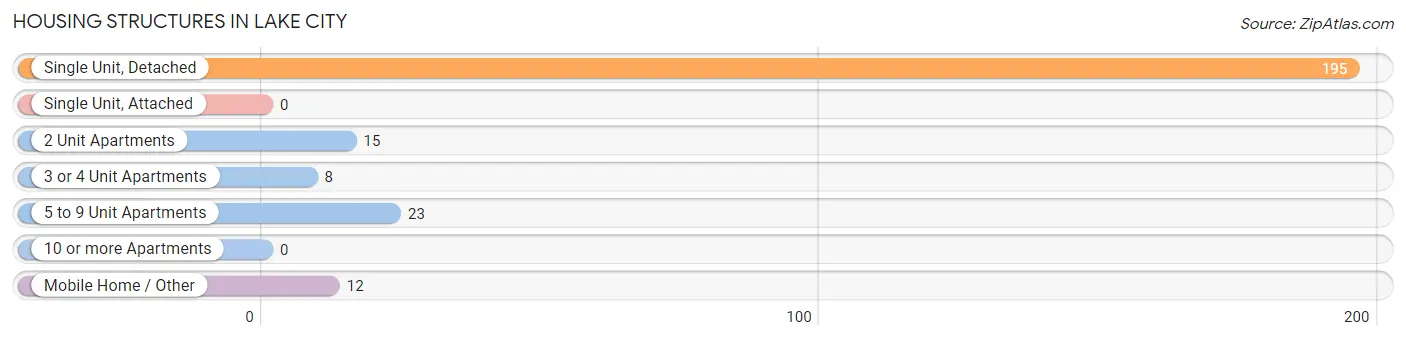
| Structure Type | # Housing Units | % Housing Units |
| Single Unit, Detached | 195 | 77.1% |
| Single Unit, Attached | 0 | 0.0% |
| 2 Unit Apartments | 15 | 5.9% |
| 3 or 4 Unit Apartments | 8 | 3.2% |
| 5 to 9 Unit Apartments | 23 | 9.1% |
| 10 or more Apartments | 0 | 0.0% |
| Mobile Home / Other | 12 | 4.7% |
| Total | 253 | 100.0% |
Housing Structures by Occupancy in Lake City
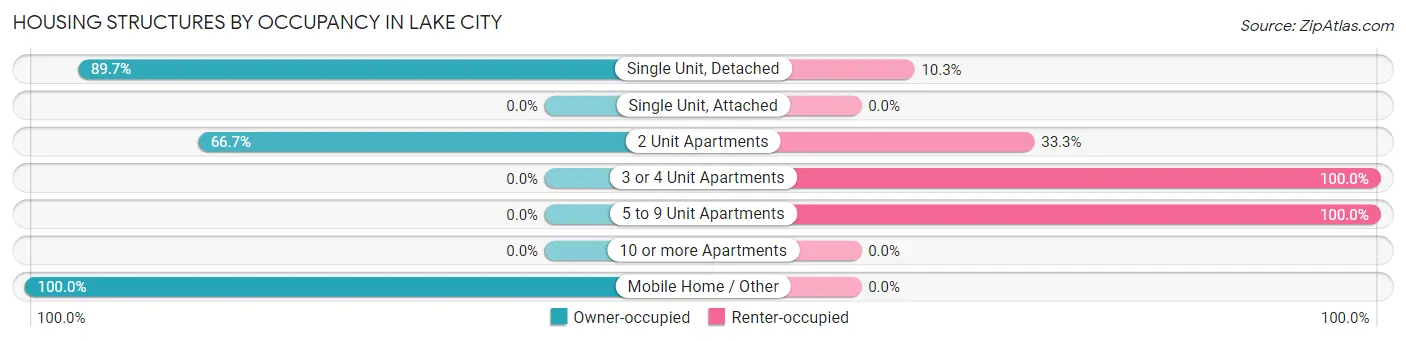
| Structure Type | Owner-occupied | Renter-occupied |
| Single Unit, Detached | 175 (89.7%) | 20 (10.3%) |
| Single Unit, Attached | 0 (0.0%) | 0 (0.0%) |
| 2 Unit Apartments | 10 (66.7%) | 5 (33.3%) |
| 3 or 4 Unit Apartments | 0 (0.0%) | 8 (100.0%) |
| 5 to 9 Unit Apartments | 0 (0.0%) | 23 (100.0%) |
| 10 or more Apartments | 0 (0.0%) | 0 (0.0%) |
| Mobile Home / Other | 12 (100.0%) | 0 (0.0%) |
| Total | 197 (77.9%) | 56 (22.1%) |
Housing Structures by Number of Rooms in Lake City
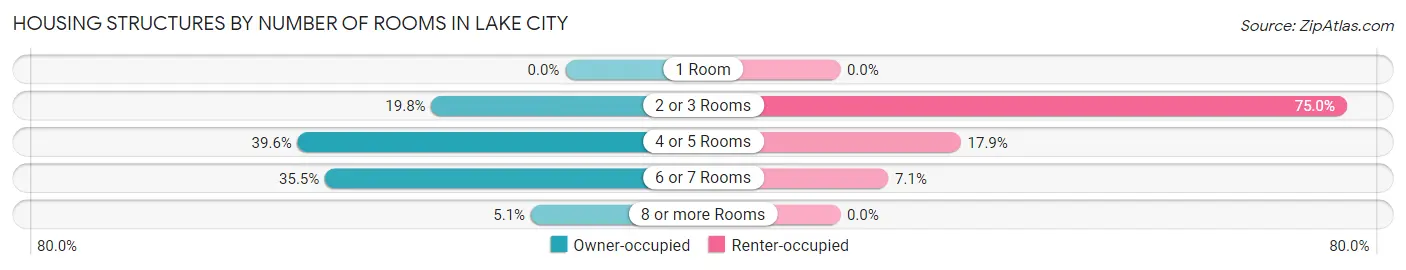
| Number of Rooms | Owner-occupied | Renter-occupied |
| 1 Room | 0 (0.0%) | 0 (0.0%) |
| 2 or 3 Rooms | 39 (19.8%) | 42 (75.0%) |
| 4 or 5 Rooms | 78 (39.6%) | 10 (17.9%) |
| 6 or 7 Rooms | 70 (35.5%) | 4 (7.1%) |
| 8 or more Rooms | 10 (5.1%) | 0 (0.0%) |
| Total | 197 (100.0%) | 56 (100.0%) |
Housing Structure by Heating Type in Lake City
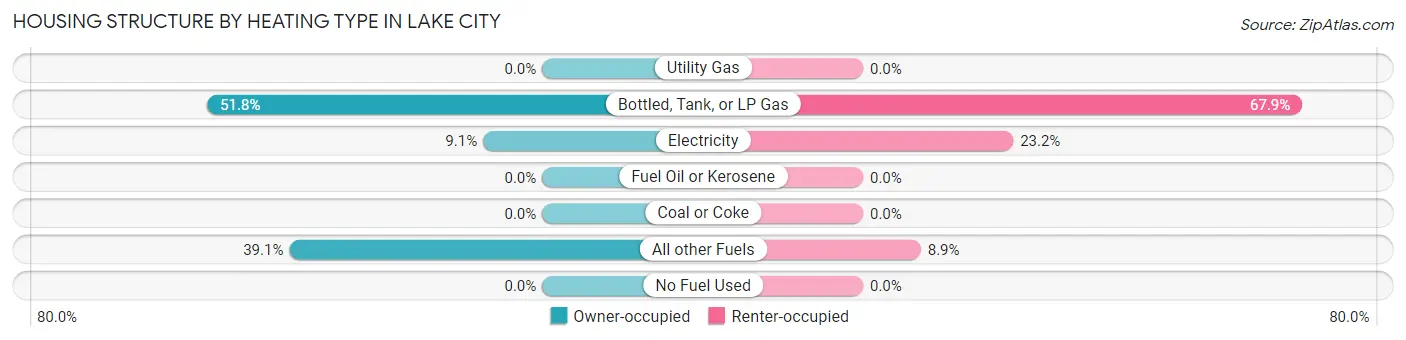
| Heating Type | Owner-occupied | Renter-occupied |
| Utility Gas | 0 (0.0%) | 0 (0.0%) |
| Bottled, Tank, or LP Gas | 102 (51.8%) | 38 (67.9%) |
| Electricity | 18 (9.1%) | 13 (23.2%) |
| Fuel Oil or Kerosene | 0 (0.0%) | 0 (0.0%) |
| Coal or Coke | 0 (0.0%) | 0 (0.0%) |
| All other Fuels | 77 (39.1%) | 5 (8.9%) |
| No Fuel Used | 0 (0.0%) | 0 (0.0%) |
| Total | 197 (100.0%) | 56 (100.0%) |
Household Vehicle Usage in Lake City
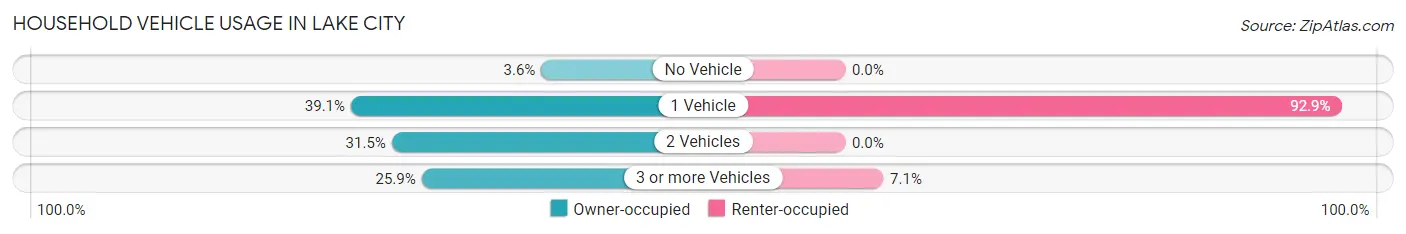
| Vehicles per Household | Owner-occupied | Renter-occupied |
| No Vehicle | 7 (3.5%) | 0 (0.0%) |
| 1 Vehicle | 77 (39.1%) | 52 (92.9%) |
| 2 Vehicles | 62 (31.5%) | 0 (0.0%) |
| 3 or more Vehicles | 51 (25.9%) | 4 (7.1%) |
| Total | 197 (100.0%) | 56 (100.0%) |
Real Estate & Mortgages in Lake City
Real Estate and Mortgage Overview in Lake City
| Characteristic | Without Mortgage | With Mortgage |
| Housing Units | 83 | 114 |
| Median Property Value | $289,300 | $366,700 |
| Median Household Income | - | - |
| Monthly Housing Costs | $485 | $14 |
| Real Estate Taxes | $1,185 | $0 |
Property Value by Mortgage Status in Lake City
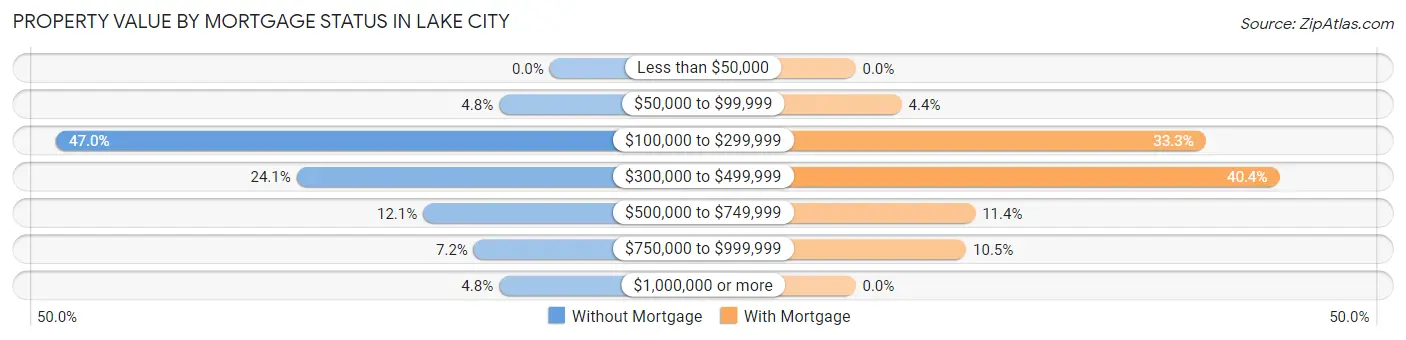
| Property Value | Without Mortgage | With Mortgage |
| Less than $50,000 | 0 (0.0%) | 0 (0.0%) |
| $50,000 to $99,999 | 4 (4.8%) | 5 (4.4%) |
| $100,000 to $299,999 | 39 (47.0%) | 38 (33.3%) |
| $300,000 to $499,999 | 20 (24.1%) | 46 (40.4%) |
| $500,000 to $749,999 | 10 (12.0%) | 13 (11.4%) |
| $750,000 to $999,999 | 6 (7.2%) | 12 (10.5%) |
| $1,000,000 or more | 4 (4.8%) | 0 (0.0%) |
| Total | 83 (100.0%) | 114 (100.0%) |
Household Income by Mortgage Status in Lake City
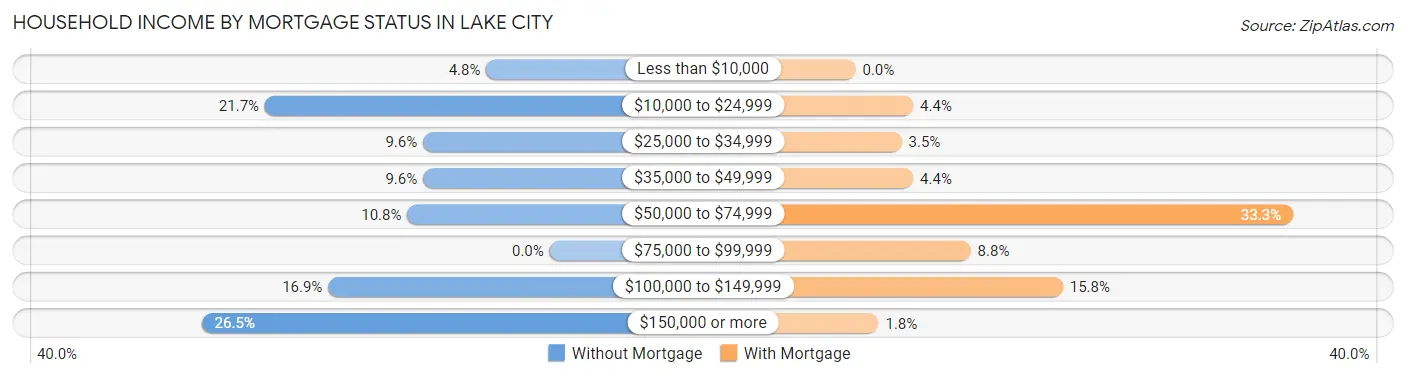
| Household Income | Without Mortgage | With Mortgage |
| Less than $10,000 | 4 (4.8%) | 0 (0.0%) |
| $10,000 to $24,999 | 18 (21.7%) | 5 (4.4%) |
| $25,000 to $34,999 | 8 (9.6%) | 4 (3.5%) |
| $35,000 to $49,999 | 8 (9.6%) | 5 (4.4%) |
| $50,000 to $74,999 | 9 (10.8%) | 38 (33.3%) |
| $75,000 to $99,999 | 0 (0.0%) | 10 (8.8%) |
| $100,000 to $149,999 | 14 (16.9%) | 18 (15.8%) |
| $150,000 or more | 22 (26.5%) | 2 (1.8%) |
| Total | 83 (100.0%) | 114 (100.0%) |
Property Value to Household Income Ratio in Lake City
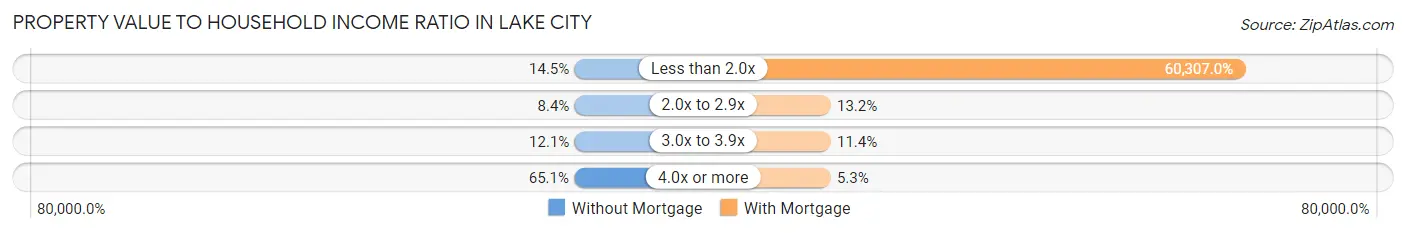
| Value-to-Income Ratio | Without Mortgage | With Mortgage |
| Less than 2.0x | 12 (14.5%) | 68,750 (60,307.0%) |
| 2.0x to 2.9x | 7 (8.4%) | 15 (13.2%) |
| 3.0x to 3.9x | 10 (12.0%) | 13 (11.4%) |
| 4.0x or more | 54 (65.1%) | 6 (5.3%) |
| Total | 83 (100.0%) | 114 (100.0%) |
Real Estate Taxes by Mortgage Status in Lake City
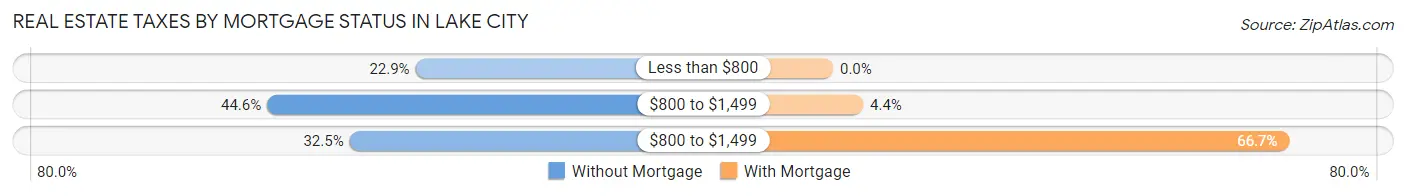
| Property Taxes | Without Mortgage | With Mortgage |
| Less than $800 | 19 (22.9%) | 0 (0.0%) |
| $800 to $1,499 | 37 (44.6%) | 5 (4.4%) |
| $800 to $1,499 | 27 (32.5%) | 76 (66.7%) |
| Total | 83 (100.0%) | 114 (100.0%) |
Health & Disability in Lake City
Health Insurance Coverage by Age in Lake City
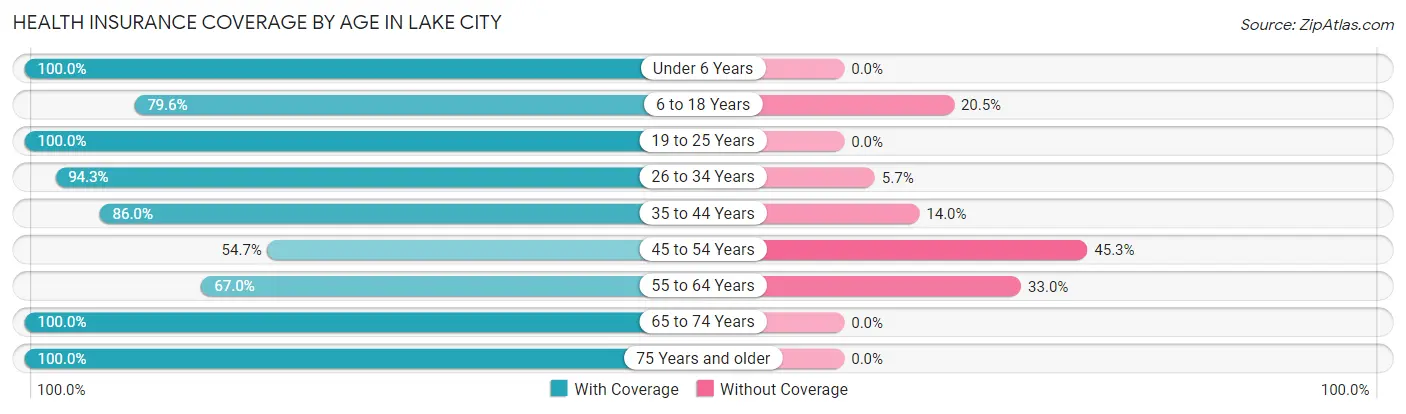
| Age Bracket | With Coverage | Without Coverage |
| Under 6 Years | 28 (100.0%) | 0 (0.0%) |
| 6 to 18 Years | 35 (79.5%) | 9 (20.4%) |
| 19 to 25 Years | 4 (100.0%) | 0 (0.0%) |
| 26 to 34 Years | 33 (94.3%) | 2 (5.7%) |
| 35 to 44 Years | 43 (86.0%) | 7 (14.0%) |
| 45 to 54 Years | 41 (54.7%) | 34 (45.3%) |
| 55 to 64 Years | 63 (67.0%) | 31 (33.0%) |
| 65 to 74 Years | 97 (100.0%) | 0 (0.0%) |
| 75 Years and older | 38 (100.0%) | 0 (0.0%) |
| Total | 382 (82.2%) | 83 (17.8%) |
Health Insurance Coverage by Citizenship Status in Lake City
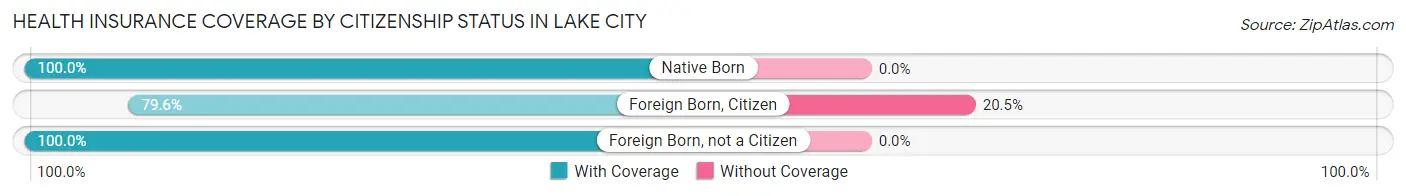
| Citizenship Status | With Coverage | Without Coverage |
| Native Born | 28 (100.0%) | 0 (0.0%) |
| Foreign Born, Citizen | 35 (79.5%) | 9 (20.4%) |
| Foreign Born, not a Citizen | 4 (100.0%) | 0 (0.0%) |
Health Insurance Coverage by Household Income in Lake City
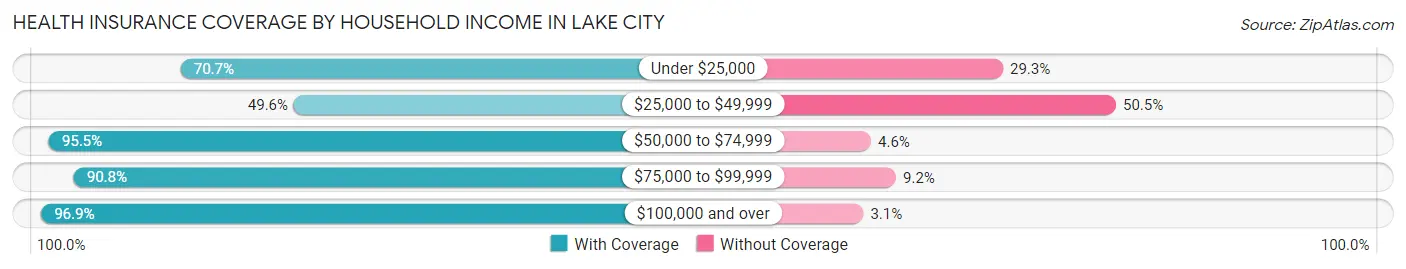
| Household Income | With Coverage | Without Coverage |
| Under $25,000 | 29 (70.7%) | 12 (29.3%) |
| $25,000 to $49,999 | 55 (49.5%) | 56 (50.4%) |
| $50,000 to $74,999 | 84 (95.5%) | 4 (4.5%) |
| $75,000 to $99,999 | 59 (90.8%) | 6 (9.2%) |
| $100,000 and over | 155 (96.9%) | 5 (3.1%) |
Public vs Private Health Insurance Coverage by Age in Lake City
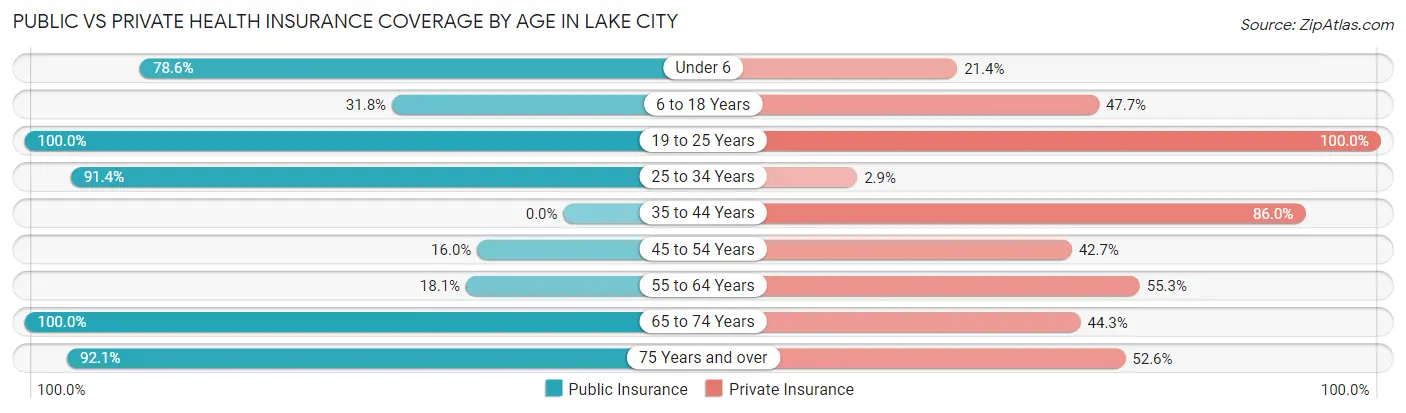
| Age Bracket | Public Insurance | Private Insurance |
| Under 6 | 22 (78.6%) | 6 (21.4%) |
| 6 to 18 Years | 14 (31.8%) | 21 (47.7%) |
| 19 to 25 Years | 4 (100.0%) | 4 (100.0%) |
| 25 to 34 Years | 32 (91.4%) | 1 (2.9%) |
| 35 to 44 Years | 0 (0.0%) | 43 (86.0%) |
| 45 to 54 Years | 12 (16.0%) | 32 (42.7%) |
| 55 to 64 Years | 17 (18.1%) | 52 (55.3%) |
| 65 to 74 Years | 97 (100.0%) | 43 (44.3%) |
| 75 Years and over | 35 (92.1%) | 20 (52.6%) |
| Total | 233 (50.1%) | 222 (47.7%) |
Disability Status by Sex by Age in Lake City
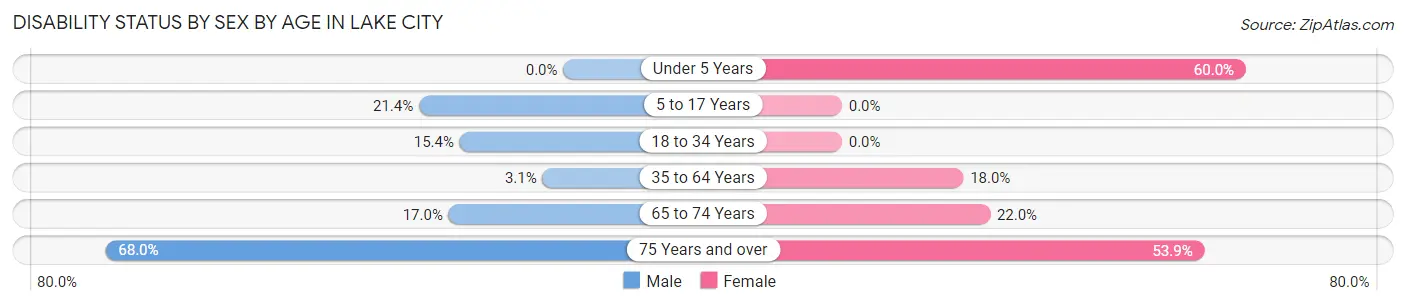
| Age Bracket | Male | Female |
| Under 5 Years | 0 (0.0%) | 6 (60.0%) |
| 5 to 17 Years | 6 (21.4%) | 0 (0.0%) |
| 18 to 34 Years | 4 (15.4%) | 0 (0.0%) |
| 35 to 64 Years | 3 (3.1%) | 22 (18.0%) |
| 65 to 74 Years | 8 (17.0%) | 11 (22.0%) |
| 75 Years and over | 17 (68.0%) | 7 (53.8%) |
Disability Class by Sex by Age in Lake City
Disability Class: Hearing Difficulty
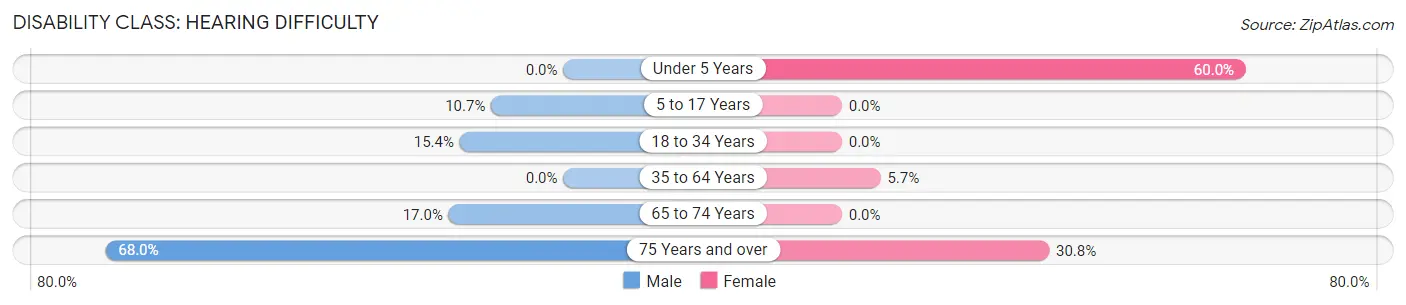
| Age Bracket | Male | Female |
| Under 5 Years | 0 (0.0%) | 6 (60.0%) |
| 5 to 17 Years | 3 (10.7%) | 0 (0.0%) |
| 18 to 34 Years | 4 (15.4%) | 0 (0.0%) |
| 35 to 64 Years | 0 (0.0%) | 7 (5.7%) |
| 65 to 74 Years | 8 (17.0%) | 0 (0.0%) |
| 75 Years and over | 17 (68.0%) | 4 (30.8%) |
Disability Class: Vision Difficulty
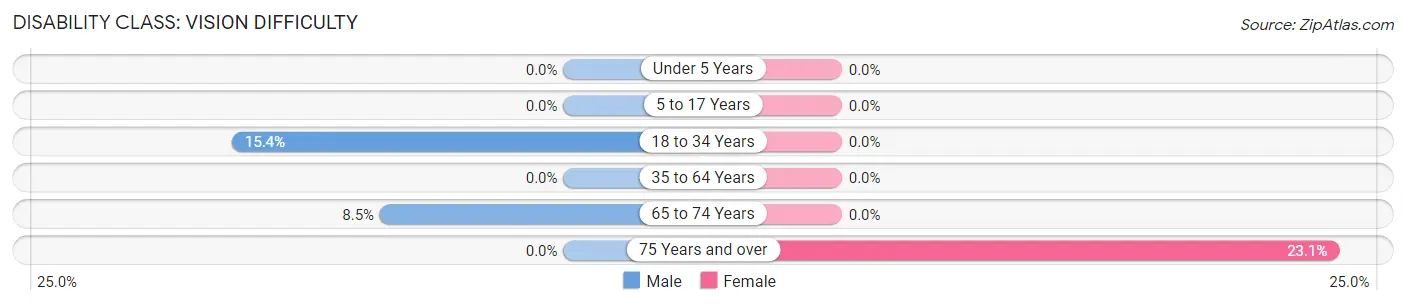
| Age Bracket | Male | Female |
| Under 5 Years | 0 (0.0%) | 0 (0.0%) |
| 5 to 17 Years | 0 (0.0%) | 0 (0.0%) |
| 18 to 34 Years | 4 (15.4%) | 0 (0.0%) |
| 35 to 64 Years | 0 (0.0%) | 0 (0.0%) |
| 65 to 74 Years | 4 (8.5%) | 0 (0.0%) |
| 75 Years and over | 0 (0.0%) | 3 (23.1%) |
Disability Class: Cognitive Difficulty
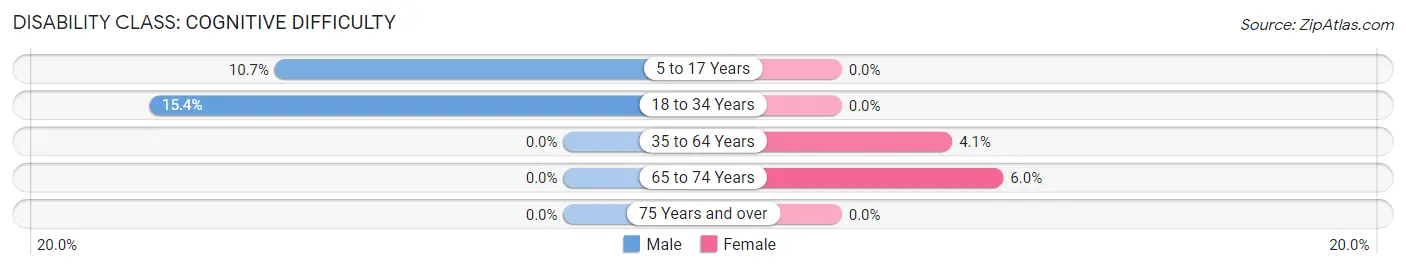
| Age Bracket | Male | Female |
| 5 to 17 Years | 3 (10.7%) | 0 (0.0%) |
| 18 to 34 Years | 4 (15.4%) | 0 (0.0%) |
| 35 to 64 Years | 0 (0.0%) | 5 (4.1%) |
| 65 to 74 Years | 0 (0.0%) | 3 (6.0%) |
| 75 Years and over | 0 (0.0%) | 0 (0.0%) |
Disability Class: Ambulatory Difficulty
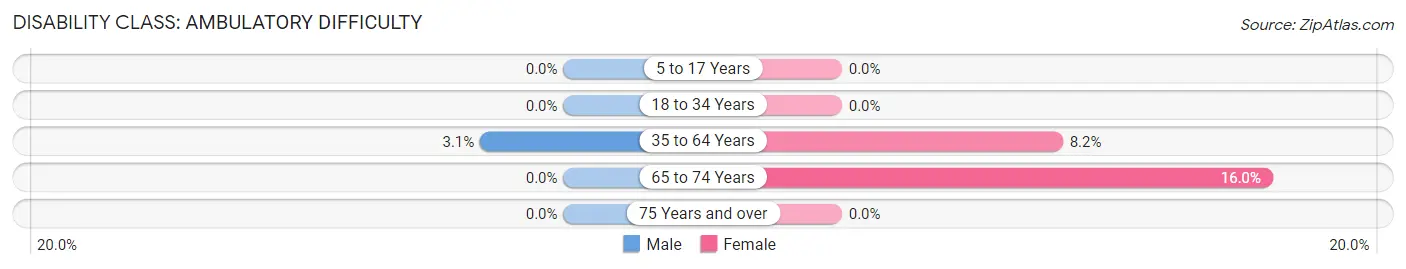
| Age Bracket | Male | Female |
| 5 to 17 Years | 0 (0.0%) | 0 (0.0%) |
| 18 to 34 Years | 0 (0.0%) | 0 (0.0%) |
| 35 to 64 Years | 3 (3.1%) | 10 (8.2%) |
| 65 to 74 Years | 0 (0.0%) | 8 (16.0%) |
| 75 Years and over | 0 (0.0%) | 0 (0.0%) |
Disability Class: Self-Care Difficulty
| Age Bracket | Male | Female |
| 5 to 17 Years | 0 (0.0%) | 0 (0.0%) |
| 18 to 34 Years | 0 (0.0%) | 0 (0.0%) |
| 35 to 64 Years | 3 (3.1%) | 0 (0.0%) |
| 65 to 74 Years | 0 (0.0%) | 0 (0.0%) |
| 75 Years and over | 0 (0.0%) | 0 (0.0%) |
Technology Access in Lake City
Computing Device Access in Lake City
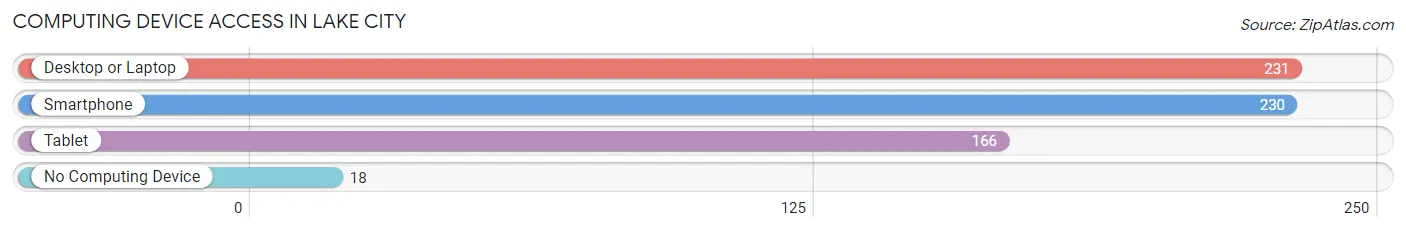
| Device Type | # Households | % Households |
| Desktop or Laptop | 231 | 91.3% |
| Smartphone | 230 | 90.9% |
| Tablet | 166 | 65.6% |
| No Computing Device | 18 | 7.1% |
| Total | 253 | 100.0% |
Internet Access in Lake City
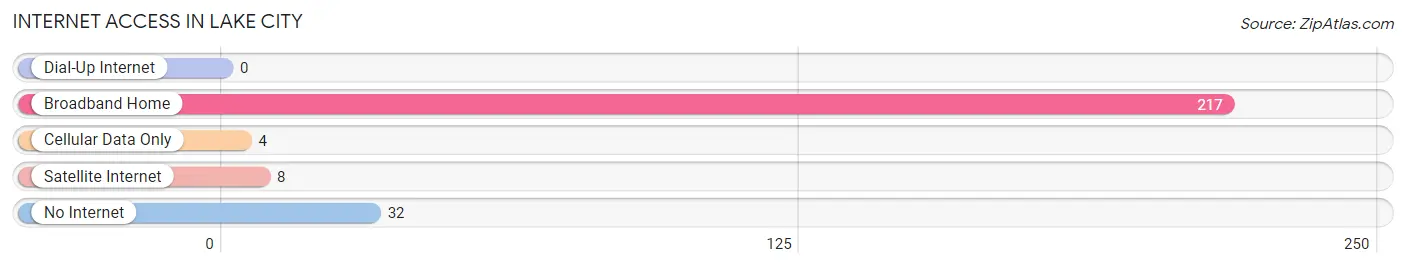
| Internet Type | # Households | % Households |
| Dial-Up Internet | 0 | 0.0% |
| Broadband Home | 217 | 85.8% |
| Cellular Data Only | 4 | 1.6% |
| Satellite Internet | 8 | 3.2% |
| No Internet | 32 | 12.7% |
| Total | 253 | 100.0% |
Lake City Summary
City of Lake City Colorado
Lake City, Colorado is a small town located in Hinsdale County in the San Juan Mountains of southwestern Colorado. It is the county seat of Hinsdale County and is the only incorporated municipality in the county. The town is situated at an elevation of 8,743 feet and is surrounded by the Uncompahgre National Forest. The population of Lake City was estimated to be 431 in 2019.
History
The area around Lake City was first settled in the late 1860s by prospectors and miners looking for gold and silver. The town was officially founded in 1874 and was named after nearby Lake San Cristobal. The town quickly grew and by 1880, it had a population of over 1,000 people.
In the late 1800s, Lake City was a bustling mining town with several saloons, hotels, and stores. The town was also home to several newspapers, including the Lake City Miner and the Lake City Times.
In the early 1900s, the mining industry began to decline and the population of Lake City began to decrease. The town was nearly abandoned by the 1930s.
In the 1950s, the town began to experience a resurgence as a tourist destination. The town was featured in several movies and television shows, including the 1960s television series, The High Chaparral.
Geography
Lake City is located in the San Juan Mountains of southwestern Colorado. The town is situated at an elevation of 8,743 feet and is surrounded by the Uncompahgre National Forest. The town is located on the western side of the San Juan Mountains and is approximately 25 miles from the Continental Divide.
The town is located on the Lake Fork of the Gunnison River and is surrounded by several mountain peaks, including Uncompahgre Peak, which is the highest peak in the San Juan Mountains.
The town is located approximately 30 miles from the nearest major city Montrose Colorado
Economy
The economy of Lake City is largely based on tourism. The town is a popular destination for outdoor recreation, including camping, fishing, hiking, and skiing. The town is also home to several restaurants, shops, and lodging establishments.
The town is also home to several mining operations, including the Lake City Mining Company, which is the largest employer in the town.
Demographics
The population of Lake City was estimated to be 431 in 2019. The town is predominantly white, with approximately 95% of the population identifying as white. The median household income in the town is $41,250 and the median home value is $220,000.
The town is served by the Lake City School District, which includes one elementary school, one middle school, and one high school. The town is also home to several churches, including the First Presbyterian Church and the Church of Jesus Christ of Latter-day Saints.
Common Questions
What is Per Capita Income in Lake City?
Per Capita income in Lake City is $46,390.
What is the Median Family Income in Lake City?
Median Family Income in Lake City is $63,750.
What is the Median Household income in Lake City?
Median Household Income in Lake City is $57,548.
What is Inequality or Gini Index in Lake City?
Inequality or Gini Index in Lake City is 0.44.
What is the Total Population of Lake City?
Total Population of Lake City is 465.
What is the Total Male Population of Lake City?
Total Male Population of Lake City is 223.
What is the Total Female Population of Lake City?
Total Female Population of Lake City is 242.
What is the Ratio of Males per 100 Females in Lake City?
There are 92.15 Males per 100 Females in Lake City.
What is the Ratio of Females per 100 Males in Lake City?
There are 108.52 Females per 100 Males in Lake City.
What is the Median Population Age in Lake City?
Median Population Age in Lake City is 54.9 Years.
What is the Average Family Size in Lake City
Average Family Size in Lake City is 2.2 People.
What is the Average Household Size in Lake City
Average Household Size in Lake City is 1.8 People.
How Large is the Labor Force in Lake City?
There are 216 People in the Labor Forcein in Lake City.
What is the Percentage of People in the Labor Force in Lake City?
52.2% of People are in the Labor Force in Lake City.
What is the Unemployment Rate in Lake City?
Unemployment Rate in Lake City is 1.4%.