Durham, OR Map & Demographics
Durham Map
Durham Overview
$57,950
PER CAPITA INCOME
$104,464
AVG FAMILY INCOME
$98,839
AVG HOUSEHOLD INCOME
35.5%
WAGE / INCOME GAP [ % ]
64.5¢/ $1
WAGE / INCOME GAP [ $ ]
0.47
INEQUALITY / GINI INDEX
1,860
TOTAL POPULATION
948
MALE POPULATION
912
FEMALE POPULATION
103.95
MALES / 100 FEMALES
96.20
FEMALES / 100 MALES
42.7
MEDIAN AGE
2.6
AVG FAMILY SIZE
2.2
AVG HOUSEHOLD SIZE
998
LABOR FORCE [ PEOPLE ]
64.5%
PERCENT IN LABOR FORCE
3.2%
UNEMPLOYMENT RATE
Income in Durham
Income Overview in Durham
Per Capita Income in Durham is $57,950, while median incomes of families and households are $104,464 and $98,839 respectively.
| Characteristic | Number | Measure |
| Per Capita Income | 1,860 | $57,950 |
| Median Family Income | 561 | $104,464 |
| Mean Family Income | 561 | $139,308 |
| Median Household Income | 851 | $98,839 |
| Mean Household Income | 851 | $125,557 |
| Income Deficit | 561 | $0 |
| Wage / Income Gap (%) | 1,860 | 35.51% |
| Wage / Income Gap ($) | 1,860 | 64.49¢ per $1 |
| Gini / Inequality Index | 1,860 | 0.47 |
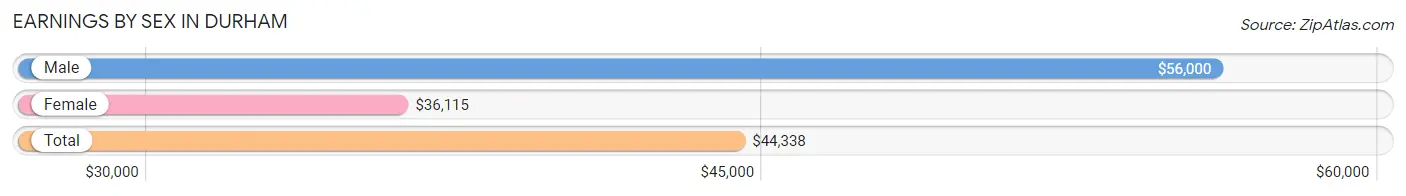
Earnings by Sex in Durham
Average Earnings in Durham are $44,338, $56,000 for men and $36,115 for women, a difference of 35.5%.
| Sex | Number | Average Earnings |
| Male | 574 (52.5%) | $56,000 |
| Female | 519 (47.5%) | $36,115 |
| Total | 1,093 (100.0%) | $44,338 |
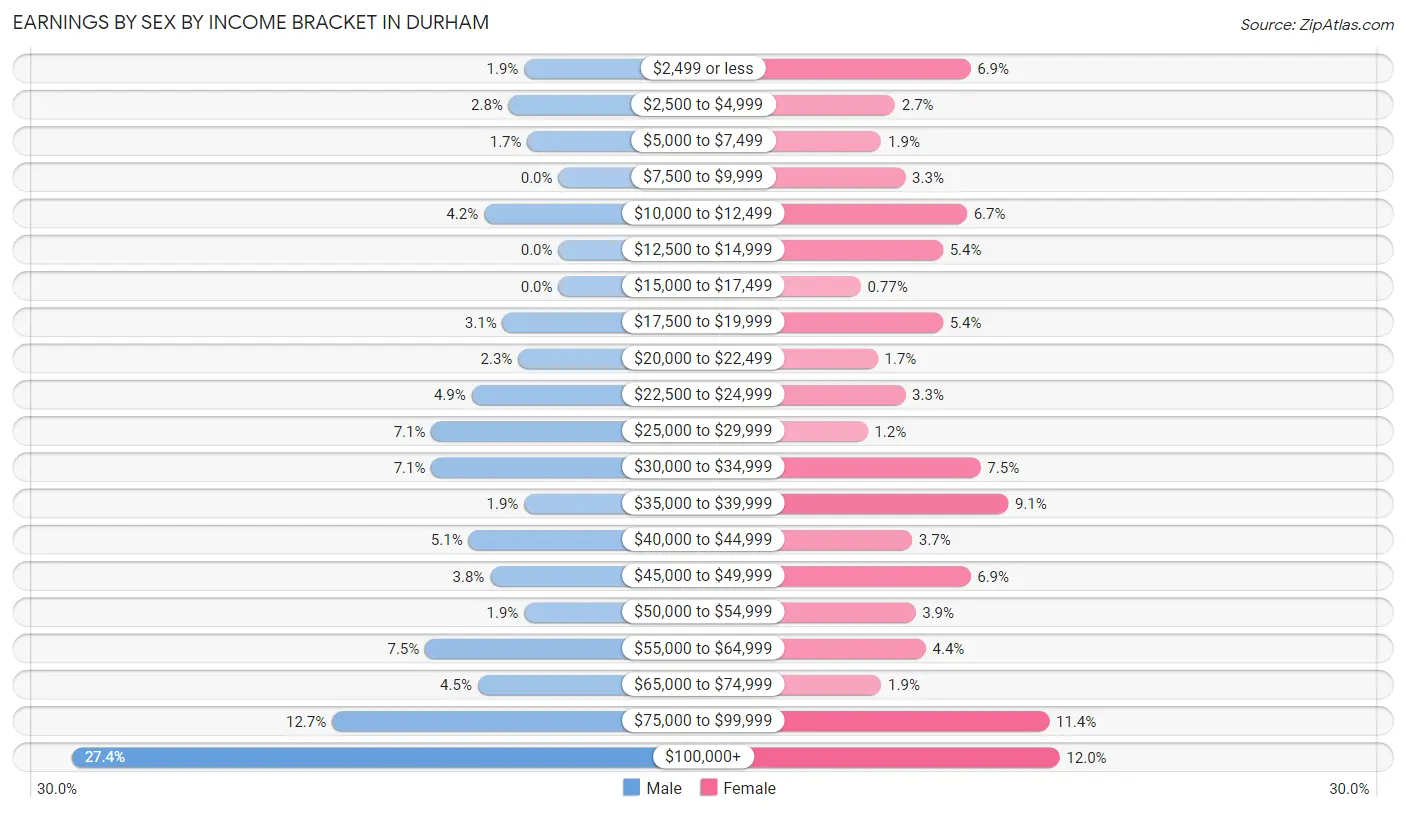
Earnings by Sex by Income Bracket in Durham
The most common earnings brackets in Durham are $100,000+ for men (157 | 27.4%) and $100,000+ for women (62 | 11.9%).
| Income | Male | Female |
| $2,499 or less | 11 (1.9%) | 36 (6.9%) |
| $2,500 to $4,999 | 16 (2.8%) | 14 (2.7%) |
| $5,000 to $7,499 | 10 (1.7%) | 10 (1.9%) |
| $7,500 to $9,999 | 0 (0.0%) | 17 (3.3%) |
| $10,000 to $12,499 | 24 (4.2%) | 35 (6.7%) |
| $12,500 to $14,999 | 0 (0.0%) | 28 (5.4%) |
| $15,000 to $17,499 | 0 (0.0%) | 4 (0.8%) |
| $17,500 to $19,999 | 18 (3.1%) | 28 (5.4%) |
| $20,000 to $22,499 | 13 (2.3%) | 9 (1.7%) |
| $22,500 to $24,999 | 28 (4.9%) | 17 (3.3%) |
| $25,000 to $29,999 | 41 (7.1%) | 6 (1.2%) |
| $30,000 to $34,999 | 41 (7.1%) | 39 (7.5%) |
| $35,000 to $39,999 | 11 (1.9%) | 47 (9.1%) |
| $40,000 to $44,999 | 29 (5.1%) | 19 (3.7%) |
| $45,000 to $49,999 | 22 (3.8%) | 36 (6.9%) |
| $50,000 to $54,999 | 11 (1.9%) | 20 (3.8%) |
| $55,000 to $64,999 | 43 (7.5%) | 23 (4.4%) |
| $65,000 to $74,999 | 26 (4.5%) | 10 (1.9%) |
| $75,000 to $99,999 | 73 (12.7%) | 59 (11.4%) |
| $100,000+ | 157 (27.4%) | 62 (11.9%) |
| Total | 574 (100.0%) | 519 (100.0%) |
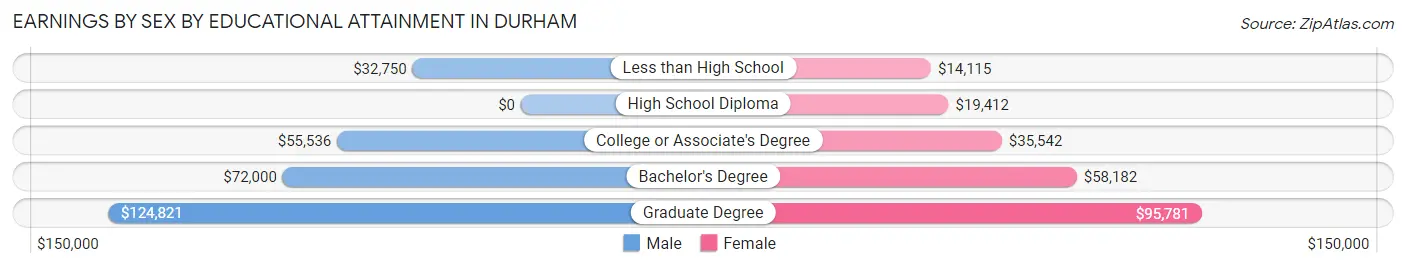
Earnings by Sex by Educational Attainment in Durham
Average earnings in Durham are $64,583 for men and $37,466 for women, a difference of 42.0%. Men with an educational attainment of graduate degree enjoy the highest average annual earnings of $124,821, while those with less than high school education earn the least with $32,750. Women with an educational attainment of graduate degree earn the most with the average annual earnings of $95,781, while those with less than high school education have the smallest earnings of $14,115.
| Educational Attainment | Male Income | Female Income |
| Less than High School | $32,750 | $14,115 |
| High School Diploma | - | - |
| College or Associate's Degree | $55,536 | $35,542 |
| Bachelor's Degree | $72,000 | $58,182 |
| Graduate Degree | $124,821 | $95,781 |
| Total | $64,583 | $37,466 |
Family Income in Durham
Family Income Brackets in Durham
According to the Durham family income data, there are 125 families falling into the $100,000 to $149,999 income range, which is the most common income bracket and makes up 22.3% of all families. Conversely, the $10,000 to $14,999 income bracket is the least frequent group with only 3 families (0.5%) belonging to this category.
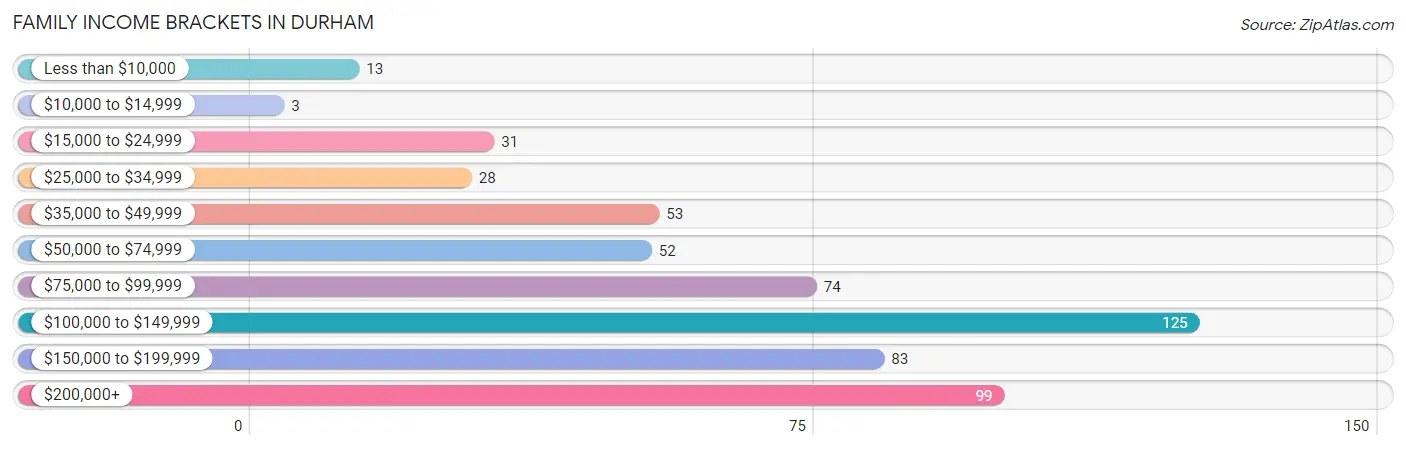
| Income Bracket | # Families | % Families |
| Less than $10,000 | 13 | 2.3% |
| $10,000 to $14,999 | 3 | 0.5% |
| $15,000 to $24,999 | 31 | 5.5% |
| $25,000 to $34,999 | 28 | 5.0% |
| $35,000 to $49,999 | 53 | 9.4% |
| $50,000 to $74,999 | 52 | 9.3% |
| $75,000 to $99,999 | 74 | 13.2% |
| $100,000 to $149,999 | 125 | 22.3% |
| $150,000 to $199,999 | 83 | 14.8% |
| $200,000+ | 99 | 17.6% |
Family Income by Famaliy Size in Durham
3-person families (83 | 14.8%) account for the highest median family income in Durham with $127,917 per family, while 2-person families (372 | 66.3%) have the highest median income of $62,578 per family member.
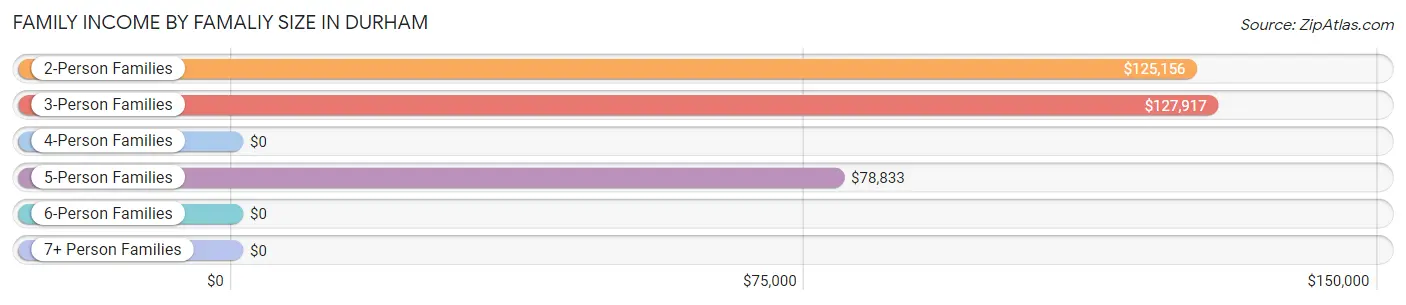
| Income Bracket | # Families | Median Income |
| 2-Person Families | 372 (66.3%) | $125,156 |
| 3-Person Families | 83 (14.8%) | $127,917 |
| 4-Person Families | 57 (10.2%) | $0 |
| 5-Person Families | 32 (5.7%) | $78,833 |
| 6-Person Families | 17 (3.0%) | $0 |
| 7+ Person Families | 0 (0.0%) | $0 |
| Total | 561 (100.0%) | $104,464 |
Family Income by Number of Earners in Durham
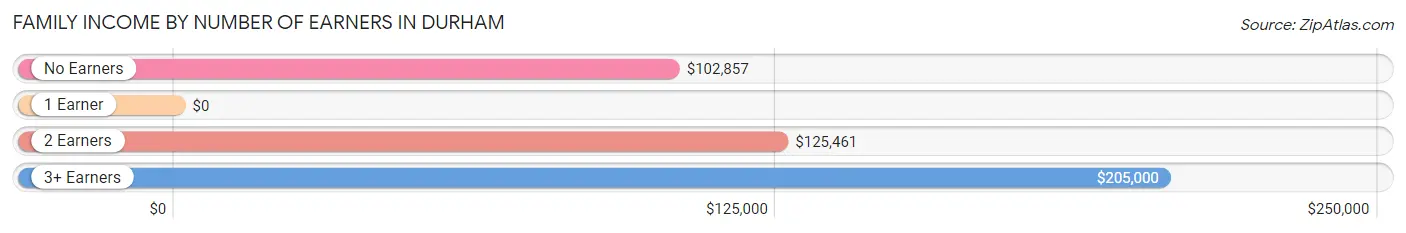
| Number of Earners | # Families | Median Income |
| No Earners | 92 (16.4%) | $102,857 |
| 1 Earner | 156 (27.8%) | $0 |
| 2 Earners | 295 (52.6%) | $125,461 |
| 3+ Earners | 18 (3.2%) | $205,000 |
| Total | 561 (100.0%) | $104,464 |
Household Income in Durham
Household Income Brackets in Durham
With 206 households falling in the category, the $100,000 to $149,999 income range is the most frequent in Durham, accounting for 24.2% of all households. In contrast, only 16 households (1.9%) fall into the less than $10,000 income bracket, making it the least populous group.
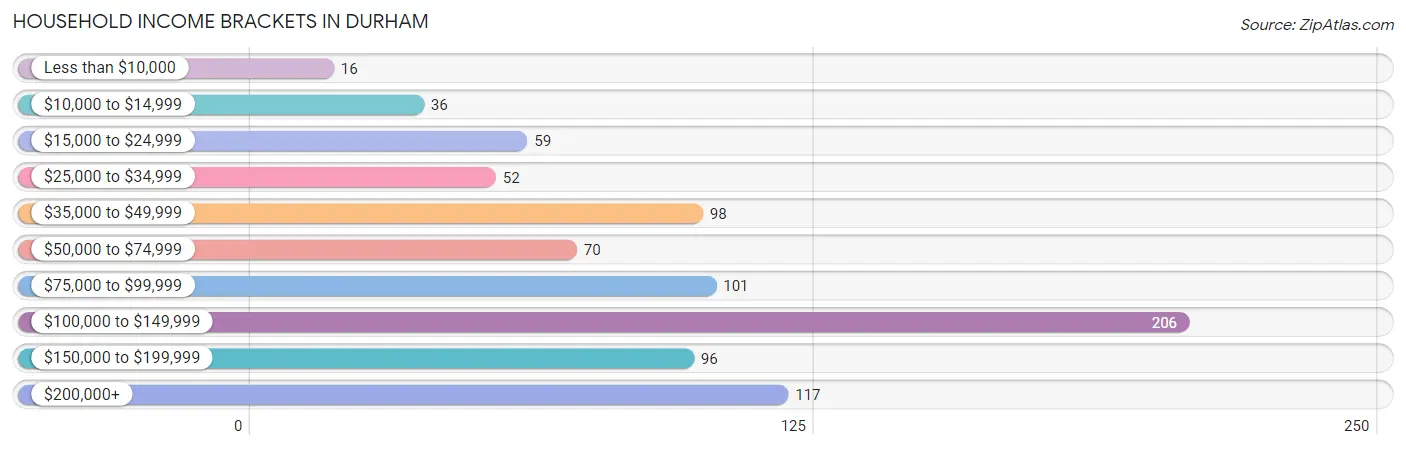
| Income Bracket | # Households | % Households |
| Less than $10,000 | 16 | 1.9% |
| $10,000 to $14,999 | 36 | 4.2% |
| $15,000 to $24,999 | 59 | 6.9% |
| $25,000 to $34,999 | 52 | 6.1% |
| $35,000 to $49,999 | 98 | 11.5% |
| $50,000 to $74,999 | 70 | 8.2% |
| $75,000 to $99,999 | 101 | 11.9% |
| $100,000 to $149,999 | 206 | 24.2% |
| $150,000 to $199,999 | 96 | 11.3% |
| $200,000+ | 117 | 13.7% |
Household Income by Householder Age in Durham
The median household income in Durham is $98,839, with the highest median household income of $127,250 found in the 45 to 64 years age bracket for the primary householder. A total of 357 households (41.9%) fall into this category. Meanwhile, the 15 to 24 years age bracket for the primary householder has the lowest median household income of $49,583, with 25 households (2.9%) in this group.
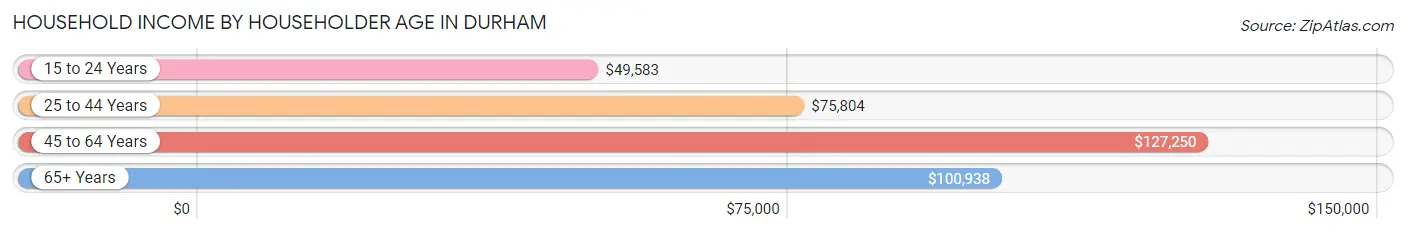
| Income Bracket | # Households | Median Income |
| 15 to 24 Years | 25 (2.9%) | $49,583 |
| 25 to 44 Years | 288 (33.8%) | $75,804 |
| 45 to 64 Years | 357 (41.9%) | $127,250 |
| 65+ Years | 181 (21.3%) | $100,938 |
| Total | 851 (100.0%) | $98,839 |
Poverty in Durham
Income Below Poverty by Sex and Age in Durham
With 8.4% poverty level for males and 9.3% for females among the residents of Durham, 5 year old males and 12 to 14 year old females are the most vulnerable to poverty, with 3 males (100.0%) and 12 females (32.4%) in their respective age groups living below the poverty level.
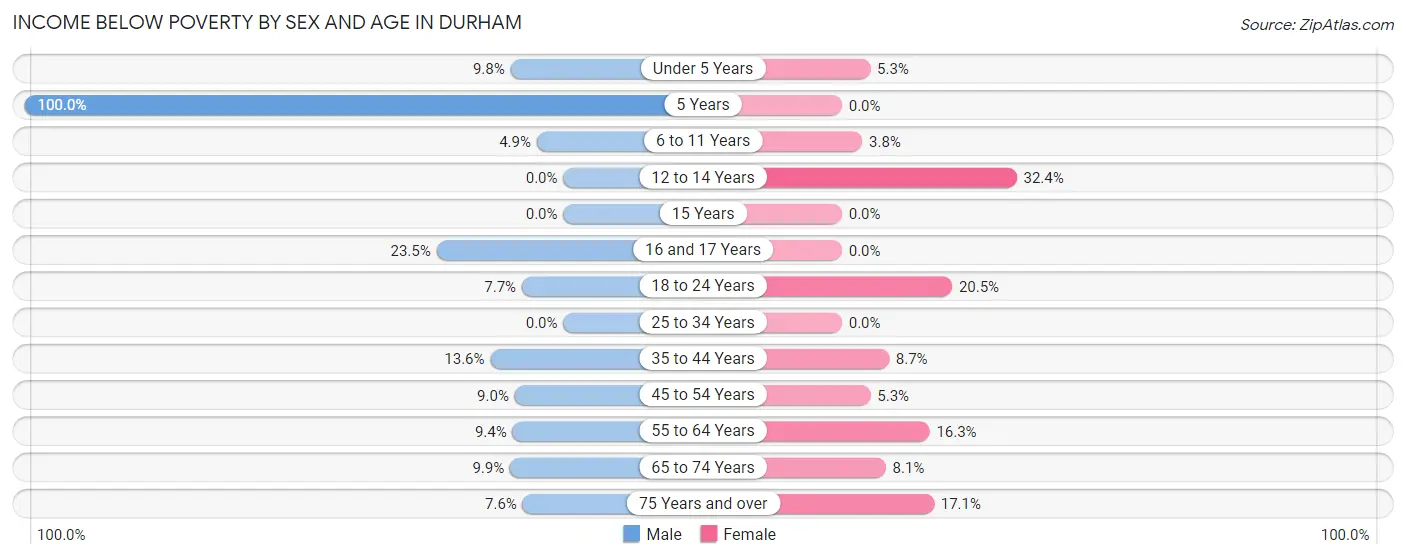
| Age Bracket | Male | Female |
| Under 5 Years | 5 (9.8%) | 2 (5.3%) |
| 5 Years | 3 (100.0%) | 0 (0.0%) |
| 6 to 11 Years | 3 (4.9%) | 2 (3.8%) |
| 12 to 14 Years | 0 (0.0%) | 12 (32.4%) |
| 15 Years | 0 (0.0%) | 0 (0.0%) |
| 16 and 17 Years | 4 (23.5%) | 0 (0.0%) |
| 18 to 24 Years | 4 (7.7%) | 9 (20.4%) |
| 25 to 34 Years | 0 (0.0%) | 0 (0.0%) |
| 35 to 44 Years | 21 (13.6%) | 9 (8.7%) |
| 45 to 54 Years | 11 (9.0%) | 7 (5.3%) |
| 55 to 64 Years | 15 (9.4%) | 27 (16.3%) |
| 65 to 74 Years | 10 (9.9%) | 10 (8.1%) |
| 75 Years and over | 4 (7.5%) | 7 (17.1%) |
| Total | 80 (8.4%) | 85 (9.3%) |
Income Above Poverty by Sex and Age in Durham
According to the poverty statistics in Durham, males aged 12 to 14 years and females aged 5 years are the age groups that are most secure financially, with 100.0% of males and 100.0% of females in these age groups living above the poverty line.
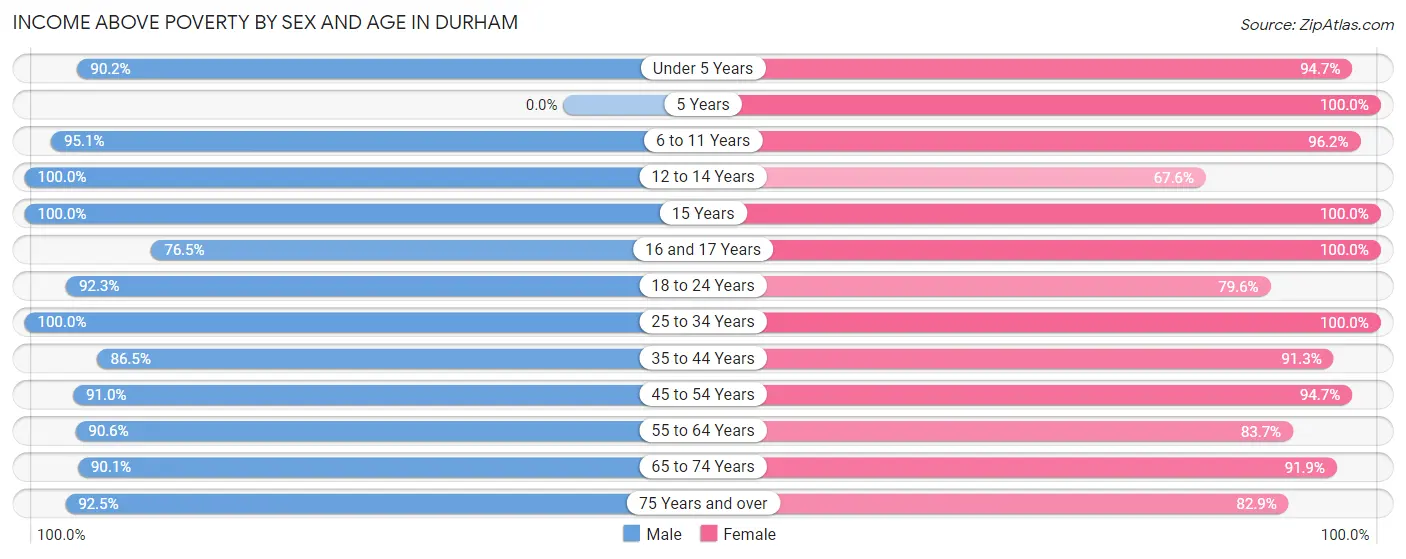
| Age Bracket | Male | Female |
| Under 5 Years | 46 (90.2%) | 36 (94.7%) |
| 5 Years | 0 (0.0%) | 9 (100.0%) |
| 6 to 11 Years | 58 (95.1%) | 51 (96.2%) |
| 12 to 14 Years | 48 (100.0%) | 25 (67.6%) |
| 15 Years | 6 (100.0%) | 7 (100.0%) |
| 16 and 17 Years | 13 (76.5%) | 10 (100.0%) |
| 18 to 24 Years | 48 (92.3%) | 35 (79.5%) |
| 25 to 34 Years | 120 (100.0%) | 149 (100.0%) |
| 35 to 44 Years | 134 (86.5%) | 94 (91.3%) |
| 45 to 54 Years | 111 (91.0%) | 125 (94.7%) |
| 55 to 64 Years | 144 (90.6%) | 139 (83.7%) |
| 65 to 74 Years | 91 (90.1%) | 113 (91.9%) |
| 75 Years and over | 49 (92.4%) | 34 (82.9%) |
| Total | 868 (91.6%) | 827 (90.7%) |
Income Below Poverty Among Married-Couple Families in Durham
The poverty statistics for married-couple families in Durham show that 3.3% or 14 of the total 425 families live below the poverty line. Families with 3 or 4 children have the highest poverty rate of 23.5%, comprising of 8 families. On the other hand, families with no children have the lowest poverty rate of 0.0%, which includes 0 families.
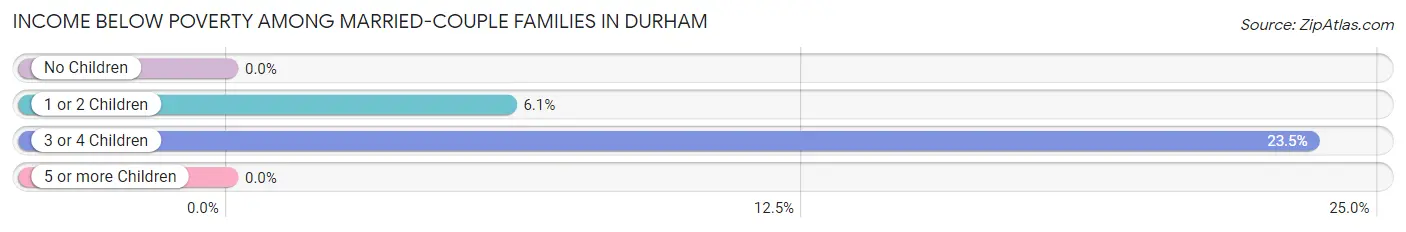
| Children | Above Poverty | Below Poverty |
| No Children | 292 (100.0%) | 0 (0.0%) |
| 1 or 2 Children | 93 (93.9%) | 6 (6.1%) |
| 3 or 4 Children | 26 (76.5%) | 8 (23.5%) |
| 5 or more Children | 0 (0.0%) | 0 (0.0%) |
| Total | 411 (96.7%) | 14 (3.3%) |
Income Below Poverty Among Single-Parent Households in Durham
According to the poverty data in Durham, 13.8% or 11 single-father households and 21.4% or 12 single-mother households are living below the poverty line. Among single-father households, those with 1 or 2 children have the highest poverty rate, with 7 households (28.0%) experiencing poverty. Likewise, among single-mother households, those with 3 or 4 children have the highest poverty rate, with 3 households (100.0%) falling below the poverty line.
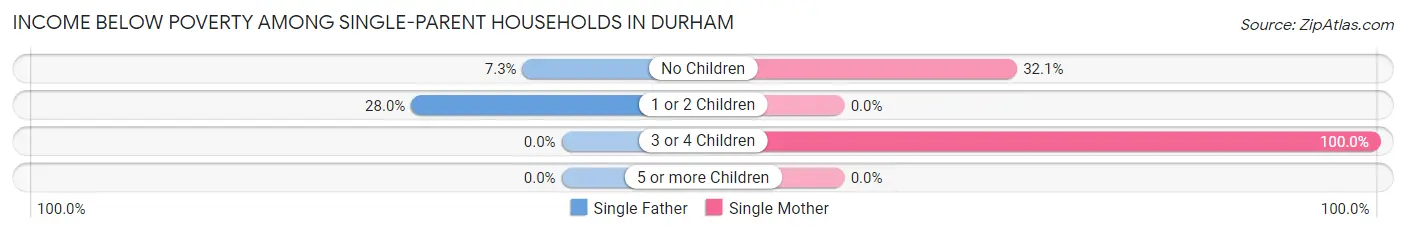
| Children | Single Father | Single Mother |
| No Children | 4 (7.3%) | 9 (32.1%) |
| 1 or 2 Children | 7 (28.0%) | 0 (0.0%) |
| 3 or 4 Children | 0 (0.0%) | 3 (100.0%) |
| 5 or more Children | 0 (0.0%) | 0 (0.0%) |
| Total | 11 (13.8%) | 12 (21.4%) |
Income Below Poverty Among Married-Couple vs Single-Parent Households in Durham
The poverty data for Durham shows that 14 of the married-couple family households (3.3%) and 23 of the single-parent households (16.9%) are living below the poverty level. Within the married-couple family households, those with 3 or 4 children have the highest poverty rate, with 8 households (23.5%) falling below the poverty line. Among the single-parent households, those with 3 or 4 children have the highest poverty rate, with 3 household (100.0%) living below poverty.
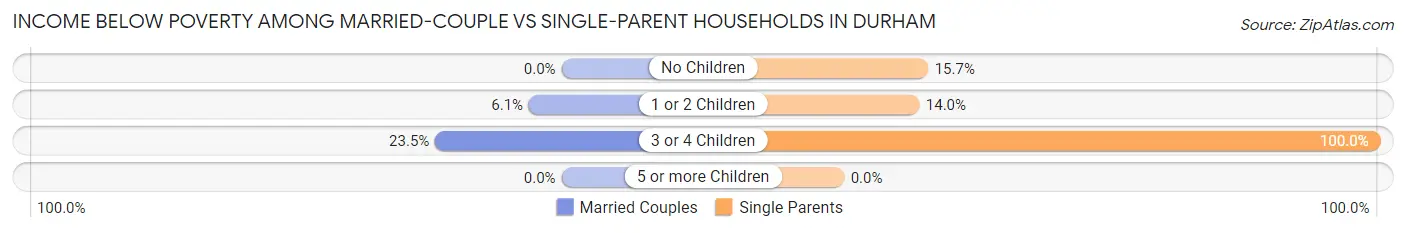
| Children | Married-Couple Families | Single-Parent Households |
| No Children | 0 (0.0%) | 13 (15.7%) |
| 1 or 2 Children | 6 (6.1%) | 7 (14.0%) |
| 3 or 4 Children | 8 (23.5%) | 3 (100.0%) |
| 5 or more Children | 0 (0.0%) | 0 (0.0%) |
| Total | 14 (3.3%) | 23 (16.9%) |
Race in Durham
The most populous races in Durham are White / Caucasian (1,287 | 69.2%), Hispanic or Latino (427 | 23.0%), and Two or more Races (253 | 13.6%).
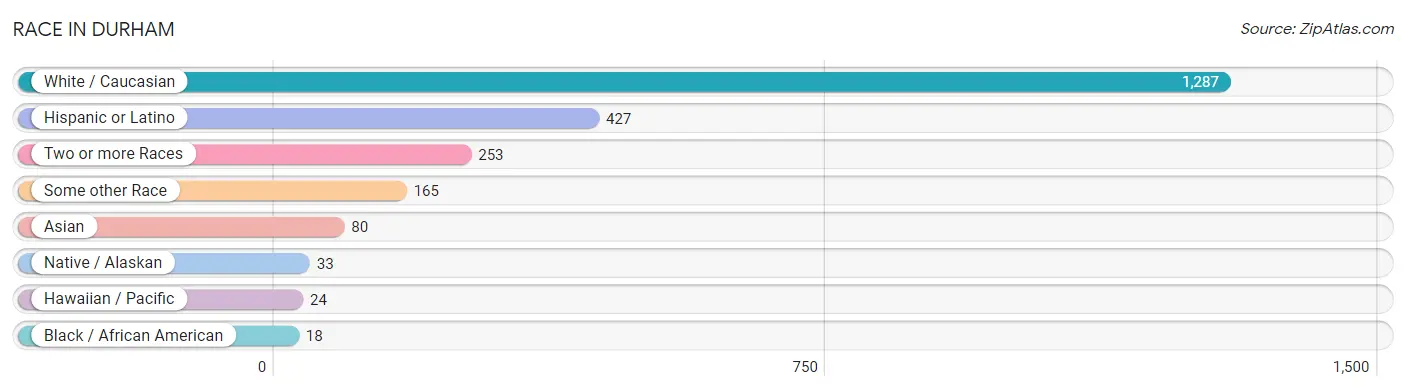
| Race | # Population | % Population |
| Asian | 80 | 4.3% |
| Black / African American | 18 | 1.0% |
| Hawaiian / Pacific | 24 | 1.3% |
| Hispanic or Latino | 427 | 23.0% |
| Native / Alaskan | 33 | 1.8% |
| White / Caucasian | 1,287 | 69.2% |
| Two or more Races | 253 | 13.6% |
| Some other Race | 165 | 8.9% |
| Total | 1,860 | 100.0% |
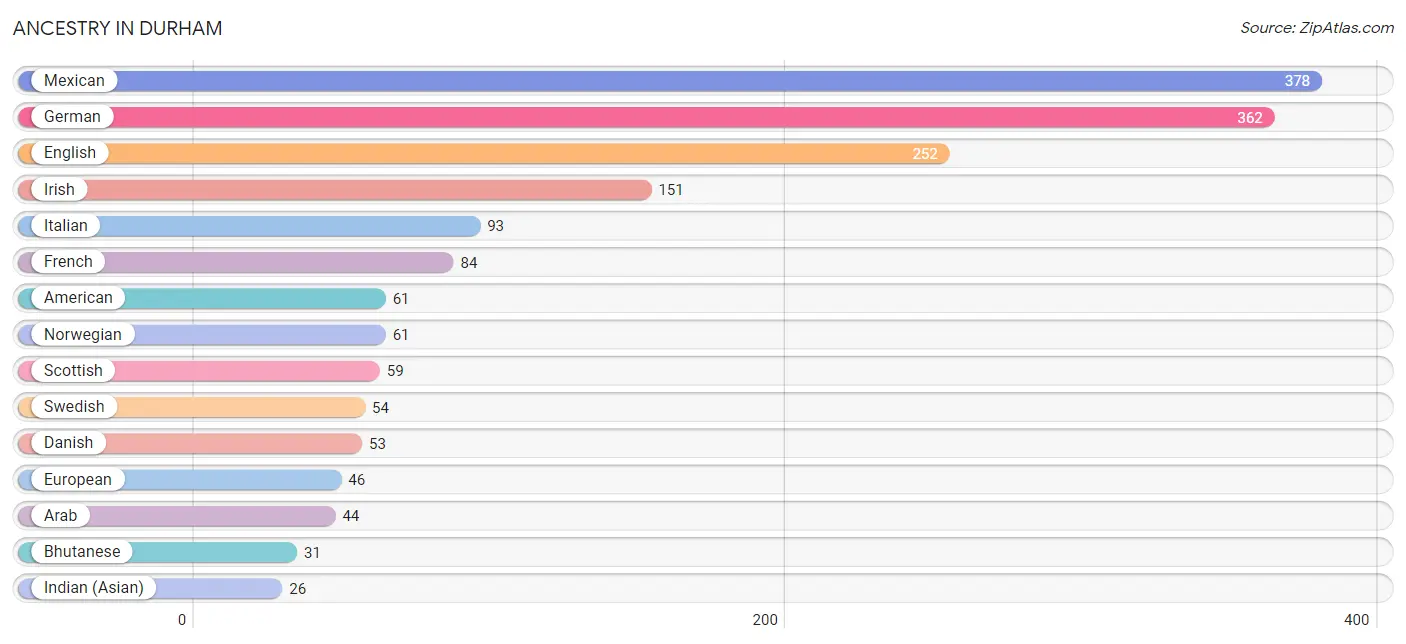
Ancestry in Durham
The most populous ancestries reported in Durham are Mexican (378 | 20.3%), German (362 | 19.5%), English (252 | 13.6%), Irish (151 | 8.1%), and Italian (93 | 5.0%), together accounting for 66.5% of all Durham residents.
| Ancestry | # Population | % Population |
| African | 5 | 0.3% |
| American | 61 | 3.3% |
| Arab | 44 | 2.4% |
| Argentinean | 3 | 0.2% |
| Belgian | 4 | 0.2% |
| Bhutanese | 31 | 1.7% |
| Brazilian | 7 | 0.4% |
| British | 4 | 0.2% |
| Burmese | 20 | 1.1% |
| Central American | 13 | 0.7% |
| Colombian | 9 | 0.5% |
| Croatian | 8 | 0.4% |
| Czech | 10 | 0.5% |
| Danish | 53 | 2.9% |
| Dutch | 25 | 1.3% |
| Eastern European | 20 | 1.1% |
| English | 252 | 13.6% |
| European | 46 | 2.5% |
| Filipino | 3 | 0.2% |
| Finnish | 14 | 0.7% |
| French | 84 | 4.5% |
| French Canadian | 10 | 0.5% |
| German | 362 | 19.5% |
| Greek | 4 | 0.2% |
| Guatemalan | 5 | 0.3% |
| Indian (Asian) | 26 | 1.4% |
| Iranian | 5 | 0.3% |
| Iraqi | 21 | 1.1% |
| Irish | 151 | 8.1% |
| Italian | 93 | 5.0% |
| Kiowa | 6 | 0.3% |
| Korean | 23 | 1.2% |
| Mexican | 378 | 20.3% |
| Norwegian | 61 | 3.3% |
| Panamanian | 8 | 0.4% |
| Polish | 25 | 1.3% |
| Portuguese | 4 | 0.2% |
| Russian | 5 | 0.3% |
| Scandinavian | 13 | 0.7% |
| Scotch-Irish | 19 | 1.0% |
| Scottish | 59 | 3.2% |
| Slavic | 3 | 0.2% |
| South American | 12 | 0.6% |
| Spaniard | 11 | 0.6% |
| Spanish | 13 | 0.7% |
| Sri Lankan | 12 | 0.6% |
| Subsaharan African | 5 | 0.3% |
| Swedish | 54 | 2.9% |
| Swiss | 3 | 0.2% |
| Thai | 14 | 0.7% |
| Tlingit-Haida | 4 | 0.2% |
| Turkish | 7 | 0.4% |
| Welsh | 11 | 0.6% | View All 53 Rows |
Immigrants in Durham
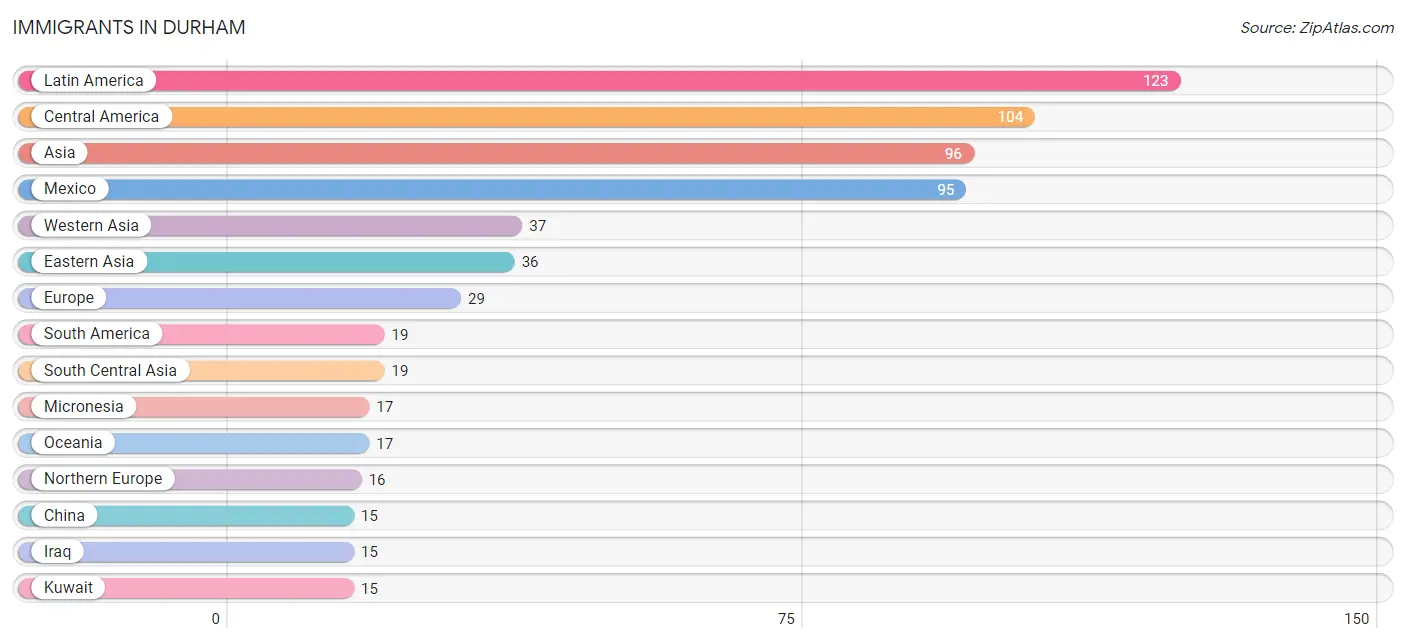
The most numerous immigrant groups reported in Durham came from Latin America (123 | 6.6%), Central America (104 | 5.6%), Asia (96 | 5.2%), Mexico (95 | 5.1%), and Western Asia (37 | 2.0%), together accounting for 24.5% of all Durham residents.
| Immigration Origin | # Population | % Population |
| Argentina | 3 | 0.2% |
| Asia | 96 | 5.2% |
| Central America | 104 | 5.6% |
| China | 15 | 0.8% |
| Colombia | 6 | 0.3% |
| Eastern Asia | 36 | 1.9% |
| England | 14 | 0.7% |
| Europe | 29 | 1.6% |
| Germany | 13 | 0.7% |
| Guatemala | 5 | 0.3% |
| India | 14 | 0.7% |
| Indonesia | 4 | 0.2% |
| Iran | 5 | 0.3% |
| Iraq | 15 | 0.8% |
| Japan | 12 | 0.6% |
| Korea | 9 | 0.5% |
| Kuwait | 15 | 0.8% |
| Latin America | 123 | 6.6% |
| Mexico | 95 | 5.1% |
| Micronesia | 17 | 0.9% |
| Northern Europe | 16 | 0.9% |
| Oceania | 17 | 0.9% |
| Panama | 4 | 0.2% |
| Peru | 10 | 0.5% |
| South America | 19 | 1.0% |
| South Central Asia | 19 | 1.0% |
| South Eastern Asia | 4 | 0.2% |
| Syria | 7 | 0.4% |
| Western Asia | 37 | 2.0% |
| Western Europe | 13 | 0.7% | View All 30 Rows |
Sex and Age in Durham
Sex and Age in Durham
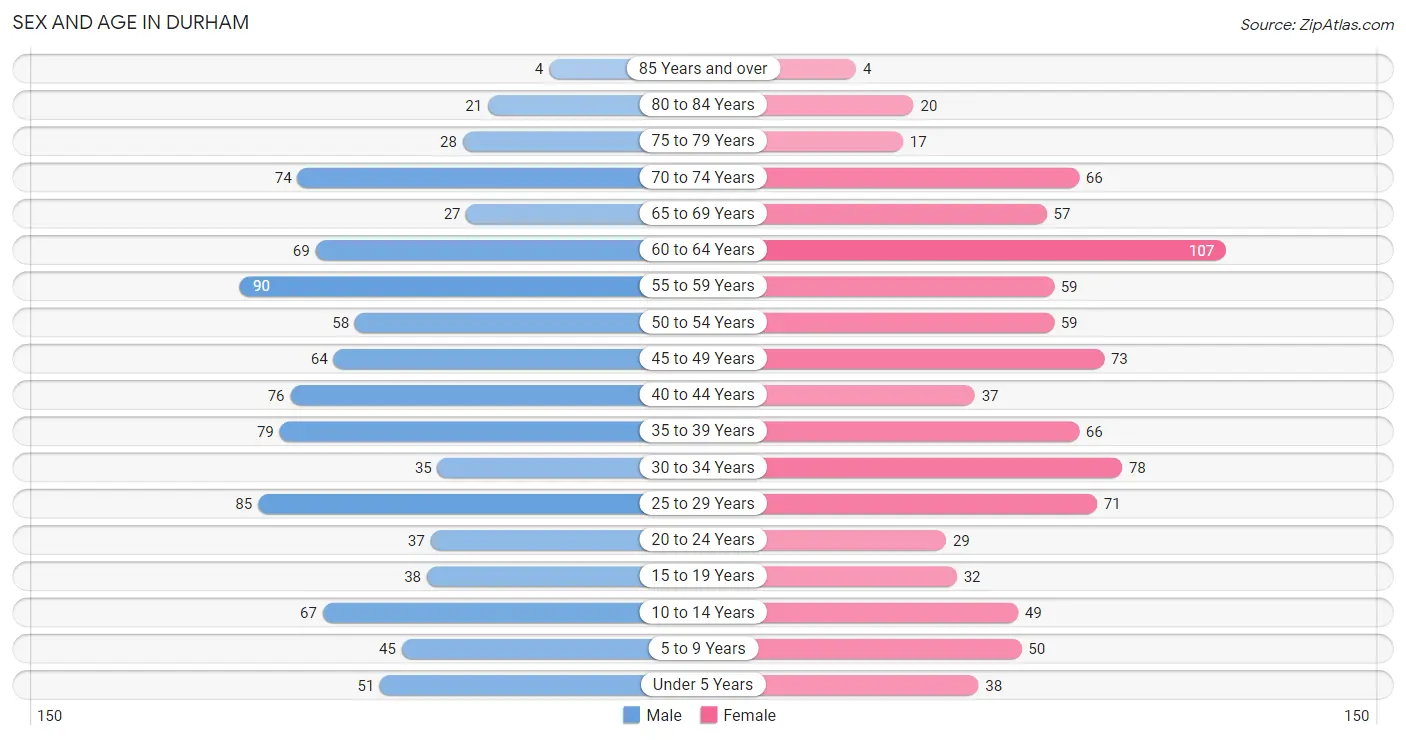
The most populous age groups in Durham are 55 to 59 Years (90 | 9.5%) for men and 60 to 64 Years (107 | 11.7%) for women.
| Age Bracket | Male | Female |
| Under 5 Years | 51 (5.4%) | 38 (4.2%) |
| 5 to 9 Years | 45 (4.8%) | 50 (5.5%) |
| 10 to 14 Years | 67 (7.1%) | 49 (5.4%) |
| 15 to 19 Years | 38 (4.0%) | 32 (3.5%) |
| 20 to 24 Years | 37 (3.9%) | 29 (3.2%) |
| 25 to 29 Years | 85 (9.0%) | 71 (7.8%) |
| 30 to 34 Years | 35 (3.7%) | 78 (8.6%) |
| 35 to 39 Years | 79 (8.3%) | 66 (7.2%) |
| 40 to 44 Years | 76 (8.0%) | 37 (4.1%) |
| 45 to 49 Years | 64 (6.8%) | 73 (8.0%) |
| 50 to 54 Years | 58 (6.1%) | 59 (6.5%) |
| 55 to 59 Years | 90 (9.5%) | 59 (6.5%) |
| 60 to 64 Years | 69 (7.3%) | 107 (11.7%) |
| 65 to 69 Years | 27 (2.9%) | 57 (6.2%) |
| 70 to 74 Years | 74 (7.8%) | 66 (7.2%) |
| 75 to 79 Years | 28 (2.9%) | 17 (1.9%) |
| 80 to 84 Years | 21 (2.2%) | 20 (2.2%) |
| 85 Years and over | 4 (0.4%) | 4 (0.4%) |
| Total | 948 (100.0%) | 912 (100.0%) |
Families and Households in Durham
Median Family Size in Durham
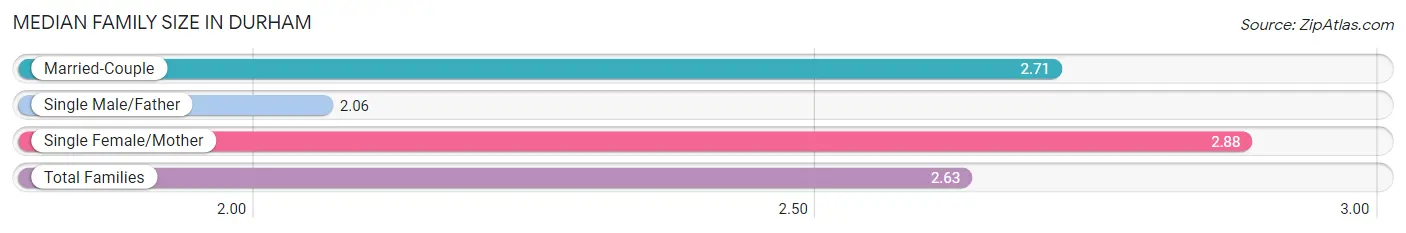
The median family size in Durham is 2.63 persons per family, with single female/mother families (56 | 10.0%) accounting for the largest median family size of 2.88 persons per family. On the other hand, single male/father families (80 | 14.3%) represent the smallest median family size with 2.06 persons per family.
| Family Type | # Families | Family Size |
| Married-Couple | 425 (75.8%) | 2.71 |
| Single Male/Father | 80 (14.3%) | 2.06 |
| Single Female/Mother | 56 (10.0%) | 2.88 |
| Total Families | 561 (100.0%) | 2.63 |
Median Household Size in Durham
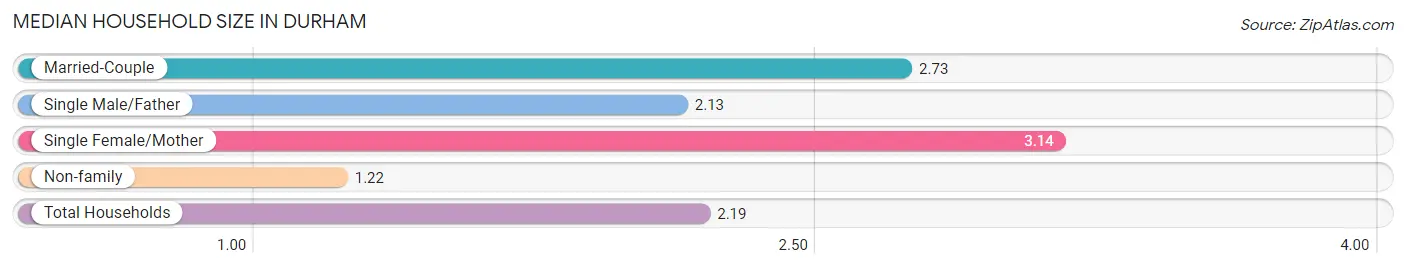
The median household size in Durham is 2.19 persons per household, with single female/mother households (56 | 6.6%) accounting for the largest median household size of 3.14 persons per household. non-family households (290 | 34.1%) represent the smallest median household size with 1.22 persons per household.
| Household Type | # Households | Household Size |
| Married-Couple | 425 (49.9%) | 2.73 |
| Single Male/Father | 80 (9.4%) | 2.13 |
| Single Female/Mother | 56 (6.6%) | 3.14 |
| Non-family | 290 (34.1%) | 1.22 |
| Total Households | 851 (100.0%) | 2.19 |
Household Size by Marriage Status in Durham
Out of a total of 851 households in Durham, 561 (65.9%) are family households, while 290 (34.1%) are nonfamily households. The most numerous type of family households are 2-person households, comprising 357, and the most common type of nonfamily households are 1-person households, comprising 232.
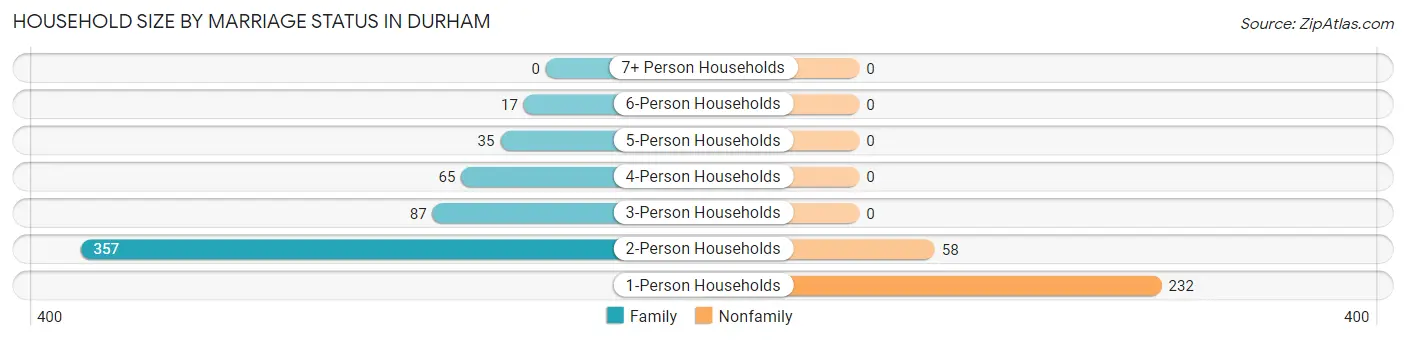
| Household Size | Family Households | Nonfamily Households |
| 1-Person Households | - | 232 (27.3%) |
| 2-Person Households | 357 (41.9%) | 58 (6.8%) |
| 3-Person Households | 87 (10.2%) | 0 (0.0%) |
| 4-Person Households | 65 (7.6%) | 0 (0.0%) |
| 5-Person Households | 35 (4.1%) | 0 (0.0%) |
| 6-Person Households | 17 (2.0%) | 0 (0.0%) |
| 7+ Person Households | 0 (0.0%) | 0 (0.0%) |
| Total | 561 (65.9%) | 290 (34.1%) |
Female Fertility in Durham
Fertility by Age in Durham
Average fertility rate in Durham is 23.0 births per 1,000 women. Women in the age bracket of 35 to 50 years have the highest fertility rate with 33.0 births per 1,000 women. Women in the age bracket of 35 to 50 years acount for 66.7% of all women with births.
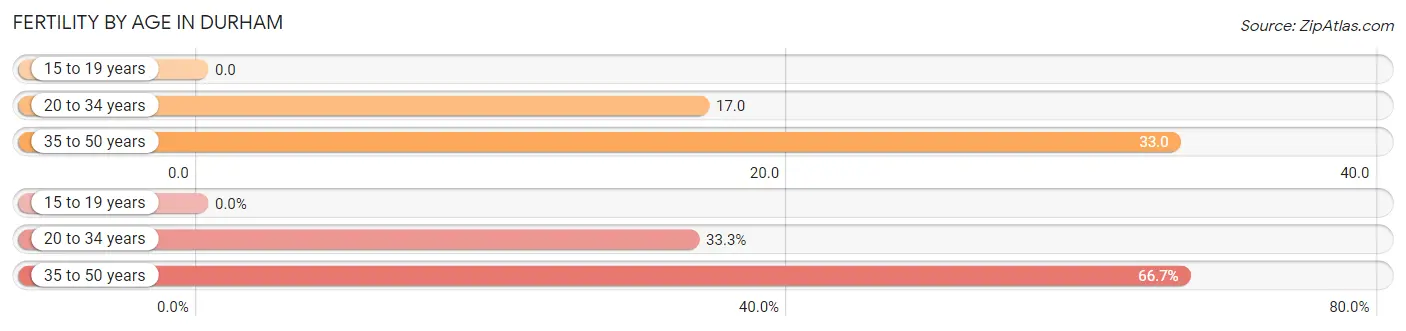
| Age Bracket | Women with Births | Births / 1,000 Women |
| 15 to 19 years | 0 (0.0%) | 0.0 |
| 20 to 34 years | 3 (33.3%) | 17.0 |
| 35 to 50 years | 6 (66.7%) | 33.0 |
| Total | 9 (100.0%) | 23.0 |
Fertility by Age by Marriage Status in Durham
66.7% of women with births (9) in Durham are married. The highest percentage of unmarried women with births falls into 20 to 34 years age bracket with 100.0% of them unmarried at the time of birth, while the lowest percentage of unmarried women with births belong to 35 to 50 years age bracket with 0.0% of them unmarried.
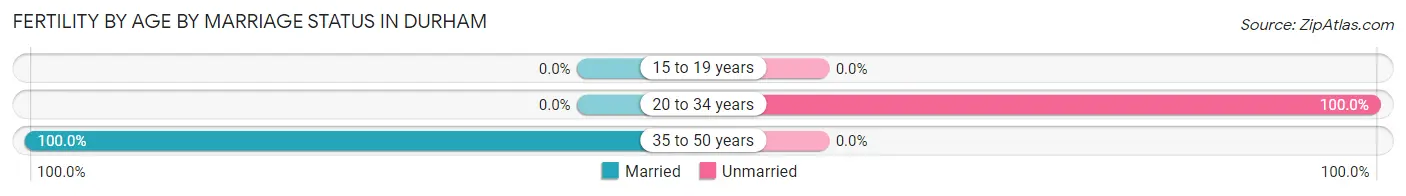
| Age Bracket | Married | Unmarried |
| 15 to 19 years | 0 (0.0%) | 0 (0.0%) |
| 20 to 34 years | 0 (0.0%) | 3 (100.0%) |
| 35 to 50 years | 6 (100.0%) | 0 (0.0%) |
| Total | 6 (66.7%) | 3 (33.3%) |
Fertility by Education in Durham
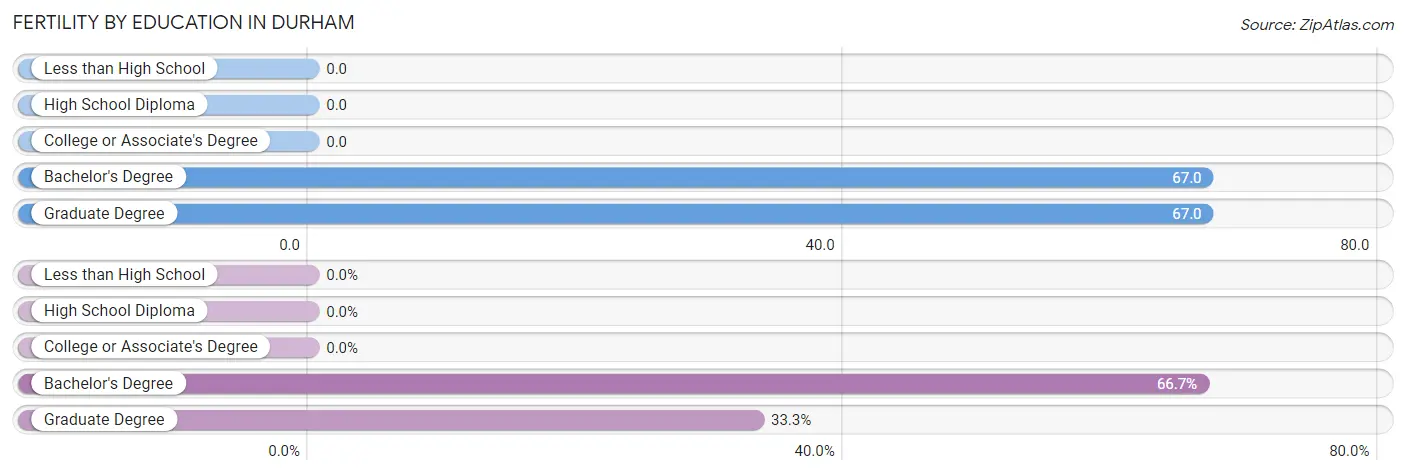
| Educational Attainment | Women with Births | Births / 1,000 Women |
| Less than High School | 0 (0.0%) | 0.0 |
| High School Diploma | 0 (0.0%) | 0.0 |
| College or Associate's Degree | 0 (0.0%) | 0.0 |
| Bachelor's Degree | 6 (66.7%) | 67.0 |
| Graduate Degree | 3 (33.3%) | 67.0 |
| Total | 9 (100.0%) | 23.0 |
Fertility by Education by Marriage Status in Durham
33.3% of women with births in Durham are unmarried. Women with the educational attainment of graduate degree are most likely to be married with 100.0% of them married at childbirth, while women with the educational attainment of bachelor's degree are least likely to be married with 50.0% of them unmarried at childbirth.
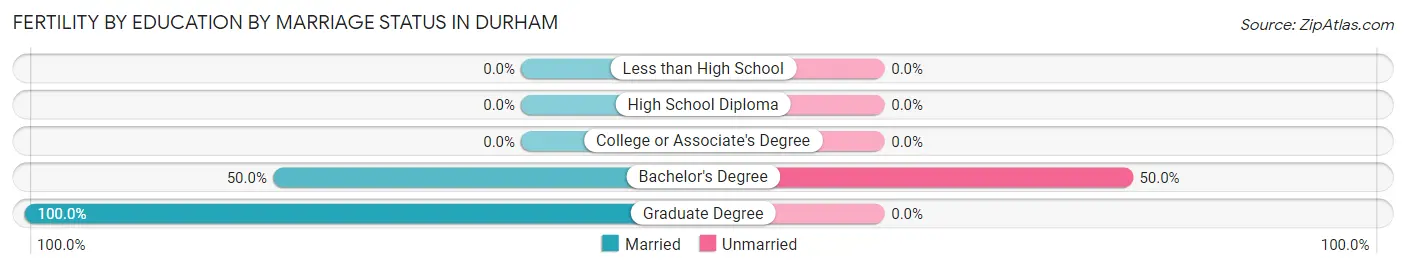
| Educational Attainment | Married | Unmarried |
| Less than High School | 0 (0.0%) | 0 (0.0%) |
| High School Diploma | 0 (0.0%) | 0 (0.0%) |
| College or Associate's Degree | 0 (0.0%) | 0 (0.0%) |
| Bachelor's Degree | 3 (50.0%) | 3 (50.0%) |
| Graduate Degree | 3 (100.0%) | 0 (0.0%) |
| Total | 6 (66.7%) | 3 (33.3%) |
Employment Characteristics in Durham
Employment by Class of Employer in Durham
Among the 959 employed individuals in Durham, private company employees (609 | 63.5%), self-employed (not incorporated) (90 | 9.4%), and local government employees (84 | 8.8%) make up the most common classes of employment.
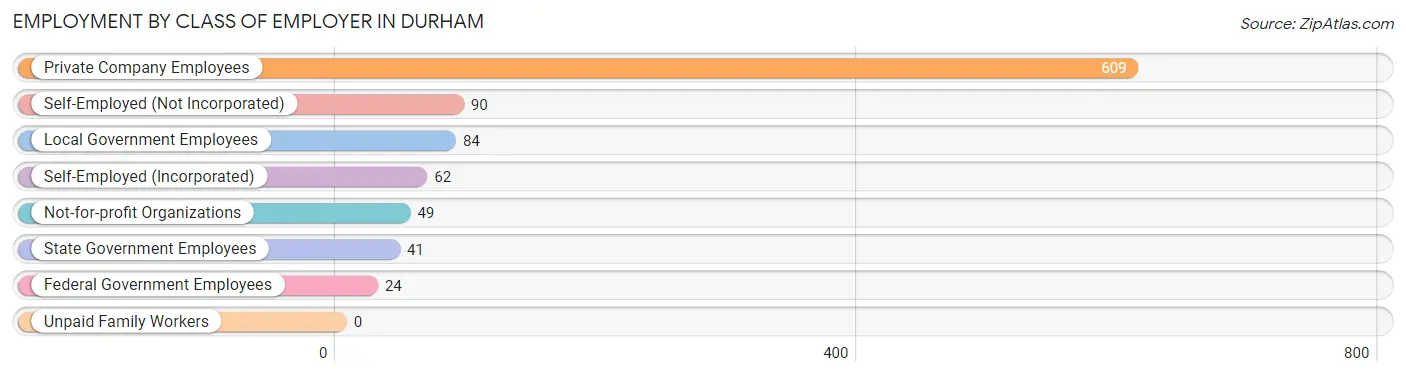
| Employer Class | # Employees | % Employees |
| Private Company Employees | 609 | 63.5% |
| Self-Employed (Incorporated) | 62 | 6.5% |
| Self-Employed (Not Incorporated) | 90 | 9.4% |
| Not-for-profit Organizations | 49 | 5.1% |
| Local Government Employees | 84 | 8.8% |
| State Government Employees | 41 | 4.3% |
| Federal Government Employees | 24 | 2.5% |
| Unpaid Family Workers | 0 | 0.0% |
| Total | 959 | 100.0% |
Employment Status by Age in Durham
According to the labor force statistics for Durham, out of the total population over 16 years of age (1,547), 64.5% or 998 individuals are in the labor force, with 3.2% or 32 of them unemployed. The age group with the highest labor force participation rate is 30 to 34 years, with 95.6% or 108 individuals in the labor force. Within the labor force, the 45 to 54 years age range has the highest percentage of unemployed individuals, with 8.4% or 20 of them being unemployed.
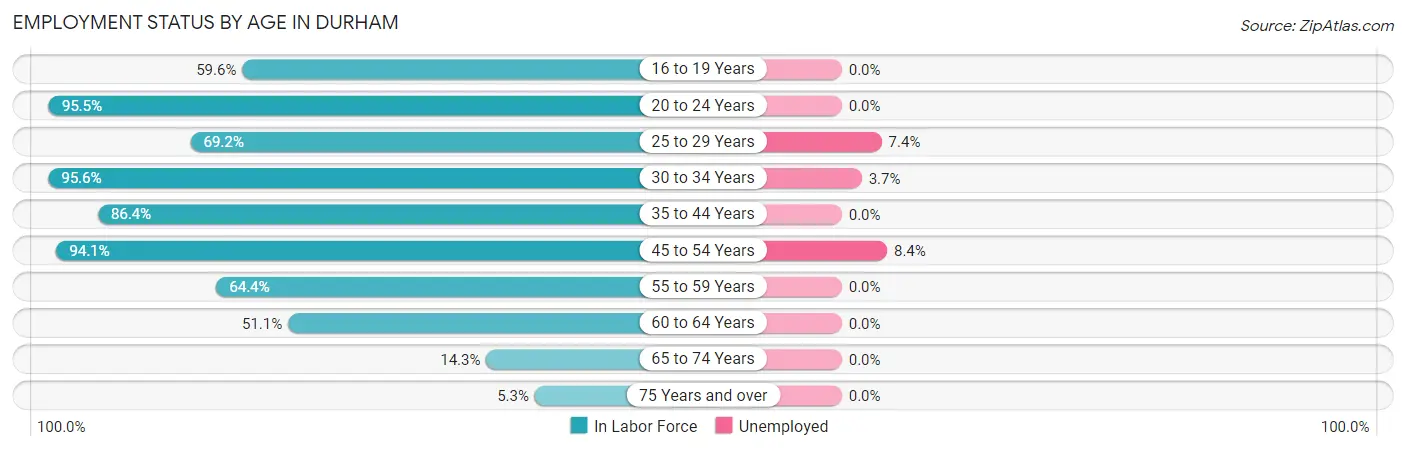
| Age Bracket | In Labor Force | Unemployed |
| 16 to 19 Years | 34 (59.6%) | 0 (0.0%) |
| 20 to 24 Years | 63 (95.5%) | 0 (0.0%) |
| 25 to 29 Years | 108 (69.2%) | 8 (7.4%) |
| 30 to 34 Years | 108 (95.6%) | 4 (3.7%) |
| 35 to 44 Years | 223 (86.4%) | 0 (0.0%) |
| 45 to 54 Years | 239 (94.1%) | 20 (8.4%) |
| 55 to 59 Years | 96 (64.4%) | 0 (0.0%) |
| 60 to 64 Years | 90 (51.1%) | 0 (0.0%) |
| 65 to 74 Years | 32 (14.3%) | 0 (0.0%) |
| 75 Years and over | 5 (5.3%) | 0 (0.0%) |
| Total | 998 (64.5%) | 32 (3.2%) |
Employment Status by Educational Attainment in Durham
According to labor force statistics for Durham, 78.1% of individuals (864) out of the total population between 25 and 64 years of age (1,106) are in the labor force, with 3.7% or 32 of them being unemployed. The group with the highest labor force participation rate are those with the educational attainment of bachelor's degree or higher, with 81.7% or 398 individuals in the labor force. Within the labor force, individuals with high school diploma education have the highest percentage of unemployment, with 7.9% or 12 of them being unemployed.
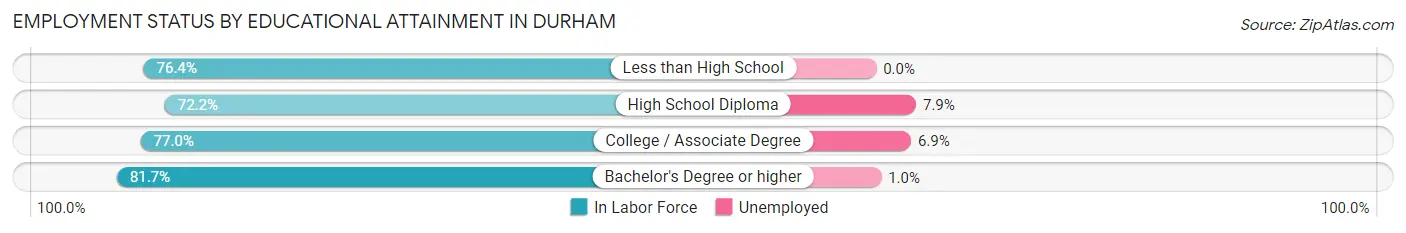
| Educational Attainment | In Labor Force | Unemployed |
| Less than High School | 84 (76.4%) | 0 (0.0%) |
| High School Diploma | 151 (72.2%) | 17 (7.9%) |
| College / Associate Degree | 231 (77.0%) | 21 (6.9%) |
| Bachelor's Degree or higher | 398 (81.7%) | 5 (1.0%) |
| Total | 864 (78.1%) | 41 (3.7%) |
Employment Occupations by Sex in Durham
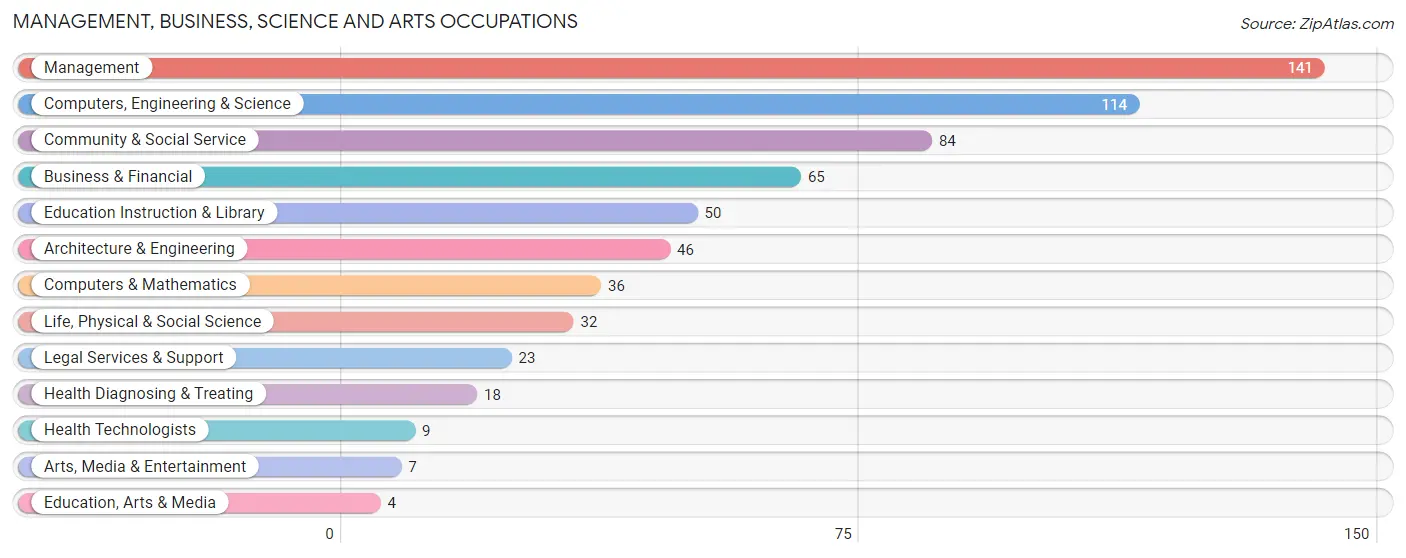
Management, Business, Science and Arts Occupations
The most common Management, Business, Science and Arts occupations in Durham are Management (141 | 14.6%), Computers, Engineering & Science (114 | 11.8%), Community & Social Service (84 | 8.7%), Business & Financial (65 | 6.7%), and Education Instruction & Library (50 | 5.2%).
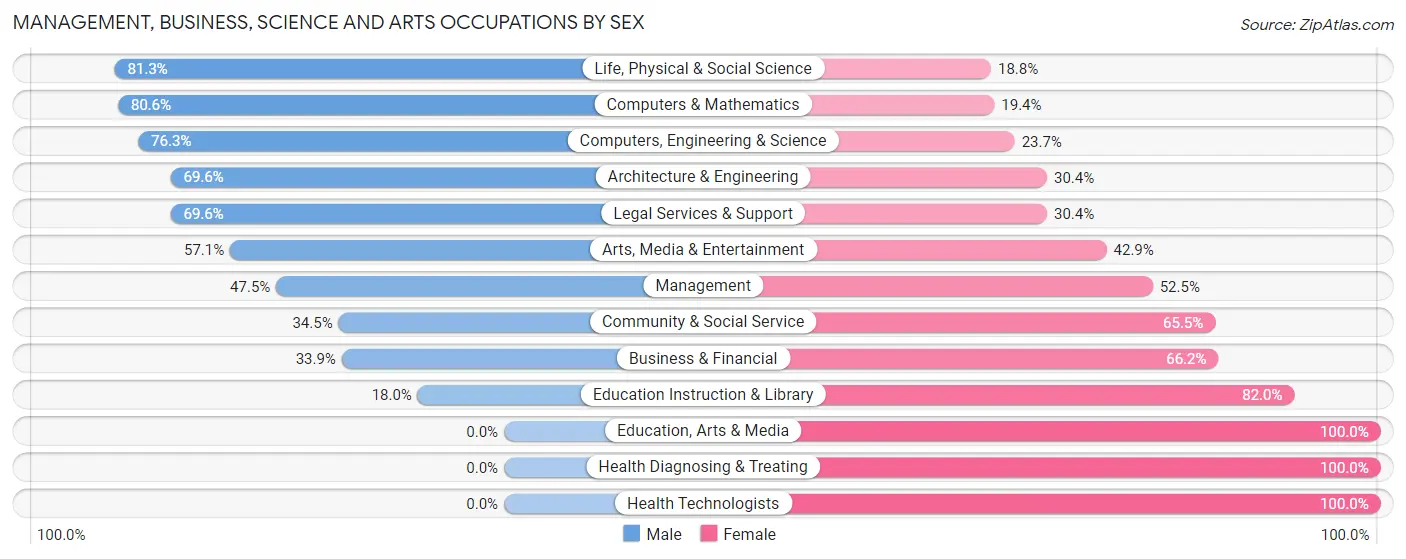
Management, Business, Science and Arts Occupations by Sex
Within the Management, Business, Science and Arts occupations in Durham, the most male-oriented occupations are Life, Physical & Social Science (81.2%), Computers & Mathematics (80.6%), and Computers, Engineering & Science (76.3%), while the most female-oriented occupations are Education, Arts & Media (100.0%), Health Diagnosing & Treating (100.0%), and Health Technologists (100.0%).
| Occupation | Male | Female |
| Management | 67 (47.5%) | 74 (52.5%) |
| Business & Financial | 22 (33.9%) | 43 (66.1%) |
| Computers, Engineering & Science | 87 (76.3%) | 27 (23.7%) |
| Computers & Mathematics | 29 (80.6%) | 7 (19.4%) |
| Architecture & Engineering | 32 (69.6%) | 14 (30.4%) |
| Life, Physical & Social Science | 26 (81.2%) | 6 (18.8%) |
| Community & Social Service | 29 (34.5%) | 55 (65.5%) |
| Education, Arts & Media | 0 (0.0%) | 4 (100.0%) |
| Legal Services & Support | 16 (69.6%) | 7 (30.4%) |
| Education Instruction & Library | 9 (18.0%) | 41 (82.0%) |
| Arts, Media & Entertainment | 4 (57.1%) | 3 (42.9%) |
| Health Diagnosing & Treating | 0 (0.0%) | 18 (100.0%) |
| Health Technologists | 0 (0.0%) | 9 (100.0%) |
| Total (Category) | 205 (48.6%) | 217 (51.4%) |
| Total (Overall) | 487 (50.4%) | 479 (49.6%) |
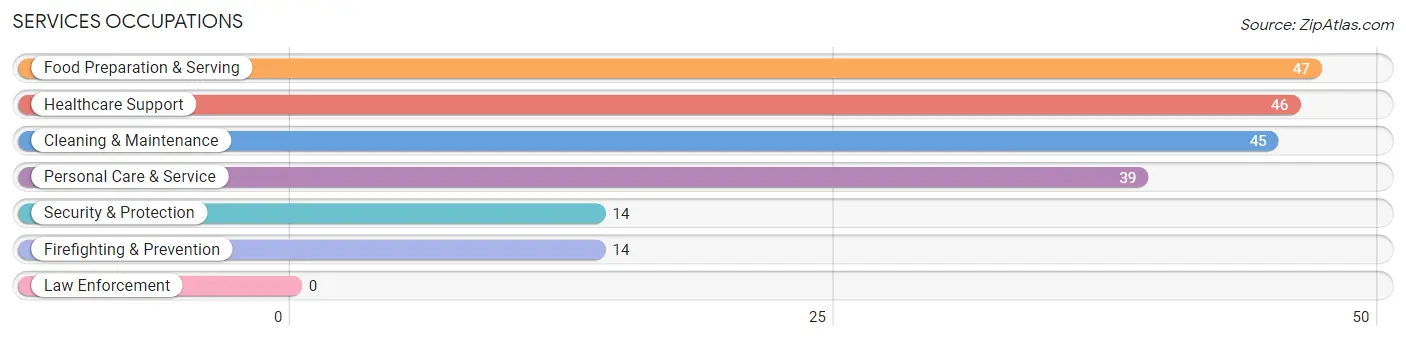
Services Occupations
The most common Services occupations in Durham are Food Preparation & Serving (47 | 4.9%), Healthcare Support (46 | 4.8%), Cleaning & Maintenance (45 | 4.7%), Personal Care & Service (39 | 4.0%), and Security & Protection (14 | 1.5%).
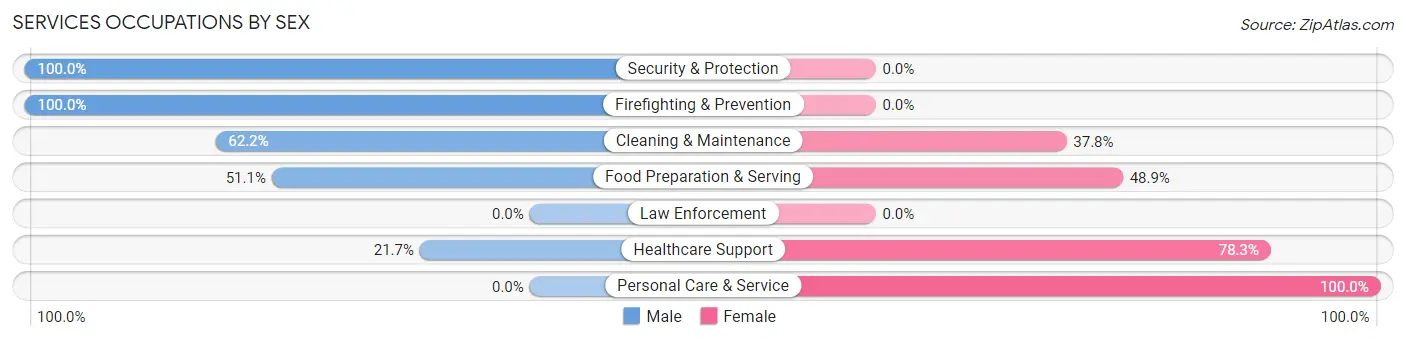
Services Occupations by Sex
Within the Services occupations in Durham, the most male-oriented occupations are Security & Protection (100.0%), Firefighting & Prevention (100.0%), and Cleaning & Maintenance (62.2%), while the most female-oriented occupations are Personal Care & Service (100.0%), Healthcare Support (78.3%), and Food Preparation & Serving (48.9%).
| Occupation | Male | Female |
| Healthcare Support | 10 (21.7%) | 36 (78.3%) |
| Security & Protection | 14 (100.0%) | 0 (0.0%) |
| Firefighting & Prevention | 14 (100.0%) | 0 (0.0%) |
| Law Enforcement | 0 (0.0%) | 0 (0.0%) |
| Food Preparation & Serving | 24 (51.1%) | 23 (48.9%) |
| Cleaning & Maintenance | 28 (62.2%) | 17 (37.8%) |
| Personal Care & Service | 0 (0.0%) | 39 (100.0%) |
| Total (Category) | 76 (39.8%) | 115 (60.2%) |
| Total (Overall) | 487 (50.4%) | 479 (49.6%) |
Sales and Office Occupations
The most common Sales and Office occupations in Durham are Sales & Related (109 | 11.3%), and Office & Administration (81 | 8.4%).
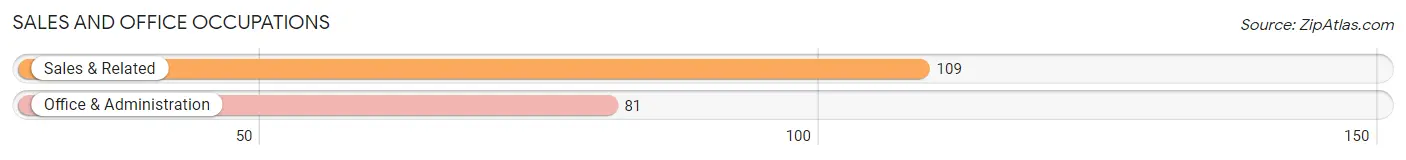
Sales and Office Occupations by Sex
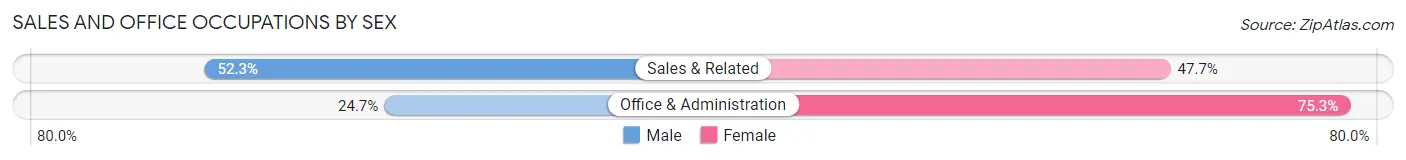
| Occupation | Male | Female |
| Sales & Related | 57 (52.3%) | 52 (47.7%) |
| Office & Administration | 20 (24.7%) | 61 (75.3%) |
| Total (Category) | 77 (40.5%) | 113 (59.5%) |
| Total (Overall) | 487 (50.4%) | 479 (49.6%) |
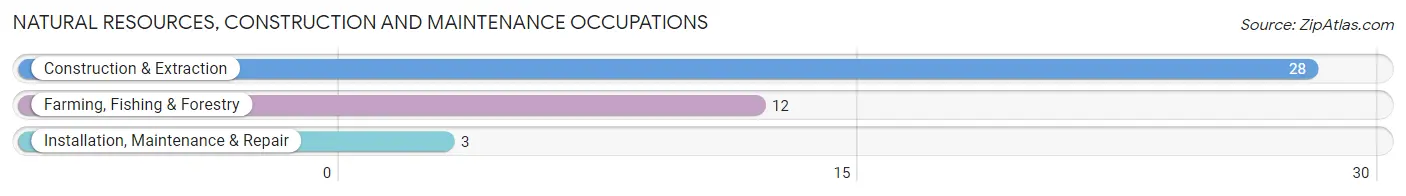
Natural Resources, Construction and Maintenance Occupations
The most common Natural Resources, Construction and Maintenance occupations in Durham are Construction & Extraction (28 | 2.9%), Farming, Fishing & Forestry (12 | 1.2%), and Installation, Maintenance & Repair (3 | 0.3%).
Natural Resources, Construction and Maintenance Occupations by Sex
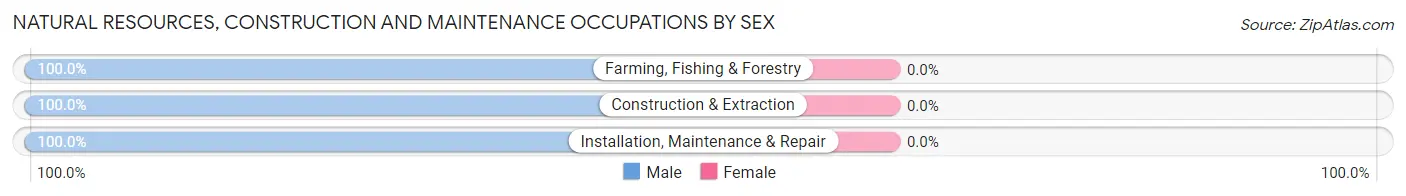
| Occupation | Male | Female |
| Farming, Fishing & Forestry | 12 (100.0%) | 0 (0.0%) |
| Construction & Extraction | 28 (100.0%) | 0 (0.0%) |
| Installation, Maintenance & Repair | 3 (100.0%) | 0 (0.0%) |
| Total (Category) | 43 (100.0%) | 0 (0.0%) |
| Total (Overall) | 487 (50.4%) | 479 (49.6%) |
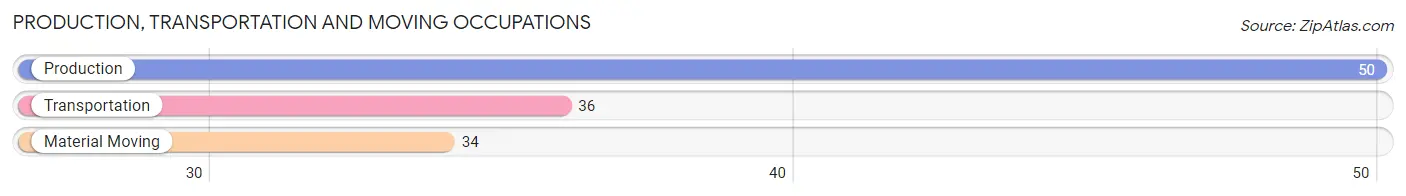
Production, Transportation and Moving Occupations
The most common Production, Transportation and Moving occupations in Durham are Production (50 | 5.2%), Transportation (36 | 3.7%), and Material Moving (34 | 3.5%).
Production, Transportation and Moving Occupations by Sex
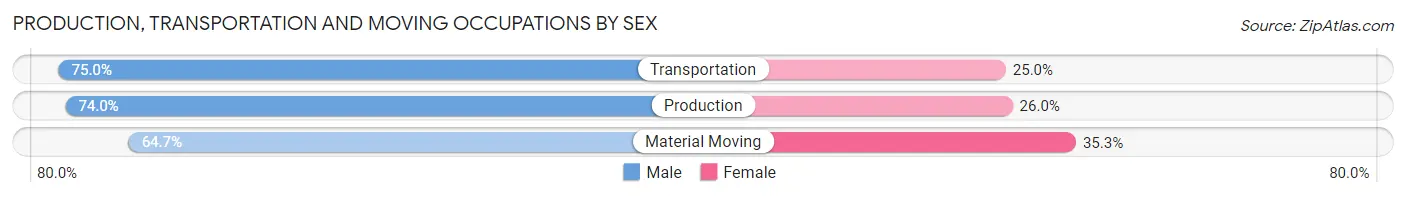
| Occupation | Male | Female |
| Production | 37 (74.0%) | 13 (26.0%) |
| Transportation | 27 (75.0%) | 9 (25.0%) |
| Material Moving | 22 (64.7%) | 12 (35.3%) |
| Total (Category) | 86 (71.7%) | 34 (28.3%) |
| Total (Overall) | 487 (50.4%) | 479 (49.6%) |
Employment Industries by Sex in Durham
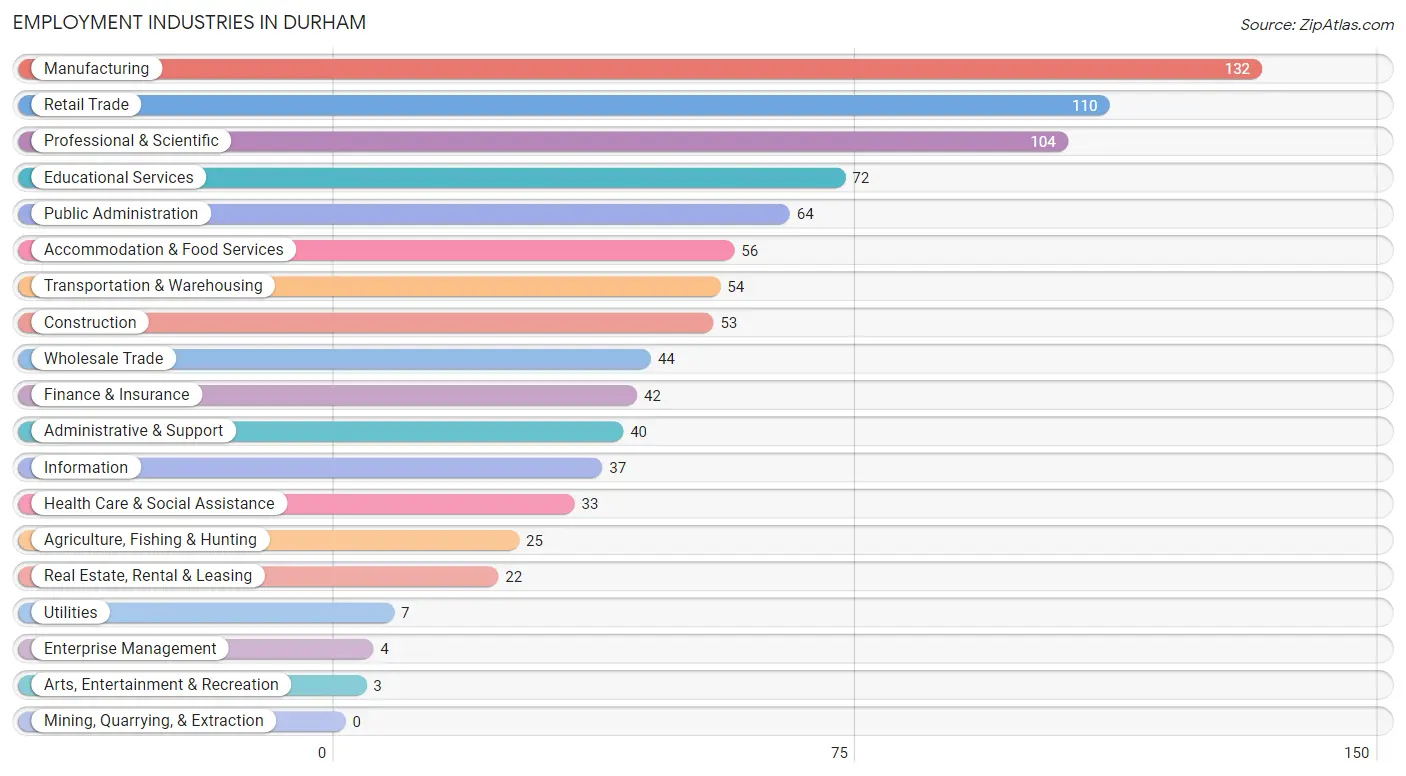
Employment Industries in Durham
The major employment industries in Durham include Manufacturing (132 | 13.7%), Retail Trade (110 | 11.4%), Professional & Scientific (104 | 10.8%), Educational Services (72 | 7.4%), and Public Administration (64 | 6.6%).
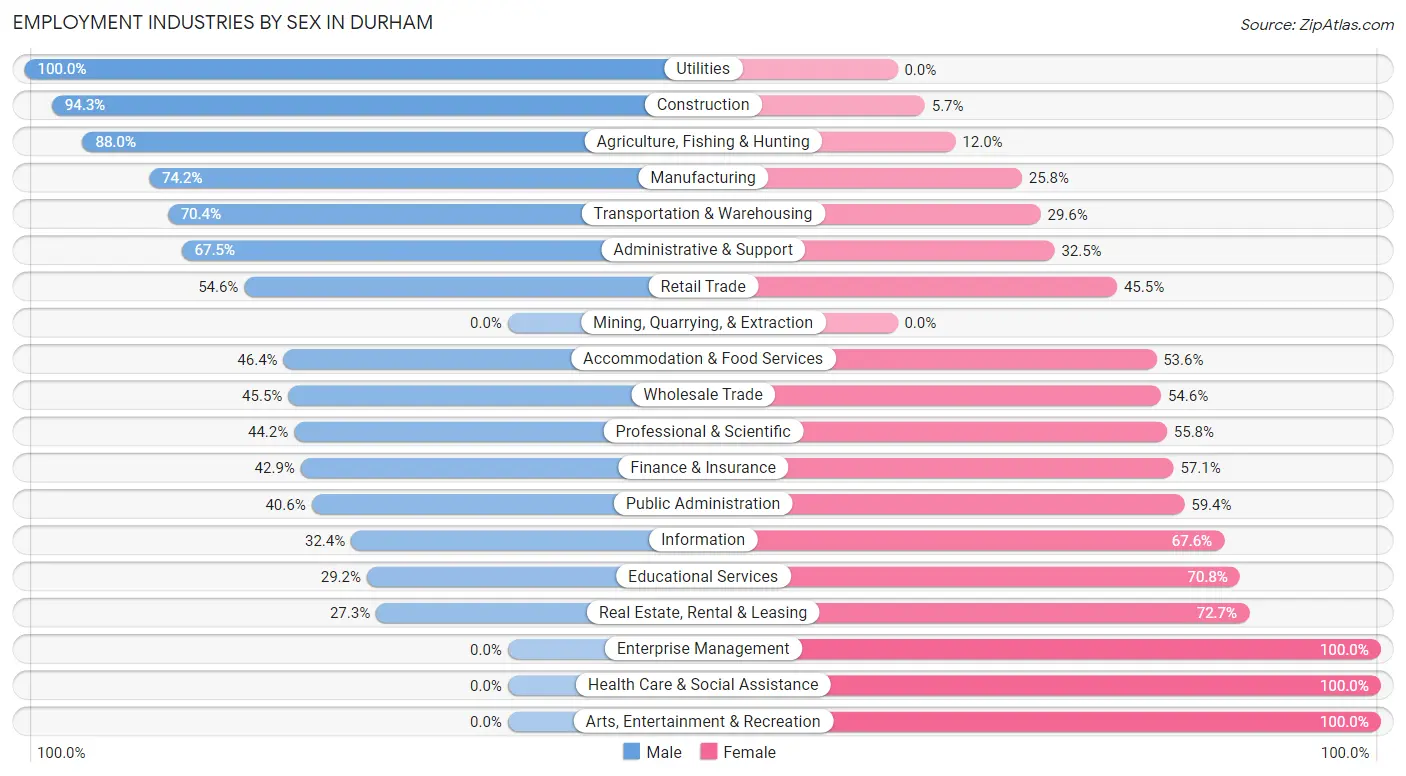
Employment Industries by Sex in Durham
The Durham industries that see more men than women are Utilities (100.0%), Construction (94.3%), and Agriculture, Fishing & Hunting (88.0%), whereas the industries that tend to have a higher number of women are Enterprise Management (100.0%), Health Care & Social Assistance (100.0%), and Arts, Entertainment & Recreation (100.0%).
| Industry | Male | Female |
| Agriculture, Fishing & Hunting | 22 (88.0%) | 3 (12.0%) |
| Mining, Quarrying, & Extraction | 0 (0.0%) | 0 (0.0%) |
| Construction | 50 (94.3%) | 3 (5.7%) |
| Manufacturing | 98 (74.2%) | 34 (25.8%) |
| Wholesale Trade | 20 (45.5%) | 24 (54.5%) |
| Retail Trade | 60 (54.5%) | 50 (45.5%) |
| Transportation & Warehousing | 38 (70.4%) | 16 (29.6%) |
| Utilities | 7 (100.0%) | 0 (0.0%) |
| Information | 12 (32.4%) | 25 (67.6%) |
| Finance & Insurance | 18 (42.9%) | 24 (57.1%) |
| Real Estate, Rental & Leasing | 6 (27.3%) | 16 (72.7%) |
| Professional & Scientific | 46 (44.2%) | 58 (55.8%) |
| Enterprise Management | 0 (0.0%) | 4 (100.0%) |
| Administrative & Support | 27 (67.5%) | 13 (32.5%) |
| Educational Services | 21 (29.2%) | 51 (70.8%) |
| Health Care & Social Assistance | 0 (0.0%) | 33 (100.0%) |
| Arts, Entertainment & Recreation | 0 (0.0%) | 3 (100.0%) |
| Accommodation & Food Services | 26 (46.4%) | 30 (53.6%) |
| Public Administration | 26 (40.6%) | 38 (59.4%) |
| Total | 487 (50.4%) | 479 (49.6%) |
Education in Durham
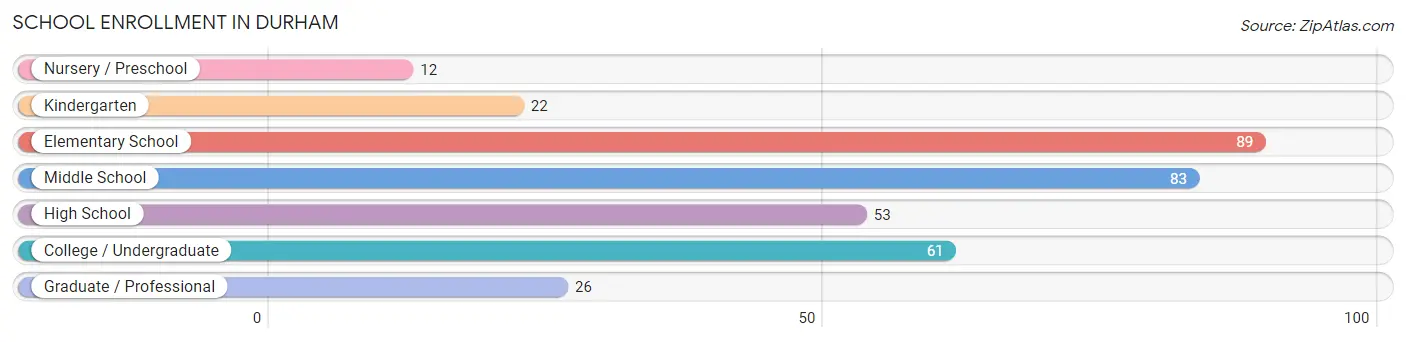
School Enrollment in Durham
The most common levels of schooling among the 346 students in Durham are elementary school (89 | 25.7%), middle school (83 | 24.0%), and college / undergraduate (61 | 17.6%).
| School Level | # Students | % Students |
| Nursery / Preschool | 12 | 3.5% |
| Kindergarten | 22 | 6.4% |
| Elementary School | 89 | 25.7% |
| Middle School | 83 | 24.0% |
| High School | 53 | 15.3% |
| College / Undergraduate | 61 | 17.6% |
| Graduate / Professional | 26 | 7.5% |
| Total | 346 | 100.0% |
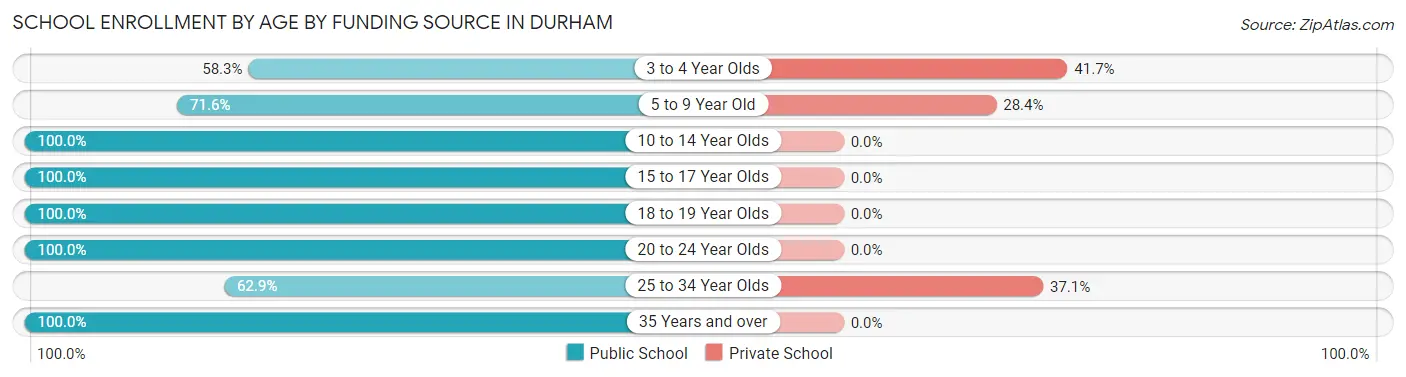
School Enrollment by Age by Funding Source in Durham
Out of a total of 346 students who are enrolled in schools in Durham, 45 (13.0%) attend a private institution, while the remaining 301 (87.0%) are enrolled in public schools. The age group of 3 to 4 year olds has the highest likelihood of being enrolled in private schools, with 5 (41.7% in the age bracket) enrolled. Conversely, the age group of 10 to 14 year olds has the lowest likelihood of being enrolled in a private school, with 112 (100.0% in the age bracket) attending a public institution.
| Age Bracket | Public School | Private School |
| 3 to 4 Year Olds | 7 (58.3%) | 5 (41.7%) |
| 5 to 9 Year Old | 68 (71.6%) | 27 (28.4%) |
| 10 to 14 Year Olds | 112 (100.0%) | 0 (0.0%) |
| 15 to 17 Year Olds | 40 (100.0%) | 0 (0.0%) |
| 18 to 19 Year Olds | 11 (100.0%) | 0 (0.0%) |
| 20 to 24 Year Olds | 22 (100.0%) | 0 (0.0%) |
| 25 to 34 Year Olds | 22 (62.9%) | 13 (37.1%) |
| 35 Years and over | 19 (100.0%) | 0 (0.0%) |
| Total | 301 (87.0%) | 45 (13.0%) |
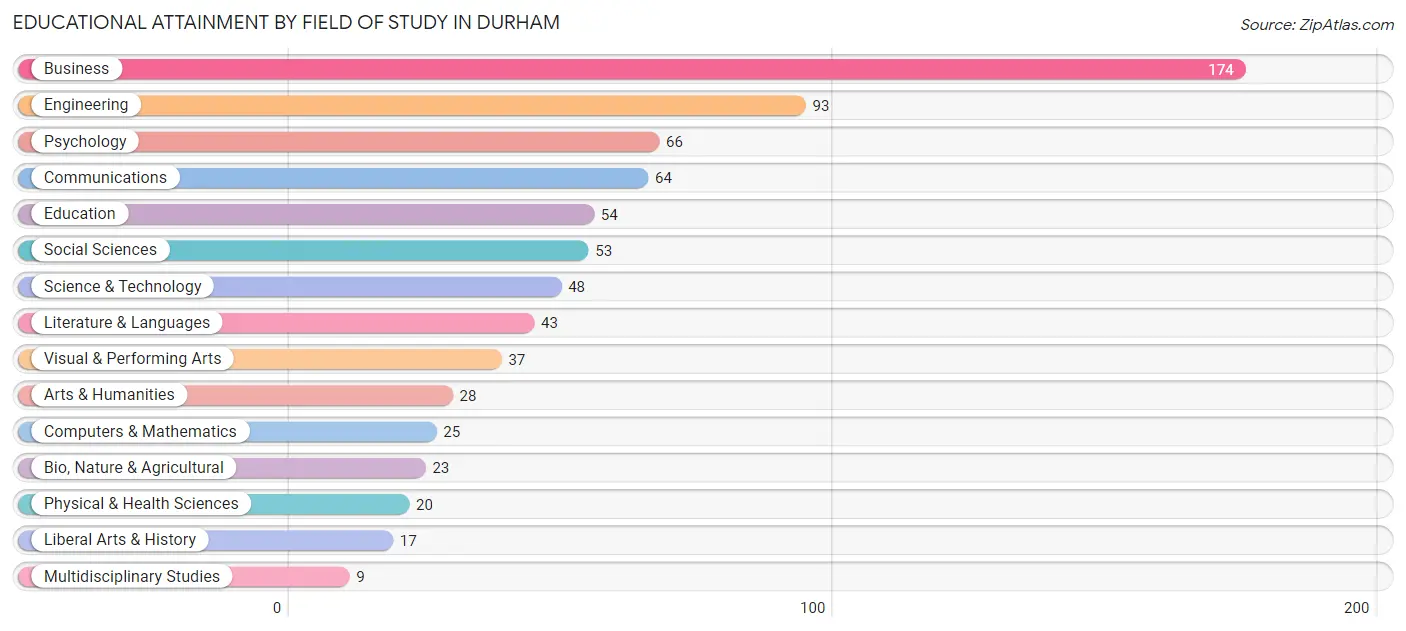
Educational Attainment by Field of Study in Durham
Business (174 | 23.1%), engineering (93 | 12.3%), psychology (66 | 8.7%), communications (64 | 8.5%), and education (54 | 7.2%) are the most common fields of study among 754 individuals in Durham who have obtained a bachelor's degree or higher.
| Field of Study | # Graduates | % Graduates |
| Computers & Mathematics | 25 | 3.3% |
| Bio, Nature & Agricultural | 23 | 3.0% |
| Physical & Health Sciences | 20 | 2.6% |
| Psychology | 66 | 8.7% |
| Social Sciences | 53 | 7.0% |
| Engineering | 93 | 12.3% |
| Multidisciplinary Studies | 9 | 1.2% |
| Science & Technology | 48 | 6.4% |
| Business | 174 | 23.1% |
| Education | 54 | 7.2% |
| Literature & Languages | 43 | 5.7% |
| Liberal Arts & History | 17 | 2.2% |
| Visual & Performing Arts | 37 | 4.9% |
| Communications | 64 | 8.5% |
| Arts & Humanities | 28 | 3.7% |
| Total | 754 | 100.0% |
Transportation & Commute in Durham
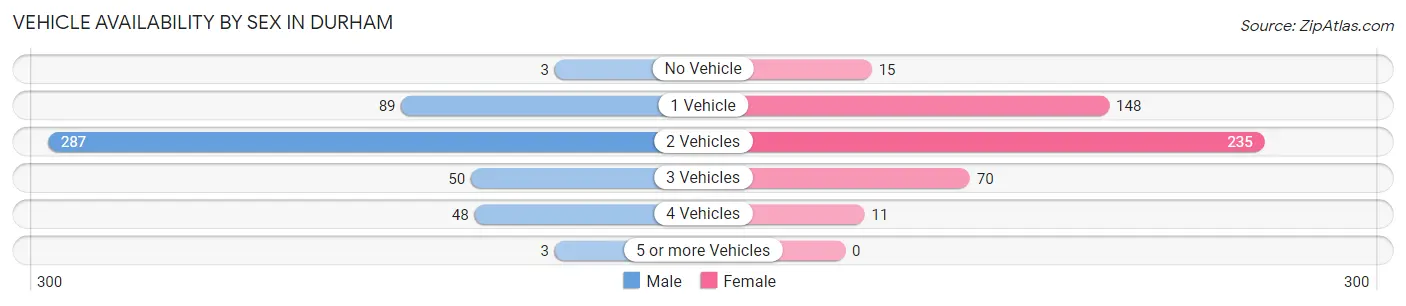
Vehicle Availability by Sex in Durham
The most prevalent vehicle ownership categories in Durham are males with 2 vehicles (287, accounting for 59.8%) and females with 2 vehicles (235, making up 59.9%).
| Vehicles Available | Male | Female |
| No Vehicle | 3 (0.6%) | 15 (3.1%) |
| 1 Vehicle | 89 (18.5%) | 148 (30.9%) |
| 2 Vehicles | 287 (59.8%) | 235 (49.1%) |
| 3 Vehicles | 50 (10.4%) | 70 (14.6%) |
| 4 Vehicles | 48 (10.0%) | 11 (2.3%) |
| 5 or more Vehicles | 3 (0.6%) | 0 (0.0%) |
| Total | 480 (100.0%) | 479 (100.0%) |
Commute Time in Durham
The most frequently occuring commute durations in Durham are 10 to 14 minutes (205 commuters, 27.4%), 20 to 24 minutes (135 commuters, 18.0%), and 30 to 34 minutes (123 commuters, 16.4%).
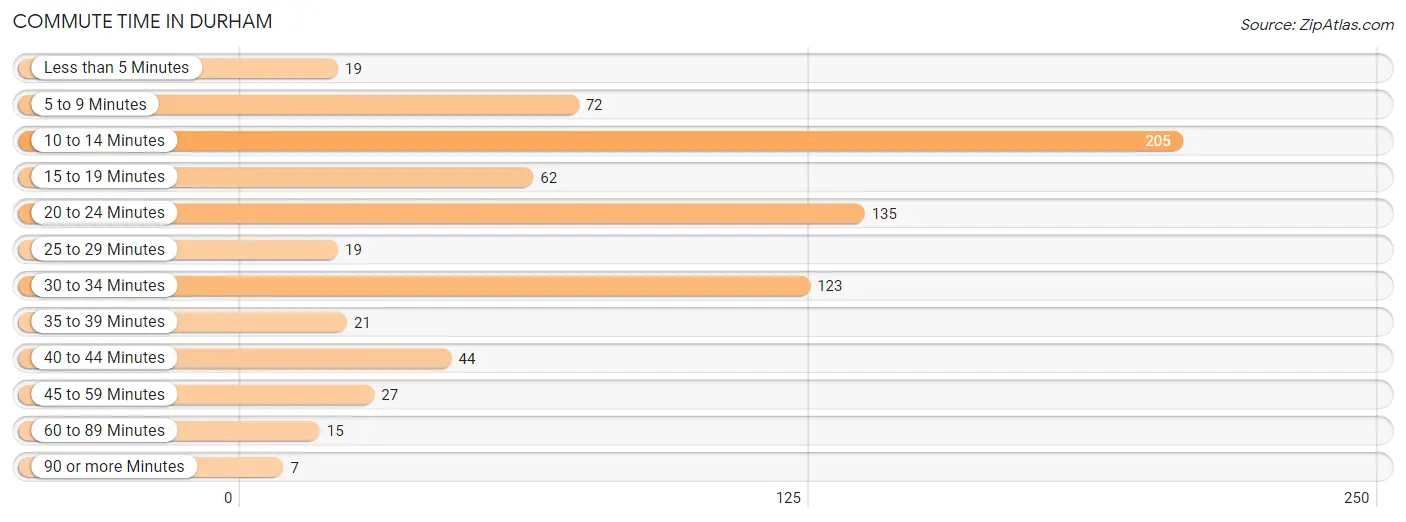
| Commute Time | # Commuters | % Commuters |
| Less than 5 Minutes | 19 | 2.5% |
| 5 to 9 Minutes | 72 | 9.6% |
| 10 to 14 Minutes | 205 | 27.4% |
| 15 to 19 Minutes | 62 | 8.3% |
| 20 to 24 Minutes | 135 | 18.0% |
| 25 to 29 Minutes | 19 | 2.5% |
| 30 to 34 Minutes | 123 | 16.4% |
| 35 to 39 Minutes | 21 | 2.8% |
| 40 to 44 Minutes | 44 | 5.9% |
| 45 to 59 Minutes | 27 | 3.6% |
| 60 to 89 Minutes | 15 | 2.0% |
| 90 or more Minutes | 7 | 0.9% |
Commute Time by Sex in Durham
The most common commute times in Durham are 30 to 34 minutes (73 commuters, 19.6%) for males and 10 to 14 minutes (133 commuters, 35.3%) for females.
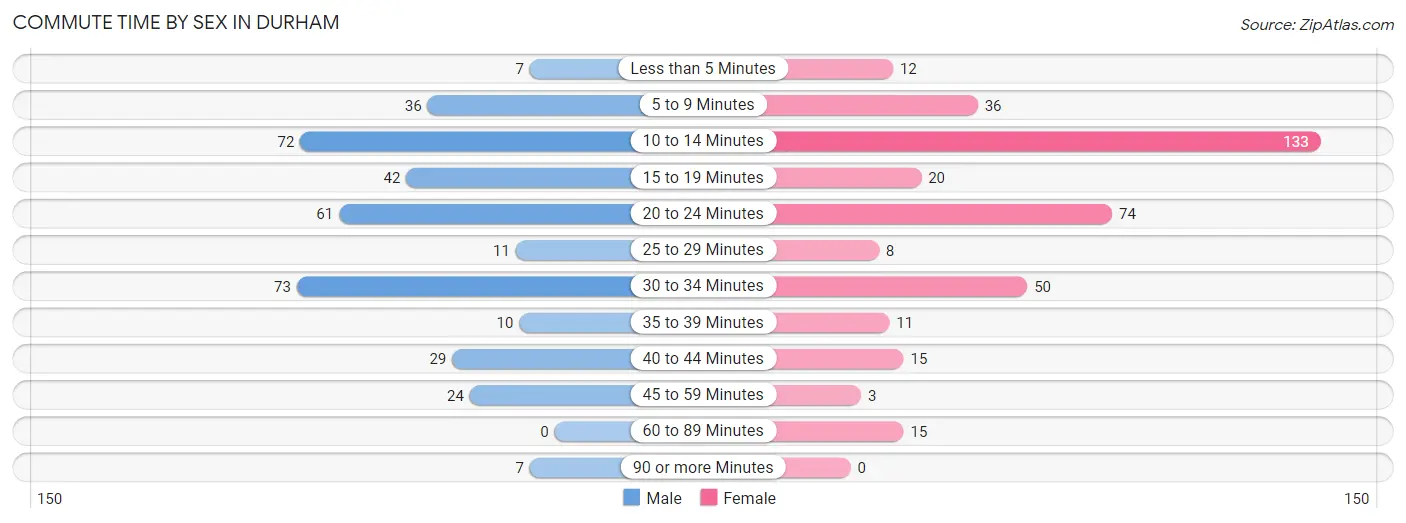
| Commute Time | Male | Female |
| Less than 5 Minutes | 7 (1.9%) | 12 (3.2%) |
| 5 to 9 Minutes | 36 (9.7%) | 36 (9.6%) |
| 10 to 14 Minutes | 72 (19.4%) | 133 (35.3%) |
| 15 to 19 Minutes | 42 (11.3%) | 20 (5.3%) |
| 20 to 24 Minutes | 61 (16.4%) | 74 (19.6%) |
| 25 to 29 Minutes | 11 (3.0%) | 8 (2.1%) |
| 30 to 34 Minutes | 73 (19.6%) | 50 (13.3%) |
| 35 to 39 Minutes | 10 (2.7%) | 11 (2.9%) |
| 40 to 44 Minutes | 29 (7.8%) | 15 (4.0%) |
| 45 to 59 Minutes | 24 (6.5%) | 3 (0.8%) |
| 60 to 89 Minutes | 0 (0.0%) | 15 (4.0%) |
| 90 or more Minutes | 7 (1.9%) | 0 (0.0%) |
Time of Departure to Work by Sex in Durham
The most frequent times of departure to work in Durham are 7:30 AM to 7:59 AM (62, 16.7%) for males and 8:00 AM to 8:29 AM (93, 24.7%) for females.
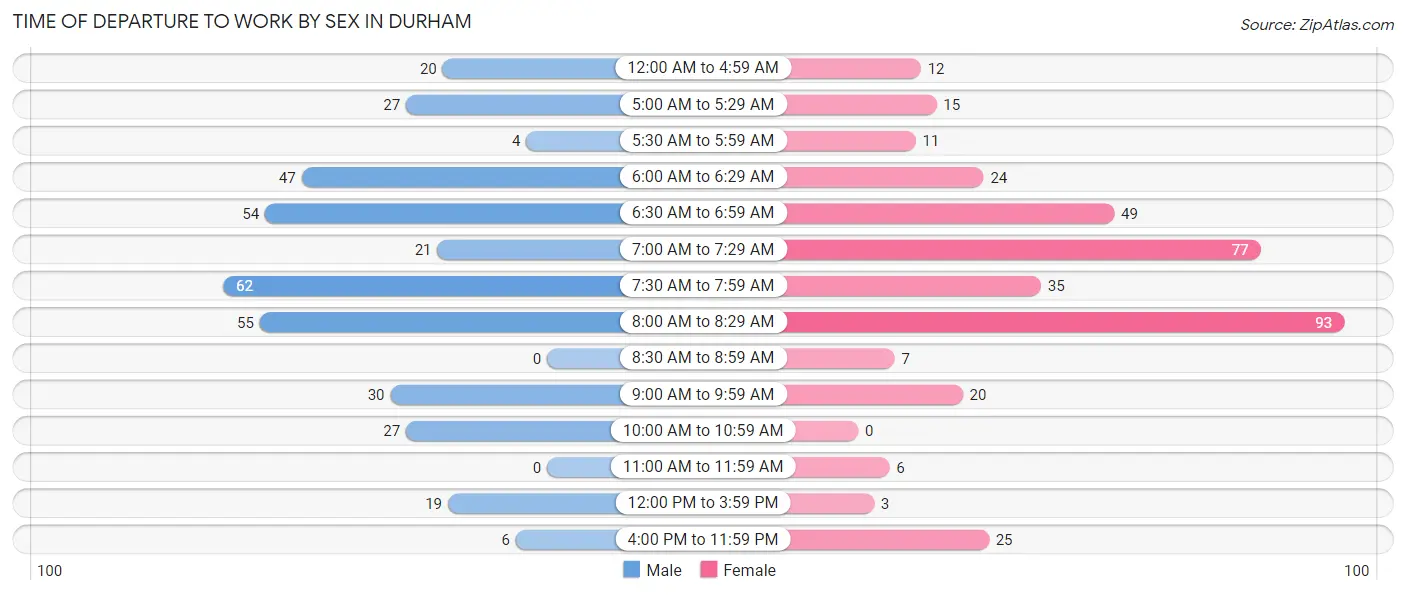
| Time of Departure | Male | Female |
| 12:00 AM to 4:59 AM | 20 (5.4%) | 12 (3.2%) |
| 5:00 AM to 5:29 AM | 27 (7.3%) | 15 (4.0%) |
| 5:30 AM to 5:59 AM | 4 (1.1%) | 11 (2.9%) |
| 6:00 AM to 6:29 AM | 47 (12.6%) | 24 (6.4%) |
| 6:30 AM to 6:59 AM | 54 (14.5%) | 49 (13.0%) |
| 7:00 AM to 7:29 AM | 21 (5.7%) | 77 (20.4%) |
| 7:30 AM to 7:59 AM | 62 (16.7%) | 35 (9.3%) |
| 8:00 AM to 8:29 AM | 55 (14.8%) | 93 (24.7%) |
| 8:30 AM to 8:59 AM | 0 (0.0%) | 7 (1.9%) |
| 9:00 AM to 9:59 AM | 30 (8.1%) | 20 (5.3%) |
| 10:00 AM to 10:59 AM | 27 (7.3%) | 0 (0.0%) |
| 11:00 AM to 11:59 AM | 0 (0.0%) | 6 (1.6%) |
| 12:00 PM to 3:59 PM | 19 (5.1%) | 3 (0.8%) |
| 4:00 PM to 11:59 PM | 6 (1.6%) | 25 (6.6%) |
| Total | 372 (100.0%) | 377 (100.0%) |
Housing Occupancy in Durham
Occupancy by Ownership in Durham
Of the total 851 dwellings in Durham, owner-occupied units account for 355 (41.7%), while renter-occupied units make up 496 (58.3%).
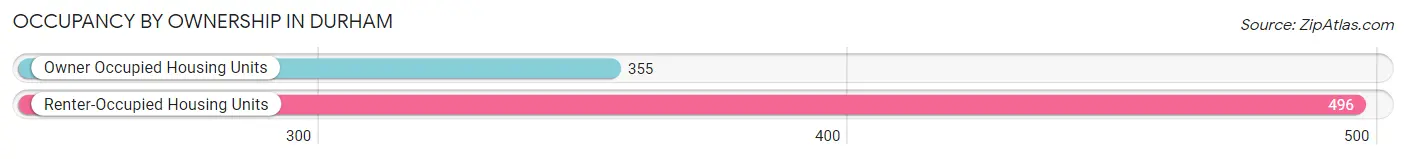
| Occupancy | # Housing Units | % Housing Units |
| Owner Occupied Housing Units | 355 | 41.7% |
| Renter-Occupied Housing Units | 496 | 58.3% |
| Total Occupied Housing Units | 851 | 100.0% |
Occupancy by Household Size in Durham
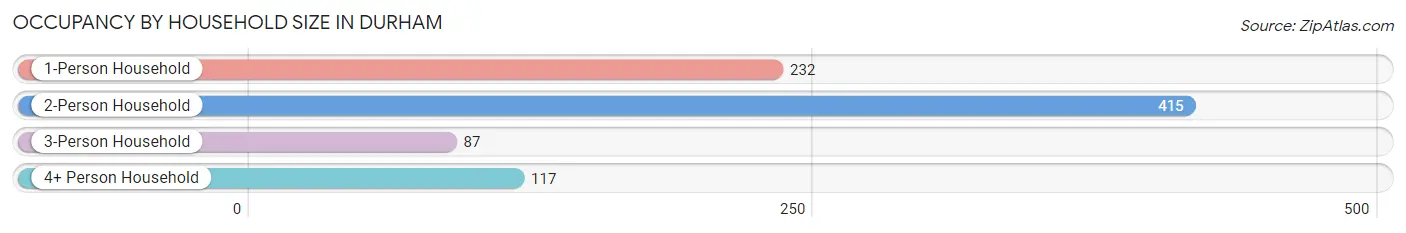
| Household Size | # Housing Units | % Housing Units |
| 1-Person Household | 232 | 27.3% |
| 2-Person Household | 415 | 48.8% |
| 3-Person Household | 87 | 10.2% |
| 4+ Person Household | 117 | 13.8% |
| Total Housing Units | 851 | 100.0% |
Occupancy by Ownership by Household Size in Durham
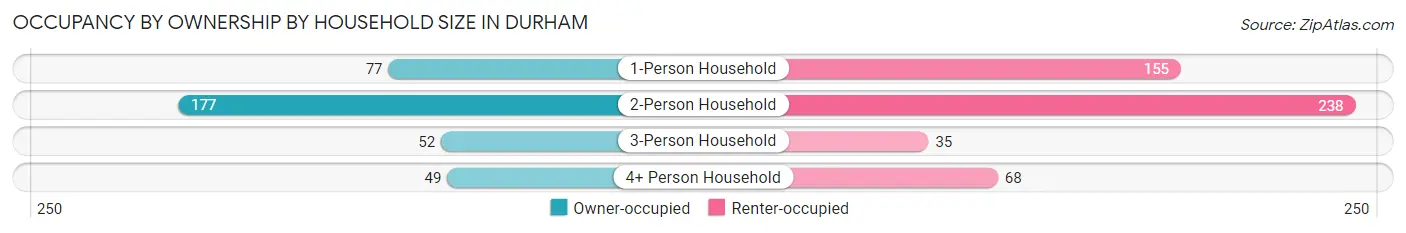
| Household Size | Owner-occupied | Renter-occupied |
| 1-Person Household | 77 (33.2%) | 155 (66.8%) |
| 2-Person Household | 177 (42.6%) | 238 (57.4%) |
| 3-Person Household | 52 (59.8%) | 35 (40.2%) |
| 4+ Person Household | 49 (41.9%) | 68 (58.1%) |
| Total Housing Units | 355 (41.7%) | 496 (58.3%) |
Occupancy by Educational Attainment in Durham
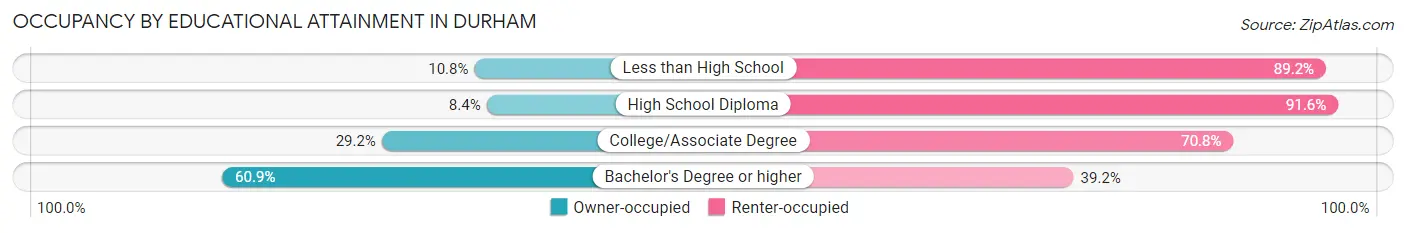
| Household Size | Owner-occupied | Renter-occupied |
| Less than High School | 9 (10.8%) | 74 (89.2%) |
| High School Diploma | 8 (8.4%) | 87 (91.6%) |
| College/Associate Degree | 66 (29.2%) | 160 (70.8%) |
| Bachelor's Degree or higher | 272 (60.9%) | 175 (39.2%) |
Occupancy by Age of Householder in Durham
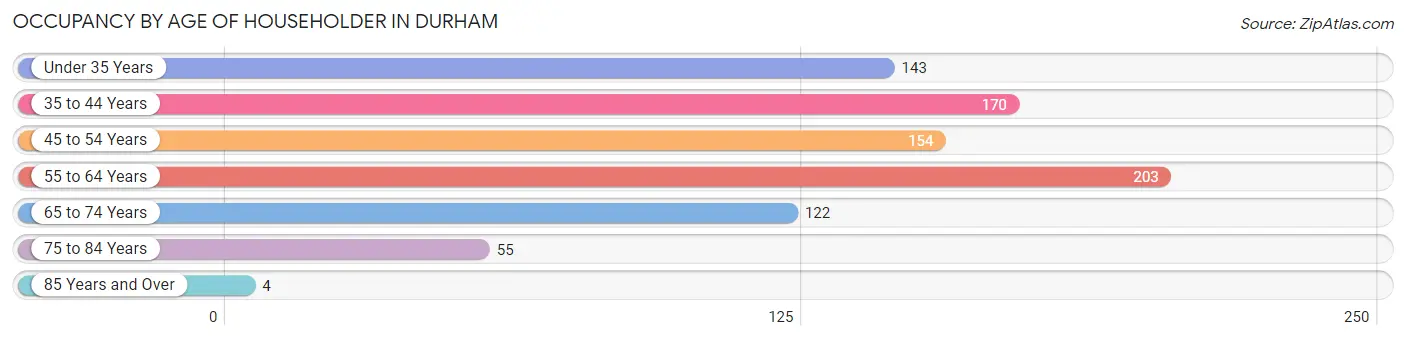
| Age Bracket | # Households | % Households |
| Under 35 Years | 143 | 16.8% |
| 35 to 44 Years | 170 | 20.0% |
| 45 to 54 Years | 154 | 18.1% |
| 55 to 64 Years | 203 | 23.8% |
| 65 to 74 Years | 122 | 14.3% |
| 75 to 84 Years | 55 | 6.5% |
| 85 Years and Over | 4 | 0.5% |
| Total | 851 | 100.0% |
Housing Finances in Durham
Median Income by Occupancy in Durham
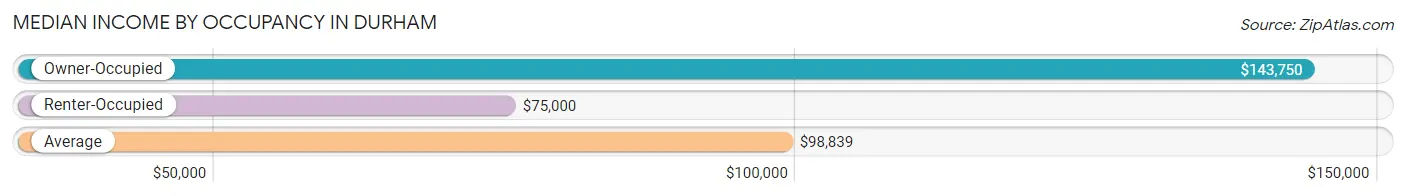
| Occupancy Type | # Households | Median Income |
| Owner-Occupied | 355 (41.7%) | $143,750 |
| Renter-Occupied | 496 (58.3%) | $75,000 |
| Average | 851 (100.0%) | $98,839 |
Occupancy by Householder Income Bracket in Durham
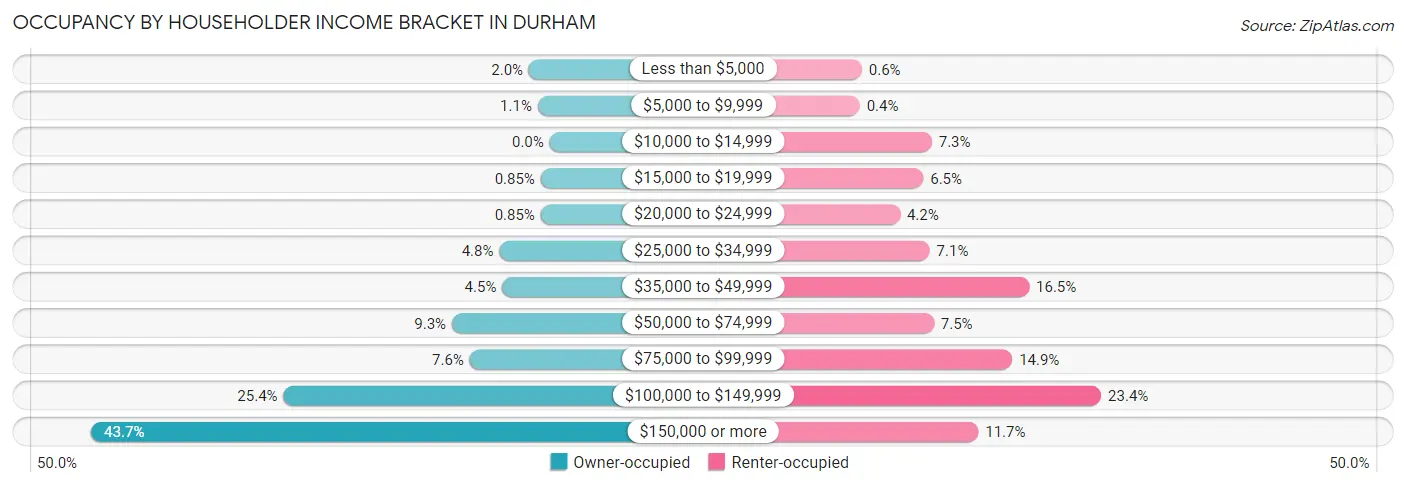
| Income Bracket | Owner-occupied | Renter-occupied |
| Less than $5,000 | 7 (2.0%) | 3 (0.6%) |
| $5,000 to $9,999 | 4 (1.1%) | 2 (0.4%) |
| $10,000 to $14,999 | 0 (0.0%) | 36 (7.3%) |
| $15,000 to $19,999 | 3 (0.9%) | 32 (6.5%) |
| $20,000 to $24,999 | 3 (0.9%) | 21 (4.2%) |
| $25,000 to $34,999 | 17 (4.8%) | 35 (7.1%) |
| $35,000 to $49,999 | 16 (4.5%) | 82 (16.5%) |
| $50,000 to $74,999 | 33 (9.3%) | 37 (7.5%) |
| $75,000 to $99,999 | 27 (7.6%) | 74 (14.9%) |
| $100,000 to $149,999 | 90 (25.4%) | 116 (23.4%) |
| $150,000 or more | 155 (43.7%) | 58 (11.7%) |
| Total | 355 (100.0%) | 496 (100.0%) |
Monthly Housing Cost Tiers in Durham
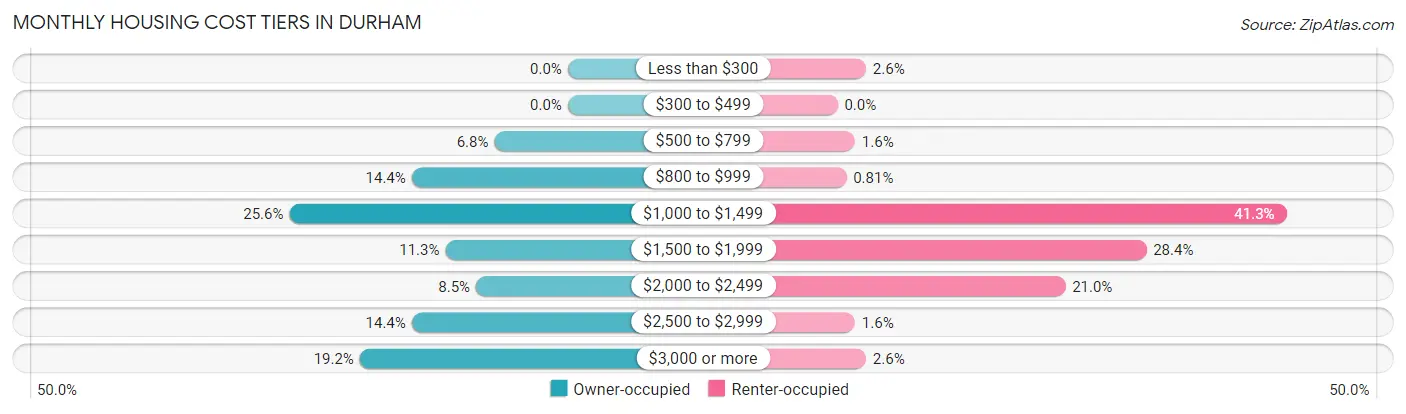
| Monthly Cost | Owner-occupied | Renter-occupied |
| Less than $300 | 0 (0.0%) | 13 (2.6%) |
| $300 to $499 | 0 (0.0%) | 0 (0.0%) |
| $500 to $799 | 24 (6.8%) | 8 (1.6%) |
| $800 to $999 | 51 (14.4%) | 4 (0.8%) |
| $1,000 to $1,499 | 91 (25.6%) | 205 (41.3%) |
| $1,500 to $1,999 | 40 (11.3%) | 141 (28.4%) |
| $2,000 to $2,499 | 30 (8.5%) | 104 (21.0%) |
| $2,500 to $2,999 | 51 (14.4%) | 8 (1.6%) |
| $3,000 or more | 68 (19.2%) | 13 (2.6%) |
| Total | 355 (100.0%) | 496 (100.0%) |
Physical Housing Characteristics in Durham
Housing Structures in Durham
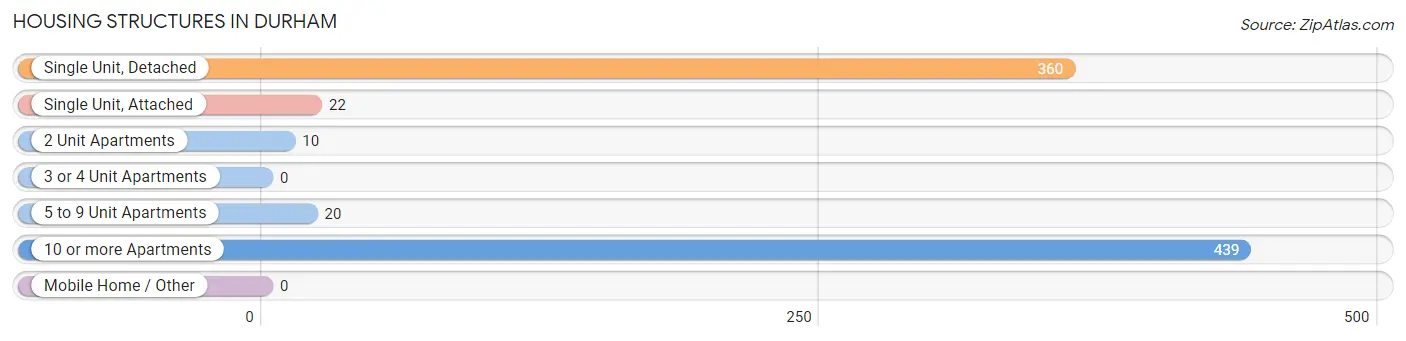
| Structure Type | # Housing Units | % Housing Units |
| Single Unit, Detached | 360 | 42.3% |
| Single Unit, Attached | 22 | 2.6% |
| 2 Unit Apartments | 10 | 1.2% |
| 3 or 4 Unit Apartments | 0 | 0.0% |
| 5 to 9 Unit Apartments | 20 | 2.4% |
| 10 or more Apartments | 439 | 51.6% |
| Mobile Home / Other | 0 | 0.0% |
| Total | 851 | 100.0% |
Housing Structures by Occupancy in Durham
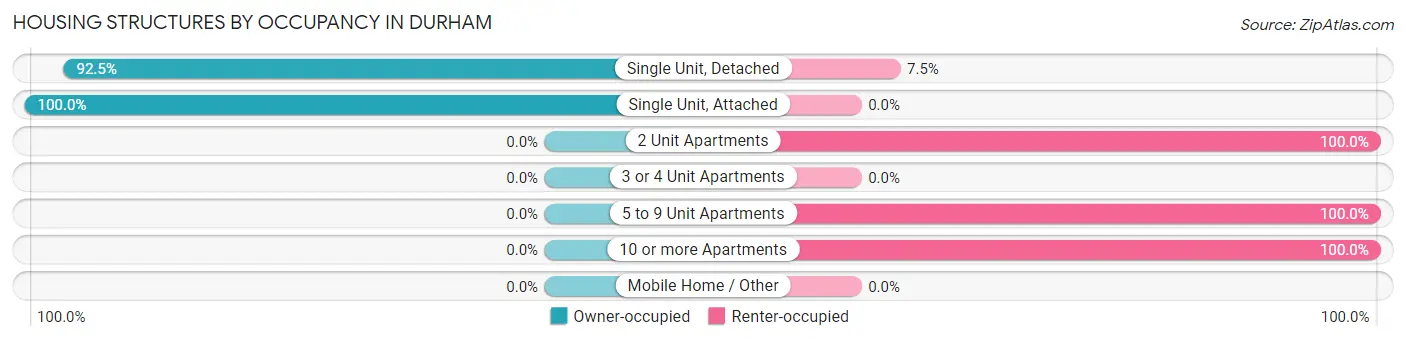
| Structure Type | Owner-occupied | Renter-occupied |
| Single Unit, Detached | 333 (92.5%) | 27 (7.5%) |
| Single Unit, Attached | 22 (100.0%) | 0 (0.0%) |
| 2 Unit Apartments | 0 (0.0%) | 10 (100.0%) |
| 3 or 4 Unit Apartments | 0 (0.0%) | 0 (0.0%) |
| 5 to 9 Unit Apartments | 0 (0.0%) | 20 (100.0%) |
| 10 or more Apartments | 0 (0.0%) | 439 (100.0%) |
| Mobile Home / Other | 0 (0.0%) | 0 (0.0%) |
| Total | 355 (41.7%) | 496 (58.3%) |
Housing Structures by Number of Rooms in Durham
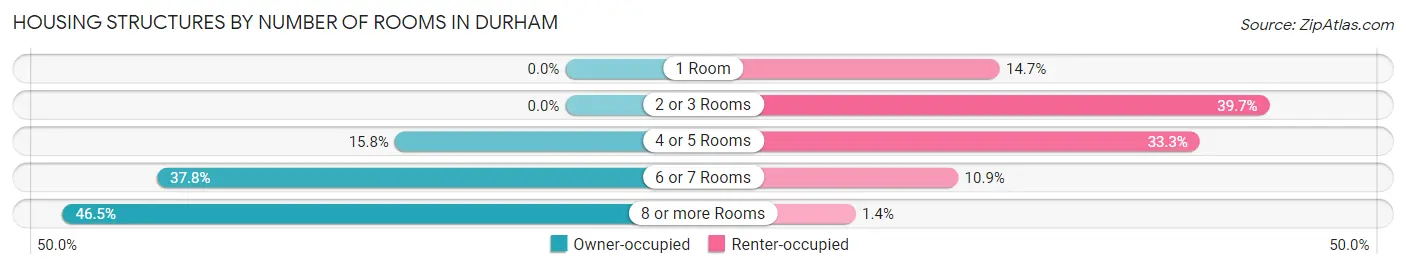
| Number of Rooms | Owner-occupied | Renter-occupied |
| 1 Room | 0 (0.0%) | 73 (14.7%) |
| 2 or 3 Rooms | 0 (0.0%) | 197 (39.7%) |
| 4 or 5 Rooms | 56 (15.8%) | 165 (33.3%) |
| 6 or 7 Rooms | 134 (37.8%) | 54 (10.9%) |
| 8 or more Rooms | 165 (46.5%) | 7 (1.4%) |
| Total | 355 (100.0%) | 496 (100.0%) |
Housing Structure by Heating Type in Durham
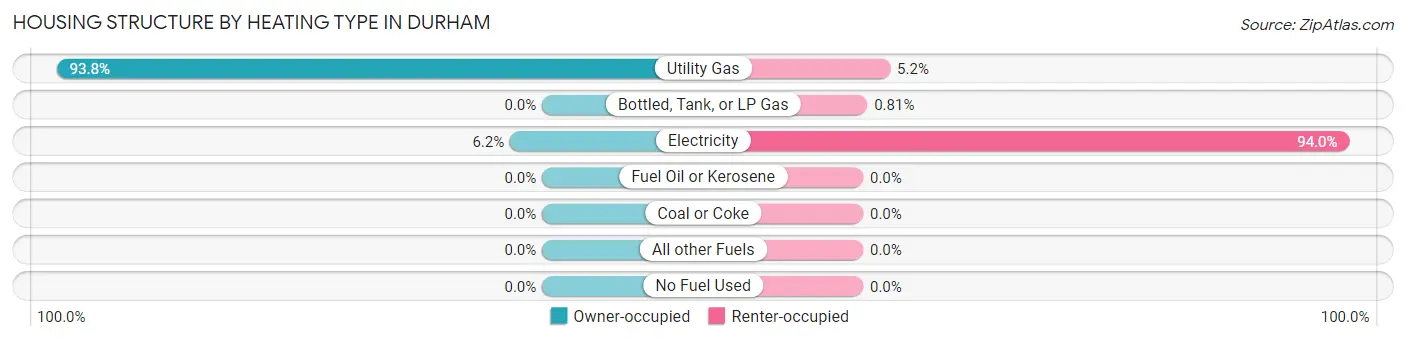
| Heating Type | Owner-occupied | Renter-occupied |
| Utility Gas | 333 (93.8%) | 26 (5.2%) |
| Bottled, Tank, or LP Gas | 0 (0.0%) | 4 (0.8%) |
| Electricity | 22 (6.2%) | 466 (94.0%) |
| Fuel Oil or Kerosene | 0 (0.0%) | 0 (0.0%) |
| Coal or Coke | 0 (0.0%) | 0 (0.0%) |
| All other Fuels | 0 (0.0%) | 0 (0.0%) |
| No Fuel Used | 0 (0.0%) | 0 (0.0%) |
| Total | 355 (100.0%) | 496 (100.0%) |
Household Vehicle Usage in Durham
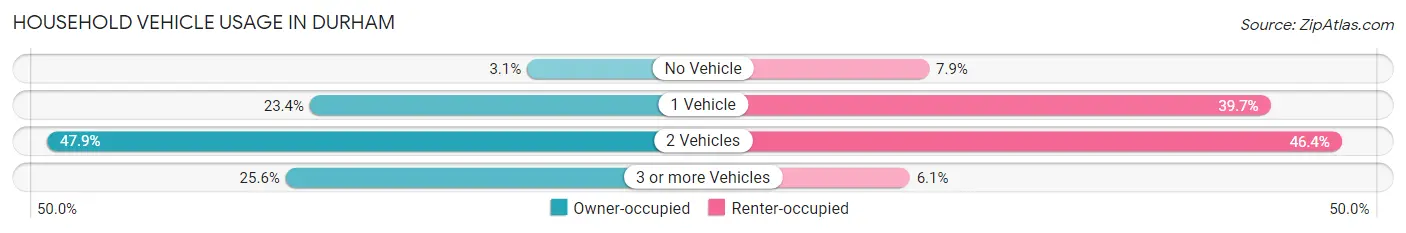
| Vehicles per Household | Owner-occupied | Renter-occupied |
| No Vehicle | 11 (3.1%) | 39 (7.9%) |
| 1 Vehicle | 83 (23.4%) | 197 (39.7%) |
| 2 Vehicles | 170 (47.9%) | 230 (46.4%) |
| 3 or more Vehicles | 91 (25.6%) | 30 (6.0%) |
| Total | 355 (100.0%) | 496 (100.0%) |
Real Estate & Mortgages in Durham
Real Estate and Mortgage Overview in Durham
| Characteristic | Without Mortgage | With Mortgage |
| Housing Units | 119 | 236 |
| Median Property Value | $737,700 | $647,800 |
| Median Household Income | $135,781 | $101 |
| Monthly Housing Costs | $965 | $68 |
| Real Estate Taxes | $6,138 | $0 |
Property Value by Mortgage Status in Durham
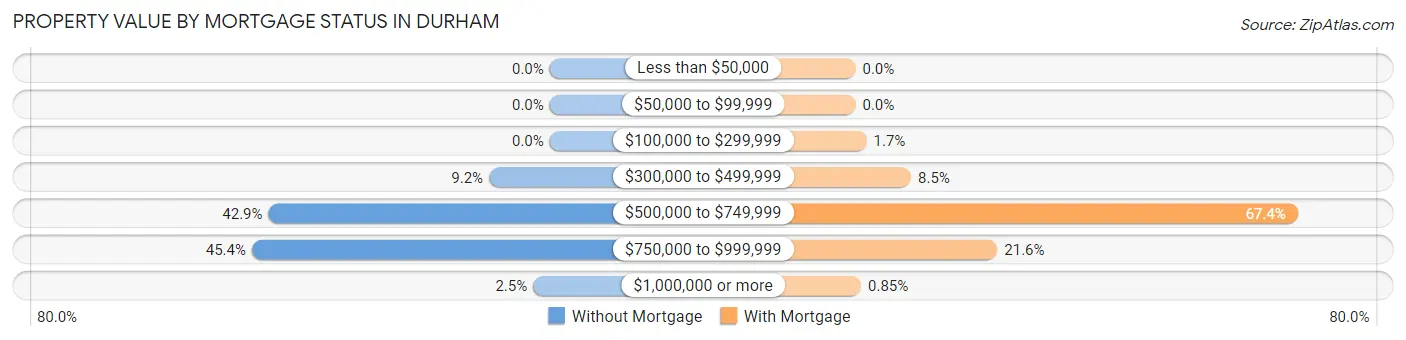
| Property Value | Without Mortgage | With Mortgage |
| Less than $50,000 | 0 (0.0%) | 0 (0.0%) |
| $50,000 to $99,999 | 0 (0.0%) | 0 (0.0%) |
| $100,000 to $299,999 | 0 (0.0%) | 4 (1.7%) |
| $300,000 to $499,999 | 11 (9.2%) | 20 (8.5%) |
| $500,000 to $749,999 | 51 (42.9%) | 159 (67.4%) |
| $750,000 to $999,999 | 54 (45.4%) | 51 (21.6%) |
| $1,000,000 or more | 3 (2.5%) | 2 (0.9%) |
| Total | 119 (100.0%) | 236 (100.0%) |
Household Income by Mortgage Status in Durham
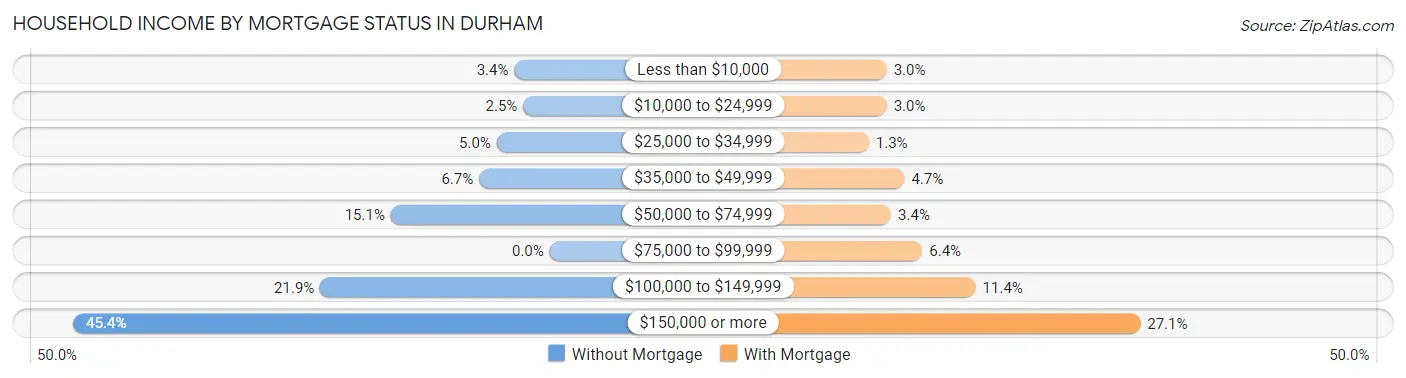
| Household Income | Without Mortgage | With Mortgage |
| Less than $10,000 | 4 (3.4%) | 7 (3.0%) |
| $10,000 to $24,999 | 3 (2.5%) | 7 (3.0%) |
| $25,000 to $34,999 | 6 (5.0%) | 3 (1.3%) |
| $35,000 to $49,999 | 8 (6.7%) | 11 (4.7%) |
| $50,000 to $74,999 | 18 (15.1%) | 8 (3.4%) |
| $75,000 to $99,999 | 0 (0.0%) | 15 (6.4%) |
| $100,000 to $149,999 | 26 (21.8%) | 27 (11.4%) |
| $150,000 or more | 54 (45.4%) | 64 (27.1%) |
| Total | 119 (100.0%) | 236 (100.0%) |
Property Value to Household Income Ratio in Durham
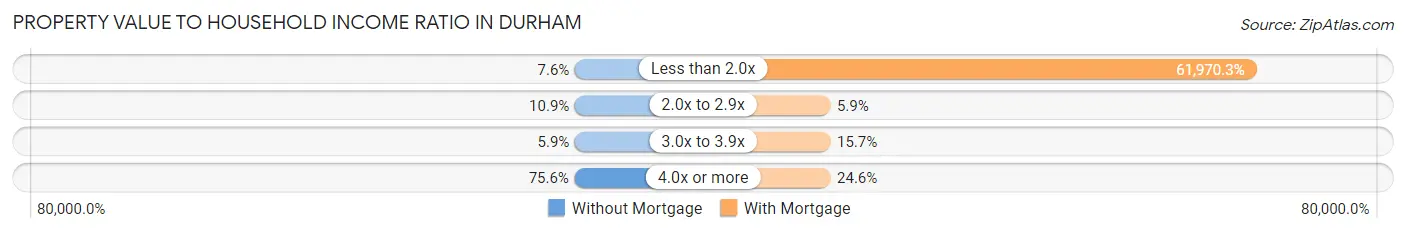
| Value-to-Income Ratio | Without Mortgage | With Mortgage |
| Less than 2.0x | 9 (7.6%) | 146,250 (61,970.3%) |
| 2.0x to 2.9x | 13 (10.9%) | 14 (5.9%) |
| 3.0x to 3.9x | 7 (5.9%) | 37 (15.7%) |
| 4.0x or more | 90 (75.6%) | 58 (24.6%) |
| Total | 119 (100.0%) | 236 (100.0%) |
Real Estate Taxes by Mortgage Status in Durham
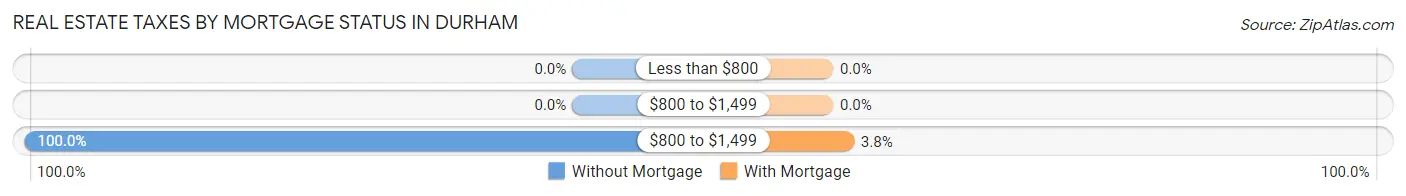
| Property Taxes | Without Mortgage | With Mortgage |
| Less than $800 | 0 (0.0%) | 0 (0.0%) |
| $800 to $1,499 | 0 (0.0%) | 0 (0.0%) |
| $800 to $1,499 | 119 (100.0%) | 9 (3.8%) |
| Total | 119 (100.0%) | 236 (100.0%) |
Health & Disability in Durham
Health Insurance Coverage by Age in Durham
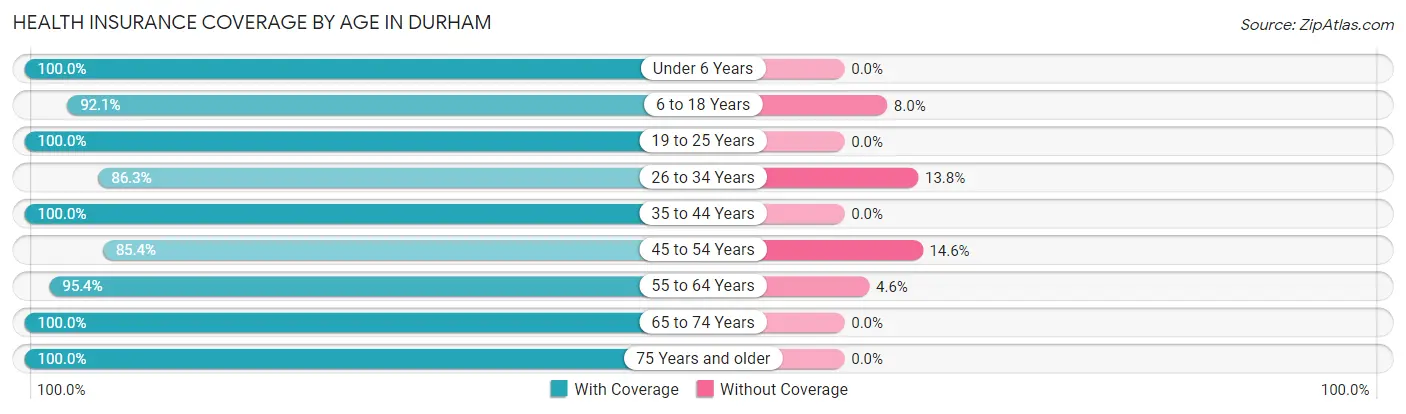
| Age Bracket | With Coverage | Without Coverage |
| Under 6 Years | 101 (100.0%) | 0 (0.0%) |
| 6 to 18 Years | 220 (92.0%) | 19 (8.0%) |
| 19 to 25 Years | 125 (100.0%) | 0 (0.0%) |
| 26 to 34 Years | 207 (86.3%) | 33 (13.8%) |
| 35 to 44 Years | 258 (100.0%) | 0 (0.0%) |
| 45 to 54 Years | 217 (85.4%) | 37 (14.6%) |
| 55 to 64 Years | 310 (95.4%) | 15 (4.6%) |
| 65 to 74 Years | 224 (100.0%) | 0 (0.0%) |
| 75 Years and older | 94 (100.0%) | 0 (0.0%) |
| Total | 1,756 (94.4%) | 104 (5.6%) |
Health Insurance Coverage by Citizenship Status in Durham
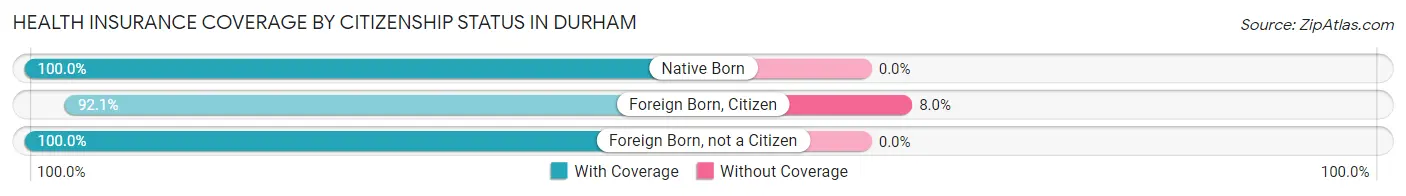
| Citizenship Status | With Coverage | Without Coverage |
| Native Born | 101 (100.0%) | 0 (0.0%) |
| Foreign Born, Citizen | 220 (92.0%) | 19 (8.0%) |
| Foreign Born, not a Citizen | 125 (100.0%) | 0 (0.0%) |
Health Insurance Coverage by Household Income in Durham
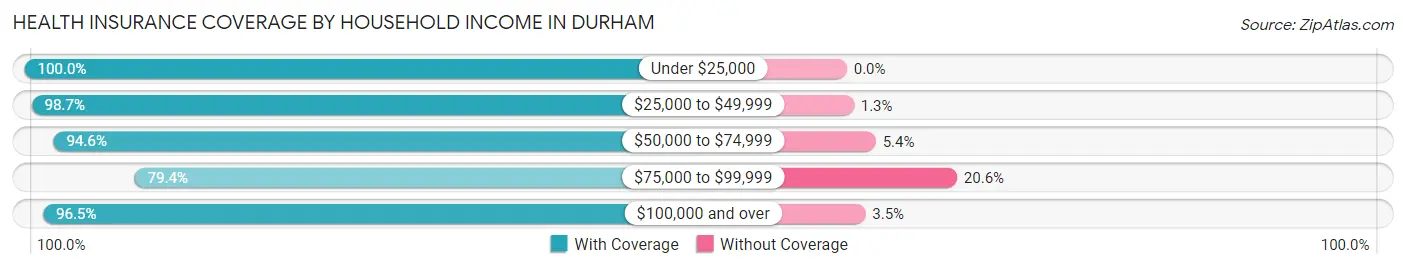
| Household Income | With Coverage | Without Coverage |
| Under $25,000 | 181 (100.0%) | 0 (0.0%) |
| $25,000 to $49,999 | 302 (98.7%) | 4 (1.3%) |
| $50,000 to $74,999 | 157 (94.6%) | 9 (5.4%) |
| $75,000 to $99,999 | 227 (79.4%) | 59 (20.6%) |
| $100,000 and over | 889 (96.5%) | 32 (3.5%) |
Public vs Private Health Insurance Coverage by Age in Durham
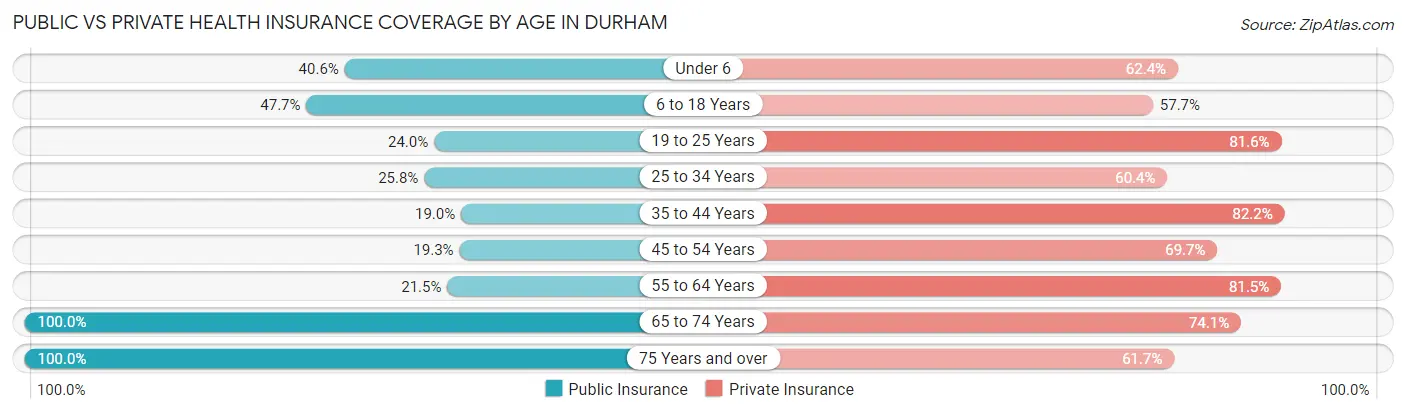
| Age Bracket | Public Insurance | Private Insurance |
| Under 6 | 41 (40.6%) | 63 (62.4%) |
| 6 to 18 Years | 114 (47.7%) | 138 (57.7%) |
| 19 to 25 Years | 30 (24.0%) | 102 (81.6%) |
| 25 to 34 Years | 62 (25.8%) | 145 (60.4%) |
| 35 to 44 Years | 49 (19.0%) | 212 (82.2%) |
| 45 to 54 Years | 49 (19.3%) | 177 (69.7%) |
| 55 to 64 Years | 70 (21.5%) | 265 (81.5%) |
| 65 to 74 Years | 224 (100.0%) | 166 (74.1%) |
| 75 Years and over | 94 (100.0%) | 58 (61.7%) |
| Total | 733 (39.4%) | 1,326 (71.3%) |
Disability Status by Sex by Age in Durham
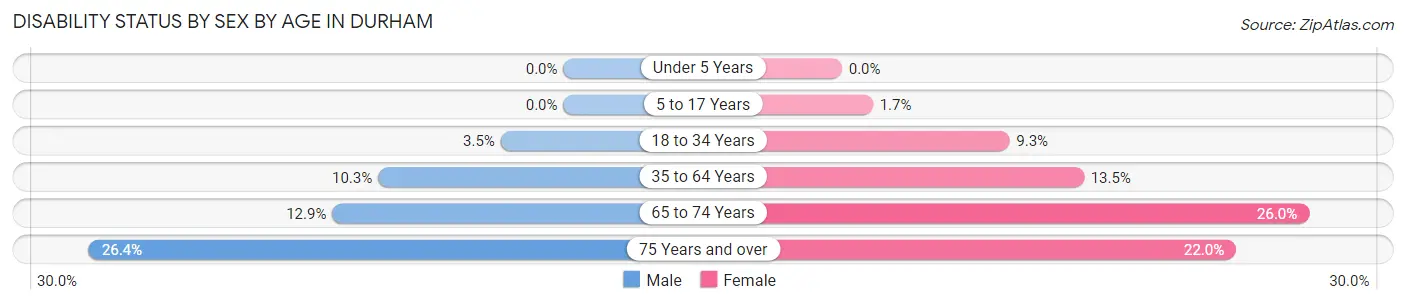
| Age Bracket | Male | Female |
| Under 5 Years | 0 (0.0%) | 0 (0.0%) |
| 5 to 17 Years | 0 (0.0%) | 2 (1.7%) |
| 18 to 34 Years | 6 (3.5%) | 18 (9.3%) |
| 35 to 64 Years | 45 (10.3%) | 54 (13.5%) |
| 65 to 74 Years | 13 (12.9%) | 32 (26.0%) |
| 75 Years and over | 14 (26.4%) | 9 (22.0%) |
Disability Class by Sex by Age in Durham
Disability Class: Hearing Difficulty
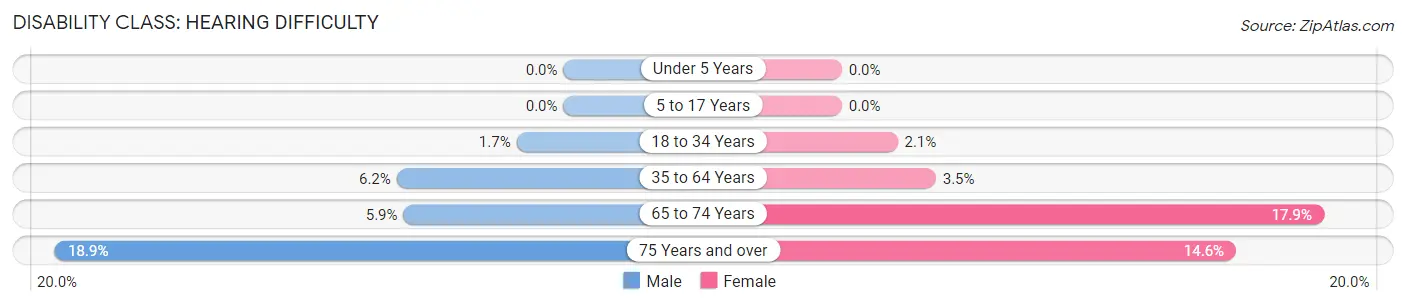
| Age Bracket | Male | Female |
| Under 5 Years | 0 (0.0%) | 0 (0.0%) |
| 5 to 17 Years | 0 (0.0%) | 0 (0.0%) |
| 18 to 34 Years | 3 (1.7%) | 4 (2.1%) |
| 35 to 64 Years | 27 (6.2%) | 14 (3.5%) |
| 65 to 74 Years | 6 (5.9%) | 22 (17.9%) |
| 75 Years and over | 10 (18.9%) | 6 (14.6%) |
Disability Class: Vision Difficulty
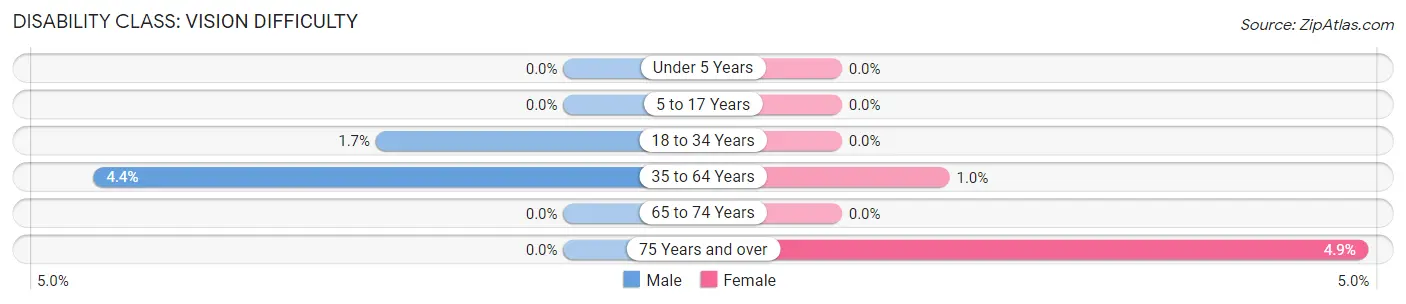
| Age Bracket | Male | Female |
| Under 5 Years | 0 (0.0%) | 0 (0.0%) |
| 5 to 17 Years | 0 (0.0%) | 0 (0.0%) |
| 18 to 34 Years | 3 (1.7%) | 0 (0.0%) |
| 35 to 64 Years | 19 (4.4%) | 4 (1.0%) |
| 65 to 74 Years | 0 (0.0%) | 0 (0.0%) |
| 75 Years and over | 0 (0.0%) | 2 (4.9%) |
Disability Class: Cognitive Difficulty
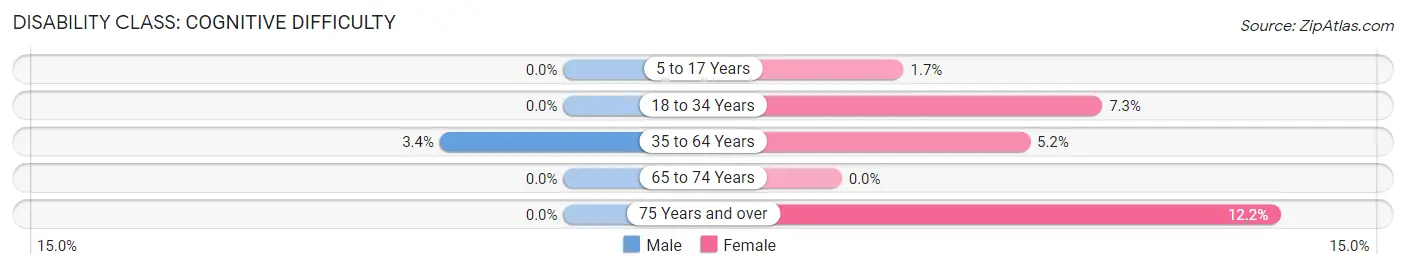
| Age Bracket | Male | Female |
| 5 to 17 Years | 0 (0.0%) | 2 (1.7%) |
| 18 to 34 Years | 0 (0.0%) | 14 (7.2%) |
| 35 to 64 Years | 15 (3.4%) | 21 (5.2%) |
| 65 to 74 Years | 0 (0.0%) | 0 (0.0%) |
| 75 Years and over | 0 (0.0%) | 5 (12.2%) |
Disability Class: Ambulatory Difficulty
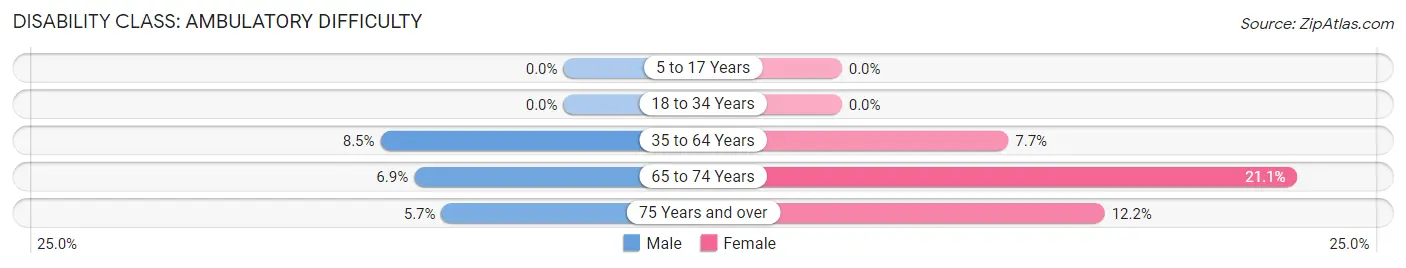
| Age Bracket | Male | Female |
| 5 to 17 Years | 0 (0.0%) | 0 (0.0%) |
| 18 to 34 Years | 0 (0.0%) | 0 (0.0%) |
| 35 to 64 Years | 37 (8.5%) | 31 (7.7%) |
| 65 to 74 Years | 7 (6.9%) | 26 (21.1%) |
| 75 Years and over | 3 (5.7%) | 5 (12.2%) |
Disability Class: Self-Care Difficulty
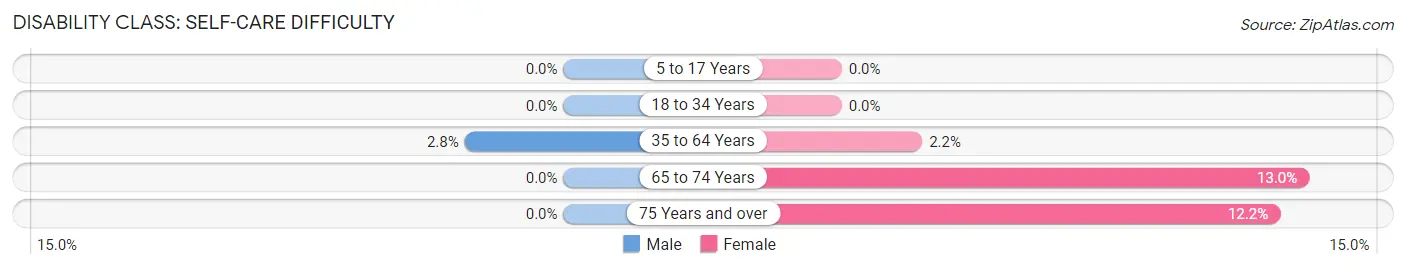
| Age Bracket | Male | Female |
| 5 to 17 Years | 0 (0.0%) | 0 (0.0%) |
| 18 to 34 Years | 0 (0.0%) | 0 (0.0%) |
| 35 to 64 Years | 12 (2.8%) | 9 (2.2%) |
| 65 to 74 Years | 0 (0.0%) | 16 (13.0%) |
| 75 Years and over | 0 (0.0%) | 5 (12.2%) |
Technology Access in Durham
Computing Device Access in Durham
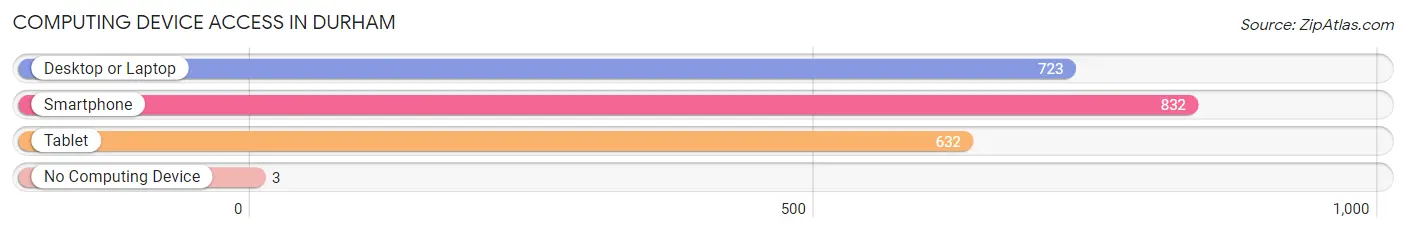
| Device Type | # Households | % Households |
| Desktop or Laptop | 723 | 85.0% |
| Smartphone | 832 | 97.8% |
| Tablet | 632 | 74.3% |
| No Computing Device | 3 | 0.4% |
| Total | 851 | 100.0% |
Internet Access in Durham
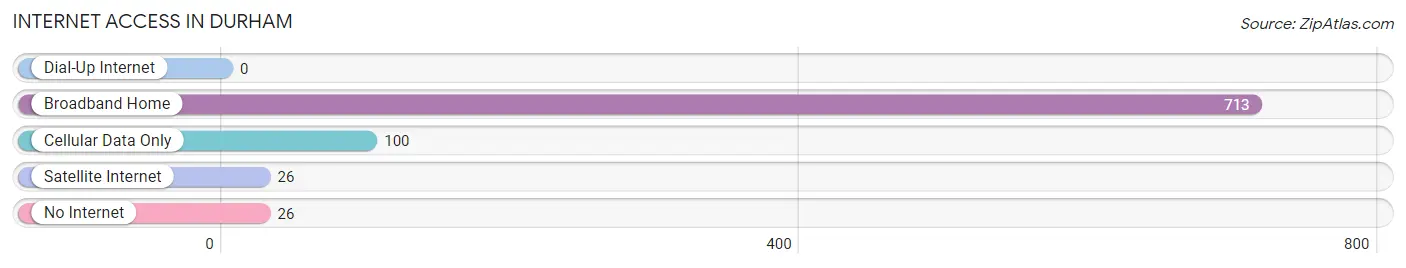
| Internet Type | # Households | % Households |
| Dial-Up Internet | 0 | 0.0% |
| Broadband Home | 713 | 83.8% |
| Cellular Data Only | 100 | 11.7% |
| Satellite Internet | 26 | 3.1% |
| No Internet | 26 | 3.1% |
| Total | 851 | 100.0% |
Durham Summary
Durham is a small unincorporated community located in the foothills of the Cascade Mountains in Lane County, Oregon. It is situated on the banks of the McKenzie River, approximately 20 miles east of Eugene. The community is home to a population of approximately 500 people, and is known for its rural charm and close-knit community.
History
Durham was first settled in the late 1800s by a group of settlers from the Midwest. The settlers were drawn to the area by the abundance of timber and the potential for farming. The first post office was established in 1891, and the town was officially incorporated in 1895.
The town grew slowly over the next few decades, and by the mid-1900s, it had become a popular destination for tourists and outdoor enthusiasts. The town was also home to a number of small businesses, including a sawmill, a general store, and a blacksmith shop.
Geography
Durham is located in the foothills of the Cascade Mountains in Lane County, Oregon. It is situated on the banks of the McKenzie River, approximately 20 miles east of Eugene. The town is surrounded by lush forests and rolling hills, and is home to a variety of wildlife, including deer, elk, and black bears.
The climate in Durham is mild and temperate, with warm summers and cool winters. The average annual temperature is around 50 degrees Fahrenheit, and the average annual precipitation is around 40 inches.
Economy
Durham’s economy is largely based on tourism and outdoor recreation. The town is home to a number of popular attractions, including the McKenzie River National Recreation Trail, the McKenzie River Scenic Byway, and the McKenzie River Whitewater Park.
The town is also home to a number of small businesses, including restaurants, cafes, and shops. The town is also home to a number of small farms, which produce a variety of fruits and vegetables.
Demographics
As of the 2010 census, Durham had a population of 500 people. The racial makeup of the town was 95.2% White, 0.6% African American, 0.4% Native American, 0.2% Asian, 0.2% Pacific Islander, and 3.4% from other races. The median household income was $37,500, and the median family income was $41,250.
Conclusion
Durham is a small unincorporated community located in the foothills of the Cascade Mountains in Lane County, Oregon. It is situated on the banks of the McKenzie River, approximately 20 miles east of Eugene. The town is home to a population of approximately 500 people, and is known for its rural charm and close-knit community. The town’s economy is largely based on tourism and outdoor recreation, and it is home to a number of small businesses and farms. The town has a diverse population, with a median household income of $37,500 and a median family income of $41,250.
Common Questions
What is Per Capita Income in Durham?
Per Capita income in Durham is $57,950.
What is the Median Family Income in Durham?
Median Family Income in Durham is $104,464.
What is the Median Household income in Durham?
Median Household Income in Durham is $98,839.
What is Income or Wage Gap in Durham?
Income or Wage Gap in Durham is 35.5%.
Women in Durham earn 64.5 cents for every dollar earned by a man.
What is Inequality or Gini Index in Durham?
Inequality or Gini Index in Durham is 0.47.
What is the Total Population of Durham?
Total Population of Durham is 1,860.
What is the Total Male Population of Durham?
Total Male Population of Durham is 948.
What is the Total Female Population of Durham?
Total Female Population of Durham is 912.
What is the Ratio of Males per 100 Females in Durham?
There are 103.95 Males per 100 Females in Durham.
What is the Ratio of Females per 100 Males in Durham?
There are 96.20 Females per 100 Males in Durham.
What is the Median Population Age in Durham?
Median Population Age in Durham is 42.7 Years.
What is the Average Family Size in Durham
Average Family Size in Durham is 2.6 People.
What is the Average Household Size in Durham
Average Household Size in Durham is 2.2 People.
How Large is the Labor Force in Durham?
There are 998 People in the Labor Forcein in Durham.
What is the Percentage of People in the Labor Force in Durham?
64.5% of People are in the Labor Force in Durham.
What is the Unemployment Rate in Durham?
Unemployment Rate in Durham is 3.2%.