McGill, NV Map & Demographics
McGill Map
McGill Overview
$35,273
PER CAPITA INCOME
$117,563
AVG FAMILY INCOME
$62,837
AVG HOUSEHOLD INCOME
64.2%
WAGE / INCOME GAP [ % ]
35.8¢/ $1
WAGE / INCOME GAP [ $ ]
0.31
INEQUALITY / GINI INDEX
879
TOTAL POPULATION
457
MALE POPULATION
422
FEMALE POPULATION
108.29
MALES / 100 FEMALES
92.34
FEMALES / 100 MALES
53.3
MEDIAN AGE
2.8
AVG FAMILY SIZE
2.1
AVG HOUSEHOLD SIZE
375
LABOR FORCE [ PEOPLE ]
53.6%
PERCENT IN LABOR FORCE
6.9%
UNEMPLOYMENT RATE
Income in McGill
Income Overview in McGill
Per Capita Income in McGill is $35,273, while median incomes of families and households are $117,563 and $62,837 respectively.
| Characteristic | Number | Measure |
| Per Capita Income | 879 | $35,273 |
| Median Family Income | 237 | $117,563 |
| Mean Family Income | 237 | $85,955 |
| Median Household Income | 415 | $62,837 |
| Mean Household Income | 415 | $69,200 |
| Income Deficit | 237 | $0 |
| Wage / Income Gap (%) | 879 | 64.17% |
| Wage / Income Gap ($) | 879 | 35.83¢ per $1 |
| Gini / Inequality Index | 879 | 0.31 |
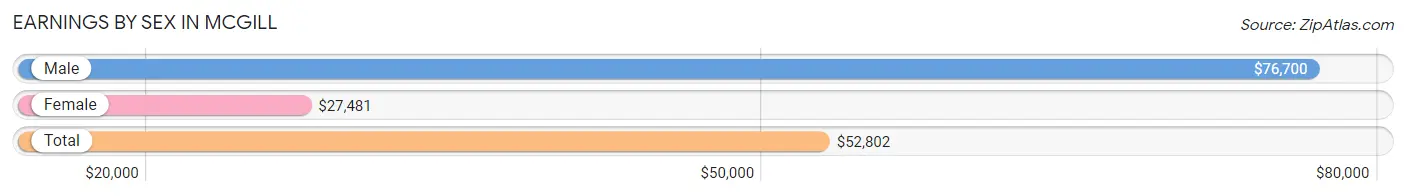
Earnings by Sex in McGill
Average Earnings in McGill are $52,802, $76,700 for men and $27,481 for women, a difference of 64.2%.
| Sex | Number | Average Earnings |
| Male | 136 (36.3%) | $76,700 |
| Female | 239 (63.7%) | $27,481 |
| Total | 375 (100.0%) | $52,802 |
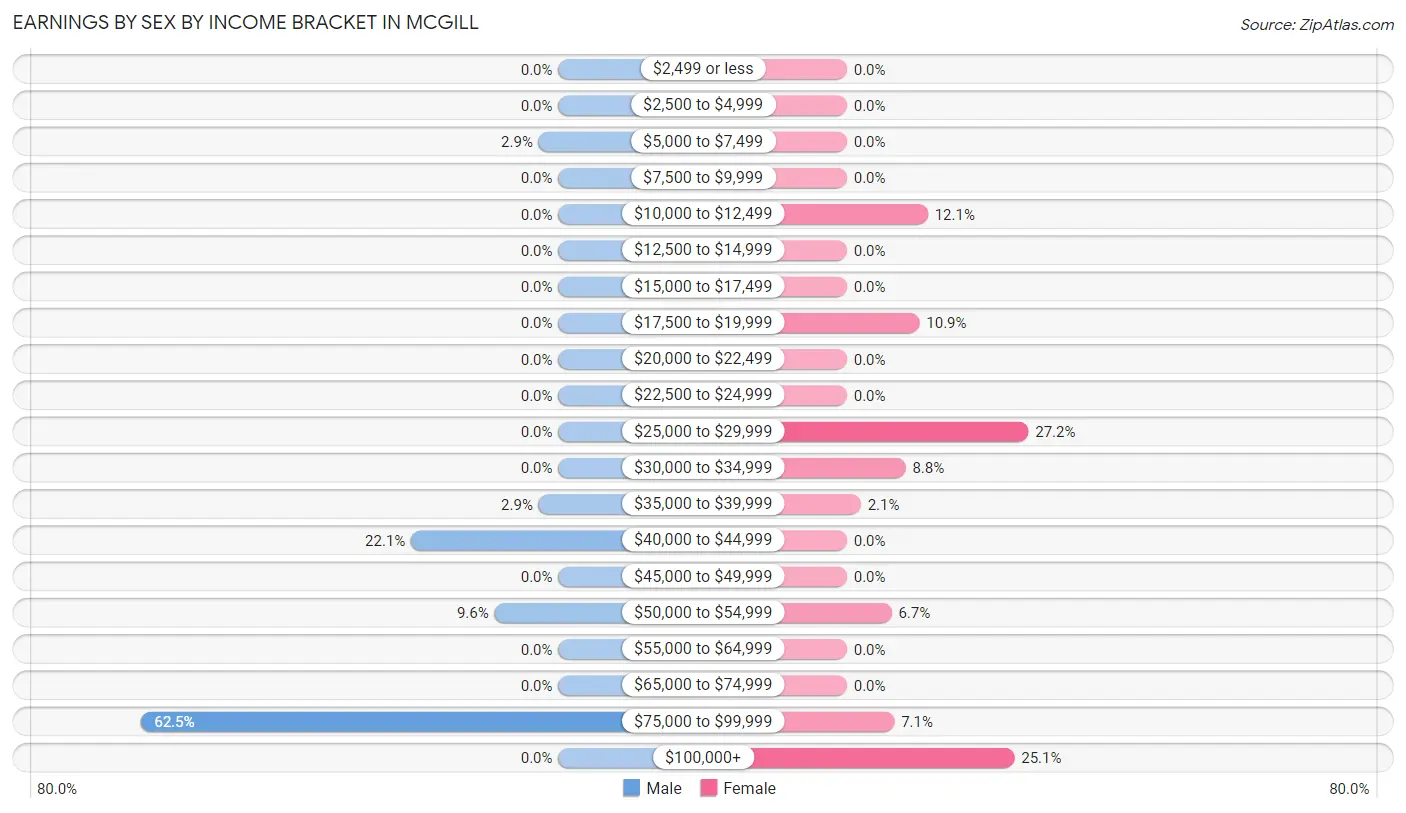
Earnings by Sex by Income Bracket in McGill
The most common earnings brackets in McGill are $75,000 to $99,999 for men (85 | 62.5%) and $25,000 to $29,999 for women (65 | 27.2%).
| Income | Male | Female |
| $2,499 or less | 0 (0.0%) | 0 (0.0%) |
| $2,500 to $4,999 | 0 (0.0%) | 0 (0.0%) |
| $5,000 to $7,499 | 4 (2.9%) | 0 (0.0%) |
| $7,500 to $9,999 | 0 (0.0%) | 0 (0.0%) |
| $10,000 to $12,499 | 0 (0.0%) | 29 (12.1%) |
| $12,500 to $14,999 | 0 (0.0%) | 0 (0.0%) |
| $15,000 to $17,499 | 0 (0.0%) | 0 (0.0%) |
| $17,500 to $19,999 | 0 (0.0%) | 26 (10.9%) |
| $20,000 to $22,499 | 0 (0.0%) | 0 (0.0%) |
| $22,500 to $24,999 | 0 (0.0%) | 0 (0.0%) |
| $25,000 to $29,999 | 0 (0.0%) | 65 (27.2%) |
| $30,000 to $34,999 | 0 (0.0%) | 21 (8.8%) |
| $35,000 to $39,999 | 4 (2.9%) | 5 (2.1%) |
| $40,000 to $44,999 | 30 (22.1%) | 0 (0.0%) |
| $45,000 to $49,999 | 0 (0.0%) | 0 (0.0%) |
| $50,000 to $54,999 | 13 (9.6%) | 16 (6.7%) |
| $55,000 to $64,999 | 0 (0.0%) | 0 (0.0%) |
| $65,000 to $74,999 | 0 (0.0%) | 0 (0.0%) |
| $75,000 to $99,999 | 85 (62.5%) | 17 (7.1%) |
| $100,000+ | 0 (0.0%) | 60 (25.1%) |
| Total | 136 (100.0%) | 239 (100.0%) |
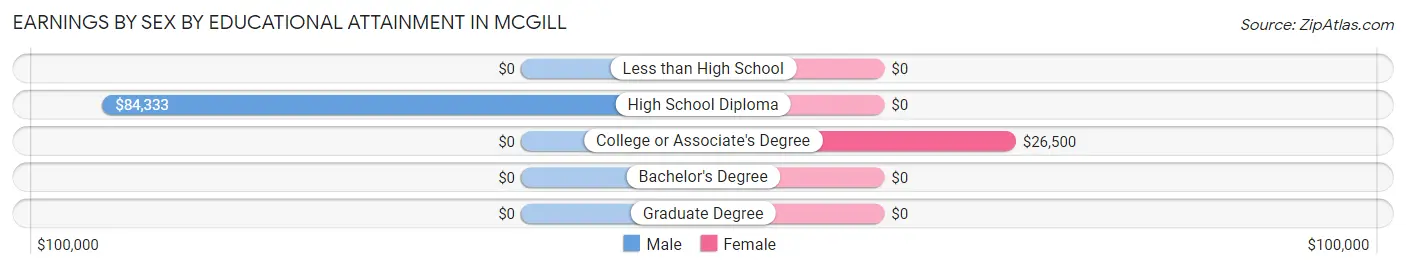
Earnings by Sex by Educational Attainment in McGill
| Educational Attainment | Male Income | Female Income |
| Less than High School | - | - |
| High School Diploma | $84,333 | $0 |
| College or Associate's Degree | - | - |
| Bachelor's Degree | - | - |
| Graduate Degree | - | - |
| Total | $84,000 | $0 |
Family Income in McGill
Family Income Brackets in McGill
According to the McGill family income data, there are 120 families falling into the $100,000 to $149,999 income range, which is the most common income bracket and makes up 50.6% of all families.
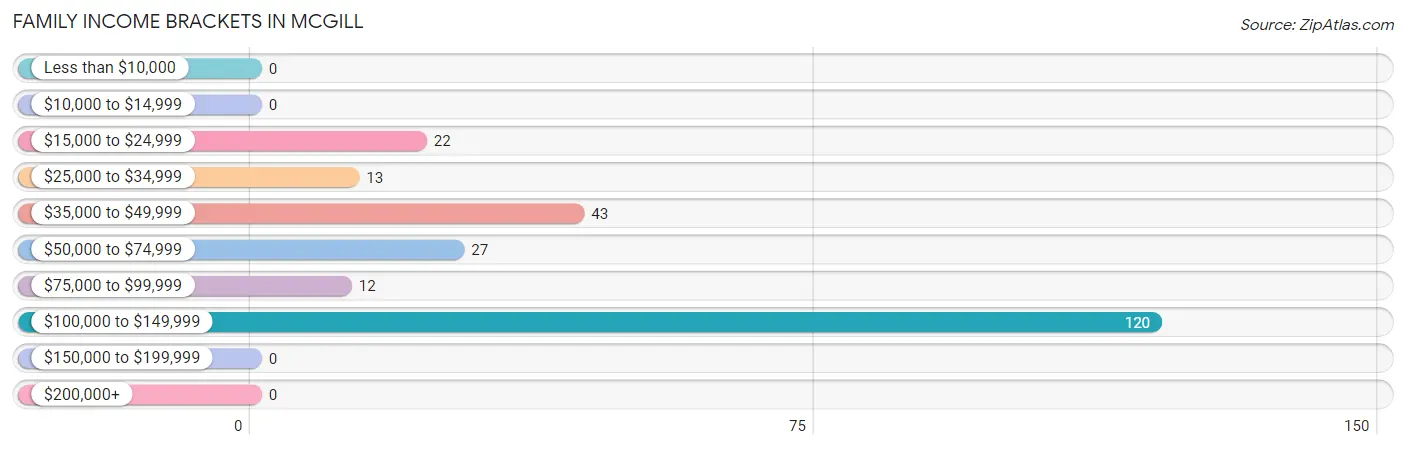
| Income Bracket | # Families | % Families |
| Less than $10,000 | 0 | 0.0% |
| $10,000 to $14,999 | 0 | 0.0% |
| $15,000 to $24,999 | 22 | 9.3% |
| $25,000 to $34,999 | 13 | 5.5% |
| $35,000 to $49,999 | 43 | 18.1% |
| $50,000 to $74,999 | 27 | 11.4% |
| $75,000 to $99,999 | 12 | 5.1% |
| $100,000 to $149,999 | 120 | 50.6% |
| $150,000 to $199,999 | 0 | 0.0% |
| $200,000+ | 0 | 0.0% |
Family Income by Famaliy Size in McGill
3-person families (76 | 32.1%) account for the highest median family income in McGill with $131,222 per family, while 3-person families (76 | 32.1%) have the highest median income of $43,741 per family member.
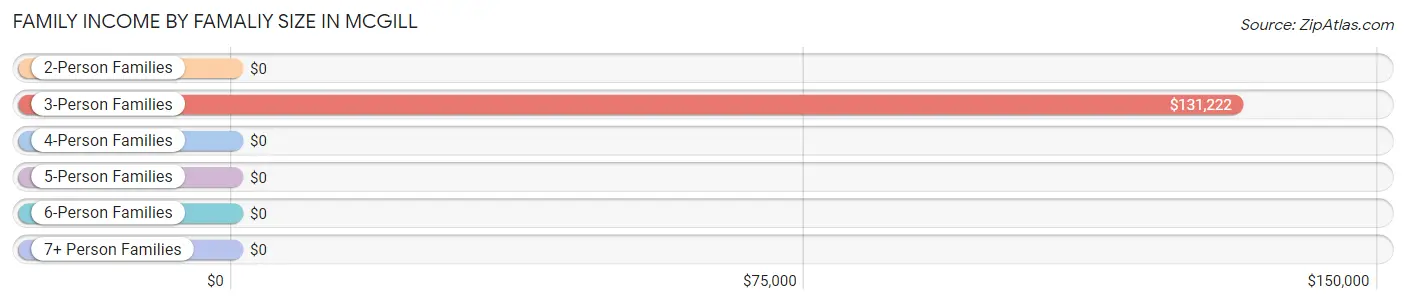
| Income Bracket | # Families | Median Income |
| 2-Person Families | 148 (62.5%) | $0 |
| 3-Person Families | 76 (32.1%) | $131,222 |
| 4-Person Families | 13 (5.5%) | $0 |
| 5-Person Families | 0 (0.0%) | $0 |
| 6-Person Families | 0 (0.0%) | $0 |
| 7+ Person Families | 0 (0.0%) | $0 |
| Total | 237 (100.0%) | $117,563 |
Family Income by Number of Earners in McGill
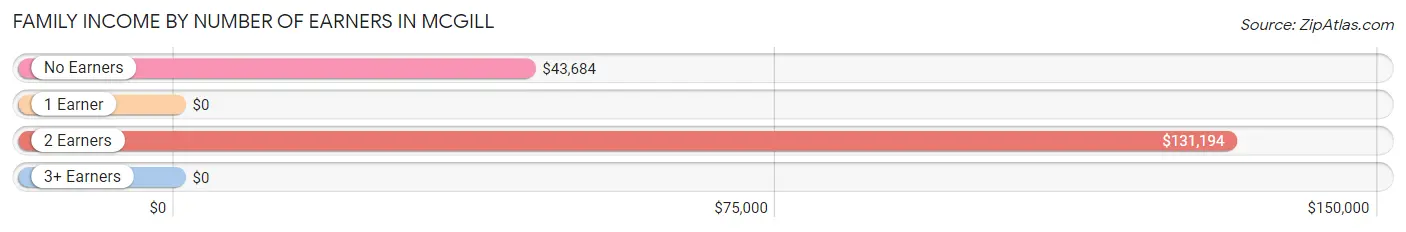
| Number of Earners | # Families | Median Income |
| No Earners | 88 (37.1%) | $43,684 |
| 1 Earner | 72 (30.4%) | $0 |
| 2 Earners | 77 (32.5%) | $131,194 |
| 3+ Earners | 0 (0.0%) | $0 |
| Total | 237 (100.0%) | $117,563 |
Household Income in McGill
Household Income Brackets in McGill
With 120 households falling in the category, the $100,000 to $149,999 income range is the most frequent in McGill, accounting for 28.9% of all households.
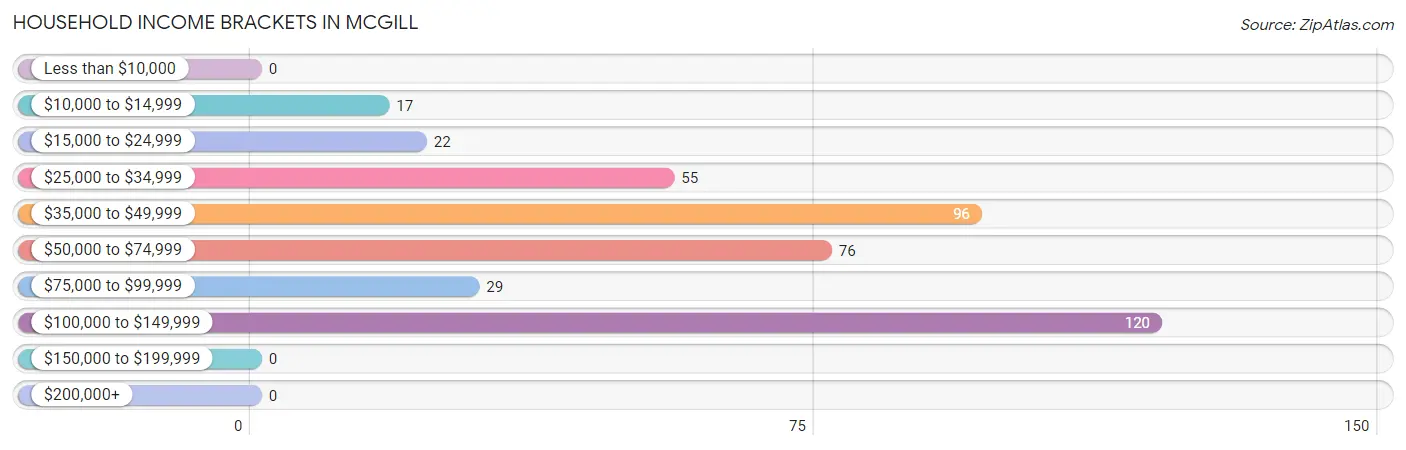
| Income Bracket | # Households | % Households |
| Less than $10,000 | 0 | 0.0% |
| $10,000 to $14,999 | 17 | 4.1% |
| $15,000 to $24,999 | 22 | 5.3% |
| $25,000 to $34,999 | 55 | 13.3% |
| $35,000 to $49,999 | 96 | 23.1% |
| $50,000 to $74,999 | 76 | 18.3% |
| $75,000 to $99,999 | 29 | 7.0% |
| $100,000 to $149,999 | 120 | 28.9% |
| $150,000 to $199,999 | 0 | 0.0% |
| $200,000+ | 0 | 0.0% |
Household Income by Householder Age in McGill
The median household income in McGill is $62,837, with the highest median household income of $118,417 found in the 45 to 64 years age bracket for the primary householder. A total of 196 households (47.2%) fall into this category. Meanwhile, the 15 to 24 years age bracket for the primary householder has the lowest median household income of $0, with 30 households (7.2%) in this group.
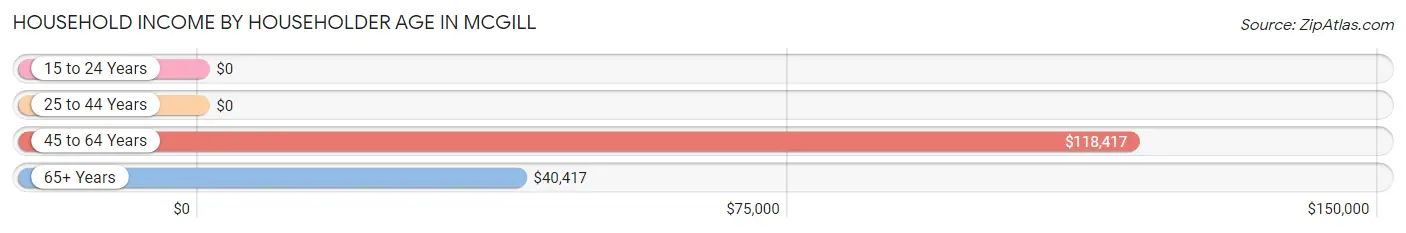
| Income Bracket | # Households | Median Income |
| 15 to 24 Years | 30 (7.2%) | $0 |
| 25 to 44 Years | 34 (8.2%) | $0 |
| 45 to 64 Years | 196 (47.2%) | $118,417 |
| 65+ Years | 155 (37.3%) | $40,417 |
| Total | 415 (100.0%) | $62,837 |
Poverty in McGill
Income Below Poverty by Sex and Age in McGill
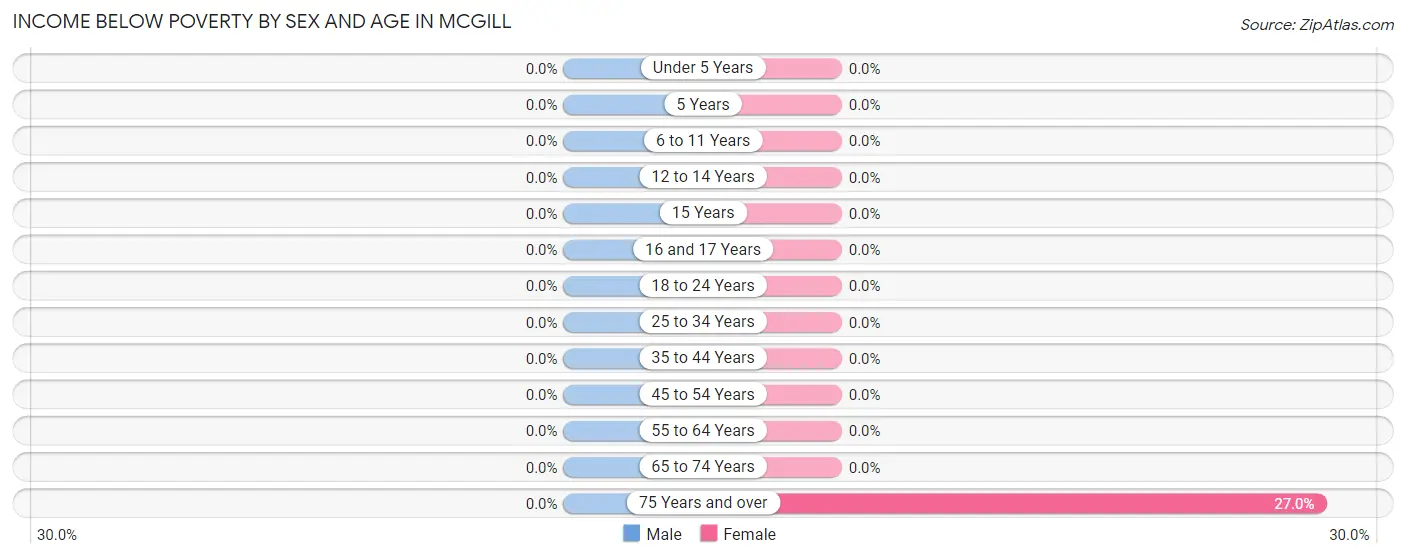
| Age Bracket | Male | Female |
| Under 5 Years | 0 (0.0%) | 0 (0.0%) |
| 5 Years | 0 (0.0%) | 0 (0.0%) |
| 6 to 11 Years | 0 (0.0%) | 0 (0.0%) |
| 12 to 14 Years | 0 (0.0%) | 0 (0.0%) |
| 15 Years | 0 (0.0%) | 0 (0.0%) |
| 16 and 17 Years | 0 (0.0%) | 0 (0.0%) |
| 18 to 24 Years | 0 (0.0%) | 0 (0.0%) |
| 25 to 34 Years | 0 (0.0%) | 0 (0.0%) |
| 35 to 44 Years | 0 (0.0%) | 0 (0.0%) |
| 45 to 54 Years | 0 (0.0%) | 0 (0.0%) |
| 55 to 64 Years | 0 (0.0%) | 0 (0.0%) |
| 65 to 74 Years | 0 (0.0%) | 0 (0.0%) |
| 75 Years and over | 0 (0.0%) | 17 (27.0%) |
| Total | 0 (0.0%) | 17 (4.0%) |
Income Above Poverty by Sex and Age in McGill
According to the poverty statistics in McGill, males aged under 5 years and females aged under 5 years are the age groups that are most secure financially, with 100.0% of males and 100.0% of females in these age groups living above the poverty line.
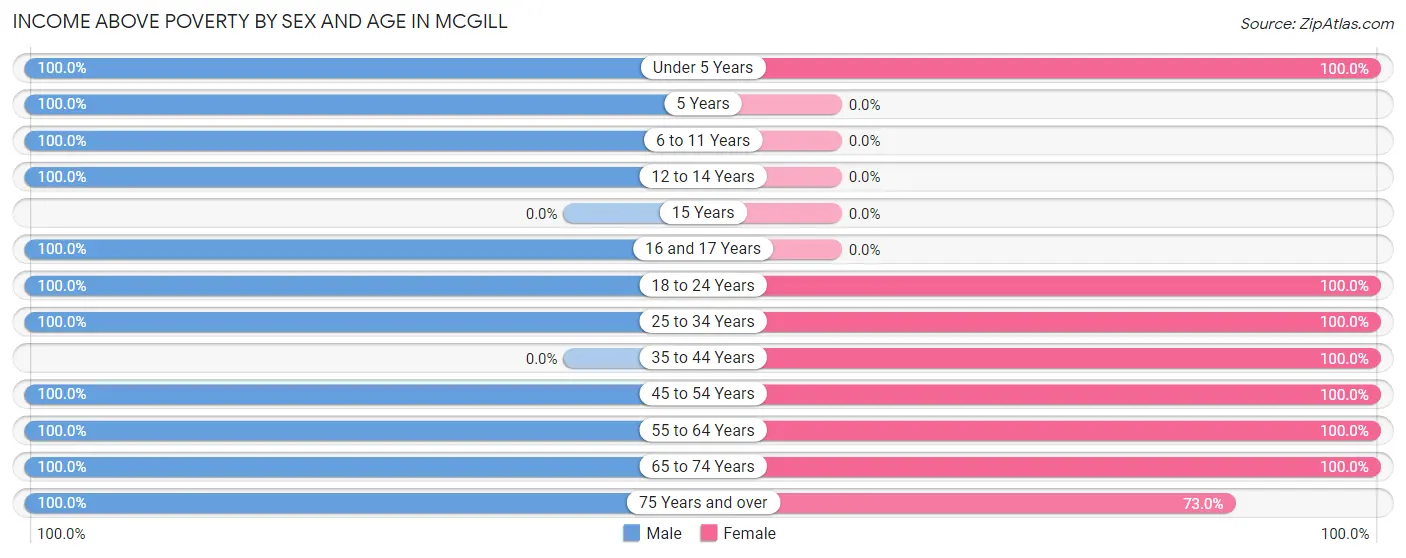
| Age Bracket | Male | Female |
| Under 5 Years | 28 (100.0%) | 32 (100.0%) |
| 5 Years | 15 (100.0%) | 0 (0.0%) |
| 6 to 11 Years | 43 (100.0%) | 0 (0.0%) |
| 12 to 14 Years | 62 (100.0%) | 0 (0.0%) |
| 15 Years | 0 (0.0%) | 0 (0.0%) |
| 16 and 17 Years | 15 (100.0%) | 0 (0.0%) |
| 18 to 24 Years | 34 (100.0%) | 26 (100.0%) |
| 25 to 34 Years | 13 (100.0%) | 29 (100.0%) |
| 35 to 44 Years | 0 (0.0%) | 91 (100.0%) |
| 45 to 54 Years | 64 (100.0%) | 28 (100.0%) |
| 55 to 64 Years | 48 (100.0%) | 132 (100.0%) |
| 65 to 74 Years | 115 (100.0%) | 21 (100.0%) |
| 75 Years and over | 20 (100.0%) | 46 (73.0%) |
| Total | 457 (100.0%) | 405 (96.0%) |
Income Below Poverty Among Married-Couple Families in McGill
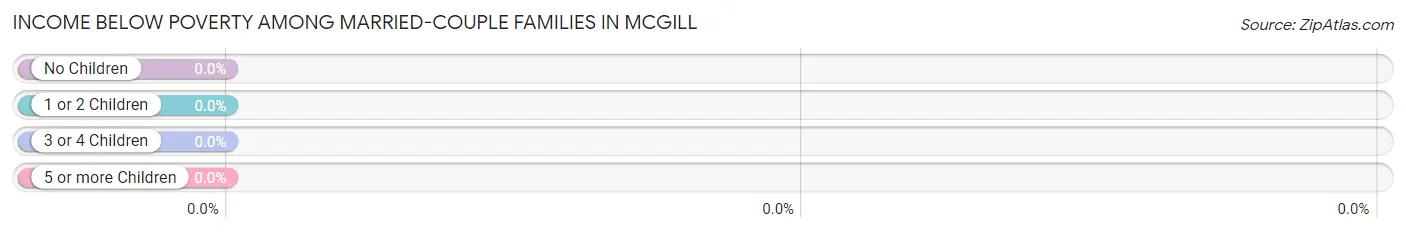
| Children | Above Poverty | Below Poverty |
| No Children | 56 (100.0%) | 0 (0.0%) |
| 1 or 2 Children | 89 (100.0%) | 0 (0.0%) |
| 3 or 4 Children | 0 (0.0%) | 0 (0.0%) |
| 5 or more Children | 0 (0.0%) | 0 (0.0%) |
| Total | 145 (100.0%) | 0 (0.0%) |
Income Below Poverty Among Single-Parent Households in McGill
| Children | Single Father | Single Mother |
| No Children | 0 (0.0%) | 0 (0.0%) |
| 1 or 2 Children | 0 (0.0%) | 0 (0.0%) |
| 3 or 4 Children | 0 (0.0%) | 0 (0.0%) |
| 5 or more Children | 0 (0.0%) | 0 (0.0%) |
| Total | 0 (0.0%) | 0 (0.0%) |
Income Below Poverty Among Married-Couple vs Single-Parent Households in McGill
| Children | Married-Couple Families | Single-Parent Households |
| No Children | 0 (0.0%) | 0 (0.0%) |
| 1 or 2 Children | 0 (0.0%) | 0 (0.0%) |
| 3 or 4 Children | 0 (0.0%) | 0 (0.0%) |
| 5 or more Children | 0 (0.0%) | 0 (0.0%) |
| Total | 0 (0.0%) | 0 (0.0%) |
Race in McGill
The most populous races in McGill are White / Caucasian (790 | 89.9%), Native / Alaskan (62 | 7.0%), and Two or more Races (27 | 3.1%).
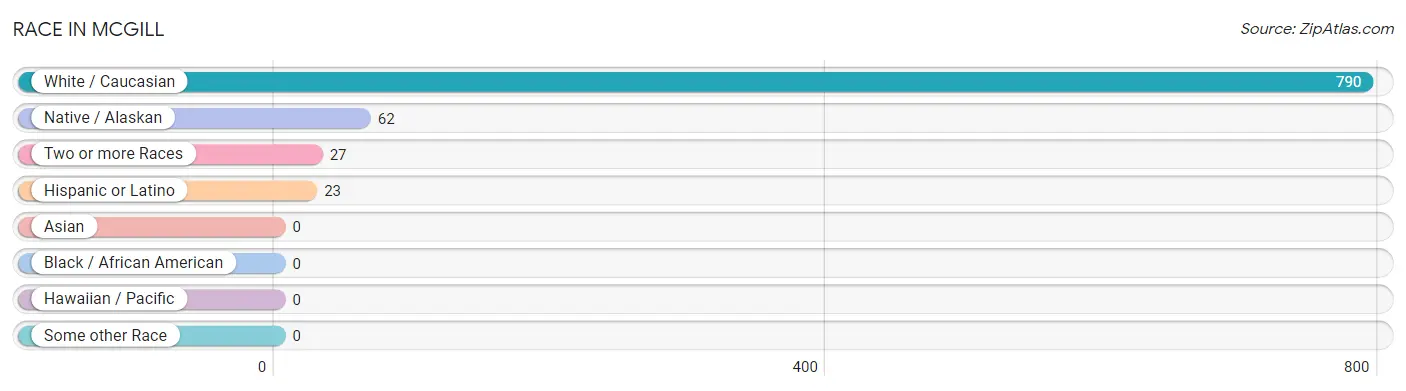
| Race | # Population | % Population |
| Asian | 0 | 0.0% |
| Black / African American | 0 | 0.0% |
| Hawaiian / Pacific | 0 | 0.0% |
| Hispanic or Latino | 23 | 2.6% |
| Native / Alaskan | 62 | 7.0% |
| White / Caucasian | 790 | 89.9% |
| Two or more Races | 27 | 3.1% |
| Some other Race | 0 | 0.0% |
| Total | 879 | 100.0% |
Ancestry in McGill
The most populous ancestries reported in McGill are English (314 | 35.7%), Scottish (126 | 14.3%), American (85 | 9.7%), European (82 | 9.3%), and German (48 | 5.5%), together accounting for 74.5% of all McGill residents.
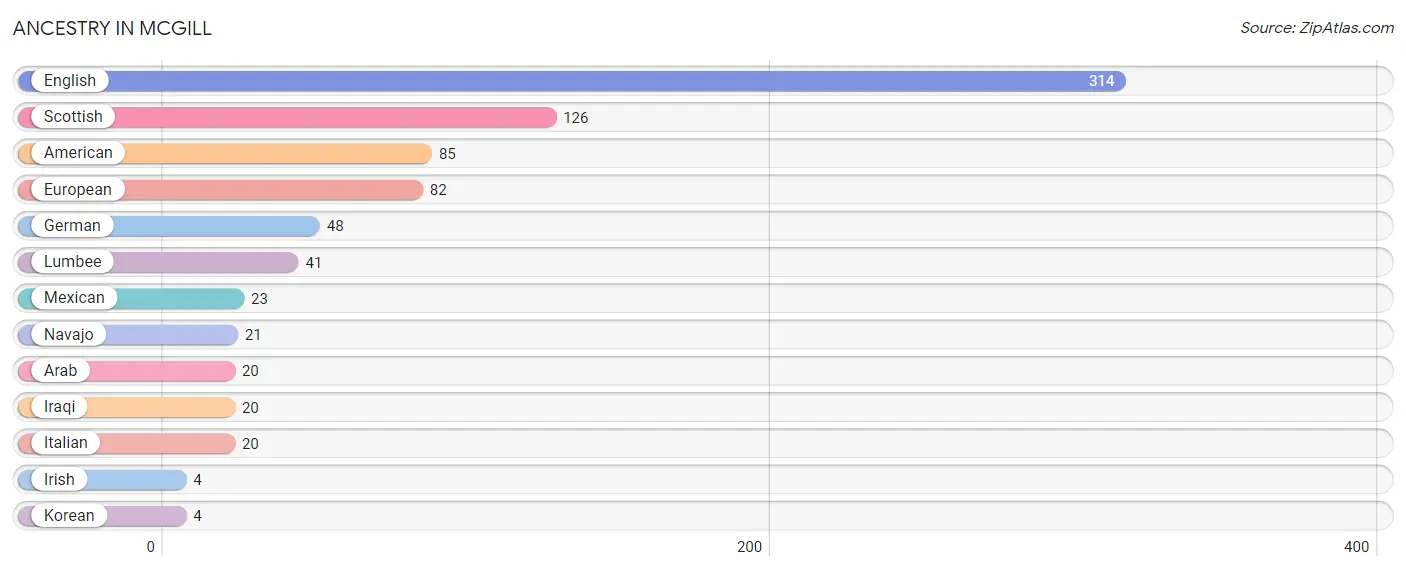
| Ancestry | # Population | % Population |
| American | 85 | 9.7% |
| Arab | 20 | 2.3% |
| English | 314 | 35.7% |
| European | 82 | 9.3% |
| German | 48 | 5.5% |
| Iraqi | 20 | 2.3% |
| Irish | 4 | 0.5% |
| Italian | 20 | 2.3% |
| Korean | 4 | 0.5% |
| Lumbee | 41 | 4.7% |
| Mexican | 23 | 2.6% |
| Navajo | 21 | 2.4% |
| Scottish | 126 | 14.3% | View All 13 Rows |
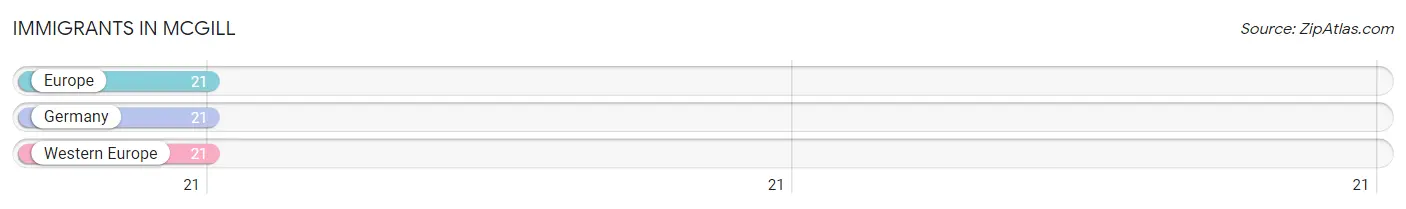
Immigrants in McGill
The most numerous immigrant groups reported in McGill came from Europe (21 | 2.4%), Germany (21 | 2.4%), and Western Europe (21 | 2.4%), together accounting for 7.2% of all McGill residents.
| Immigration Origin | # Population | % Population |
| Europe | 21 | 2.4% |
| Germany | 21 | 2.4% |
| Western Europe | 21 | 2.4% | View All 3 Rows |
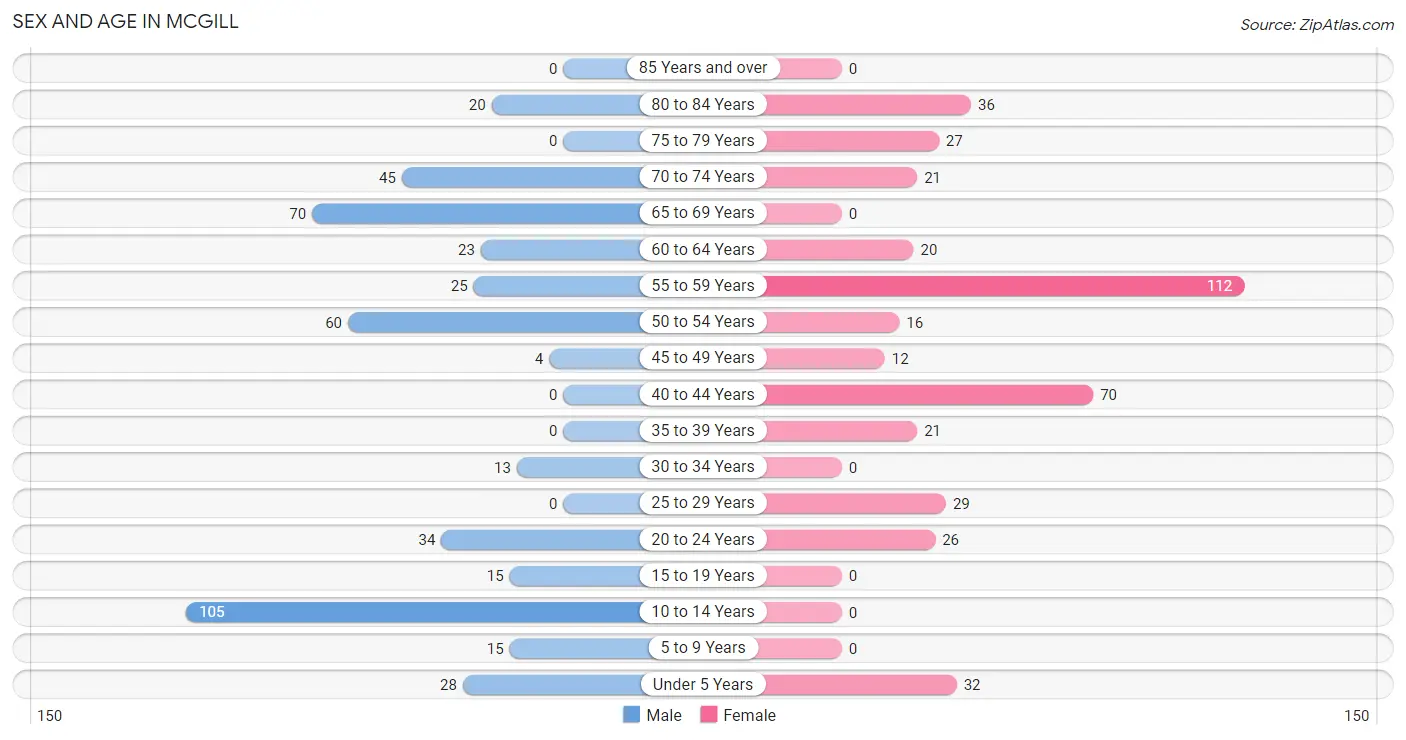
Sex and Age in McGill
Sex and Age in McGill
The most populous age groups in McGill are 10 to 14 Years (105 | 23.0%) for men and 55 to 59 Years (112 | 26.5%) for women.
| Age Bracket | Male | Female |
| Under 5 Years | 28 (6.1%) | 32 (7.6%) |
| 5 to 9 Years | 15 (3.3%) | 0 (0.0%) |
| 10 to 14 Years | 105 (23.0%) | 0 (0.0%) |
| 15 to 19 Years | 15 (3.3%) | 0 (0.0%) |
| 20 to 24 Years | 34 (7.4%) | 26 (6.2%) |
| 25 to 29 Years | 0 (0.0%) | 29 (6.9%) |
| 30 to 34 Years | 13 (2.8%) | 0 (0.0%) |
| 35 to 39 Years | 0 (0.0%) | 21 (5.0%) |
| 40 to 44 Years | 0 (0.0%) | 70 (16.6%) |
| 45 to 49 Years | 4 (0.9%) | 12 (2.8%) |
| 50 to 54 Years | 60 (13.1%) | 16 (3.8%) |
| 55 to 59 Years | 25 (5.5%) | 112 (26.5%) |
| 60 to 64 Years | 23 (5.0%) | 20 (4.7%) |
| 65 to 69 Years | 70 (15.3%) | 0 (0.0%) |
| 70 to 74 Years | 45 (9.9%) | 21 (5.0%) |
| 75 to 79 Years | 0 (0.0%) | 27 (6.4%) |
| 80 to 84 Years | 20 (4.4%) | 36 (8.5%) |
| 85 Years and over | 0 (0.0%) | 0 (0.0%) |
| Total | 457 (100.0%) | 422 (100.0%) |
Families and Households in McGill
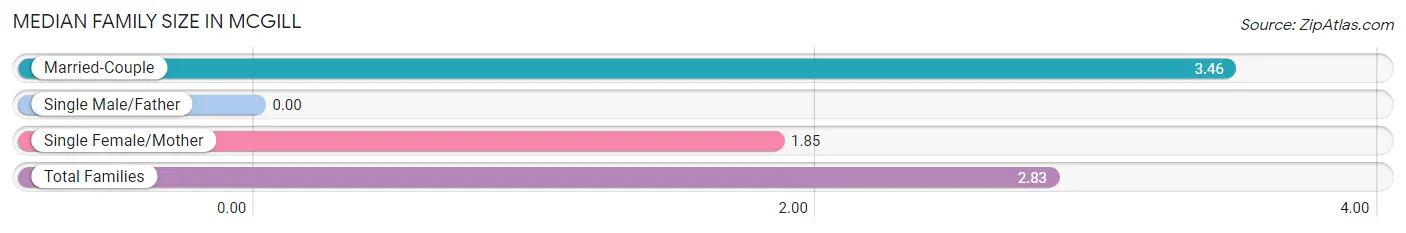
Median Family Size in McGill
| Family Type | # Families | Family Size |
| Married-Couple | 145 (61.2%) | 3.46 |
| Single Male/Father | 0 (0.0%) | - |
| Single Female/Mother | 92 (38.8%) | 1.85 |
| Total Families | 237 (100.0%) | 2.83 |
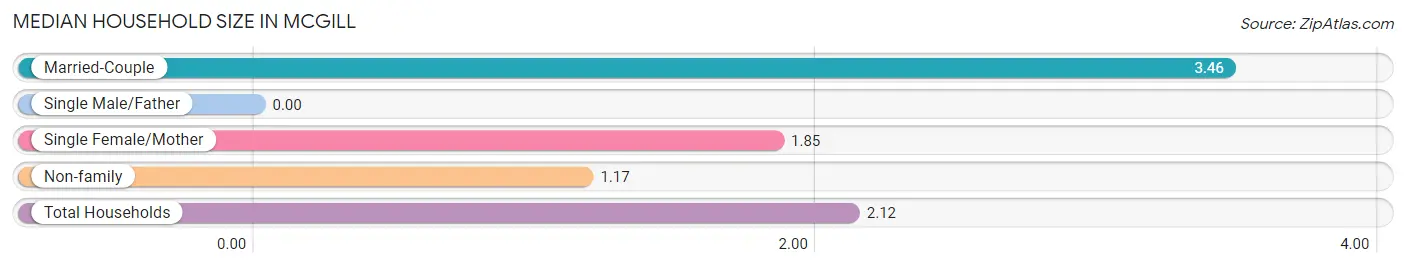
Median Household Size in McGill
| Household Type | # Households | Household Size |
| Married-Couple | 145 (34.9%) | 3.46 |
| Single Male/Father | 0 (0.0%) | - |
| Single Female/Mother | 92 (22.2%) | 1.85 |
| Non-family | 178 (42.9%) | 1.17 |
| Total Households | 415 (100.0%) | 2.12 |
Household Size by Marriage Status in McGill
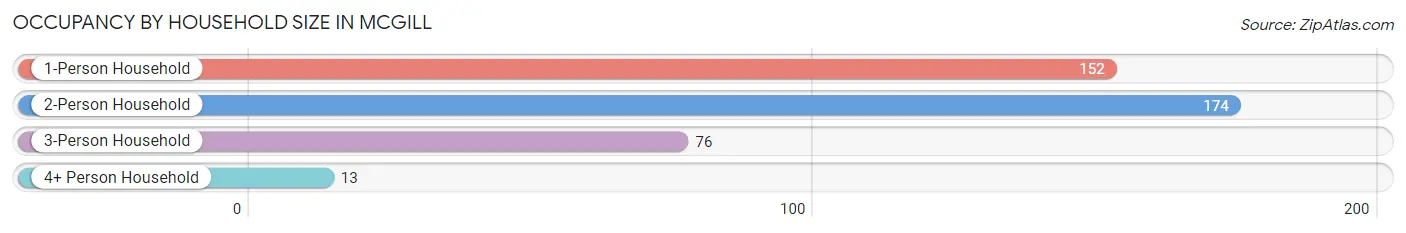
Out of a total of 415 households in McGill, 237 (57.1%) are family households, while 178 (42.9%) are nonfamily households. The most numerous type of family households are 2-person households, comprising 148, and the most common type of nonfamily households are 1-person households, comprising 152.
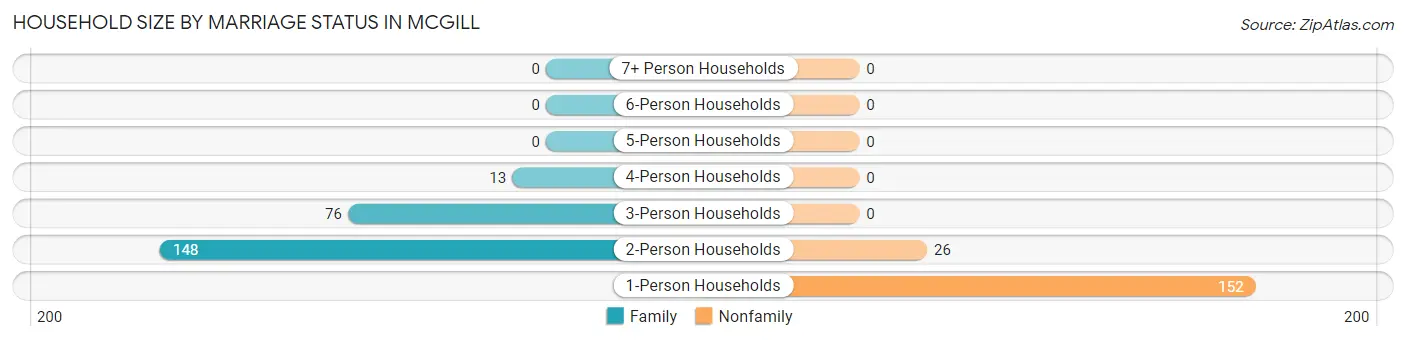
| Household Size | Family Households | Nonfamily Households |
| 1-Person Households | - | 152 (36.6%) |
| 2-Person Households | 148 (35.7%) | 26 (6.3%) |
| 3-Person Households | 76 (18.3%) | 0 (0.0%) |
| 4-Person Households | 13 (3.1%) | 0 (0.0%) |
| 5-Person Households | 0 (0.0%) | 0 (0.0%) |
| 6-Person Households | 0 (0.0%) | 0 (0.0%) |
| 7+ Person Households | 0 (0.0%) | 0 (0.0%) |
| Total | 237 (57.1%) | 178 (42.9%) |
Female Fertility in McGill
Fertility by Age in McGill
| Age Bracket | Women with Births | Births / 1,000 Women |
| 15 to 19 years | 0 (0.0%) | 0.0 |
| 20 to 34 years | 0 (0.0%) | 0.0 |
| 35 to 50 years | 0 (0.0%) | 0.0 |
| Total | 0 (0.0%) | 0.0 |
Fertility by Age by Marriage Status in McGill
| Age Bracket | Married | Unmarried |
| 15 to 19 years | 0 (0.0%) | 0 (0.0%) |
| 20 to 34 years | 0 (0.0%) | 0 (0.0%) |
| 35 to 50 years | 0 (0.0%) | 0 (0.0%) |
| Total | 0 (0.0%) | 0 (0.0%) |
Fertility by Education in McGill
| Educational Attainment | Women with Births | Births / 1,000 Women |
| Less than High School | 0 (0.0%) | 0.0 |
| High School Diploma | 0 (0.0%) | 0.0 |
| College or Associate's Degree | 0 (0.0%) | 0.0 |
| Bachelor's Degree | 0 (0.0%) | 0.0 |
| Graduate Degree | 0 (0.0%) | 0.0 |
| Total | 0 (0.0%) | 0.0 |
Fertility by Education by Marriage Status in McGill
| Educational Attainment | Married | Unmarried |
| Less than High School | 0 (0.0%) | 0 (0.0%) |
| High School Diploma | 0 (0.0%) | 0 (0.0%) |
| College or Associate's Degree | 0 (0.0%) | 0 (0.0%) |
| Bachelor's Degree | 0 (0.0%) | 0 (0.0%) |
| Graduate Degree | 0 (0.0%) | 0 (0.0%) |
| Total | 0 (0.0%) | 0 (0.0%) |
Employment Characteristics in McGill
Employment by Class of Employer in McGill
Among the 349 employed individuals in McGill, state government employees (142 | 40.7%), private company employees (138 | 39.5%), and local government employees (65 | 18.6%) make up the most common classes of employment.
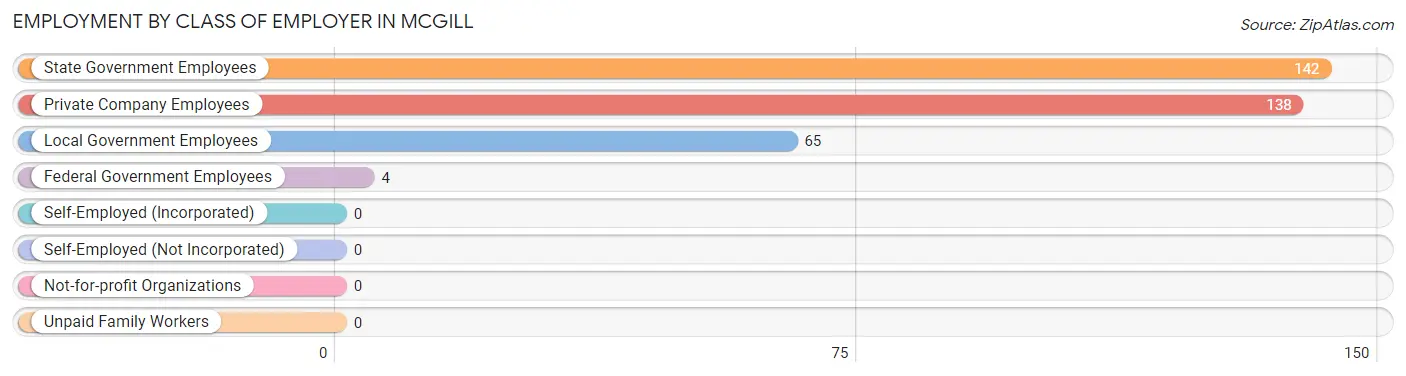
| Employer Class | # Employees | % Employees |
| Private Company Employees | 138 | 39.5% |
| Self-Employed (Incorporated) | 0 | 0.0% |
| Self-Employed (Not Incorporated) | 0 | 0.0% |
| Not-for-profit Organizations | 0 | 0.0% |
| Local Government Employees | 65 | 18.6% |
| State Government Employees | 142 | 40.7% |
| Federal Government Employees | 4 | 1.1% |
| Unpaid Family Workers | 0 | 0.0% |
| Total | 349 | 100.0% |
Employment Status by Age in McGill
According to the labor force statistics for McGill, out of the total population over 16 years of age (699), 53.6% or 375 individuals are in the labor force, with 6.9% or 26 of them unemployed. The age group with the highest labor force participation rate is 20 to 24 years, with 100.0% or 60 individuals in the labor force. Within the labor force, the 20 to 24 years age range has the highest percentage of unemployed individuals, with 43.3% or 26 of them being unemployed.
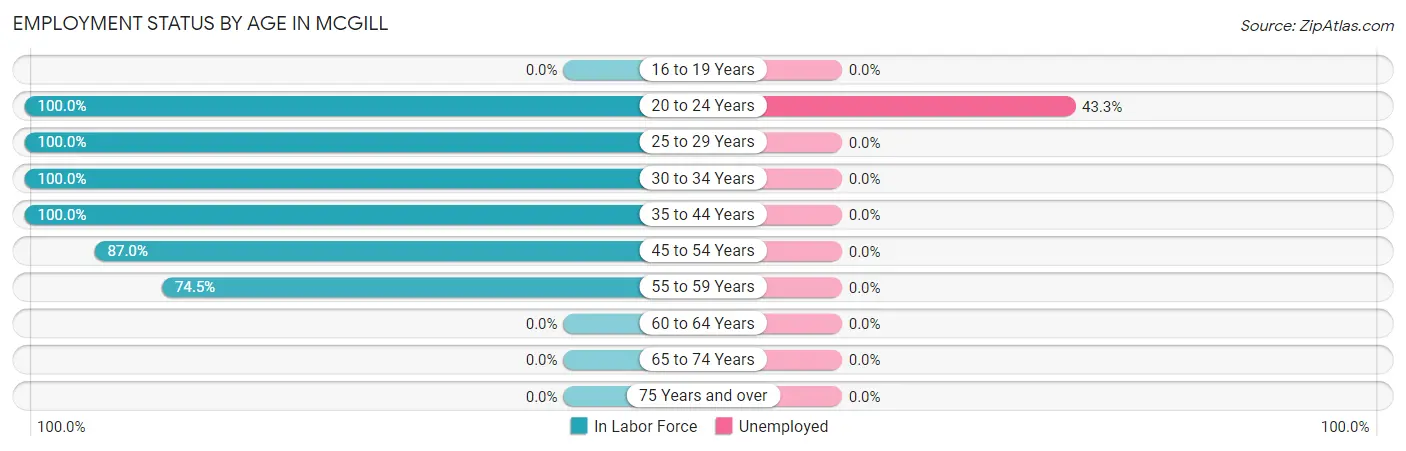
| Age Bracket | In Labor Force | Unemployed |
| 16 to 19 Years | 0 (0.0%) | 0 (0.0%) |
| 20 to 24 Years | 60 (100.0%) | 26 (43.3%) |
| 25 to 29 Years | 29 (100.0%) | 0 (0.0%) |
| 30 to 34 Years | 13 (100.0%) | 0 (0.0%) |
| 35 to 44 Years | 91 (100.0%) | 0 (0.0%) |
| 45 to 54 Years | 80 (87.0%) | 0 (0.0%) |
| 55 to 59 Years | 102 (74.5%) | 0 (0.0%) |
| 60 to 64 Years | 0 (0.0%) | 0 (0.0%) |
| 65 to 74 Years | 0 (0.0%) | 0 (0.0%) |
| 75 Years and over | 0 (0.0%) | 0 (0.0%) |
| Total | 375 (53.6%) | 26 (6.9%) |
Employment Status by Educational Attainment in McGill
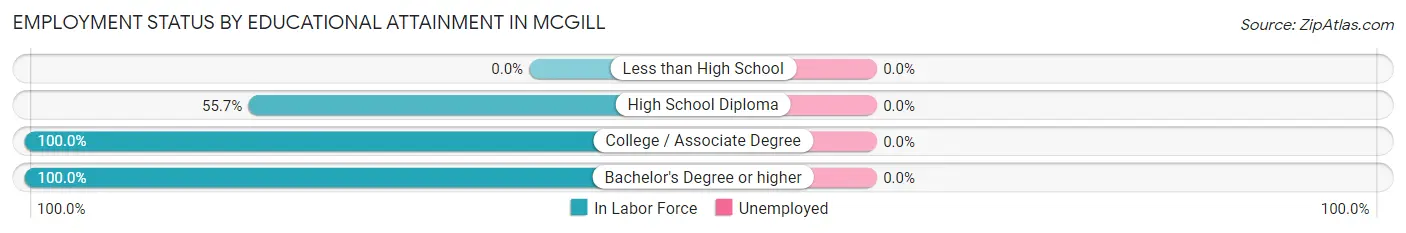
| Educational Attainment | In Labor Force | Unemployed |
| Less than High School | 0 (0.0%) | 0 (0.0%) |
| High School Diploma | 98 (55.7%) | 0 (0.0%) |
| College / Associate Degree | 136 (100.0%) | 0 (0.0%) |
| Bachelor's Degree or higher | 81 (100.0%) | 0 (0.0%) |
| Total | 315 (77.8%) | 0 (0.0%) |
Employment Occupations by Sex in McGill
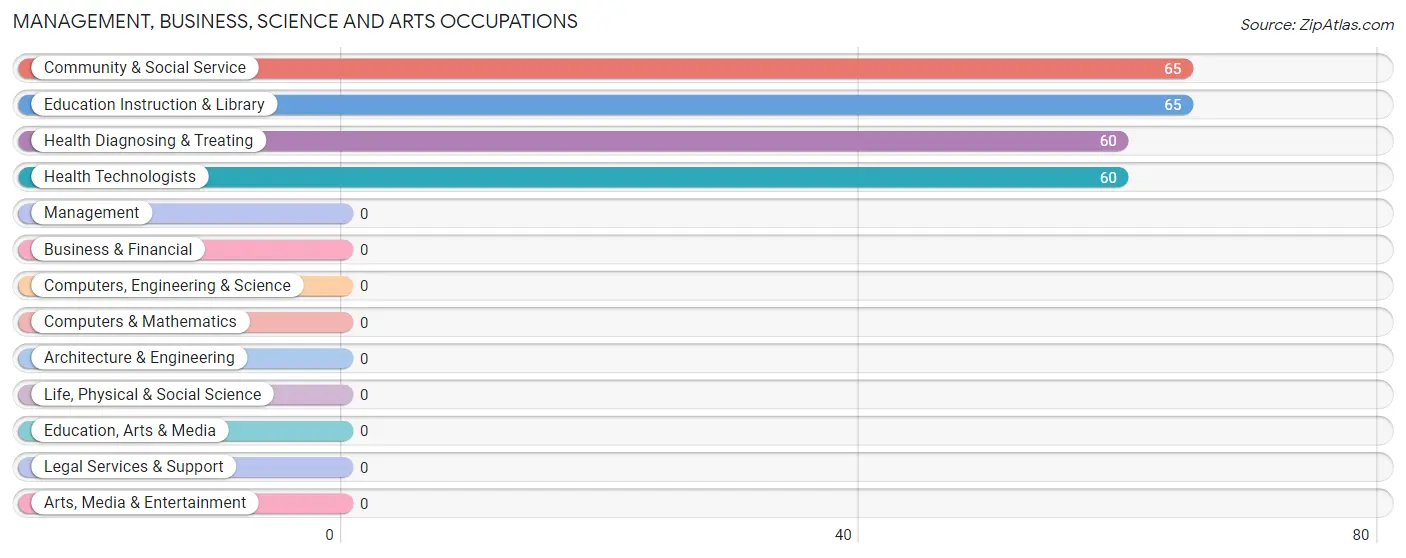
Management, Business, Science and Arts Occupations
The most common Management, Business, Science and Arts occupations in McGill are Community & Social Service (65 | 18.6%), Education Instruction & Library (65 | 18.6%), Health Diagnosing & Treating (60 | 17.2%), and Health Technologists (60 | 17.2%).
Management, Business, Science and Arts Occupations by Sex
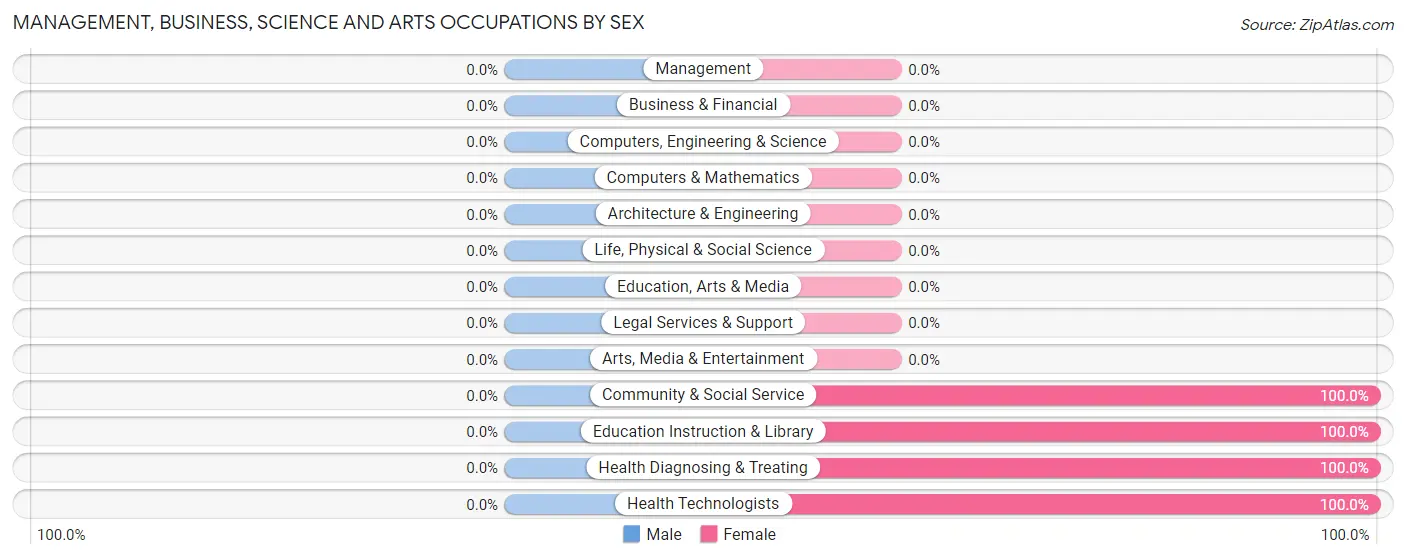
| Occupation | Male | Female |
| Management | 0 (0.0%) | 0 (0.0%) |
| Business & Financial | 0 (0.0%) | 0 (0.0%) |
| Computers, Engineering & Science | 0 (0.0%) | 0 (0.0%) |
| Computers & Mathematics | 0 (0.0%) | 0 (0.0%) |
| Architecture & Engineering | 0 (0.0%) | 0 (0.0%) |
| Life, Physical & Social Science | 0 (0.0%) | 0 (0.0%) |
| Community & Social Service | 0 (0.0%) | 65 (100.0%) |
| Education, Arts & Media | 0 (0.0%) | 0 (0.0%) |
| Legal Services & Support | 0 (0.0%) | 0 (0.0%) |
| Education Instruction & Library | 0 (0.0%) | 65 (100.0%) |
| Arts, Media & Entertainment | 0 (0.0%) | 0 (0.0%) |
| Health Diagnosing & Treating | 0 (0.0%) | 60 (100.0%) |
| Health Technologists | 0 (0.0%) | 60 (100.0%) |
| Total (Category) | 0 (0.0%) | 125 (100.0%) |
| Total (Overall) | 136 (39.0%) | 213 (61.0%) |
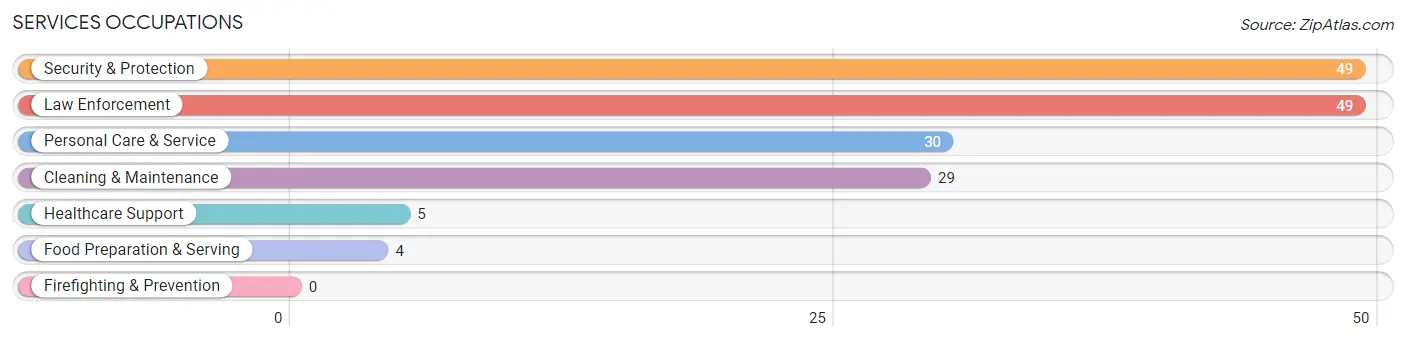
Services Occupations
The most common Services occupations in McGill are Security & Protection (49 | 14.0%), Law Enforcement (49 | 14.0%), Personal Care & Service (30 | 8.6%), Cleaning & Maintenance (29 | 8.3%), and Healthcare Support (5 | 1.4%).
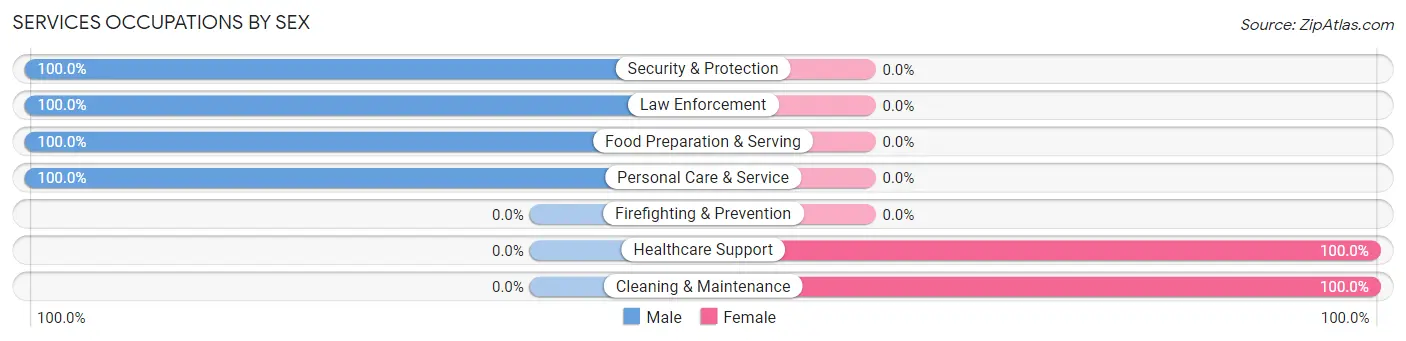
Services Occupations by Sex
Within the Services occupations in McGill, the most male-oriented occupations are Security & Protection (100.0%), Law Enforcement (100.0%), and Food Preparation & Serving (100.0%), while the most female-oriented occupations are Healthcare Support (100.0%), and Cleaning & Maintenance (100.0%).
| Occupation | Male | Female |
| Healthcare Support | 0 (0.0%) | 5 (100.0%) |
| Security & Protection | 49 (100.0%) | 0 (0.0%) |
| Firefighting & Prevention | 0 (0.0%) | 0 (0.0%) |
| Law Enforcement | 49 (100.0%) | 0 (0.0%) |
| Food Preparation & Serving | 4 (100.0%) | 0 (0.0%) |
| Cleaning & Maintenance | 0 (0.0%) | 29 (100.0%) |
| Personal Care & Service | 30 (100.0%) | 0 (0.0%) |
| Total (Category) | 83 (70.9%) | 34 (29.1%) |
| Total (Overall) | 136 (39.0%) | 213 (61.0%) |
Sales and Office Occupations
Sales and Office Occupations by Sex
| Occupation | Male | Female |
| Sales & Related | 0 (0.0%) | 0 (0.0%) |
| Office & Administration | 0 (0.0%) | 0 (0.0%) |
| Total (Category) | 0 (0.0%) | 0 (0.0%) |
| Total (Overall) | 136 (39.0%) | 213 (61.0%) |
Natural Resources, Construction and Maintenance Occupations
The most common Natural Resources, Construction and Maintenance occupations in McGill are , and Construction & Extraction (70 | 20.1%).
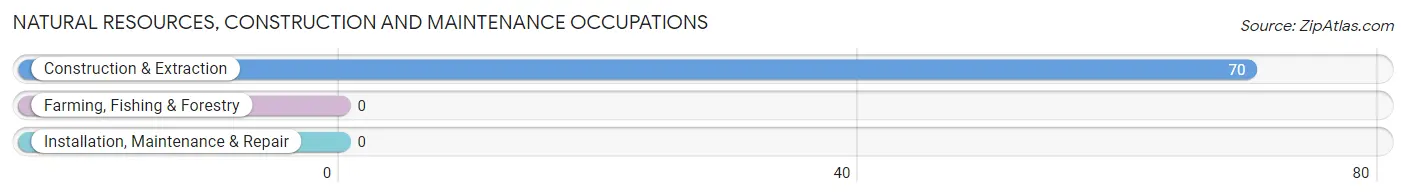
Natural Resources, Construction and Maintenance Occupations by Sex
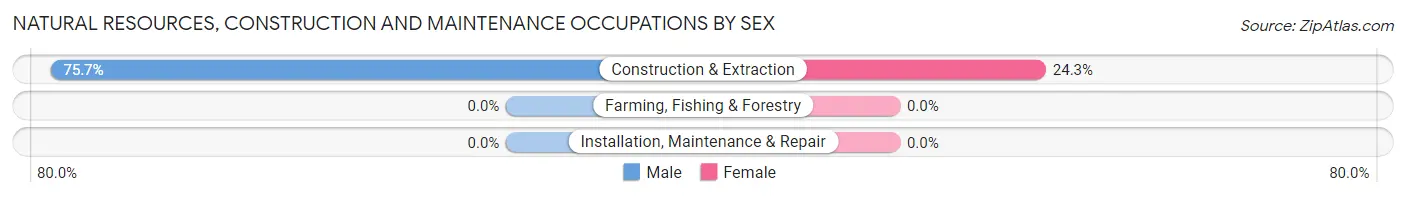
| Occupation | Male | Female |
| Farming, Fishing & Forestry | 0 (0.0%) | 0 (0.0%) |
| Construction & Extraction | 53 (75.7%) | 17 (24.3%) |
| Installation, Maintenance & Repair | 0 (0.0%) | 0 (0.0%) |
| Total (Category) | 53 (75.7%) | 17 (24.3%) |
| Total (Overall) | 136 (39.0%) | 213 (61.0%) |
Production, Transportation and Moving Occupations
The most common Production, Transportation and Moving occupations in McGill are , and Material Moving (37 | 10.6%).
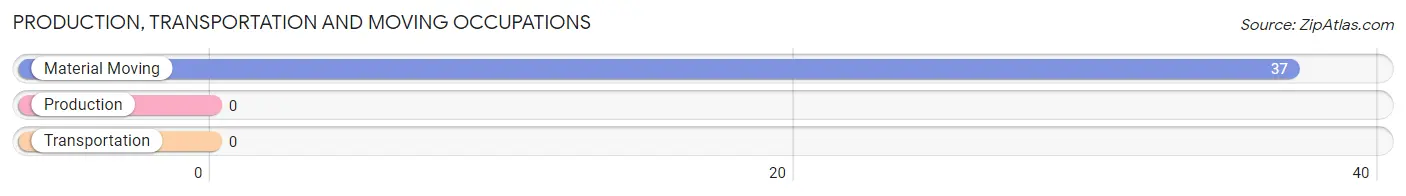
Production, Transportation and Moving Occupations by Sex
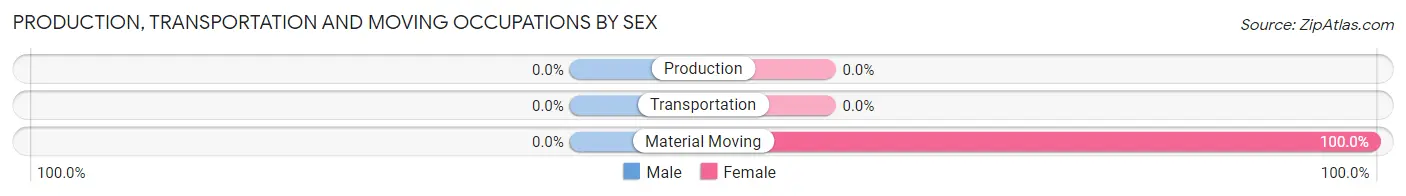
| Occupation | Male | Female |
| Production | 0 (0.0%) | 0 (0.0%) |
| Transportation | 0 (0.0%) | 0 (0.0%) |
| Material Moving | 0 (0.0%) | 37 (100.0%) |
| Total (Category) | 0 (0.0%) | 37 (100.0%) |
| Total (Overall) | 136 (39.0%) | 213 (61.0%) |
Employment Industries by Sex in McGill
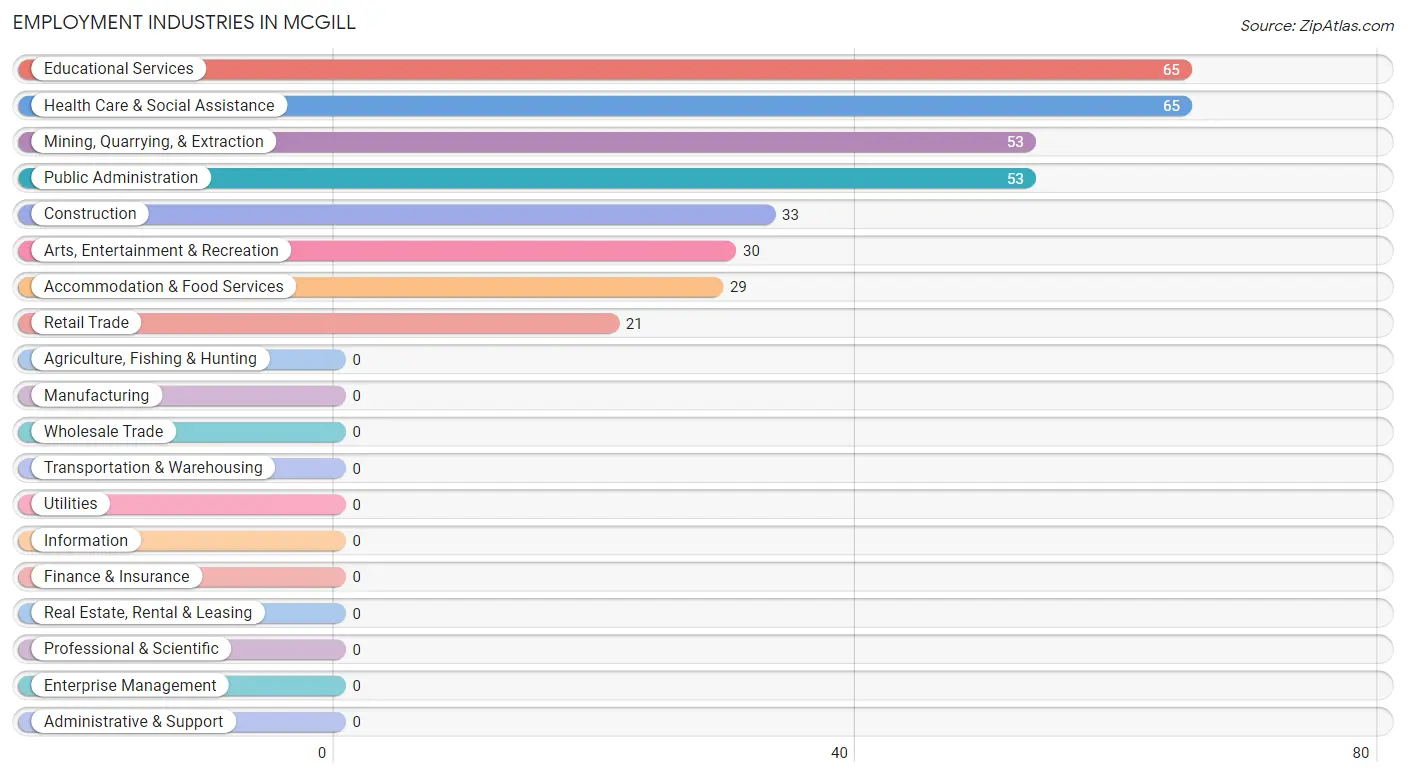
Employment Industries in McGill
The major employment industries in McGill include Educational Services (65 | 18.6%), Health Care & Social Assistance (65 | 18.6%), Mining, Quarrying, & Extraction (53 | 15.2%), Public Administration (53 | 15.2%), and Construction (33 | 9.5%).
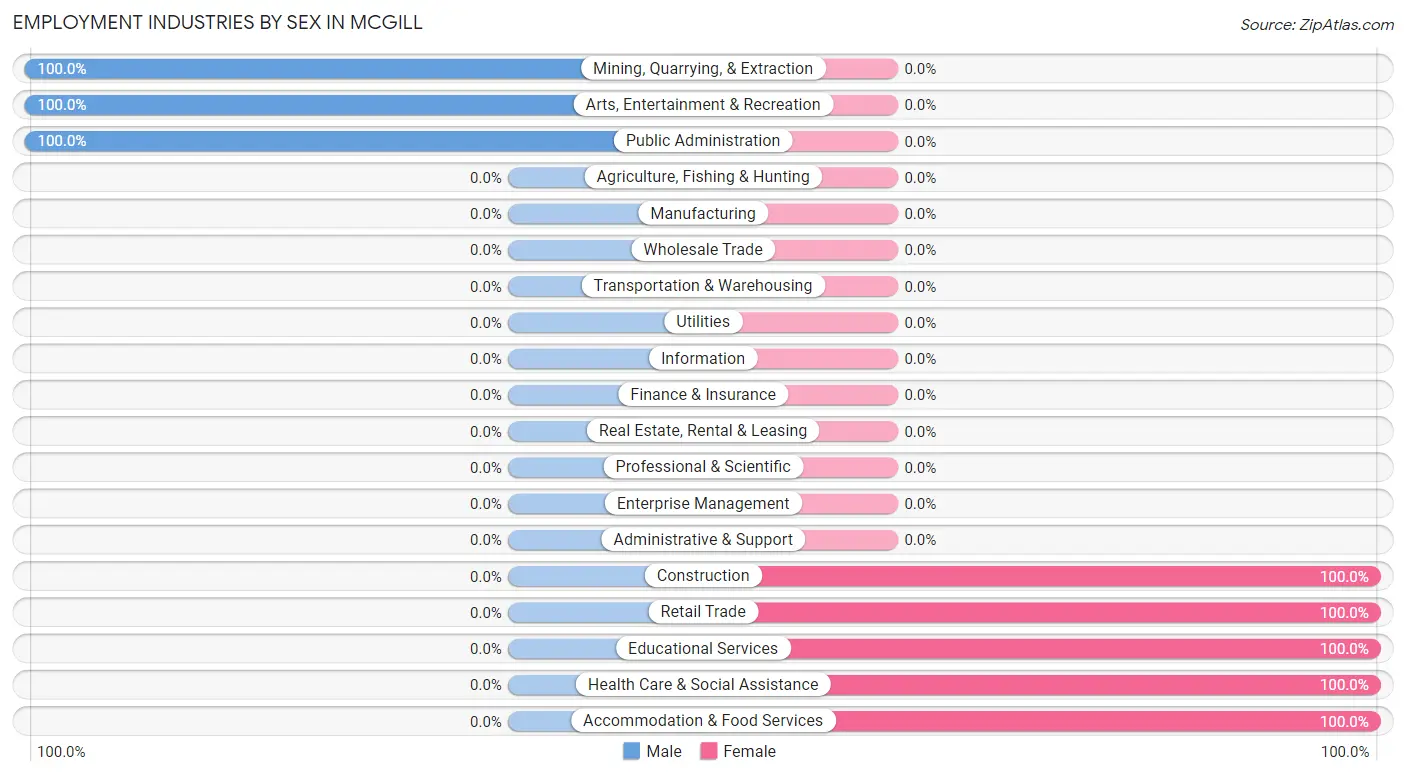
Employment Industries by Sex in McGill
The McGill industries that see more men than women are Mining, Quarrying, & Extraction (100.0%), Arts, Entertainment & Recreation (100.0%), and Public Administration (100.0%), whereas the industries that tend to have a higher number of women are Construction (100.0%), Retail Trade (100.0%), and Educational Services (100.0%).
| Industry | Male | Female |
| Agriculture, Fishing & Hunting | 0 (0.0%) | 0 (0.0%) |
| Mining, Quarrying, & Extraction | 53 (100.0%) | 0 (0.0%) |
| Construction | 0 (0.0%) | 33 (100.0%) |
| Manufacturing | 0 (0.0%) | 0 (0.0%) |
| Wholesale Trade | 0 (0.0%) | 0 (0.0%) |
| Retail Trade | 0 (0.0%) | 21 (100.0%) |
| Transportation & Warehousing | 0 (0.0%) | 0 (0.0%) |
| Utilities | 0 (0.0%) | 0 (0.0%) |
| Information | 0 (0.0%) | 0 (0.0%) |
| Finance & Insurance | 0 (0.0%) | 0 (0.0%) |
| Real Estate, Rental & Leasing | 0 (0.0%) | 0 (0.0%) |
| Professional & Scientific | 0 (0.0%) | 0 (0.0%) |
| Enterprise Management | 0 (0.0%) | 0 (0.0%) |
| Administrative & Support | 0 (0.0%) | 0 (0.0%) |
| Educational Services | 0 (0.0%) | 65 (100.0%) |
| Health Care & Social Assistance | 0 (0.0%) | 65 (100.0%) |
| Arts, Entertainment & Recreation | 30 (100.0%) | 0 (0.0%) |
| Accommodation & Food Services | 0 (0.0%) | 29 (100.0%) |
| Public Administration | 53 (100.0%) | 0 (0.0%) |
| Total | 136 (39.0%) | 213 (61.0%) |
Education in McGill
School Enrollment in McGill
The most common levels of schooling among the 165 students in McGill are middle school (62 | 37.6%), elementary school (43 | 26.1%), and college / undergraduate (30 | 18.2%).
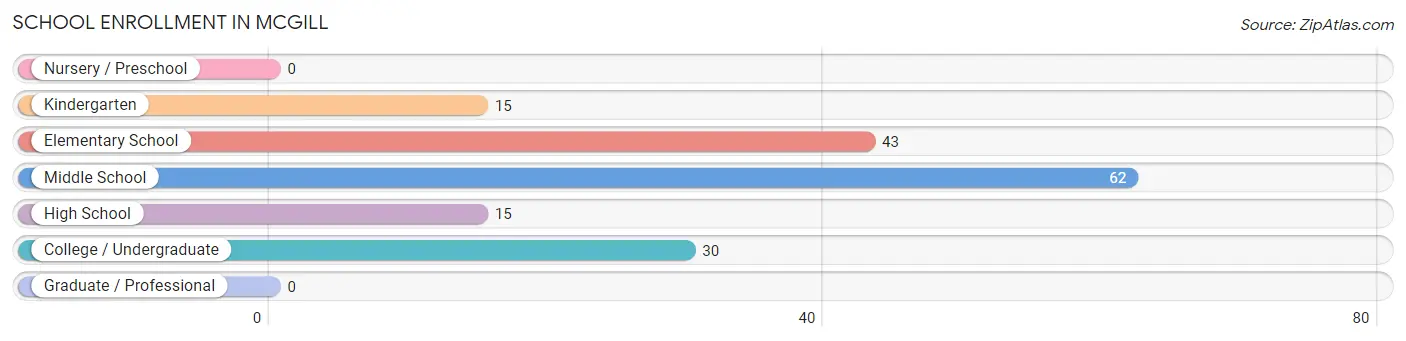
| School Level | # Students | % Students |
| Nursery / Preschool | 0 | 0.0% |
| Kindergarten | 15 | 9.1% |
| Elementary School | 43 | 26.1% |
| Middle School | 62 | 37.6% |
| High School | 15 | 9.1% |
| College / Undergraduate | 30 | 18.2% |
| Graduate / Professional | 0 | 0.0% |
| Total | 165 | 100.0% |
School Enrollment by Age by Funding Source in McGill
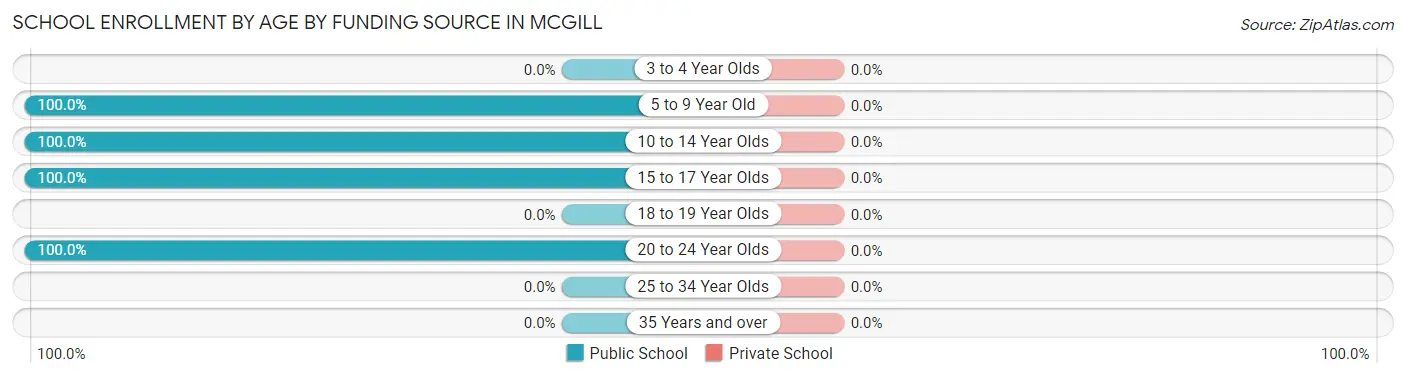
| Age Bracket | Public School | Private School |
| 3 to 4 Year Olds | 0 (0.0%) | 0 (0.0%) |
| 5 to 9 Year Old | 15 (100.0%) | 0 (0.0%) |
| 10 to 14 Year Olds | 105 (100.0%) | 0 (0.0%) |
| 15 to 17 Year Olds | 15 (100.0%) | 0 (0.0%) |
| 18 to 19 Year Olds | 0 (0.0%) | 0 (0.0%) |
| 20 to 24 Year Olds | 30 (100.0%) | 0 (0.0%) |
| 25 to 34 Year Olds | 0 (0.0%) | 0 (0.0%) |
| 35 Years and over | 0 (0.0%) | 0 (0.0%) |
| Total | 165 (100.0%) | 0 (0.0%) |
Educational Attainment by Field of Study in McGill
Science & technology (60 | 63.2%), psychology (17 | 17.9%), visual & performing arts (14 | 14.7%), and engineering (4 | 4.2%) are the most common fields of study among 95 individuals in McGill who have obtained a bachelor's degree or higher.
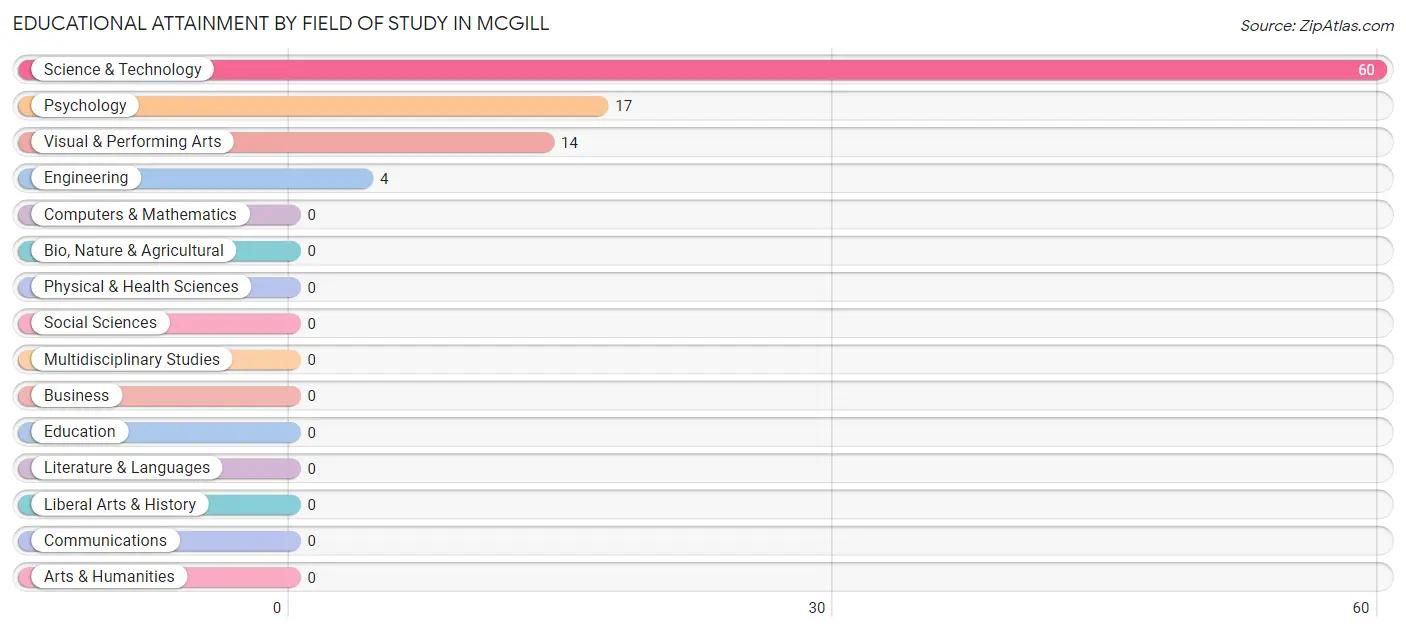
| Field of Study | # Graduates | % Graduates |
| Computers & Mathematics | 0 | 0.0% |
| Bio, Nature & Agricultural | 0 | 0.0% |
| Physical & Health Sciences | 0 | 0.0% |
| Psychology | 17 | 17.9% |
| Social Sciences | 0 | 0.0% |
| Engineering | 4 | 4.2% |
| Multidisciplinary Studies | 0 | 0.0% |
| Science & Technology | 60 | 63.2% |
| Business | 0 | 0.0% |
| Education | 0 | 0.0% |
| Literature & Languages | 0 | 0.0% |
| Liberal Arts & History | 0 | 0.0% |
| Visual & Performing Arts | 14 | 14.7% |
| Communications | 0 | 0.0% |
| Arts & Humanities | 0 | 0.0% |
| Total | 95 | 100.0% |
Transportation & Commute in McGill
Vehicle Availability by Sex in McGill
The most prevalent vehicle ownership categories in McGill are males with 2 vehicles (100, accounting for 73.5%) and females with 2 vehicles (86, making up 46.9%).
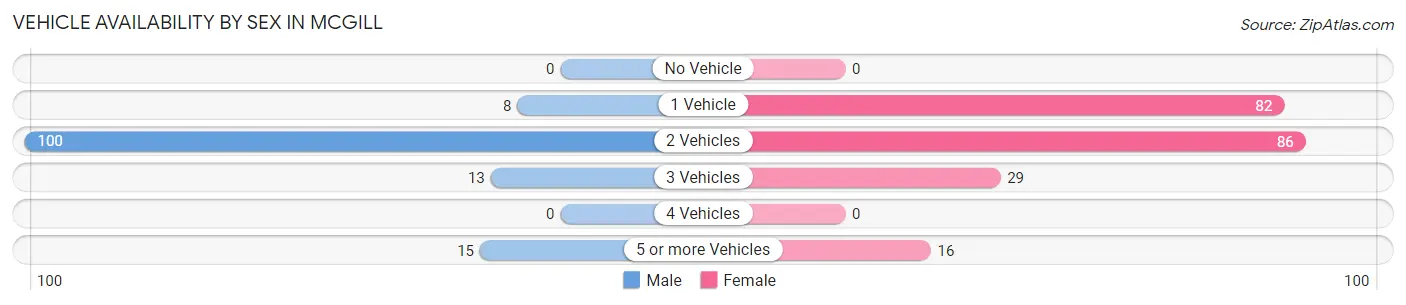
| Vehicles Available | Male | Female |
| No Vehicle | 0 (0.0%) | 0 (0.0%) |
| 1 Vehicle | 8 (5.9%) | 82 (38.5%) |
| 2 Vehicles | 100 (73.5%) | 86 (40.4%) |
| 3 Vehicles | 13 (9.6%) | 29 (13.6%) |
| 4 Vehicles | 0 (0.0%) | 0 (0.0%) |
| 5 or more Vehicles | 15 (11.0%) | 16 (7.5%) |
| Total | 136 (100.0%) | 213 (100.0%) |
Commute Time in McGill
The most frequently occuring commute durations in McGill are 20 to 24 minutes (229 commuters, 66.6%), 15 to 19 minutes (58 commuters, 16.9%), and 60 to 89 minutes (28 commuters, 8.1%).
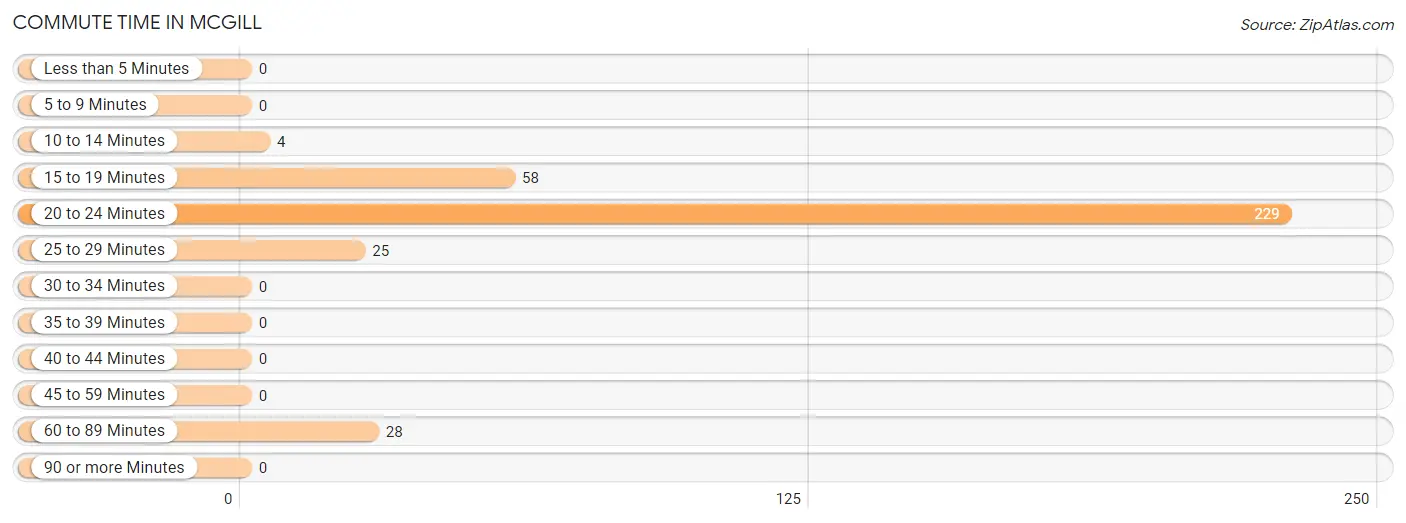
| Commute Time | # Commuters | % Commuters |
| Less than 5 Minutes | 0 | 0.0% |
| 5 to 9 Minutes | 0 | 0.0% |
| 10 to 14 Minutes | 4 | 1.2% |
| 15 to 19 Minutes | 58 | 16.9% |
| 20 to 24 Minutes | 229 | 66.6% |
| 25 to 29 Minutes | 25 | 7.3% |
| 30 to 34 Minutes | 0 | 0.0% |
| 35 to 39 Minutes | 0 | 0.0% |
| 40 to 44 Minutes | 0 | 0.0% |
| 45 to 59 Minutes | 0 | 0.0% |
| 60 to 89 Minutes | 28 | 8.1% |
| 90 or more Minutes | 0 | 0.0% |
Commute Time by Sex in McGill
The most common commute times in McGill are 20 to 24 minutes (75 commuters, 55.1%) for males and 20 to 24 minutes (154 commuters, 74.0%) for females.
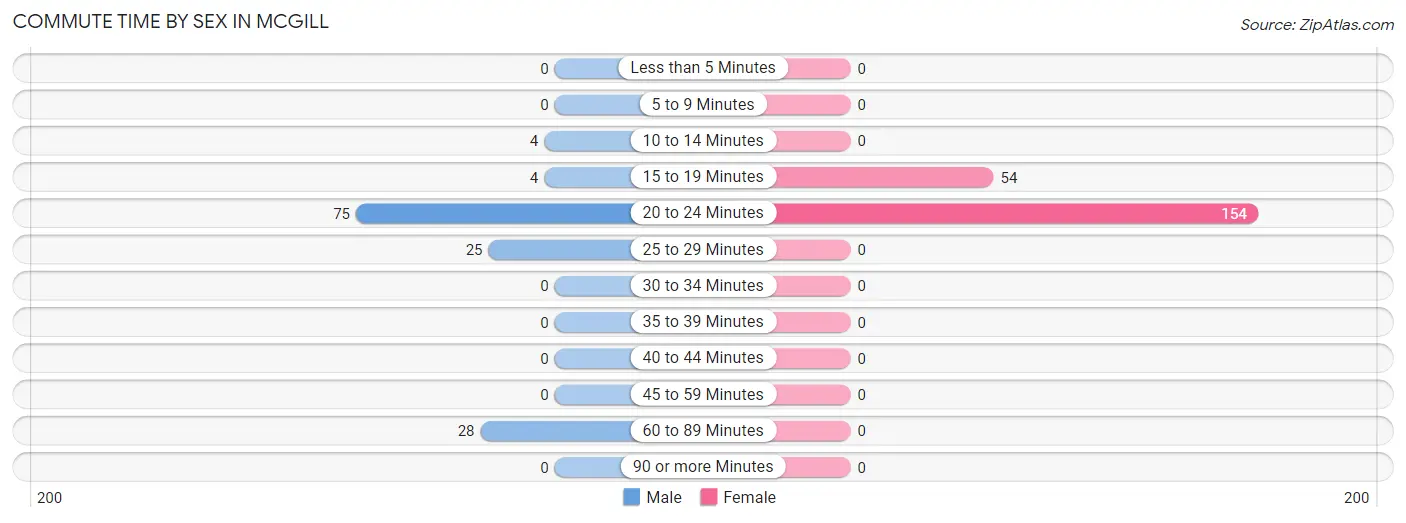
| Commute Time | Male | Female |
| Less than 5 Minutes | 0 (0.0%) | 0 (0.0%) |
| 5 to 9 Minutes | 0 (0.0%) | 0 (0.0%) |
| 10 to 14 Minutes | 4 (2.9%) | 0 (0.0%) |
| 15 to 19 Minutes | 4 (2.9%) | 54 (26.0%) |
| 20 to 24 Minutes | 75 (55.1%) | 154 (74.0%) |
| 25 to 29 Minutes | 25 (18.4%) | 0 (0.0%) |
| 30 to 34 Minutes | 0 (0.0%) | 0 (0.0%) |
| 35 to 39 Minutes | 0 (0.0%) | 0 (0.0%) |
| 40 to 44 Minutes | 0 (0.0%) | 0 (0.0%) |
| 45 to 59 Minutes | 0 (0.0%) | 0 (0.0%) |
| 60 to 89 Minutes | 28 (20.6%) | 0 (0.0%) |
| 90 or more Minutes | 0 (0.0%) | 0 (0.0%) |
Time of Departure to Work by Sex in McGill
The most frequent times of departure to work in McGill are 12:00 AM to 4:59 AM (128, 94.1%) for males and 6:30 AM to 6:59 AM (86, 41.3%) for females.
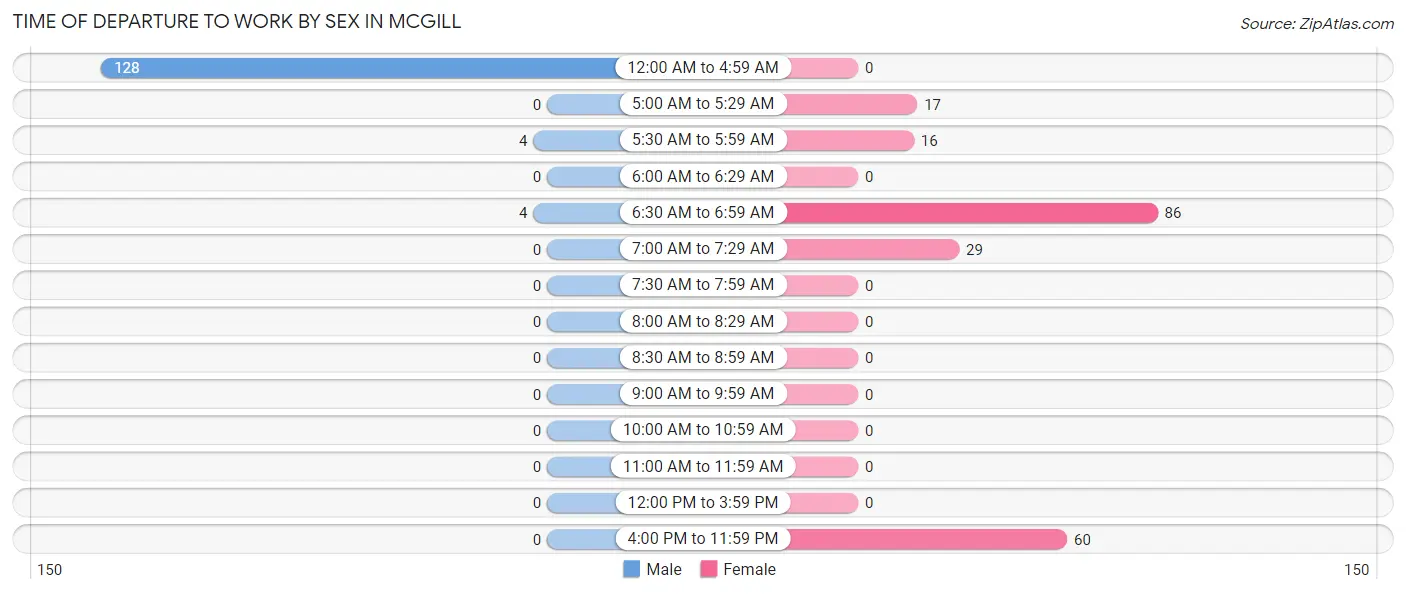
| Time of Departure | Male | Female |
| 12:00 AM to 4:59 AM | 128 (94.1%) | 0 (0.0%) |
| 5:00 AM to 5:29 AM | 0 (0.0%) | 17 (8.2%) |
| 5:30 AM to 5:59 AM | 4 (2.9%) | 16 (7.7%) |
| 6:00 AM to 6:29 AM | 0 (0.0%) | 0 (0.0%) |
| 6:30 AM to 6:59 AM | 4 (2.9%) | 86 (41.3%) |
| 7:00 AM to 7:29 AM | 0 (0.0%) | 29 (13.9%) |
| 7:30 AM to 7:59 AM | 0 (0.0%) | 0 (0.0%) |
| 8:00 AM to 8:29 AM | 0 (0.0%) | 0 (0.0%) |
| 8:30 AM to 8:59 AM | 0 (0.0%) | 0 (0.0%) |
| 9:00 AM to 9:59 AM | 0 (0.0%) | 0 (0.0%) |
| 10:00 AM to 10:59 AM | 0 (0.0%) | 0 (0.0%) |
| 11:00 AM to 11:59 AM | 0 (0.0%) | 0 (0.0%) |
| 12:00 PM to 3:59 PM | 0 (0.0%) | 0 (0.0%) |
| 4:00 PM to 11:59 PM | 0 (0.0%) | 60 (28.8%) |
| Total | 136 (100.0%) | 208 (100.0%) |
Housing Occupancy in McGill
Occupancy by Ownership in McGill
Of the total 415 dwellings in McGill, owner-occupied units account for 348 (83.9%), while renter-occupied units make up 67 (16.1%).
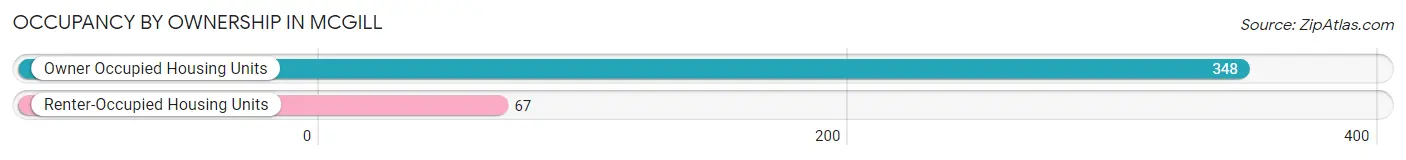
| Occupancy | # Housing Units | % Housing Units |
| Owner Occupied Housing Units | 348 | 83.9% |
| Renter-Occupied Housing Units | 67 | 16.1% |
| Total Occupied Housing Units | 415 | 100.0% |
Occupancy by Household Size in McGill
| Household Size | # Housing Units | % Housing Units |
| 1-Person Household | 152 | 36.6% |
| 2-Person Household | 174 | 41.9% |
| 3-Person Household | 76 | 18.3% |
| 4+ Person Household | 13 | 3.1% |
| Total Housing Units | 415 | 100.0% |
Occupancy by Ownership by Household Size in McGill
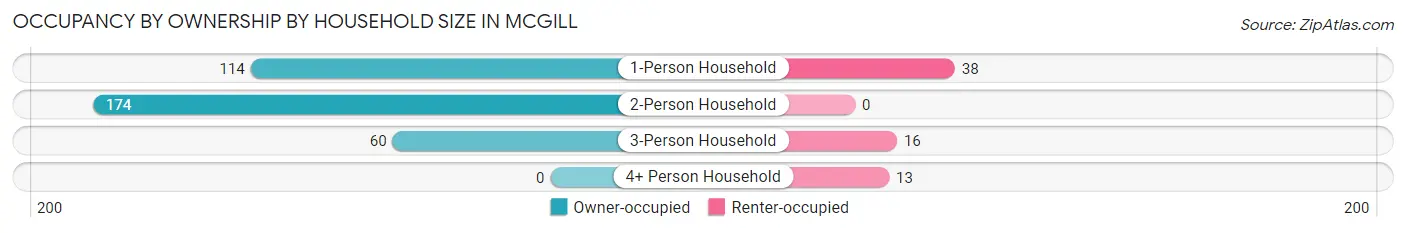
| Household Size | Owner-occupied | Renter-occupied |
| 1-Person Household | 114 (75.0%) | 38 (25.0%) |
| 2-Person Household | 174 (100.0%) | 0 (0.0%) |
| 3-Person Household | 60 (78.9%) | 16 (21.0%) |
| 4+ Person Household | 0 (0.0%) | 13 (100.0%) |
| Total Housing Units | 348 (83.9%) | 67 (16.1%) |
Occupancy by Educational Attainment in McGill
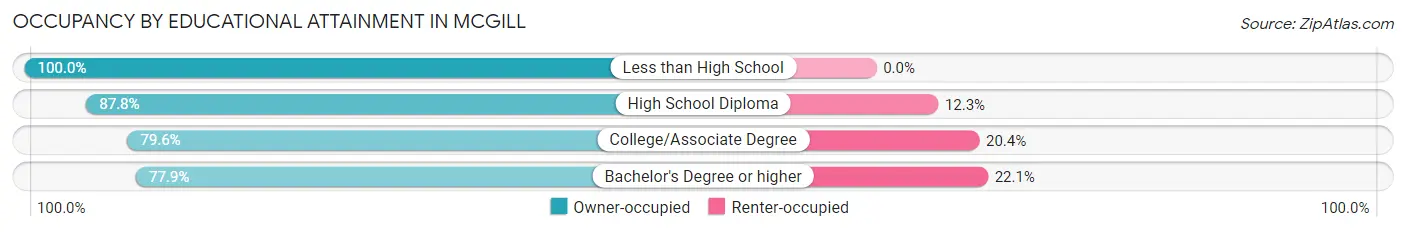
| Household Size | Owner-occupied | Renter-occupied |
| Less than High School | 13 (100.0%) | 0 (0.0%) |
| High School Diploma | 179 (87.7%) | 25 (12.2%) |
| College/Associate Degree | 82 (79.6%) | 21 (20.4%) |
| Bachelor's Degree or higher | 74 (77.9%) | 21 (22.1%) |
Occupancy by Age of Householder in McGill
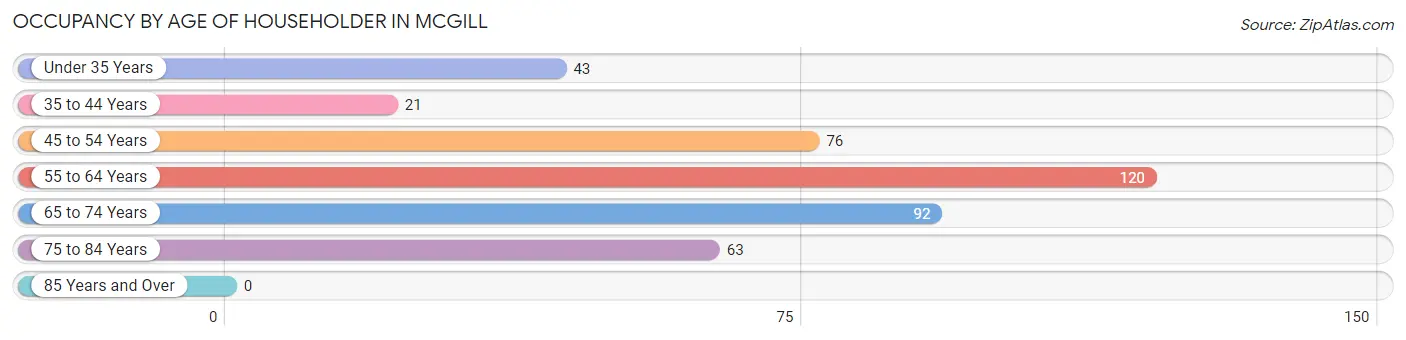
| Age Bracket | # Households | % Households |
| Under 35 Years | 43 | 10.4% |
| 35 to 44 Years | 21 | 5.1% |
| 45 to 54 Years | 76 | 18.3% |
| 55 to 64 Years | 120 | 28.9% |
| 65 to 74 Years | 92 | 22.2% |
| 75 to 84 Years | 63 | 15.2% |
| 85 Years and Over | 0 | 0.0% |
| Total | 415 | 100.0% |
Housing Finances in McGill
Median Income by Occupancy in McGill
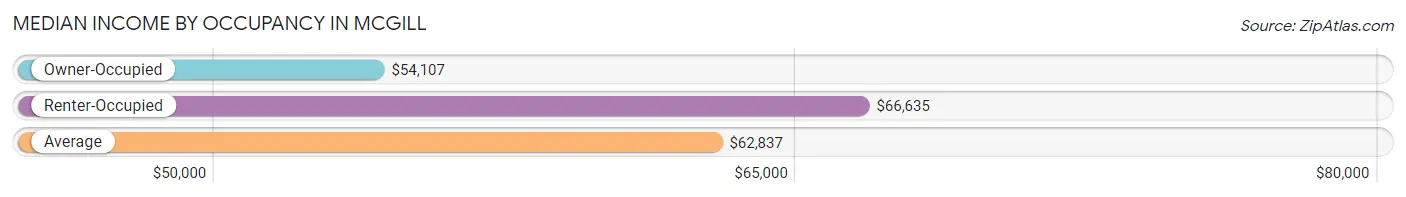
| Occupancy Type | # Households | Median Income |
| Owner-Occupied | 348 (83.9%) | $54,107 |
| Renter-Occupied | 67 (16.1%) | $66,635 |
| Average | 415 (100.0%) | $62,837 |
Occupancy by Householder Income Bracket in McGill
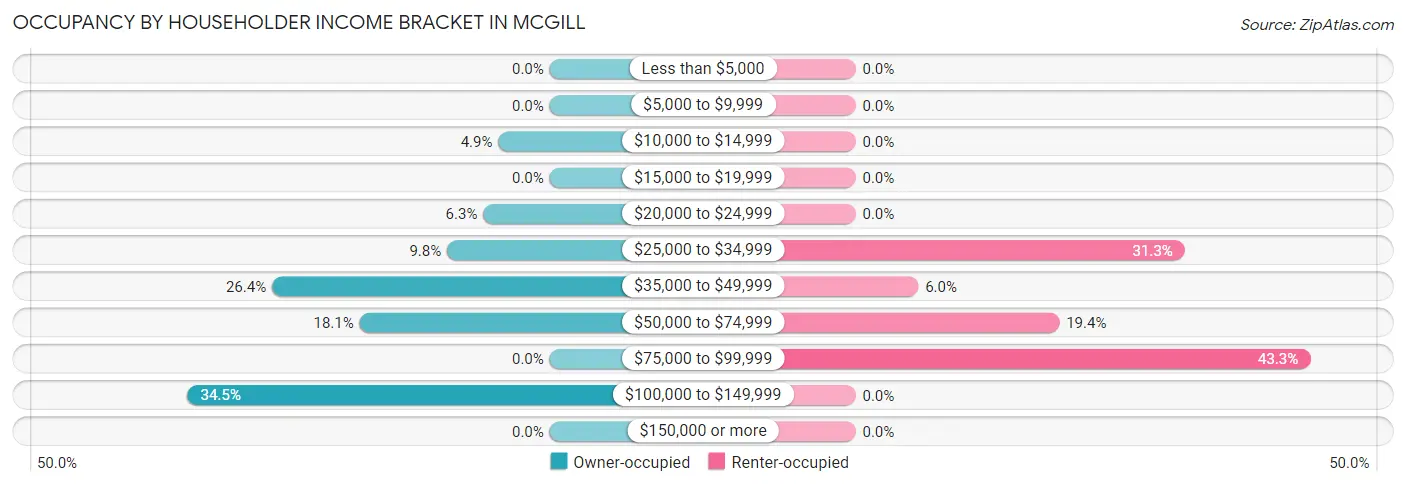
| Income Bracket | Owner-occupied | Renter-occupied |
| Less than $5,000 | 0 (0.0%) | 0 (0.0%) |
| $5,000 to $9,999 | 0 (0.0%) | 0 (0.0%) |
| $10,000 to $14,999 | 17 (4.9%) | 0 (0.0%) |
| $15,000 to $19,999 | 0 (0.0%) | 0 (0.0%) |
| $20,000 to $24,999 | 22 (6.3%) | 0 (0.0%) |
| $25,000 to $34,999 | 34 (9.8%) | 21 (31.3%) |
| $35,000 to $49,999 | 92 (26.4%) | 4 (6.0%) |
| $50,000 to $74,999 | 63 (18.1%) | 13 (19.4%) |
| $75,000 to $99,999 | 0 (0.0%) | 29 (43.3%) |
| $100,000 to $149,999 | 120 (34.5%) | 0 (0.0%) |
| $150,000 or more | 0 (0.0%) | 0 (0.0%) |
| Total | 348 (100.0%) | 67 (100.0%) |
Monthly Housing Cost Tiers in McGill
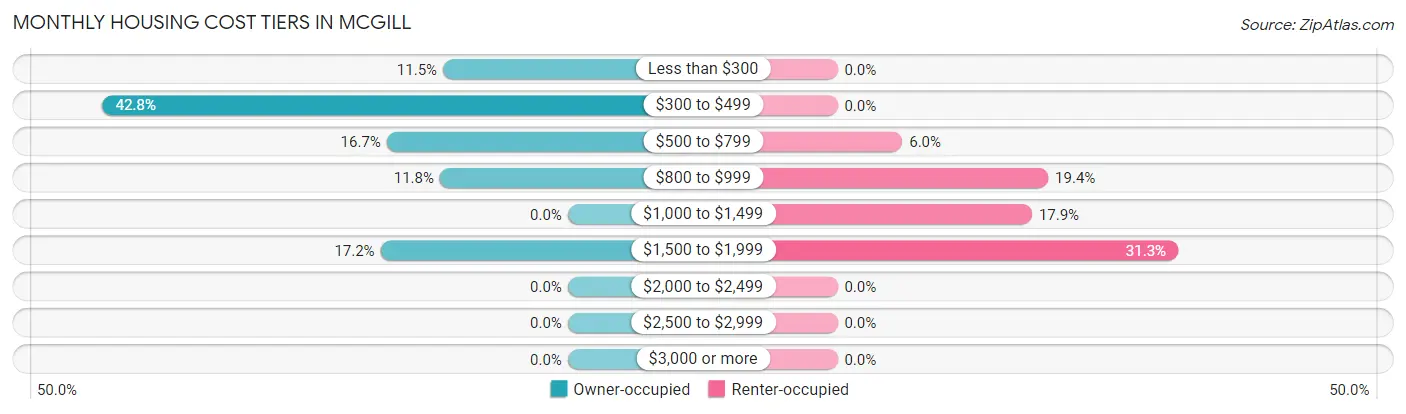
| Monthly Cost | Owner-occupied | Renter-occupied |
| Less than $300 | 40 (11.5%) | 0 (0.0%) |
| $300 to $499 | 149 (42.8%) | 0 (0.0%) |
| $500 to $799 | 58 (16.7%) | 4 (6.0%) |
| $800 to $999 | 41 (11.8%) | 13 (19.4%) |
| $1,000 to $1,499 | 0 (0.0%) | 12 (17.9%) |
| $1,500 to $1,999 | 60 (17.2%) | 21 (31.3%) |
| $2,000 to $2,499 | 0 (0.0%) | 0 (0.0%) |
| $2,500 to $2,999 | 0 (0.0%) | 0 (0.0%) |
| $3,000 or more | 0 (0.0%) | 0 (0.0%) |
| Total | 348 (100.0%) | 67 (100.0%) |
Physical Housing Characteristics in McGill
Housing Structures in McGill
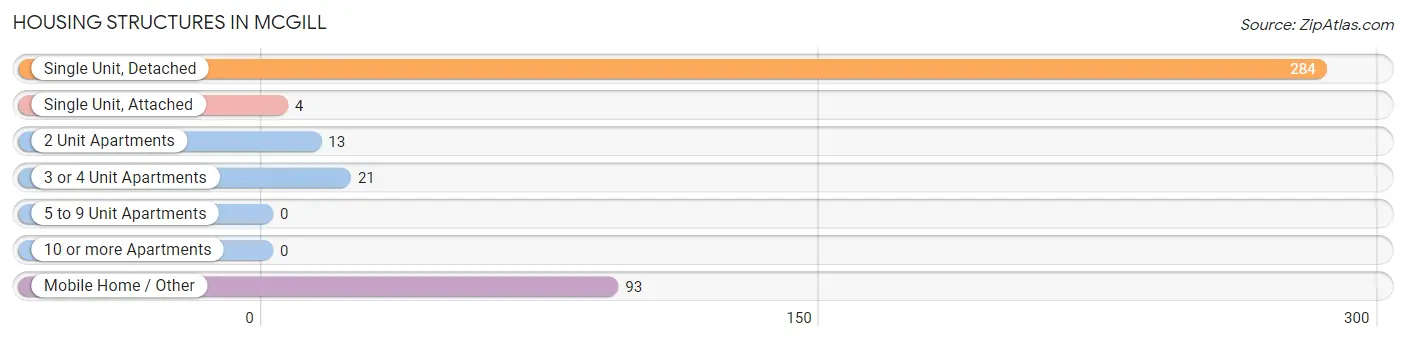
| Structure Type | # Housing Units | % Housing Units |
| Single Unit, Detached | 284 | 68.4% |
| Single Unit, Attached | 4 | 1.0% |
| 2 Unit Apartments | 13 | 3.1% |
| 3 or 4 Unit Apartments | 21 | 5.1% |
| 5 to 9 Unit Apartments | 0 | 0.0% |
| 10 or more Apartments | 0 | 0.0% |
| Mobile Home / Other | 93 | 22.4% |
| Total | 415 | 100.0% |
Housing Structures by Occupancy in McGill
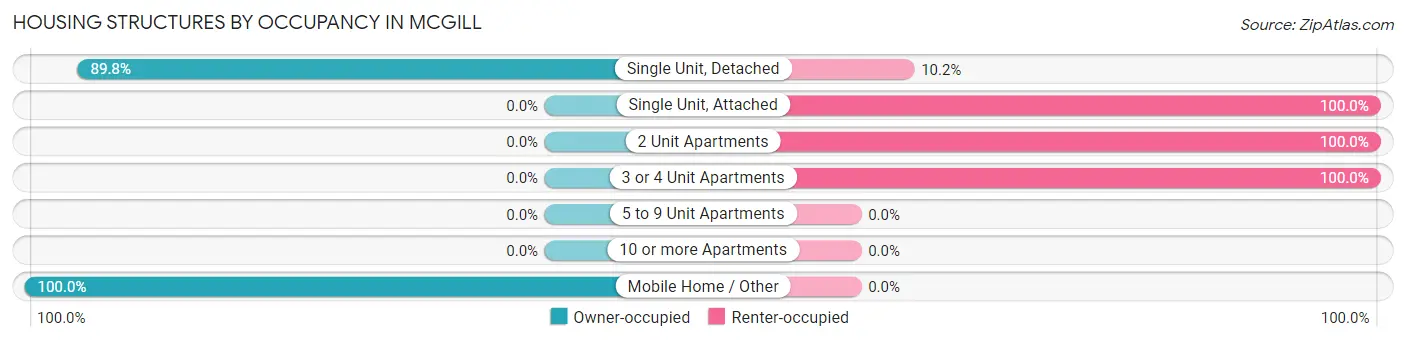
| Structure Type | Owner-occupied | Renter-occupied |
| Single Unit, Detached | 255 (89.8%) | 29 (10.2%) |
| Single Unit, Attached | 0 (0.0%) | 4 (100.0%) |
| 2 Unit Apartments | 0 (0.0%) | 13 (100.0%) |
| 3 or 4 Unit Apartments | 0 (0.0%) | 21 (100.0%) |
| 5 to 9 Unit Apartments | 0 (0.0%) | 0 (0.0%) |
| 10 or more Apartments | 0 (0.0%) | 0 (0.0%) |
| Mobile Home / Other | 93 (100.0%) | 0 (0.0%) |
| Total | 348 (83.9%) | 67 (16.1%) |
Housing Structures by Number of Rooms in McGill
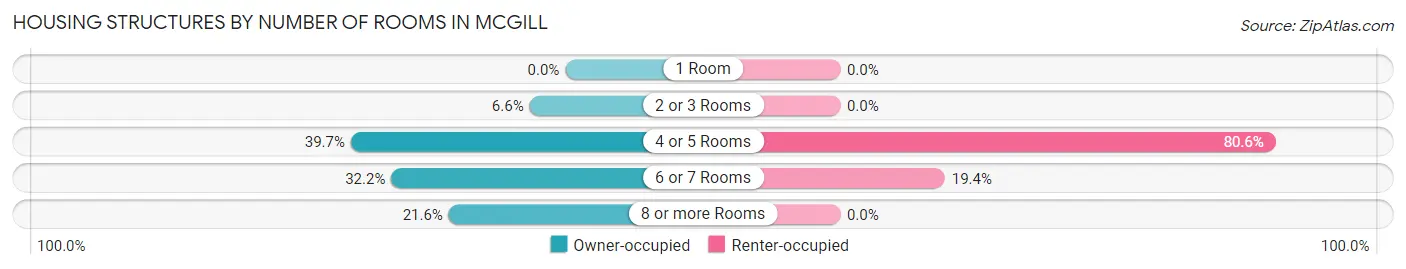
| Number of Rooms | Owner-occupied | Renter-occupied |
| 1 Room | 0 (0.0%) | 0 (0.0%) |
| 2 or 3 Rooms | 23 (6.6%) | 0 (0.0%) |
| 4 or 5 Rooms | 138 (39.7%) | 54 (80.6%) |
| 6 or 7 Rooms | 112 (32.2%) | 13 (19.4%) |
| 8 or more Rooms | 75 (21.5%) | 0 (0.0%) |
| Total | 348 (100.0%) | 67 (100.0%) |
Housing Structure by Heating Type in McGill
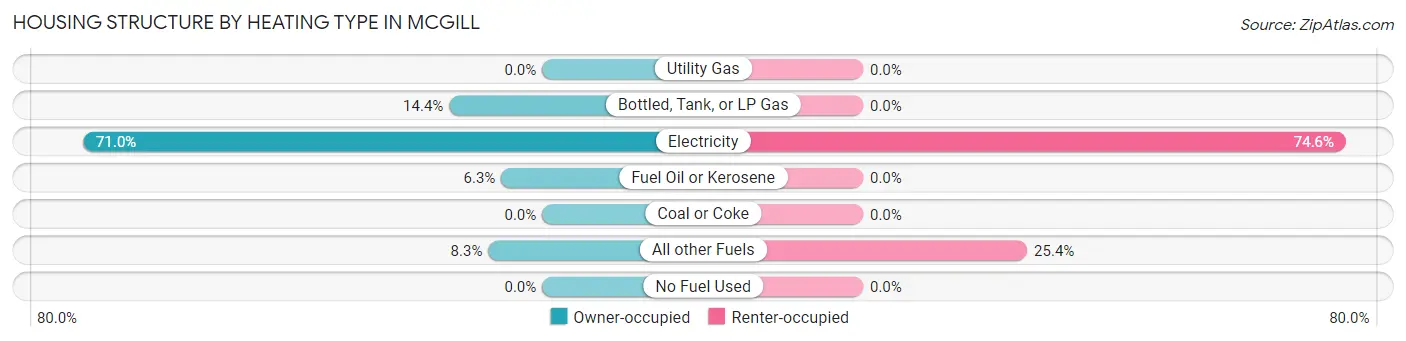
| Heating Type | Owner-occupied | Renter-occupied |
| Utility Gas | 0 (0.0%) | 0 (0.0%) |
| Bottled, Tank, or LP Gas | 50 (14.4%) | 0 (0.0%) |
| Electricity | 247 (71.0%) | 50 (74.6%) |
| Fuel Oil or Kerosene | 22 (6.3%) | 0 (0.0%) |
| Coal or Coke | 0 (0.0%) | 0 (0.0%) |
| All other Fuels | 29 (8.3%) | 17 (25.4%) |
| No Fuel Used | 0 (0.0%) | 0 (0.0%) |
| Total | 348 (100.0%) | 67 (100.0%) |
Household Vehicle Usage in McGill
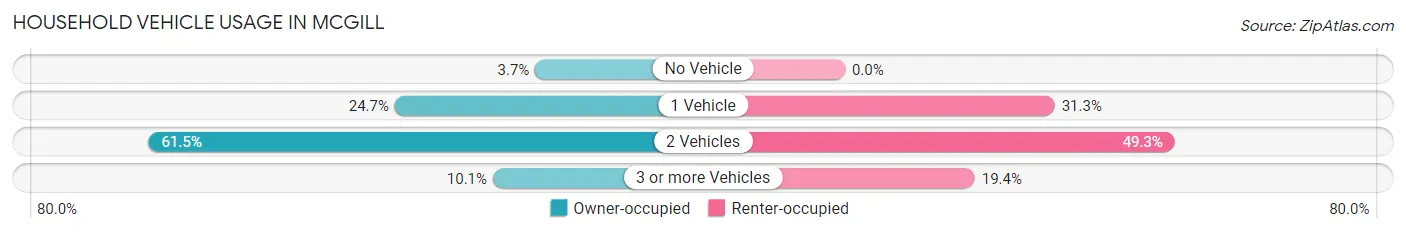
| Vehicles per Household | Owner-occupied | Renter-occupied |
| No Vehicle | 13 (3.7%) | 0 (0.0%) |
| 1 Vehicle | 86 (24.7%) | 21 (31.3%) |
| 2 Vehicles | 214 (61.5%) | 33 (49.2%) |
| 3 or more Vehicles | 35 (10.1%) | 13 (19.4%) |
| Total | 348 (100.0%) | 67 (100.0%) |
Real Estate & Mortgages in McGill
Real Estate and Mortgage Overview in McGill
| Characteristic | Without Mortgage | With Mortgage |
| Housing Units | 234 | 114 |
| Median Property Value | $88,800 | $215,200 |
| Median Household Income | $49,464 | $0 |
| Monthly Housing Costs | $447 | $0 |
| Real Estate Taxes | $545 | $4 |
Property Value by Mortgage Status in McGill
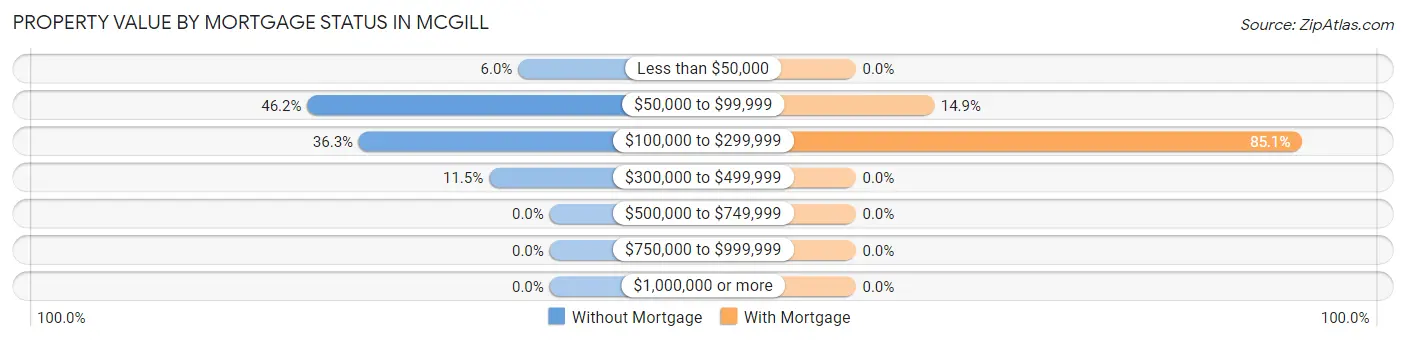
| Property Value | Without Mortgage | With Mortgage |
| Less than $50,000 | 14 (6.0%) | 0 (0.0%) |
| $50,000 to $99,999 | 108 (46.2%) | 17 (14.9%) |
| $100,000 to $299,999 | 85 (36.3%) | 97 (85.1%) |
| $300,000 to $499,999 | 27 (11.5%) | 0 (0.0%) |
| $500,000 to $749,999 | 0 (0.0%) | 0 (0.0%) |
| $750,000 to $999,999 | 0 (0.0%) | 0 (0.0%) |
| $1,000,000 or more | 0 (0.0%) | 0 (0.0%) |
| Total | 234 (100.0%) | 114 (100.0%) |
Household Income by Mortgage Status in McGill
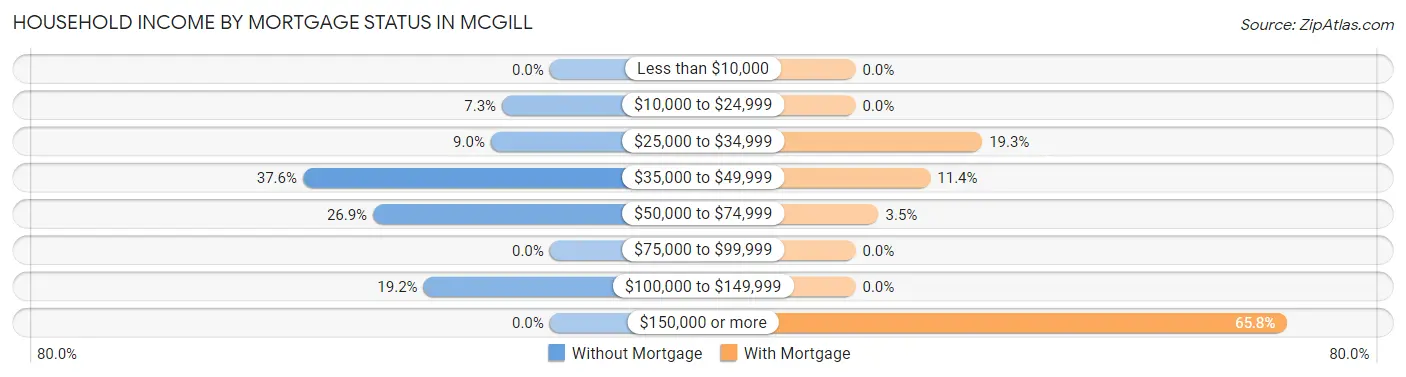
| Household Income | Without Mortgage | With Mortgage |
| Less than $10,000 | 0 (0.0%) | 0 (0.0%) |
| $10,000 to $24,999 | 17 (7.3%) | 0 (0.0%) |
| $25,000 to $34,999 | 21 (9.0%) | 22 (19.3%) |
| $35,000 to $49,999 | 88 (37.6%) | 13 (11.4%) |
| $50,000 to $74,999 | 63 (26.9%) | 4 (3.5%) |
| $75,000 to $99,999 | 0 (0.0%) | 0 (0.0%) |
| $100,000 to $149,999 | 45 (19.2%) | 0 (0.0%) |
| $150,000 or more | 0 (0.0%) | 75 (65.8%) |
| Total | 234 (100.0%) | 114 (100.0%) |
Property Value to Household Income Ratio in McGill
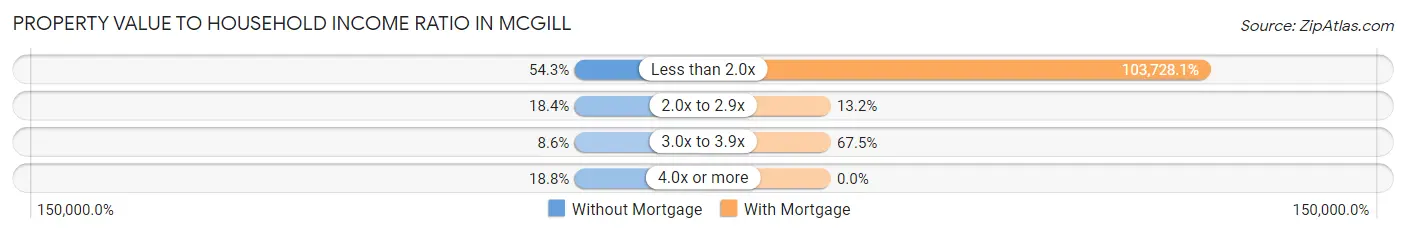
| Value-to-Income Ratio | Without Mortgage | With Mortgage |
| Less than 2.0x | 127 (54.3%) | 118,250 (103,728.1%) |
| 2.0x to 2.9x | 43 (18.4%) | 15 (13.2%) |
| 3.0x to 3.9x | 20 (8.6%) | 77 (67.5%) |
| 4.0x or more | 44 (18.8%) | 0 (0.0%) |
| Total | 234 (100.0%) | 114 (100.0%) |
Real Estate Taxes by Mortgage Status in McGill
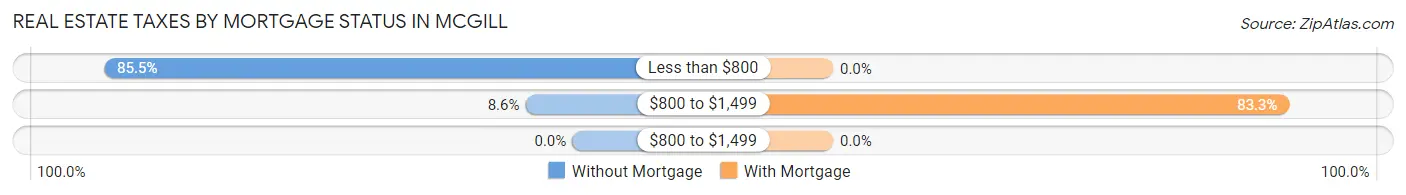
| Property Taxes | Without Mortgage | With Mortgage |
| Less than $800 | 200 (85.5%) | 0 (0.0%) |
| $800 to $1,499 | 20 (8.6%) | 95 (83.3%) |
| $800 to $1,499 | 0 (0.0%) | 0 (0.0%) |
| Total | 234 (100.0%) | 114 (100.0%) |
Health & Disability in McGill
Health Insurance Coverage by Age in McGill
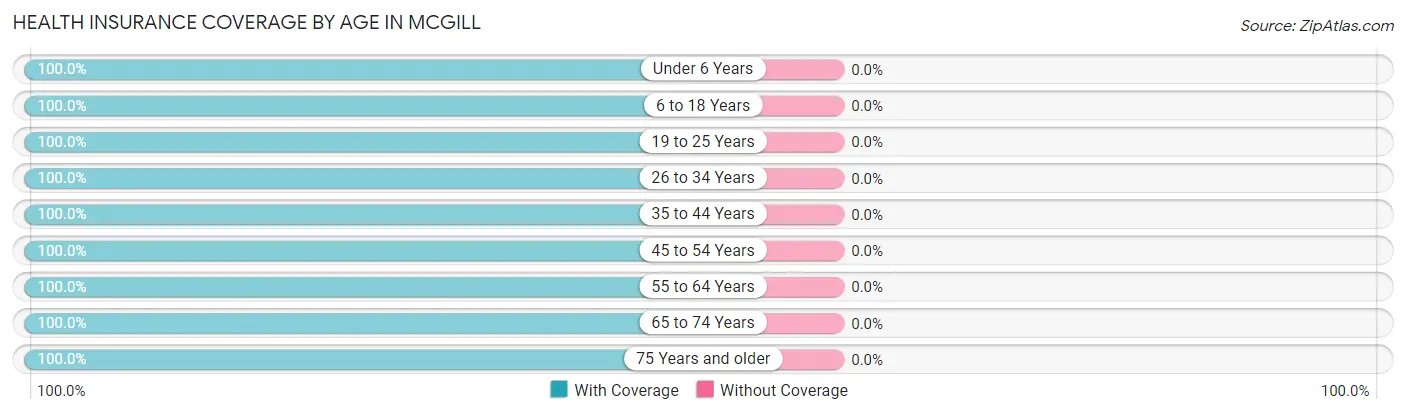
| Age Bracket | With Coverage | Without Coverage |
| Under 6 Years | 75 (100.0%) | 0 (0.0%) |
| 6 to 18 Years | 120 (100.0%) | 0 (0.0%) |
| 19 to 25 Years | 60 (100.0%) | 0 (0.0%) |
| 26 to 34 Years | 42 (100.0%) | 0 (0.0%) |
| 35 to 44 Years | 91 (100.0%) | 0 (0.0%) |
| 45 to 54 Years | 92 (100.0%) | 0 (0.0%) |
| 55 to 64 Years | 180 (100.0%) | 0 (0.0%) |
| 65 to 74 Years | 136 (100.0%) | 0 (0.0%) |
| 75 Years and older | 83 (100.0%) | 0 (0.0%) |
| Total | 879 (100.0%) | 0 (0.0%) |
Health Insurance Coverage by Citizenship Status in McGill
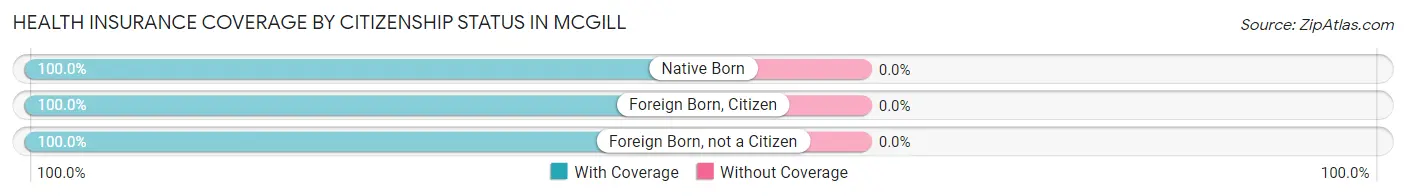
| Citizenship Status | With Coverage | Without Coverage |
| Native Born | 75 (100.0%) | 0 (0.0%) |
| Foreign Born, Citizen | 120 (100.0%) | 0 (0.0%) |
| Foreign Born, not a Citizen | 60 (100.0%) | 0 (0.0%) |
Health Insurance Coverage by Household Income in McGill
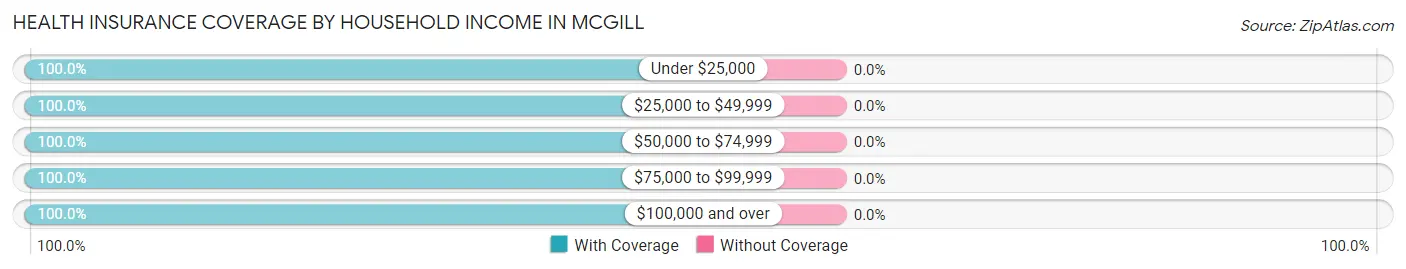
| Household Income | With Coverage | Without Coverage |
| Under $25,000 | 60 (100.0%) | 0 (0.0%) |
| $25,000 to $49,999 | 246 (100.0%) | 0 (0.0%) |
| $50,000 to $74,999 | 198 (100.0%) | 0 (0.0%) |
| $75,000 to $99,999 | 67 (100.0%) | 0 (0.0%) |
| $100,000 and over | 308 (100.0%) | 0 (0.0%) |
Public vs Private Health Insurance Coverage by Age in McGill
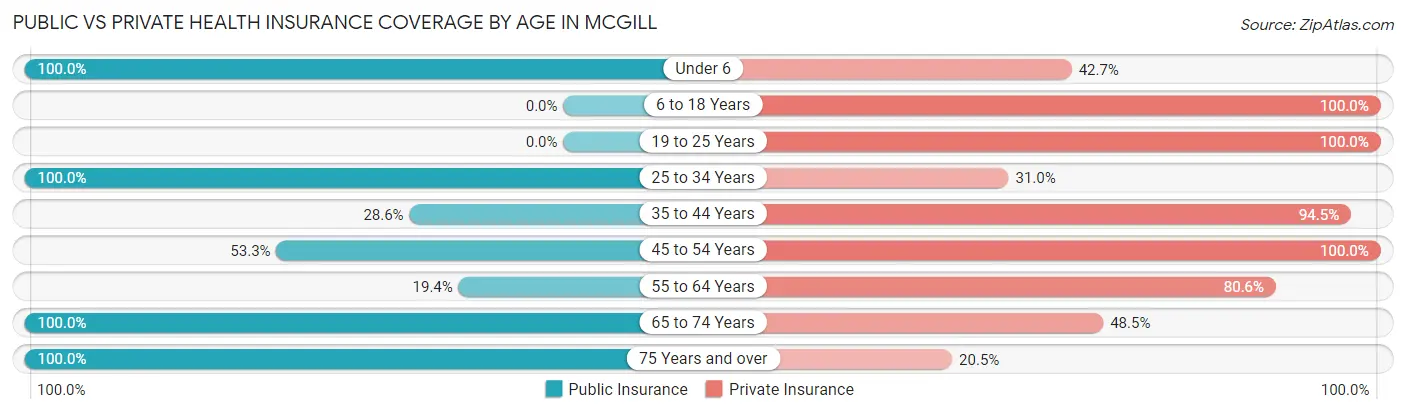
| Age Bracket | Public Insurance | Private Insurance |
| Under 6 | 75 (100.0%) | 32 (42.7%) |
| 6 to 18 Years | 0 (0.0%) | 120 (100.0%) |
| 19 to 25 Years | 0 (0.0%) | 60 (100.0%) |
| 25 to 34 Years | 42 (100.0%) | 13 (30.9%) |
| 35 to 44 Years | 26 (28.6%) | 86 (94.5%) |
| 45 to 54 Years | 49 (53.3%) | 92 (100.0%) |
| 55 to 64 Years | 35 (19.4%) | 145 (80.6%) |
| 65 to 74 Years | 136 (100.0%) | 66 (48.5%) |
| 75 Years and over | 83 (100.0%) | 17 (20.5%) |
| Total | 446 (50.7%) | 631 (71.8%) |
Disability Status by Sex by Age in McGill
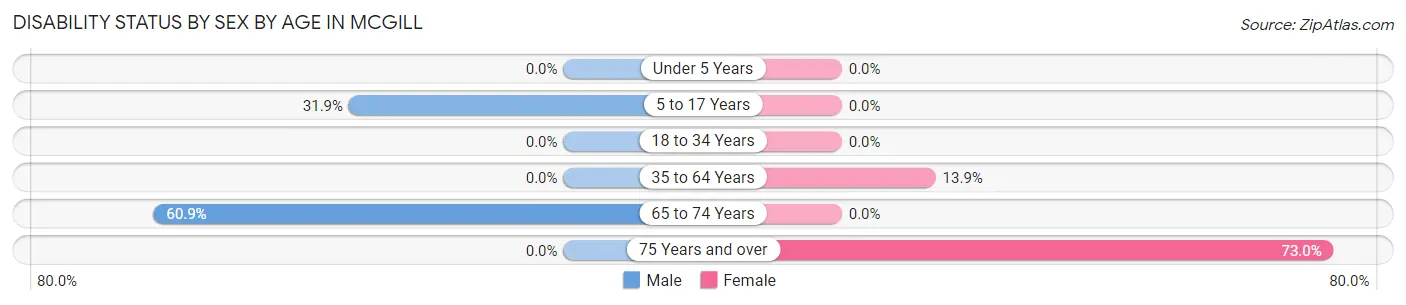
| Age Bracket | Male | Female |
| Under 5 Years | 0 (0.0%) | 0 (0.0%) |
| 5 to 17 Years | 43 (31.9%) | 0 (0.0%) |
| 18 to 34 Years | 0 (0.0%) | 0 (0.0%) |
| 35 to 64 Years | 0 (0.0%) | 35 (13.9%) |
| 65 to 74 Years | 70 (60.9%) | 0 (0.0%) |
| 75 Years and over | 0 (0.0%) | 46 (73.0%) |
Disability Class by Sex by Age in McGill
Disability Class: Hearing Difficulty
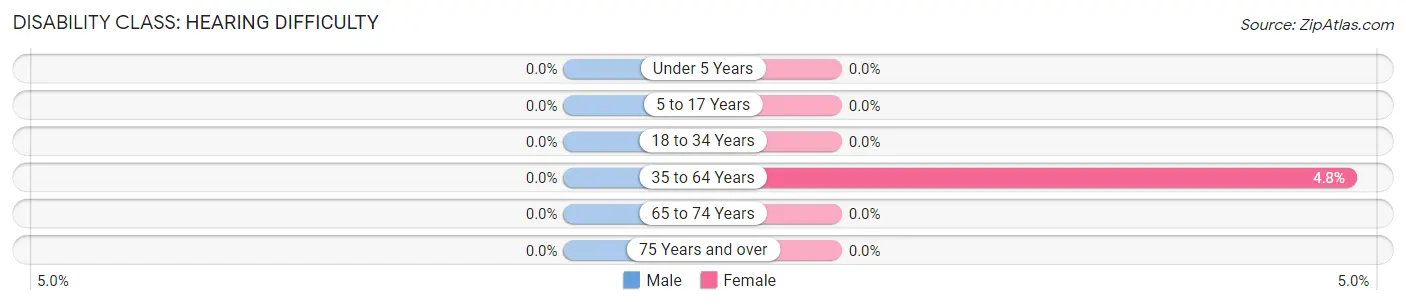
| Age Bracket | Male | Female |
| Under 5 Years | 0 (0.0%) | 0 (0.0%) |
| 5 to 17 Years | 0 (0.0%) | 0 (0.0%) |
| 18 to 34 Years | 0 (0.0%) | 0 (0.0%) |
| 35 to 64 Years | 0 (0.0%) | 12 (4.8%) |
| 65 to 74 Years | 0 (0.0%) | 0 (0.0%) |
| 75 Years and over | 0 (0.0%) | 0 (0.0%) |
Disability Class: Vision Difficulty
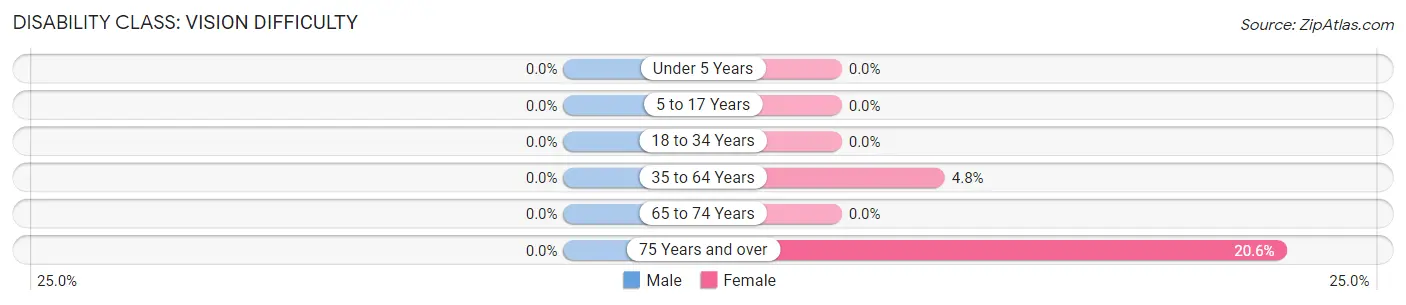
| Age Bracket | Male | Female |
| Under 5 Years | 0 (0.0%) | 0 (0.0%) |
| 5 to 17 Years | 0 (0.0%) | 0 (0.0%) |
| 18 to 34 Years | 0 (0.0%) | 0 (0.0%) |
| 35 to 64 Years | 0 (0.0%) | 12 (4.8%) |
| 65 to 74 Years | 0 (0.0%) | 0 (0.0%) |
| 75 Years and over | 0 (0.0%) | 13 (20.6%) |
Disability Class: Cognitive Difficulty
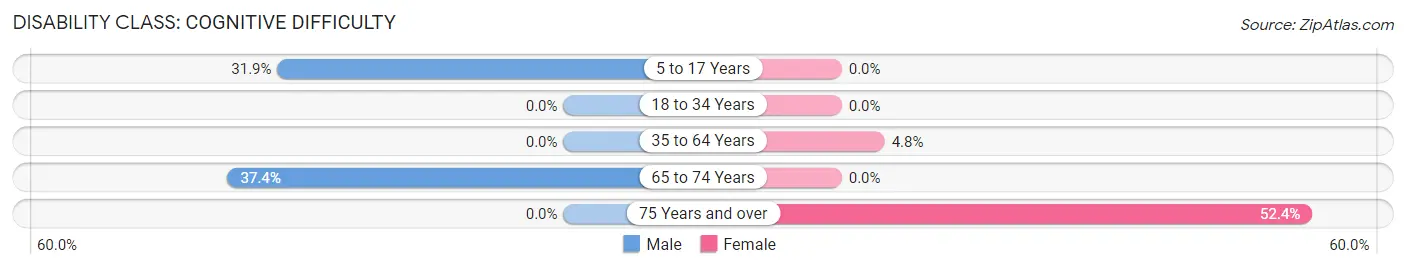
| Age Bracket | Male | Female |
| 5 to 17 Years | 43 (31.9%) | 0 (0.0%) |
| 18 to 34 Years | 0 (0.0%) | 0 (0.0%) |
| 35 to 64 Years | 0 (0.0%) | 12 (4.8%) |
| 65 to 74 Years | 43 (37.4%) | 0 (0.0%) |
| 75 Years and over | 0 (0.0%) | 33 (52.4%) |
Disability Class: Ambulatory Difficulty
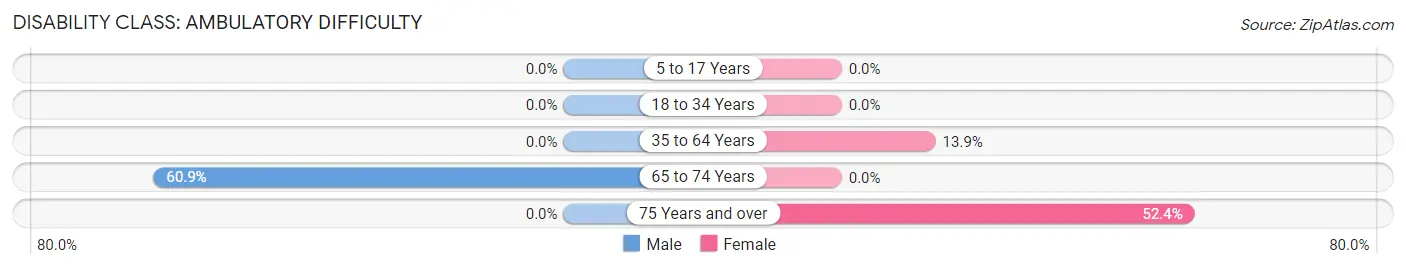
| Age Bracket | Male | Female |
| 5 to 17 Years | 0 (0.0%) | 0 (0.0%) |
| 18 to 34 Years | 0 (0.0%) | 0 (0.0%) |
| 35 to 64 Years | 0 (0.0%) | 35 (13.9%) |
| 65 to 74 Years | 70 (60.9%) | 0 (0.0%) |
| 75 Years and over | 0 (0.0%) | 33 (52.4%) |
Disability Class: Self-Care Difficulty
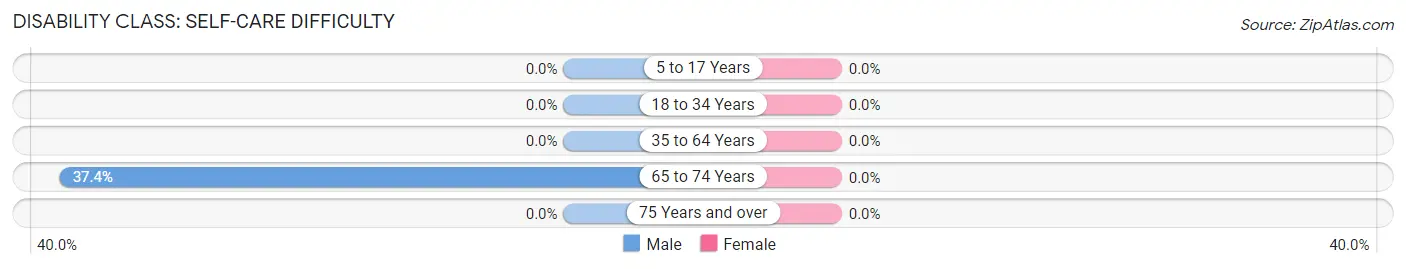
| Age Bracket | Male | Female |
| 5 to 17 Years | 0 (0.0%) | 0 (0.0%) |
| 18 to 34 Years | 0 (0.0%) | 0 (0.0%) |
| 35 to 64 Years | 0 (0.0%) | 0 (0.0%) |
| 65 to 74 Years | 43 (37.4%) | 0 (0.0%) |
| 75 Years and over | 0 (0.0%) | 0 (0.0%) |
Technology Access in McGill
Computing Device Access in McGill
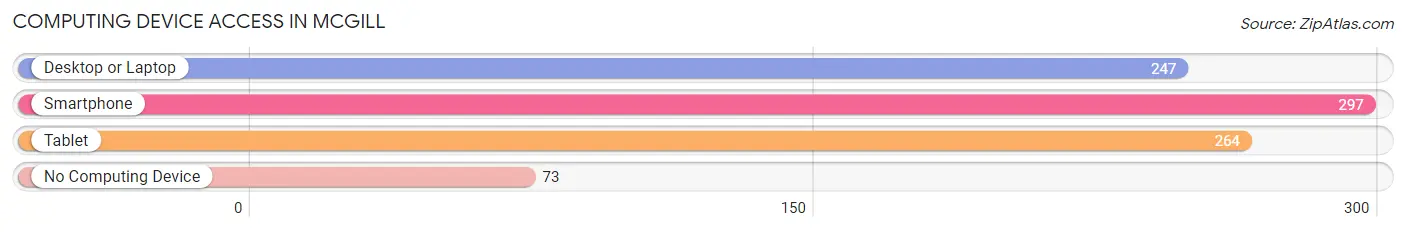
| Device Type | # Households | % Households |
| Desktop or Laptop | 247 | 59.5% |
| Smartphone | 297 | 71.6% |
| Tablet | 264 | 63.6% |
| No Computing Device | 73 | 17.6% |
| Total | 415 | 100.0% |
Internet Access in McGill
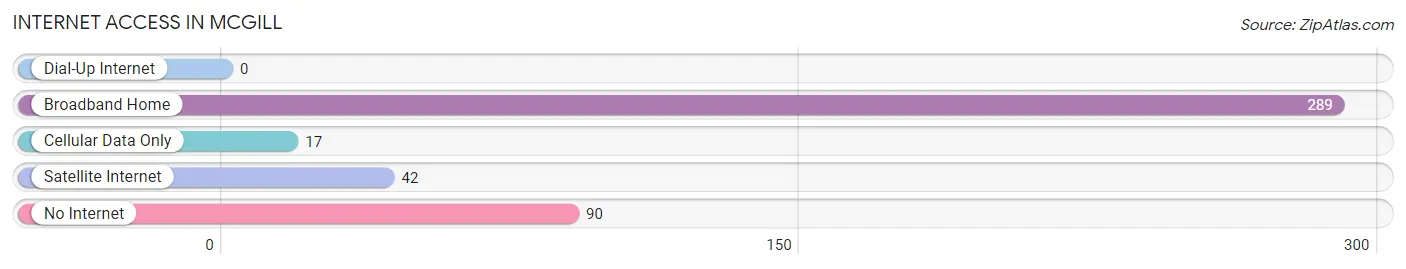
| Internet Type | # Households | % Households |
| Dial-Up Internet | 0 | 0.0% |
| Broadband Home | 289 | 69.6% |
| Cellular Data Only | 17 | 4.1% |
| Satellite Internet | 42 | 10.1% |
| No Internet | 90 | 21.7% |
| Total | 415 | 100.0% |
McGill Summary
McGill is a small town located in White Pine County, Nevada. It is situated in the eastern part of the state, near the Utah border. The town was founded in 1869 and is named after John W. McGill, a local rancher. The population of McGill was 1,072 at the 2010 census.
Geography
McGill is located at 39°37'17" North, 114°17'17" West (39.6214, -114.2881). It is situated in the Great Basin Desert, at an elevation of 5,845 feet (1,782 m). The town is located on the western edge of the Ruby Mountains, and is surrounded by the Toiyabe National Forest.
Economy
The economy of McGill is largely based on mining and tourism. The town is home to several gold and silver mines, as well as a copper mine. The nearby Ruby Mountains are popular with hikers, campers, and other outdoor enthusiasts. The town also has a few small businesses, including a grocery store, a gas station, and a few restaurants.
Demographics
As of the 2010 census, the population of McGill was 1,072. The racial makeup of the town was 94.2% White, 0.7% African American, 0.7% Native American, 0.3% Asian, 0.1% Pacific Islander, 2.2% from other races, and 1.9% from two or more races. Hispanic or Latino of any race were 5.2% of the population.
The median income for a household in McGill was $37,500, and the median income for a family was $41,250. Males had a median income of $31,250 versus $20,000 for females. The per capita income for the town was $17,845. About 10.2% of families and 12.2% of the population were below the poverty line, including 16.7% of those under age 18 and 8.3% of those age 65 or over.
Conclusion
McGill is a small town located in White Pine County, Nevada. It is situated in the eastern part of the state, near the Utah border. The town was founded in 1869 and is named after John W. McGill, a local rancher. The economy of McGill is largely based on mining and tourism. The population of McGill was 1,072 at the 2010 census, with a median income for a household of $37,500. The town is home to several gold and silver mines, as well as a copper mine, and is popular with hikers, campers, and other outdoor enthusiasts.
Common Questions
What is Per Capita Income in McGill?
Per Capita income in McGill is $35,273.
What is the Median Family Income in McGill?
Median Family Income in McGill is $117,563.
What is the Median Household income in McGill?
Median Household Income in McGill is $62,837.
What is Income or Wage Gap in McGill?
Income or Wage Gap in McGill is 64.2%.
Women in McGill earn 35.8 cents for every dollar earned by a man.
What is Inequality or Gini Index in McGill?
Inequality or Gini Index in McGill is 0.31.
What is the Total Population of McGill?
Total Population of McGill is 879.
What is the Total Male Population of McGill?
Total Male Population of McGill is 457.
What is the Total Female Population of McGill?
Total Female Population of McGill is 422.
What is the Ratio of Males per 100 Females in McGill?
There are 108.29 Males per 100 Females in McGill.
What is the Ratio of Females per 100 Males in McGill?
There are 92.34 Females per 100 Males in McGill.
What is the Median Population Age in McGill?
Median Population Age in McGill is 53.3 Years.
What is the Average Family Size in McGill
Average Family Size in McGill is 2.8 People.
What is the Average Household Size in McGill
Average Household Size in McGill is 2.1 People.
How Large is the Labor Force in McGill?
There are 375 People in the Labor Forcein in McGill.
What is the Percentage of People in the Labor Force in McGill?
53.6% of People are in the Labor Force in McGill.
What is the Unemployment Rate in McGill?
Unemployment Rate in McGill is 6.9%.