Bowling Green, MO Map & Demographics
Bowling Green Map
Bowling Green Overview
$21,033
PER CAPITA INCOME
$60,431
AVG FAMILY INCOME
$44,338
AVG HOUSEHOLD INCOME
21.1%
WAGE / INCOME GAP [ % ]
78.9¢/ $1
WAGE / INCOME GAP [ $ ]
0.42
INEQUALITY / GINI INDEX
4,149
TOTAL POPULATION
2,439
MALE POPULATION
1,710
FEMALE POPULATION
142.63
MALES / 100 FEMALES
70.11
FEMALES / 100 MALES
36.1
MEDIAN AGE
3.0
AVG FAMILY SIZE
2.3
AVG HOUSEHOLD SIZE
1,464
LABOR FORCE [ PEOPLE ]
43.2%
PERCENT IN LABOR FORCE
8.1%
UNEMPLOYMENT RATE
Bowling Green Zip Codes
Bowling Green Area Codes
Income in Bowling Green
Income Overview in Bowling Green
Per Capita Income in Bowling Green is $21,033, while median incomes of families and households are $60,431 and $44,338 respectively.
| Characteristic | Number | Measure |
| Per Capita Income | 4,149 | $21,033 |
| Median Family Income | 780 | $60,431 |
| Mean Family Income | 780 | $68,502 |
| Median Household Income | 1,399 | $44,338 |
| Mean Household Income | 1,399 | $58,778 |
| Income Deficit | 780 | $0 |
| Wage / Income Gap (%) | 4,149 | 21.06% |
| Wage / Income Gap ($) | 4,149 | 78.94¢ per $1 |
| Gini / Inequality Index | 4,149 | 0.42 |
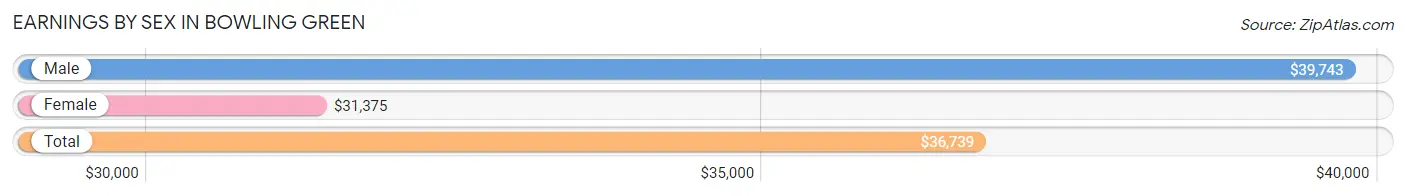
Earnings by Sex in Bowling Green
Average Earnings in Bowling Green are $36,739, $39,743 for men and $31,375 for women, a difference of 21.1%.
| Sex | Number | Average Earnings |
| Male | 868 (54.9%) | $39,743 |
| Female | 713 (45.1%) | $31,375 |
| Total | 1,581 (100.0%) | $36,739 |
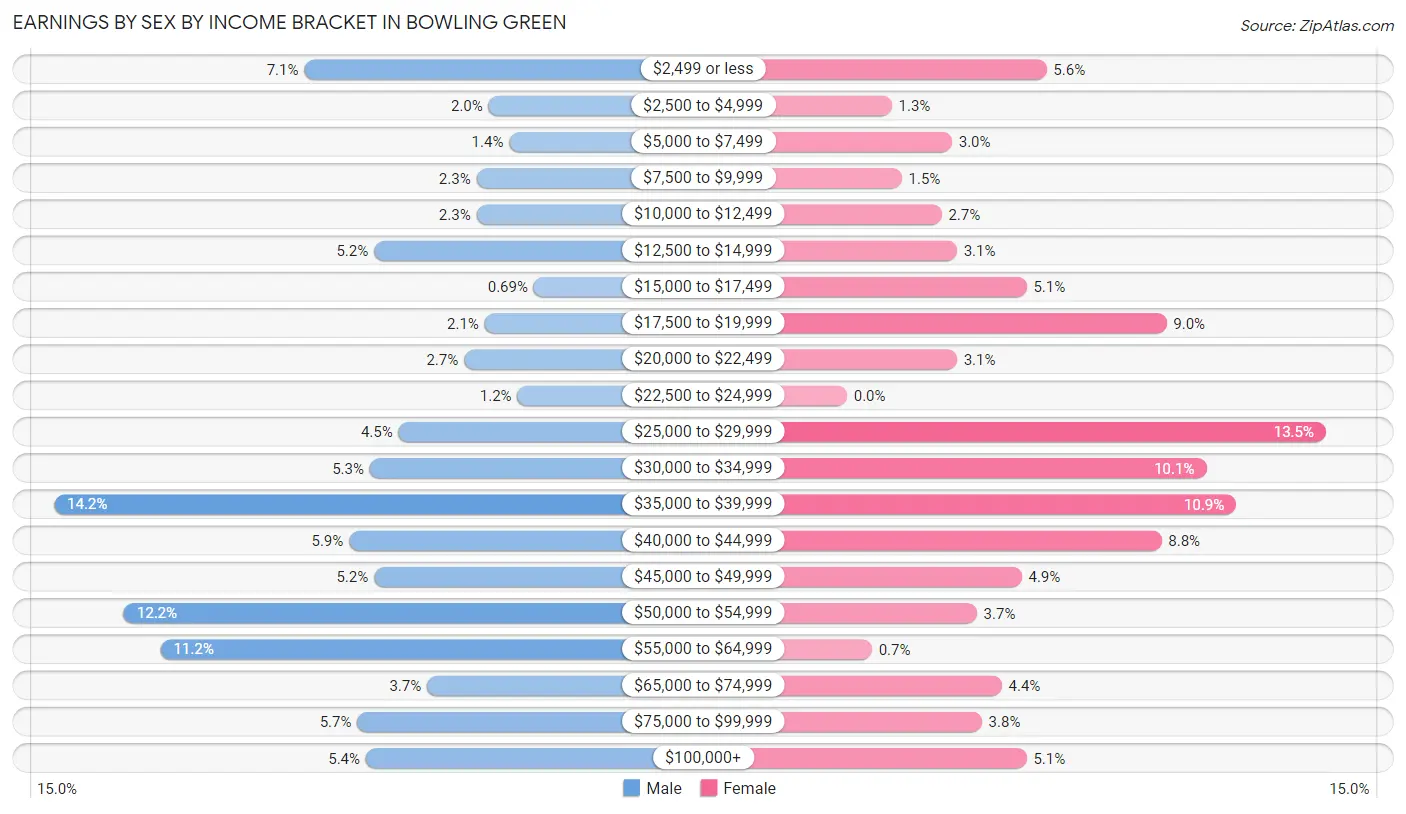
Earnings by Sex by Income Bracket in Bowling Green
The most common earnings brackets in Bowling Green are $35,000 to $39,999 for men (123 | 14.2%) and $25,000 to $29,999 for women (96 | 13.5%).
| Income | Male | Female |
| $2,499 or less | 62 (7.1%) | 40 (5.6%) |
| $2,500 to $4,999 | 17 (2.0%) | 9 (1.3%) |
| $5,000 to $7,499 | 12 (1.4%) | 21 (2.9%) |
| $7,500 to $9,999 | 20 (2.3%) | 11 (1.5%) |
| $10,000 to $12,499 | 20 (2.3%) | 19 (2.7%) |
| $12,500 to $14,999 | 45 (5.2%) | 22 (3.1%) |
| $15,000 to $17,499 | 6 (0.7%) | 36 (5.1%) |
| $17,500 to $19,999 | 18 (2.1%) | 64 (9.0%) |
| $20,000 to $22,499 | 23 (2.6%) | 22 (3.1%) |
| $22,500 to $24,999 | 10 (1.1%) | 0 (0.0%) |
| $25,000 to $29,999 | 39 (4.5%) | 96 (13.5%) |
| $30,000 to $34,999 | 46 (5.3%) | 72 (10.1%) |
| $35,000 to $39,999 | 123 (14.2%) | 78 (10.9%) |
| $40,000 to $44,999 | 51 (5.9%) | 63 (8.8%) |
| $45,000 to $49,999 | 45 (5.2%) | 35 (4.9%) |
| $50,000 to $54,999 | 106 (12.2%) | 26 (3.6%) |
| $55,000 to $64,999 | 97 (11.2%) | 5 (0.7%) |
| $65,000 to $74,999 | 32 (3.7%) | 31 (4.3%) |
| $75,000 to $99,999 | 49 (5.7%) | 27 (3.8%) |
| $100,000+ | 47 (5.4%) | 36 (5.1%) |
| Total | 868 (100.0%) | 713 (100.0%) |
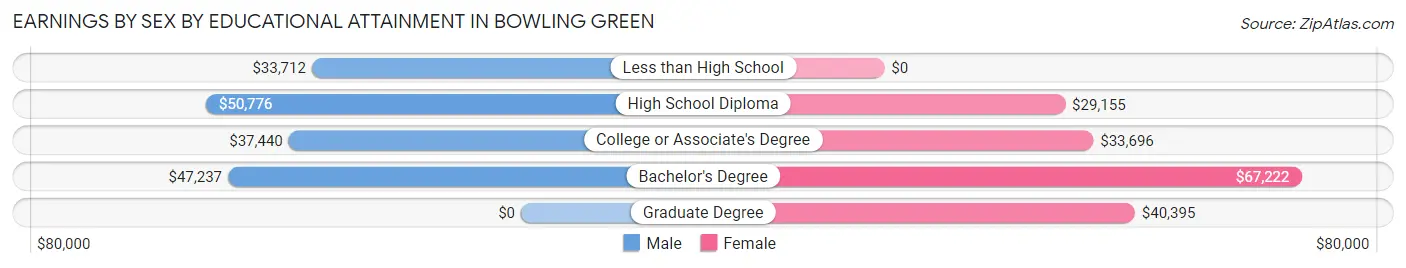
Earnings by Sex by Educational Attainment in Bowling Green
Average earnings in Bowling Green are $44,904 for men and $34,871 for women, a difference of 22.3%. Men with an educational attainment of high school diploma enjoy the highest average annual earnings of $50,776, while those with less than high school education earn the least with $33,712. Women with an educational attainment of bachelor's degree earn the most with the average annual earnings of $67,222, while those with high school diploma education have the smallest earnings of $29,155.
| Educational Attainment | Male Income | Female Income |
| Less than High School | $33,712 | $0 |
| High School Diploma | $50,776 | $29,155 |
| College or Associate's Degree | $37,440 | $33,696 |
| Bachelor's Degree | $47,237 | $67,222 |
| Graduate Degree | - | - |
| Total | $44,904 | $34,871 |
Family Income in Bowling Green
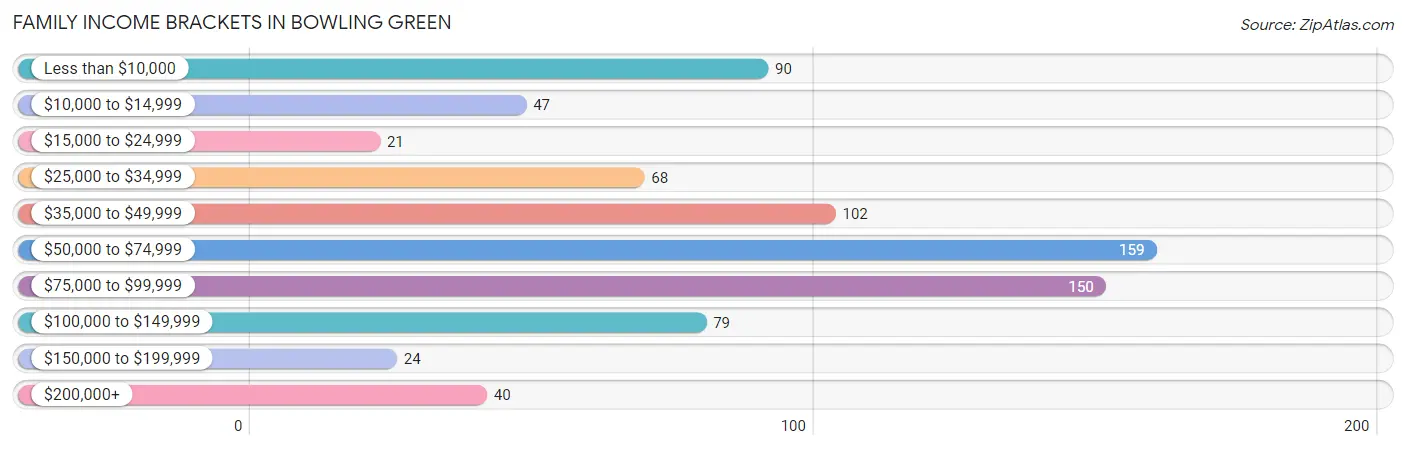
Family Income Brackets in Bowling Green
According to the Bowling Green family income data, there are 159 families falling into the $50,000 to $74,999 income range, which is the most common income bracket and makes up 20.4% of all families. Conversely, the $15,000 to $24,999 income bracket is the least frequent group with only 21 families (2.7%) belonging to this category.
| Income Bracket | # Families | % Families |
| Less than $10,000 | 90 | 11.5% |
| $10,000 to $14,999 | 47 | 6.0% |
| $15,000 to $24,999 | 21 | 2.7% |
| $25,000 to $34,999 | 68 | 8.7% |
| $35,000 to $49,999 | 102 | 13.1% |
| $50,000 to $74,999 | 159 | 20.4% |
| $75,000 to $99,999 | 150 | 19.2% |
| $100,000 to $149,999 | 79 | 10.1% |
| $150,000 to $199,999 | 24 | 3.1% |
| $200,000+ | 40 | 5.1% |
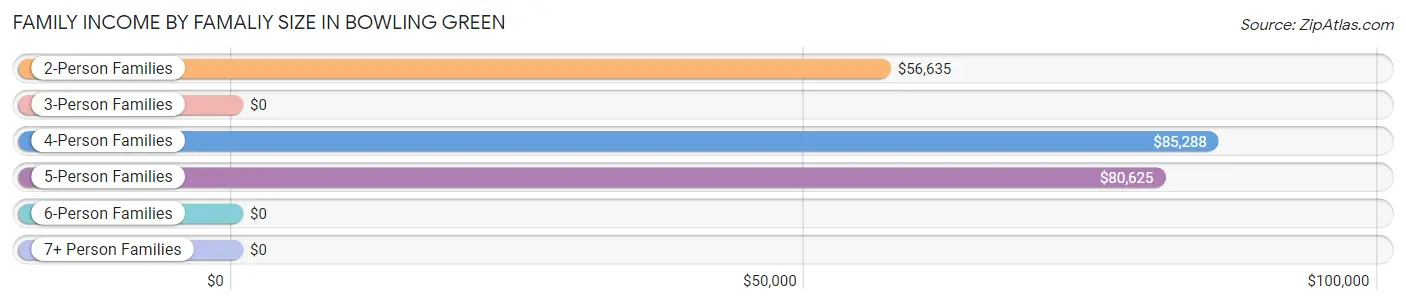
Family Income by Famaliy Size in Bowling Green
4-person families (73 | 9.4%) account for the highest median family income in Bowling Green with $85,288 per family, while 2-person families (383 | 49.1%) have the highest median income of $28,318 per family member.
| Income Bracket | # Families | Median Income |
| 2-Person Families | 383 (49.1%) | $56,635 |
| 3-Person Families | 228 (29.2%) | $0 |
| 4-Person Families | 73 (9.4%) | $85,288 |
| 5-Person Families | 78 (10.0%) | $80,625 |
| 6-Person Families | 9 (1.1%) | $0 |
| 7+ Person Families | 9 (1.1%) | $0 |
| Total | 780 (100.0%) | $60,431 |
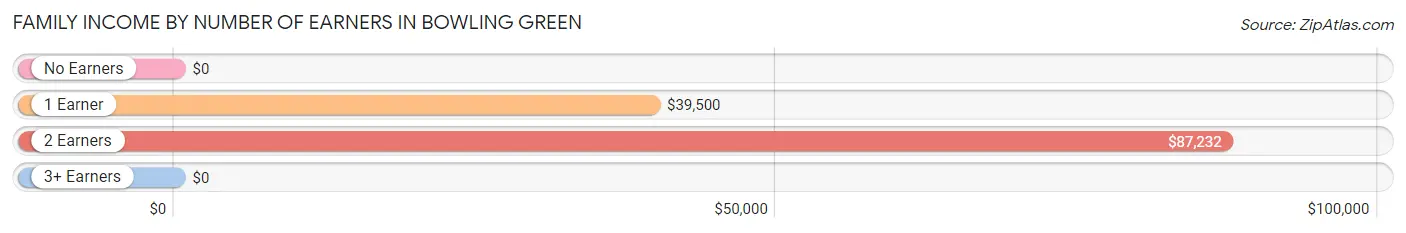
Family Income by Number of Earners in Bowling Green
| Number of Earners | # Families | Median Income |
| No Earners | 208 (26.7%) | $0 |
| 1 Earner | 202 (25.9%) | $39,500 |
| 2 Earners | 318 (40.8%) | $87,232 |
| 3+ Earners | 52 (6.7%) | $0 |
| Total | 780 (100.0%) | $60,431 |
Household Income in Bowling Green
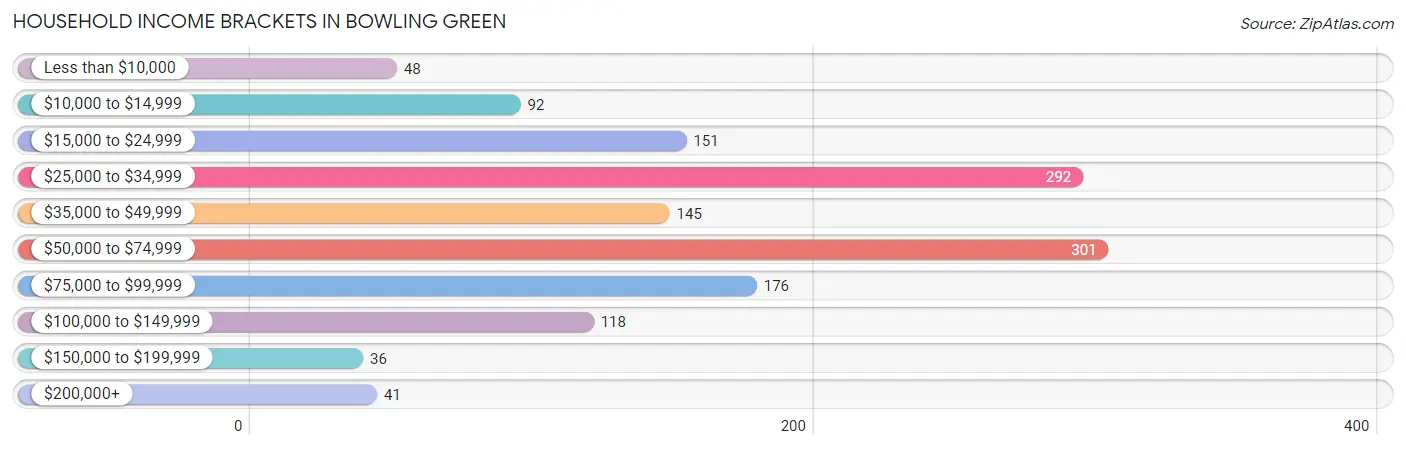
Household Income Brackets in Bowling Green
With 301 households falling in the category, the $50,000 to $74,999 income range is the most frequent in Bowling Green, accounting for 21.5% of all households. In contrast, only 36 households (2.6%) fall into the $150,000 to $199,999 income bracket, making it the least populous group.
| Income Bracket | # Households | % Households |
| Less than $10,000 | 48 | 3.4% |
| $10,000 to $14,999 | 92 | 6.6% |
| $15,000 to $24,999 | 151 | 10.8% |
| $25,000 to $34,999 | 292 | 20.9% |
| $35,000 to $49,999 | 145 | 10.4% |
| $50,000 to $74,999 | 301 | 21.5% |
| $75,000 to $99,999 | 176 | 12.6% |
| $100,000 to $149,999 | 118 | 8.4% |
| $150,000 to $199,999 | 36 | 2.6% |
| $200,000+ | 41 | 2.9% |
Household Income by Householder Age in Bowling Green
The median household income in Bowling Green is $44,338, with the highest median household income of $65,795 found in the 25 to 44 years age bracket for the primary householder. A total of 341 households (24.4%) fall into this category. Meanwhile, the 15 to 24 years age bracket for the primary householder has the lowest median household income of $0, with 242 households (17.3%) in this group.
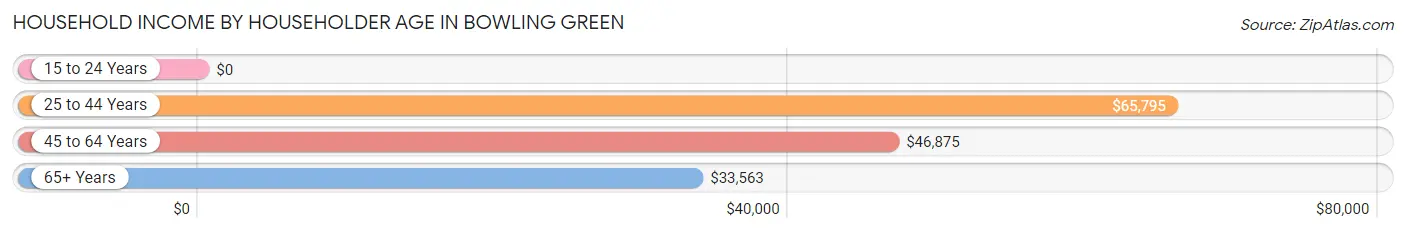
| Income Bracket | # Households | Median Income |
| 15 to 24 Years | 242 (17.3%) | $0 |
| 25 to 44 Years | 341 (24.4%) | $65,795 |
| 45 to 64 Years | 455 (32.5%) | $46,875 |
| 65+ Years | 361 (25.8%) | $33,563 |
| Total | 1,399 (100.0%) | $44,338 |
Poverty in Bowling Green
Income Below Poverty by Sex and Age in Bowling Green
With 20.2% poverty level for males and 19.5% for females among the residents of Bowling Green, 12 to 14 year old males and 5 year old females are the most vulnerable to poverty, with 60 males (78.9%) and 72 females (74.2%) in their respective age groups living below the poverty level.
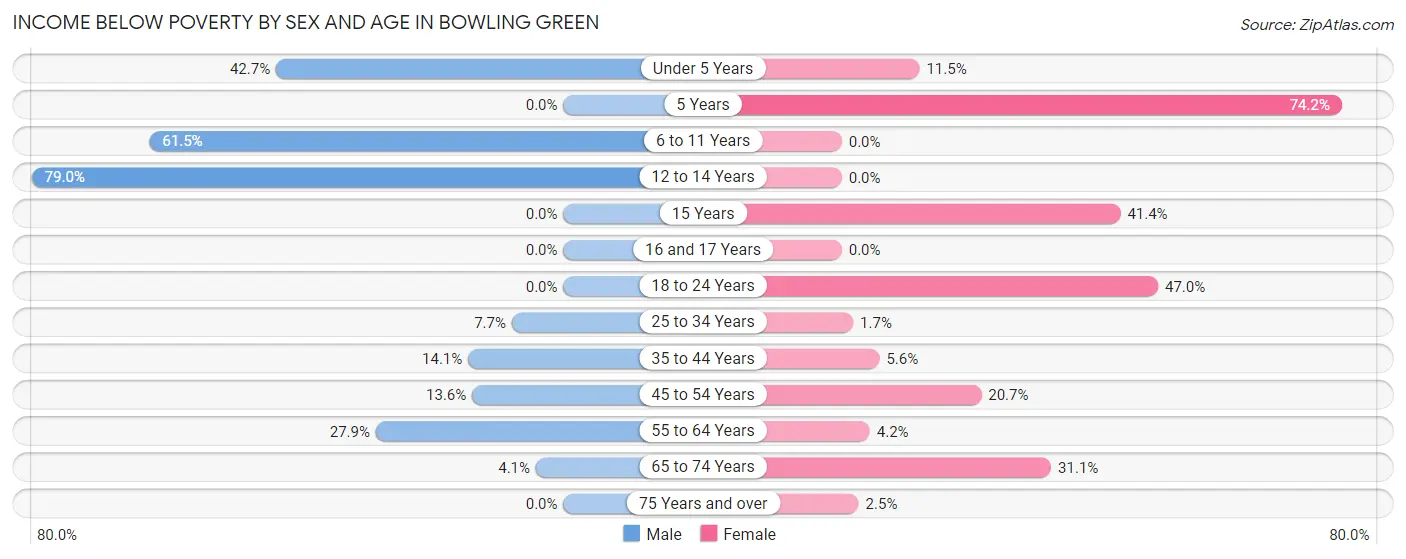
| Age Bracket | Male | Female |
| Under 5 Years | 64 (42.7%) | 9 (11.5%) |
| 5 Years | 0 (0.0%) | 72 (74.2%) |
| 6 to 11 Years | 59 (61.5%) | 0 (0.0%) |
| 12 to 14 Years | 60 (78.9%) | 0 (0.0%) |
| 15 Years | 0 (0.0%) | 12 (41.4%) |
| 16 and 17 Years | 0 (0.0%) | 0 (0.0%) |
| 18 to 24 Years | 0 (0.0%) | 108 (47.0%) |
| 25 to 34 Years | 30 (7.6%) | 3 (1.7%) |
| 35 to 44 Years | 14 (14.1%) | 9 (5.6%) |
| 45 to 54 Years | 21 (13.6%) | 35 (20.7%) |
| 55 to 64 Years | 66 (27.9%) | 5 (4.2%) |
| 65 to 74 Years | 6 (4.1%) | 60 (31.1%) |
| 75 Years and over | 0 (0.0%) | 4 (2.5%) |
| Total | 320 (20.2%) | 317 (19.5%) |
Income Above Poverty by Sex and Age in Bowling Green
According to the poverty statistics in Bowling Green, males aged 5 years and females aged 6 to 11 years are the age groups that are most secure financially, with 100.0% of males and 100.0% of females in these age groups living above the poverty line.
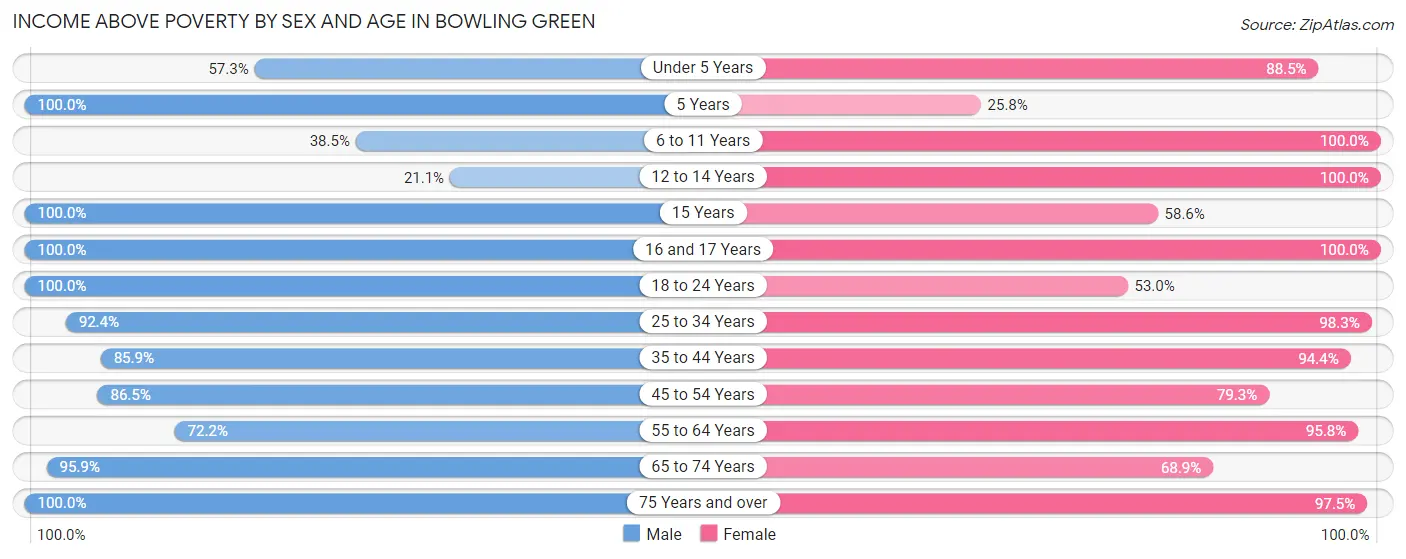
| Age Bracket | Male | Female |
| Under 5 Years | 86 (57.3%) | 69 (88.5%) |
| 5 Years | 25 (100.0%) | 25 (25.8%) |
| 6 to 11 Years | 37 (38.5%) | 174 (100.0%) |
| 12 to 14 Years | 16 (21.0%) | 15 (100.0%) |
| 15 Years | 11 (100.0%) | 17 (58.6%) |
| 16 and 17 Years | 31 (100.0%) | 20 (100.0%) |
| 18 to 24 Years | 131 (100.0%) | 122 (53.0%) |
| 25 to 34 Years | 362 (92.3%) | 175 (98.3%) |
| 35 to 44 Years | 85 (85.9%) | 152 (94.4%) |
| 45 to 54 Years | 134 (86.5%) | 134 (79.3%) |
| 55 to 64 Years | 171 (72.2%) | 115 (95.8%) |
| 65 to 74 Years | 141 (95.9%) | 133 (68.9%) |
| 75 Years and over | 36 (100.0%) | 156 (97.5%) |
| Total | 1,266 (79.8%) | 1,307 (80.5%) |
Income Below Poverty Among Married-Couple Families in Bowling Green
The poverty statistics for married-couple families in Bowling Green show that 4.0% or 19 of the total 478 families live below the poverty line. Families with 3 or 4 children have the highest poverty rate of 14.1%, comprising of 9 families. On the other hand, families with 1 or 2 children have the lowest poverty rate of 0.0%, which includes 0 families.
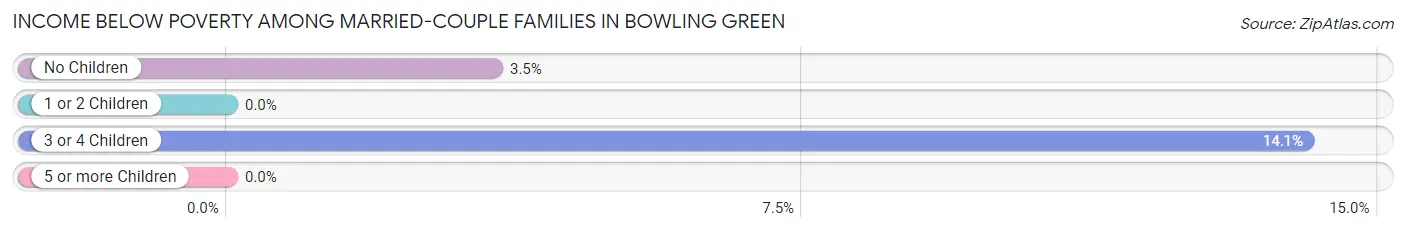
| Children | Above Poverty | Below Poverty |
| No Children | 279 (96.5%) | 10 (3.5%) |
| 1 or 2 Children | 125 (100.0%) | 0 (0.0%) |
| 3 or 4 Children | 55 (85.9%) | 9 (14.1%) |
| 5 or more Children | 0 (0.0%) | 0 (0.0%) |
| Total | 459 (96.0%) | 19 (4.0%) |
Income Below Poverty Among Single-Parent Households in Bowling Green
According to the poverty data in Bowling Green, 37.6% or 38 single-father households and 48.3% or 97 single-mother households are living below the poverty line. Among single-father households, those with 1 or 2 children have the highest poverty rate, with 38 households (55.1%) experiencing poverty. Likewise, among single-mother households, those with 1 or 2 children have the highest poverty rate, with 97 households (54.2%) falling below the poverty line.
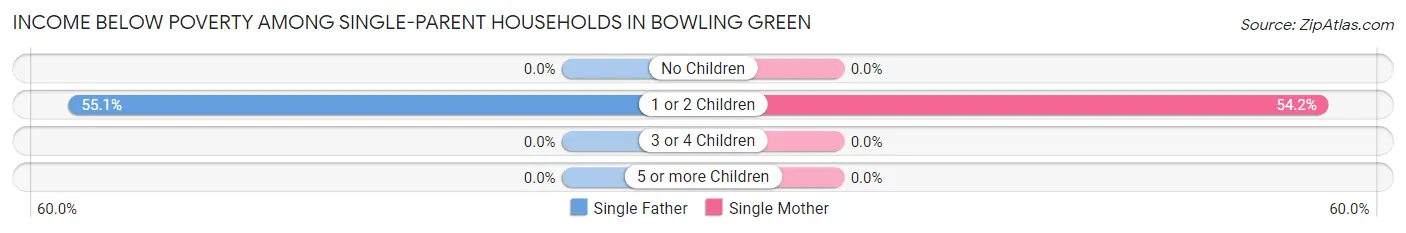
| Children | Single Father | Single Mother |
| No Children | 0 (0.0%) | 0 (0.0%) |
| 1 or 2 Children | 38 (55.1%) | 97 (54.2%) |
| 3 or 4 Children | 0 (0.0%) | 0 (0.0%) |
| 5 or more Children | 0 (0.0%) | 0 (0.0%) |
| Total | 38 (37.6%) | 97 (48.3%) |
Income Below Poverty Among Married-Couple vs Single-Parent Households in Bowling Green
The poverty data for Bowling Green shows that 19 of the married-couple family households (4.0%) and 135 of the single-parent households (44.7%) are living below the poverty level. Within the married-couple family households, those with 3 or 4 children have the highest poverty rate, with 9 households (14.1%) falling below the poverty line. Among the single-parent households, those with 1 or 2 children have the highest poverty rate, with 135 household (54.4%) living below poverty.
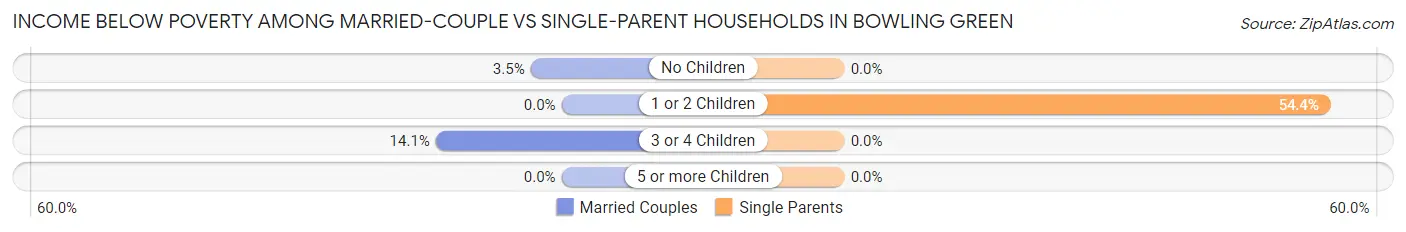
| Children | Married-Couple Families | Single-Parent Households |
| No Children | 10 (3.5%) | 0 (0.0%) |
| 1 or 2 Children | 0 (0.0%) | 135 (54.4%) |
| 3 or 4 Children | 9 (14.1%) | 0 (0.0%) |
| 5 or more Children | 0 (0.0%) | 0 (0.0%) |
| Total | 19 (4.0%) | 135 (44.7%) |
Race in Bowling Green
The most populous races in Bowling Green are White / Caucasian (3,382 | 81.5%), Black / African American (494 | 11.9%), and Two or more Races (146 | 3.5%).
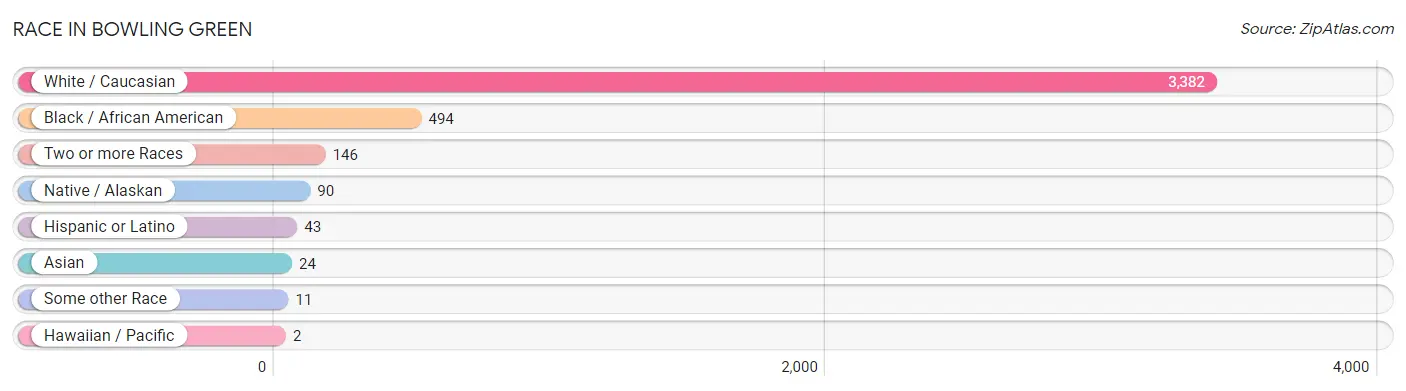
| Race | # Population | % Population |
| Asian | 24 | 0.6% |
| Black / African American | 494 | 11.9% |
| Hawaiian / Pacific | 2 | 0.1% |
| Hispanic or Latino | 43 | 1.0% |
| Native / Alaskan | 90 | 2.2% |
| White / Caucasian | 3,382 | 81.5% |
| Two or more Races | 146 | 3.5% |
| Some other Race | 11 | 0.3% |
| Total | 4,149 | 100.0% |
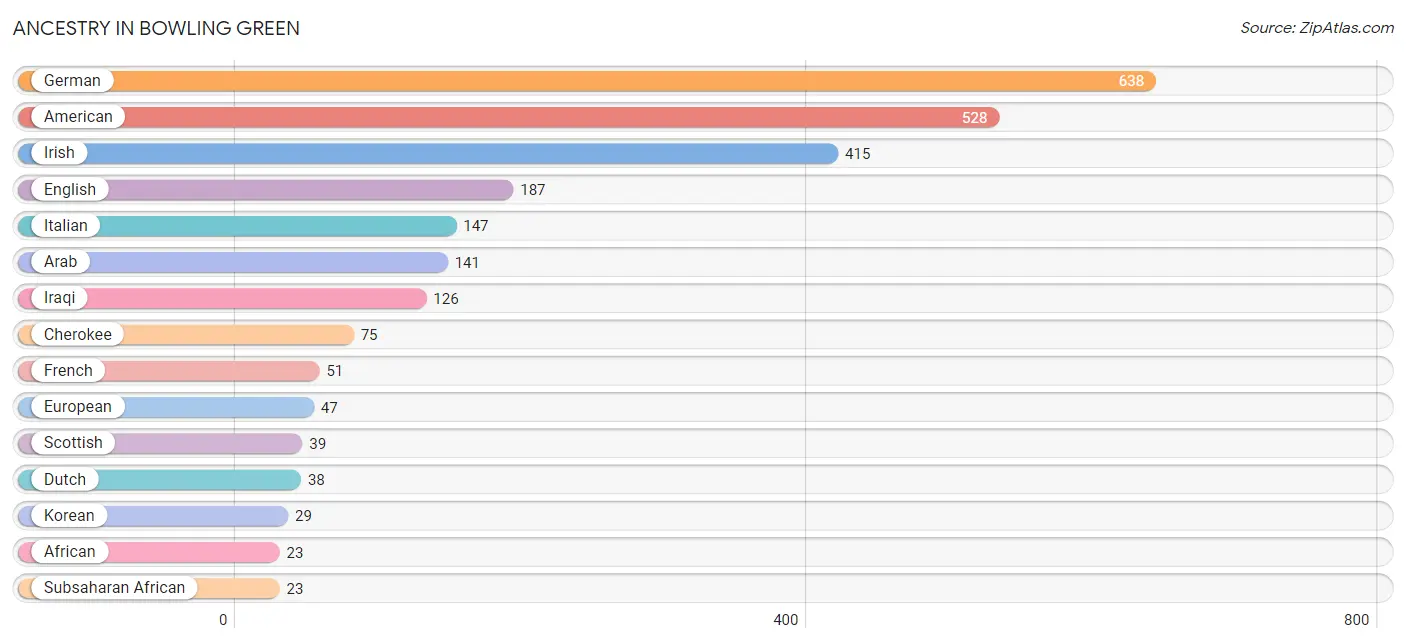
Ancestry in Bowling Green
The most populous ancestries reported in Bowling Green are German (638 | 15.4%), American (528 | 12.7%), Irish (415 | 10.0%), English (187 | 4.5%), and Italian (147 | 3.5%), together accounting for 46.2% of all Bowling Green residents.
| Ancestry | # Population | % Population |
| African | 23 | 0.5% |
| American | 528 | 12.7% |
| Apache | 1 | 0.0% |
| Arab | 141 | 3.4% |
| Blackfeet | 12 | 0.3% |
| Canadian | 2 | 0.1% |
| Cherokee | 75 | 1.8% |
| Dutch | 38 | 0.9% |
| English | 187 | 4.5% |
| European | 47 | 1.1% |
| French | 51 | 1.2% |
| French Canadian | 2 | 0.1% |
| German | 638 | 15.4% |
| Haitian | 2 | 0.1% |
| Iraqi | 126 | 3.0% |
| Irish | 415 | 10.0% |
| Italian | 147 | 3.5% |
| Jamaican | 2 | 0.1% |
| Korean | 29 | 0.7% |
| Mexican | 21 | 0.5% |
| Native Hawaiian | 2 | 0.1% |
| Norwegian | 8 | 0.2% |
| Pakistani | 2 | 0.1% |
| Polish | 18 | 0.4% |
| Portuguese | 17 | 0.4% |
| Puerto Rican | 11 | 0.3% |
| Scandinavian | 12 | 0.3% |
| Scotch-Irish | 16 | 0.4% |
| Scottish | 39 | 0.9% |
| Subsaharan African | 23 | 0.5% |
| Swedish | 8 | 0.2% |
| Syrian | 15 | 0.4% | View All 32 Rows |
Immigrants in Bowling Green
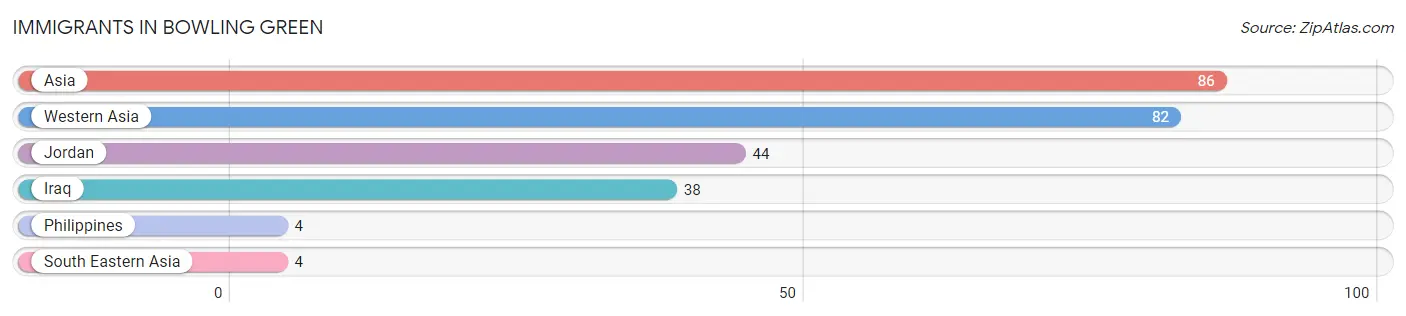
The most numerous immigrant groups reported in Bowling Green came from Asia (86 | 2.1%), Western Asia (82 | 2.0%), Jordan (44 | 1.1%), Iraq (38 | 0.9%), and Philippines (4 | 0.1%), together accounting for 6.1% of all Bowling Green residents.
| Immigration Origin | # Population | % Population |
| Asia | 86 | 2.1% |
| Iraq | 38 | 0.9% |
| Jordan | 44 | 1.1% |
| Philippines | 4 | 0.1% |
| South Eastern Asia | 4 | 0.1% |
| Western Asia | 82 | 2.0% | View All 6 Rows |
Sex and Age in Bowling Green
Sex and Age in Bowling Green
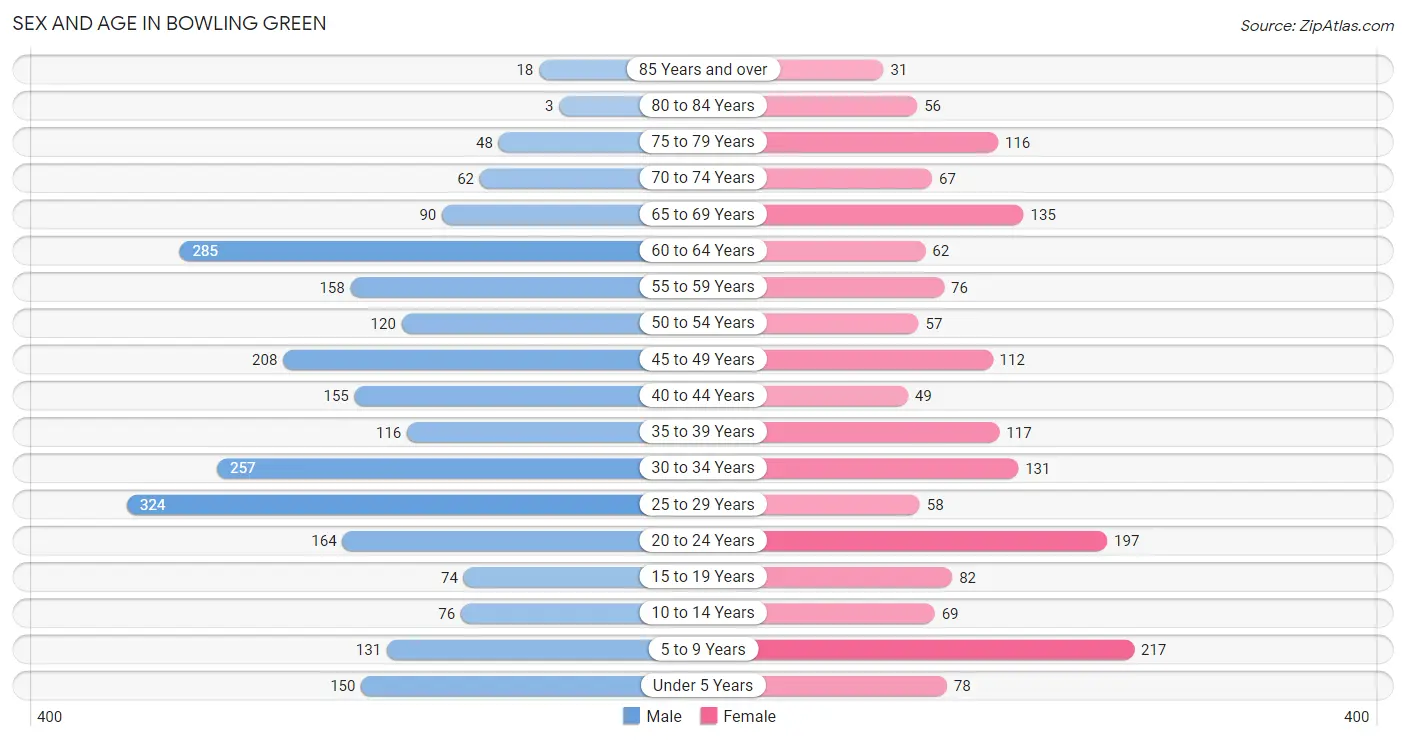
The most populous age groups in Bowling Green are 25 to 29 Years (324 | 13.3%) for men and 5 to 9 Years (217 | 12.7%) for women.
| Age Bracket | Male | Female |
| Under 5 Years | 150 (6.1%) | 78 (4.6%) |
| 5 to 9 Years | 131 (5.4%) | 217 (12.7%) |
| 10 to 14 Years | 76 (3.1%) | 69 (4.0%) |
| 15 to 19 Years | 74 (3.0%) | 82 (4.8%) |
| 20 to 24 Years | 164 (6.7%) | 197 (11.5%) |
| 25 to 29 Years | 324 (13.3%) | 58 (3.4%) |
| 30 to 34 Years | 257 (10.5%) | 131 (7.7%) |
| 35 to 39 Years | 116 (4.8%) | 117 (6.8%) |
| 40 to 44 Years | 155 (6.4%) | 49 (2.9%) |
| 45 to 49 Years | 208 (8.5%) | 112 (6.6%) |
| 50 to 54 Years | 120 (4.9%) | 57 (3.3%) |
| 55 to 59 Years | 158 (6.5%) | 76 (4.4%) |
| 60 to 64 Years | 285 (11.7%) | 62 (3.6%) |
| 65 to 69 Years | 90 (3.7%) | 135 (7.9%) |
| 70 to 74 Years | 62 (2.5%) | 67 (3.9%) |
| 75 to 79 Years | 48 (2.0%) | 116 (6.8%) |
| 80 to 84 Years | 3 (0.1%) | 56 (3.3%) |
| 85 Years and over | 18 (0.7%) | 31 (1.8%) |
| Total | 2,439 (100.0%) | 1,710 (100.0%) |
Families and Households in Bowling Green
Median Family Size in Bowling Green
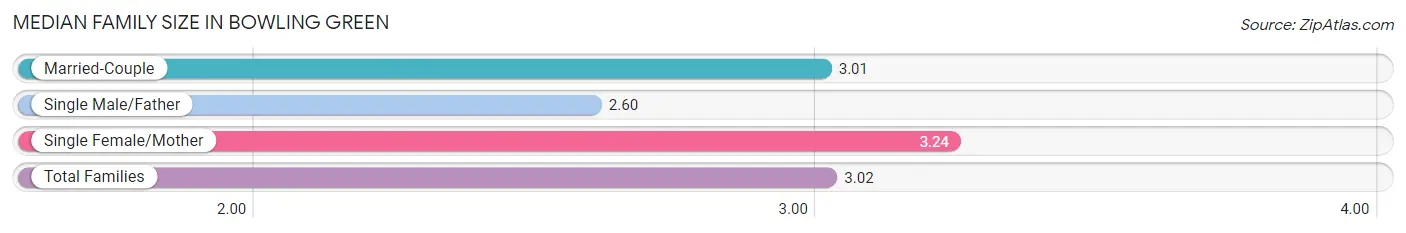
The median family size in Bowling Green is 3.02 persons per family, with single female/mother families (201 | 25.8%) accounting for the largest median family size of 3.24 persons per family. On the other hand, single male/father families (101 | 13.0%) represent the smallest median family size with 2.60 persons per family.
| Family Type | # Families | Family Size |
| Married-Couple | 478 (61.3%) | 3.01 |
| Single Male/Father | 101 (13.0%) | 2.60 |
| Single Female/Mother | 201 (25.8%) | 3.24 |
| Total Families | 780 (100.0%) | 3.02 |
Median Household Size in Bowling Green
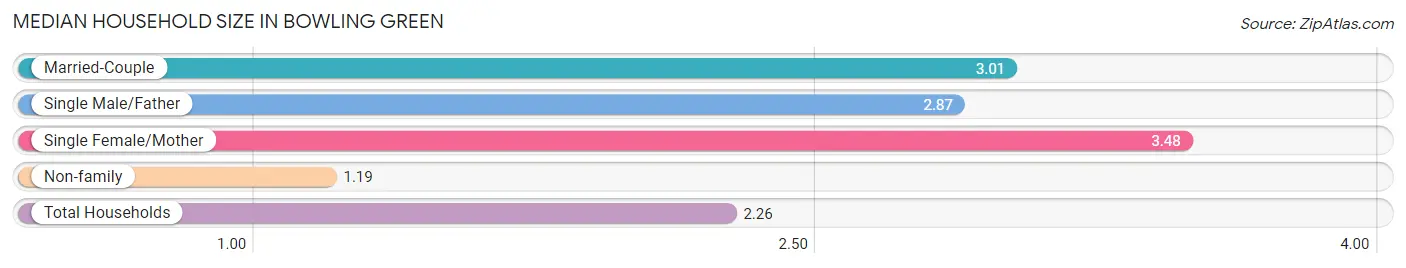
The median household size in Bowling Green is 2.26 persons per household, with single female/mother households (201 | 14.4%) accounting for the largest median household size of 3.48 persons per household. non-family households (619 | 44.3%) represent the smallest median household size with 1.19 persons per household.
| Household Type | # Households | Household Size |
| Married-Couple | 478 (34.2%) | 3.01 |
| Single Male/Father | 101 (7.2%) | 2.87 |
| Single Female/Mother | 201 (14.4%) | 3.48 |
| Non-family | 619 (44.3%) | 1.19 |
| Total Households | 1,399 (100.0%) | 2.26 |
Household Size by Marriage Status in Bowling Green
Out of a total of 1,399 households in Bowling Green, 780 (55.7%) are family households, while 619 (44.3%) are nonfamily households. The most numerous type of family households are 2-person households, comprising 364, and the most common type of nonfamily households are 1-person households, comprising 535.
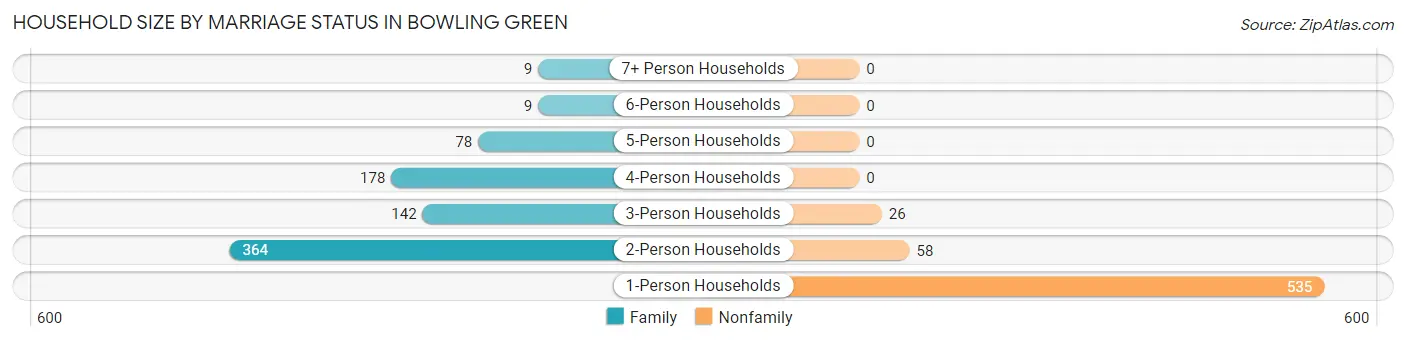
| Household Size | Family Households | Nonfamily Households |
| 1-Person Households | - | 535 (38.2%) |
| 2-Person Households | 364 (26.0%) | 58 (4.2%) |
| 3-Person Households | 142 (10.2%) | 26 (1.9%) |
| 4-Person Households | 178 (12.7%) | 0 (0.0%) |
| 5-Person Households | 78 (5.6%) | 0 (0.0%) |
| 6-Person Households | 9 (0.6%) | 0 (0.0%) |
| 7+ Person Households | 9 (0.6%) | 0 (0.0%) |
| Total | 780 (55.7%) | 619 (44.3%) |
Female Fertility in Bowling Green
Fertility by Age in Bowling Green
| Age Bracket | Women with Births | Births / 1,000 Women |
| 15 to 19 years | 0 (0.0%) | 0.0 |
| 20 to 34 years | 0 (0.0%) | 0.0 |
| 35 to 50 years | 0 (0.0%) | 0.0 |
| Total | 0 (0.0%) | 0.0 |
Fertility by Age by Marriage Status in Bowling Green
| Age Bracket | Married | Unmarried |
| 15 to 19 years | 0 (0.0%) | 0 (0.0%) |
| 20 to 34 years | 0 (0.0%) | 0 (0.0%) |
| 35 to 50 years | 0 (0.0%) | 0 (0.0%) |
| Total | 0 (0.0%) | 0 (0.0%) |
Fertility by Education in Bowling Green
| Educational Attainment | Women with Births | Births / 1,000 Women |
| Less than High School | 0 (0.0%) | 0.0 |
| High School Diploma | 0 (0.0%) | 0.0 |
| College or Associate's Degree | 0 (0.0%) | 0.0 |
| Bachelor's Degree | 0 (0.0%) | 0.0 |
| Graduate Degree | 0 (0.0%) | 0.0 |
| Total | 0 (0.0%) | 0.0 |
Fertility by Education by Marriage Status in Bowling Green
| Educational Attainment | Married | Unmarried |
| Less than High School | 0 (0.0%) | 0 (0.0%) |
| High School Diploma | 0 (0.0%) | 0 (0.0%) |
| College or Associate's Degree | 0 (0.0%) | 0 (0.0%) |
| Bachelor's Degree | 0 (0.0%) | 0 (0.0%) |
| Graduate Degree | 0 (0.0%) | 0 (0.0%) |
| Total | 0 (0.0%) | 0 (0.0%) |
Employment Characteristics in Bowling Green
Employment by Class of Employer in Bowling Green
Among the 1,343 employed individuals in Bowling Green, private company employees (907 | 67.5%), state government employees (188 | 14.0%), and local government employees (157 | 11.7%) make up the most common classes of employment.
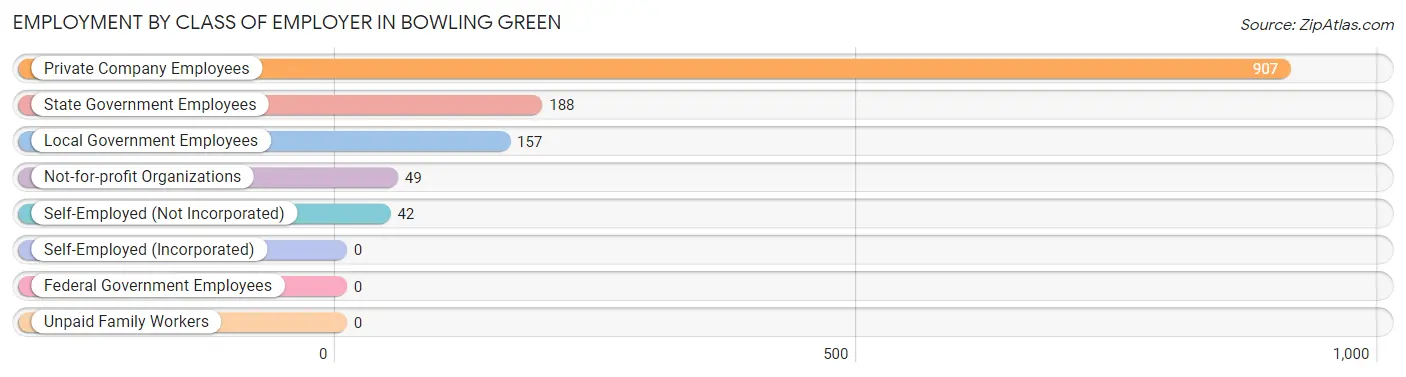
| Employer Class | # Employees | % Employees |
| Private Company Employees | 907 | 67.5% |
| Self-Employed (Incorporated) | 0 | 0.0% |
| Self-Employed (Not Incorporated) | 42 | 3.1% |
| Not-for-profit Organizations | 49 | 3.6% |
| Local Government Employees | 157 | 11.7% |
| State Government Employees | 188 | 14.0% |
| Federal Government Employees | 0 | 0.0% |
| Unpaid Family Workers | 0 | 0.0% |
| Total | 1,343 | 100.0% |
Employment Status by Age in Bowling Green
According to the labor force statistics for Bowling Green, out of the total population over 16 years of age (3,388), 43.2% or 1,464 individuals are in the labor force, with 8.1% or 119 of them unemployed. The age group with the highest labor force participation rate is 30 to 34 years, with 76.0% or 295 individuals in the labor force. Within the labor force, the 16 to 19 years age range has the highest percentage of unemployed individuals, with 47.0% or 39 of them being unemployed.
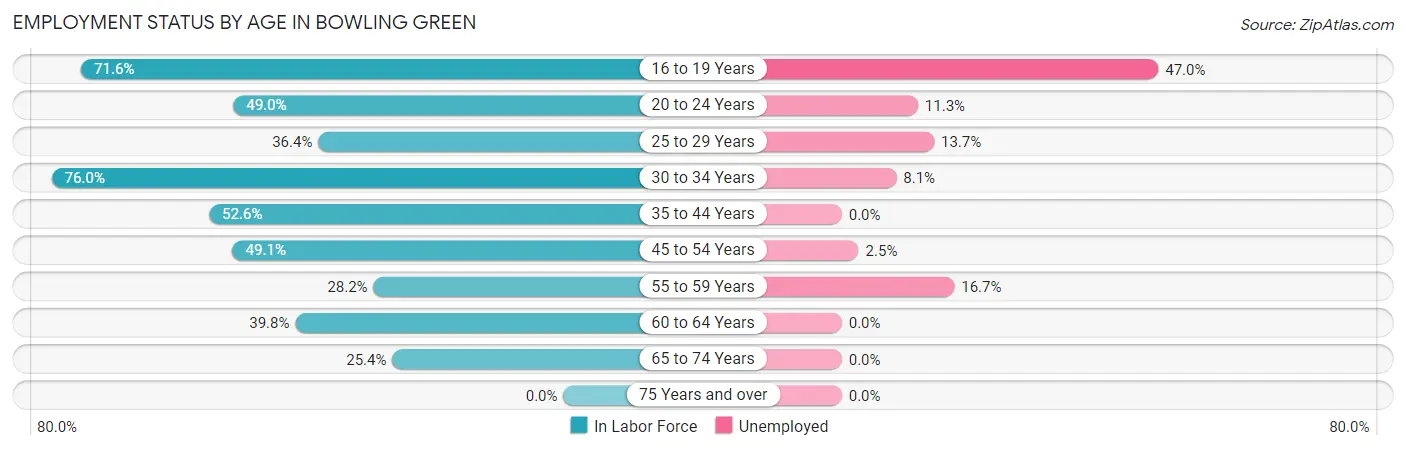
| Age Bracket | In Labor Force | Unemployed |
| 16 to 19 Years | 83 (71.6%) | 39 (47.0%) |
| 20 to 24 Years | 177 (49.0%) | 20 (11.3%) |
| 25 to 29 Years | 139 (36.4%) | 19 (13.7%) |
| 30 to 34 Years | 295 (76.0%) | 24 (8.1%) |
| 35 to 44 Years | 230 (52.6%) | 0 (0.0%) |
| 45 to 54 Years | 244 (49.1%) | 6 (2.5%) |
| 55 to 59 Years | 66 (28.2%) | 11 (16.7%) |
| 60 to 64 Years | 138 (39.8%) | 0 (0.0%) |
| 65 to 74 Years | 90 (25.4%) | 0 (0.0%) |
| 75 Years and over | 0 (0.0%) | 0 (0.0%) |
| Total | 1,464 (43.2%) | 119 (8.1%) |
Employment Status by Educational Attainment in Bowling Green
According to labor force statistics for Bowling Green, 48.7% of individuals (1,113) out of the total population between 25 and 64 years of age (2,285) are in the labor force, with 5.4% or 60 of them being unemployed. The group with the highest labor force participation rate are those with the educational attainment of bachelor's degree or higher, with 61.2% or 194 individuals in the labor force. Within the labor force, individuals with college / associate degree education have the highest percentage of unemployment, with 7.1% or 17 of them being unemployed.
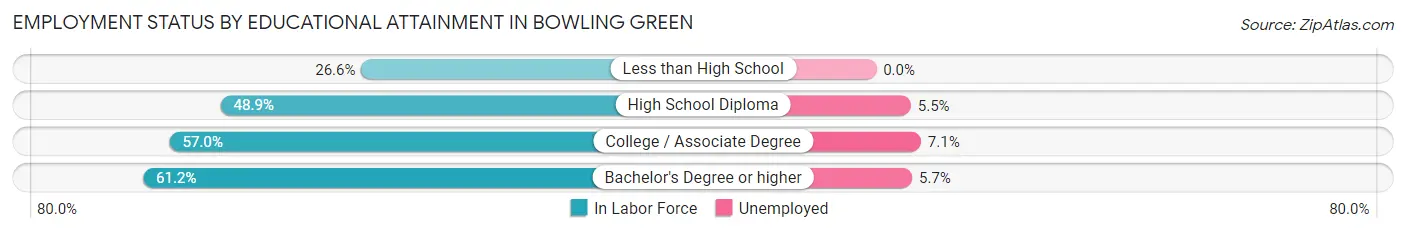
| Educational Attainment | In Labor Force | Unemployed |
| Less than High School | 93 (26.6%) | 0 (0.0%) |
| High School Diploma | 586 (48.9%) | 66 (5.5%) |
| College / Associate Degree | 239 (57.0%) | 30 (7.1%) |
| Bachelor's Degree or higher | 194 (61.2%) | 18 (5.7%) |
| Total | 1,113 (48.7%) | 123 (5.4%) |
Employment Occupations by Sex in Bowling Green
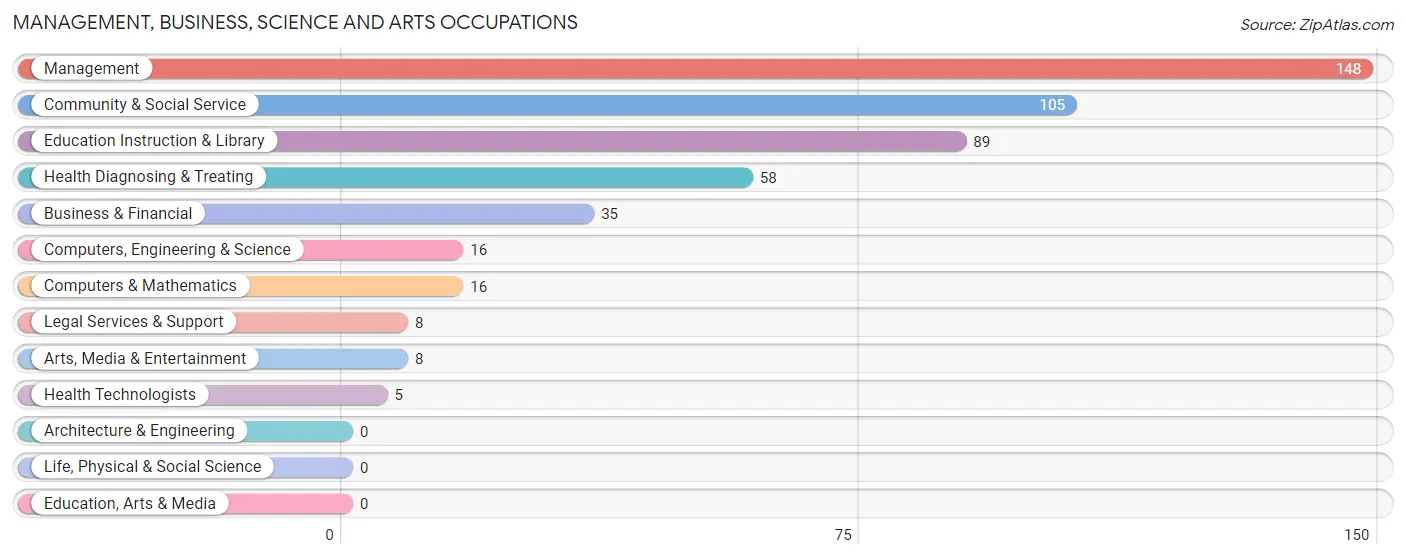
Management, Business, Science and Arts Occupations
The most common Management, Business, Science and Arts occupations in Bowling Green are Management (148 | 11.0%), Community & Social Service (105 | 7.8%), Education Instruction & Library (89 | 6.6%), Health Diagnosing & Treating (58 | 4.3%), and Business & Financial (35 | 2.6%).
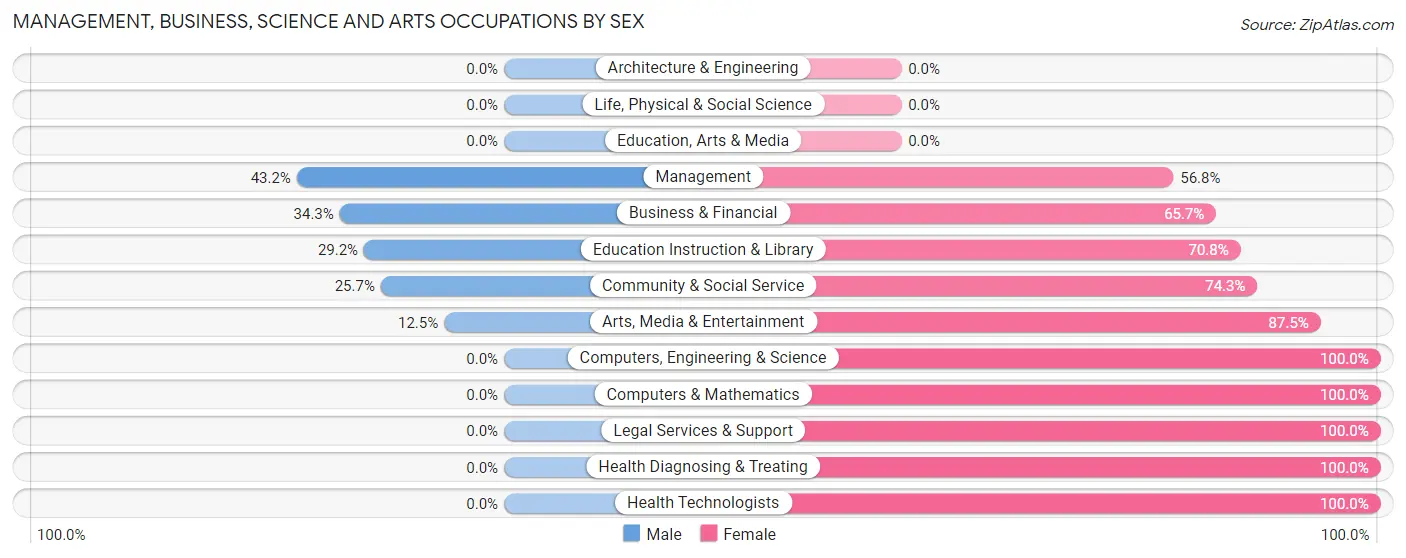
Management, Business, Science and Arts Occupations by Sex
Within the Management, Business, Science and Arts occupations in Bowling Green, the most male-oriented occupations are Management (43.2%), Business & Financial (34.3%), and Education Instruction & Library (29.2%), while the most female-oriented occupations are Computers, Engineering & Science (100.0%), Computers & Mathematics (100.0%), and Legal Services & Support (100.0%).
| Occupation | Male | Female |
| Management | 64 (43.2%) | 84 (56.8%) |
| Business & Financial | 12 (34.3%) | 23 (65.7%) |
| Computers, Engineering & Science | 0 (0.0%) | 16 (100.0%) |
| Computers & Mathematics | 0 (0.0%) | 16 (100.0%) |
| Architecture & Engineering | 0 (0.0%) | 0 (0.0%) |
| Life, Physical & Social Science | 0 (0.0%) | 0 (0.0%) |
| Community & Social Service | 27 (25.7%) | 78 (74.3%) |
| Education, Arts & Media | 0 (0.0%) | 0 (0.0%) |
| Legal Services & Support | 0 (0.0%) | 8 (100.0%) |
| Education Instruction & Library | 26 (29.2%) | 63 (70.8%) |
| Arts, Media & Entertainment | 1 (12.5%) | 7 (87.5%) |
| Health Diagnosing & Treating | 0 (0.0%) | 58 (100.0%) |
| Health Technologists | 0 (0.0%) | 5 (100.0%) |
| Total (Category) | 103 (28.4%) | 259 (71.6%) |
| Total (Overall) | 702 (52.3%) | 641 (47.7%) |
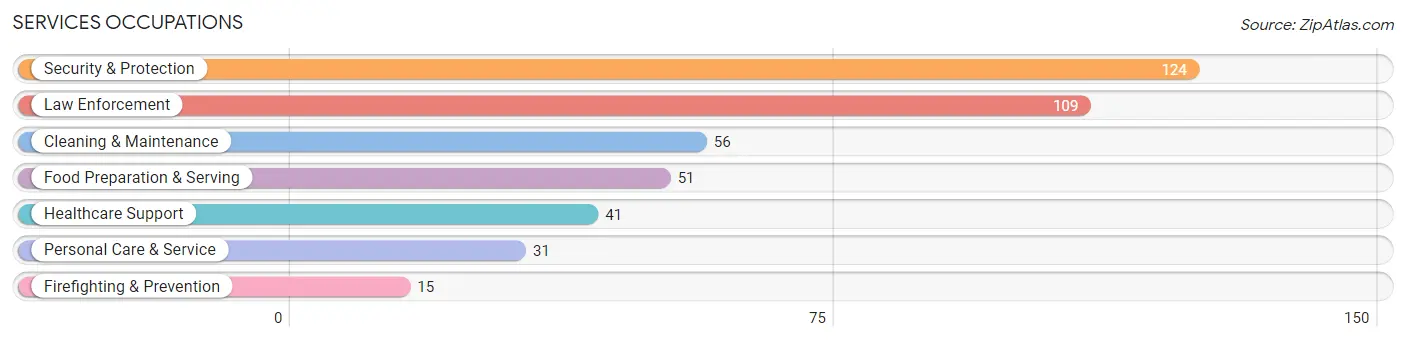
Services Occupations
The most common Services occupations in Bowling Green are Security & Protection (124 | 9.2%), Law Enforcement (109 | 8.1%), Cleaning & Maintenance (56 | 4.2%), Food Preparation & Serving (51 | 3.8%), and Healthcare Support (41 | 3.0%).
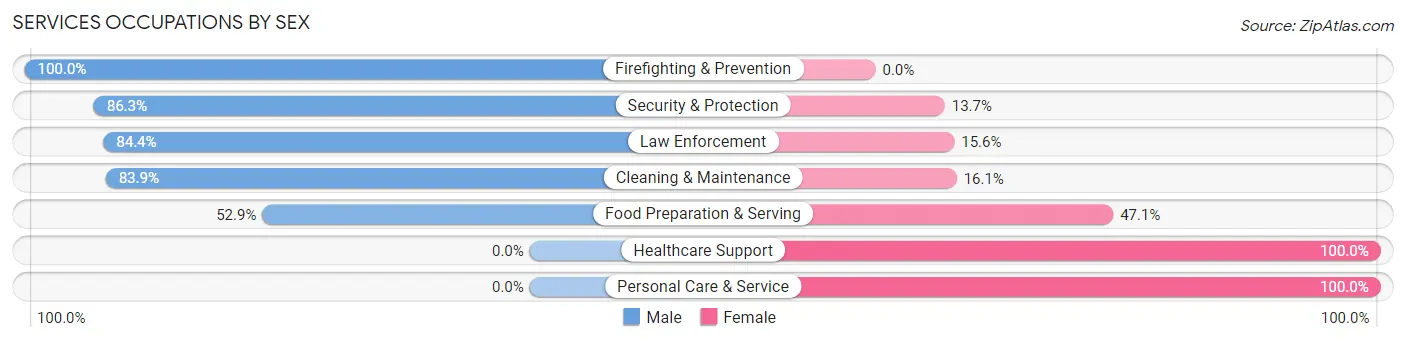
Services Occupations by Sex
Within the Services occupations in Bowling Green, the most male-oriented occupations are Firefighting & Prevention (100.0%), Security & Protection (86.3%), and Law Enforcement (84.4%), while the most female-oriented occupations are Healthcare Support (100.0%), Personal Care & Service (100.0%), and Food Preparation & Serving (47.1%).
| Occupation | Male | Female |
| Healthcare Support | 0 (0.0%) | 41 (100.0%) |
| Security & Protection | 107 (86.3%) | 17 (13.7%) |
| Firefighting & Prevention | 15 (100.0%) | 0 (0.0%) |
| Law Enforcement | 92 (84.4%) | 17 (15.6%) |
| Food Preparation & Serving | 27 (52.9%) | 24 (47.1%) |
| Cleaning & Maintenance | 47 (83.9%) | 9 (16.1%) |
| Personal Care & Service | 0 (0.0%) | 31 (100.0%) |
| Total (Category) | 181 (59.7%) | 122 (40.3%) |
| Total (Overall) | 702 (52.3%) | 641 (47.7%) |
Sales and Office Occupations
The most common Sales and Office occupations in Bowling Green are Sales & Related (133 | 9.9%), and Office & Administration (105 | 7.8%).
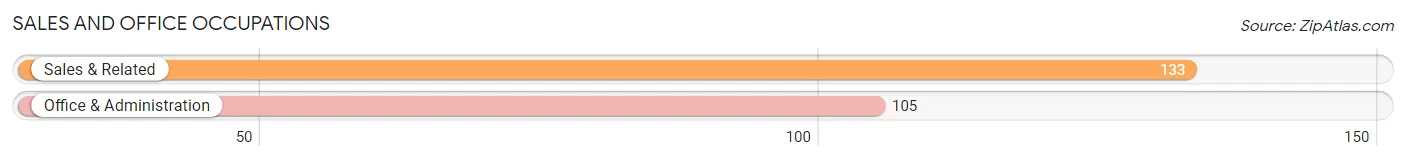
Sales and Office Occupations by Sex
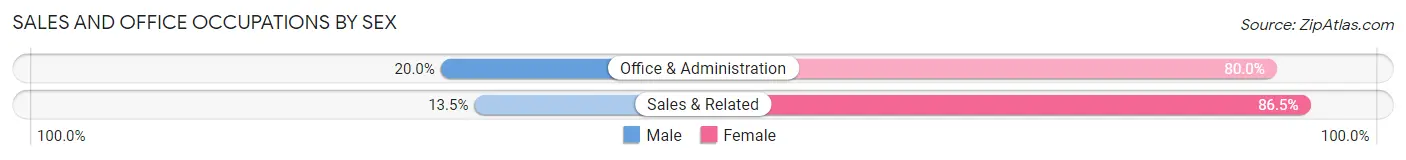
| Occupation | Male | Female |
| Sales & Related | 18 (13.5%) | 115 (86.5%) |
| Office & Administration | 21 (20.0%) | 84 (80.0%) |
| Total (Category) | 39 (16.4%) | 199 (83.6%) |
| Total (Overall) | 702 (52.3%) | 641 (47.7%) |
Natural Resources, Construction and Maintenance Occupations
The most common Natural Resources, Construction and Maintenance occupations in Bowling Green are Construction & Extraction (162 | 12.1%), Installation, Maintenance & Repair (73 | 5.4%), and Farming, Fishing & Forestry (5 | 0.4%).
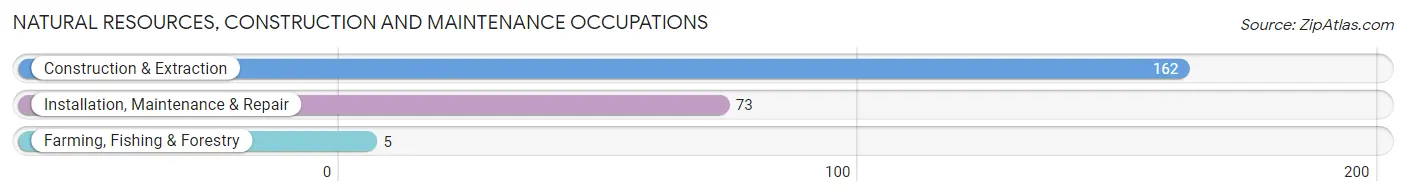
Natural Resources, Construction and Maintenance Occupations by Sex
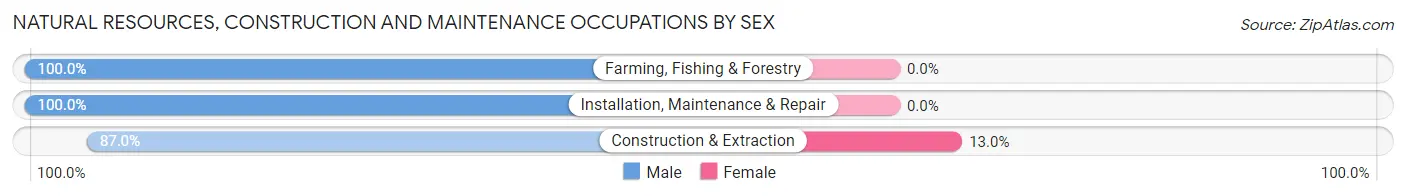
| Occupation | Male | Female |
| Farming, Fishing & Forestry | 5 (100.0%) | 0 (0.0%) |
| Construction & Extraction | 141 (87.0%) | 21 (13.0%) |
| Installation, Maintenance & Repair | 73 (100.0%) | 0 (0.0%) |
| Total (Category) | 219 (91.2%) | 21 (8.7%) |
| Total (Overall) | 702 (52.3%) | 641 (47.7%) |
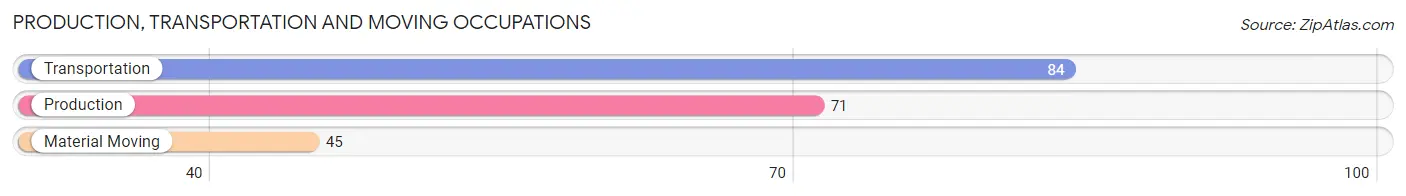
Production, Transportation and Moving Occupations
The most common Production, Transportation and Moving occupations in Bowling Green are Transportation (84 | 6.2%), Production (71 | 5.3%), and Material Moving (45 | 3.4%).
Production, Transportation and Moving Occupations by Sex
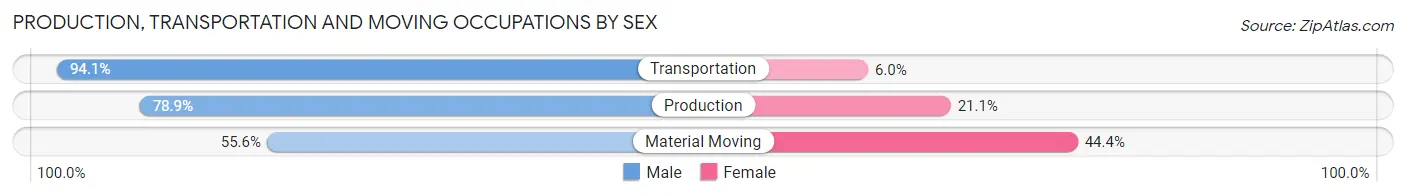
| Occupation | Male | Female |
| Production | 56 (78.9%) | 15 (21.1%) |
| Transportation | 79 (94.1%) | 5 (5.9%) |
| Material Moving | 25 (55.6%) | 20 (44.4%) |
| Total (Category) | 160 (80.0%) | 40 (20.0%) |
| Total (Overall) | 702 (52.3%) | 641 (47.7%) |
Employment Industries by Sex in Bowling Green
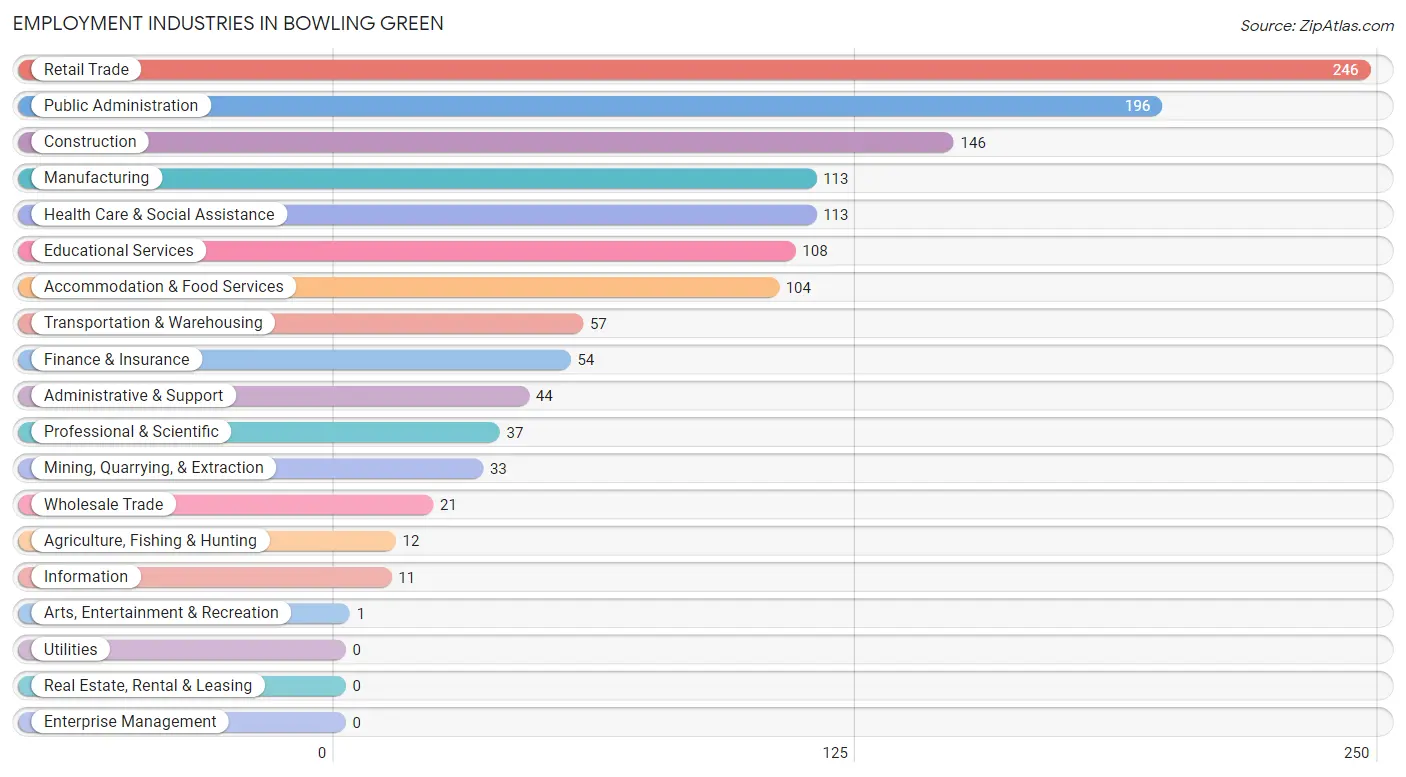
Employment Industries in Bowling Green
The major employment industries in Bowling Green include Retail Trade (246 | 18.3%), Public Administration (196 | 14.6%), Construction (146 | 10.9%), Manufacturing (113 | 8.4%), and Health Care & Social Assistance (113 | 8.4%).
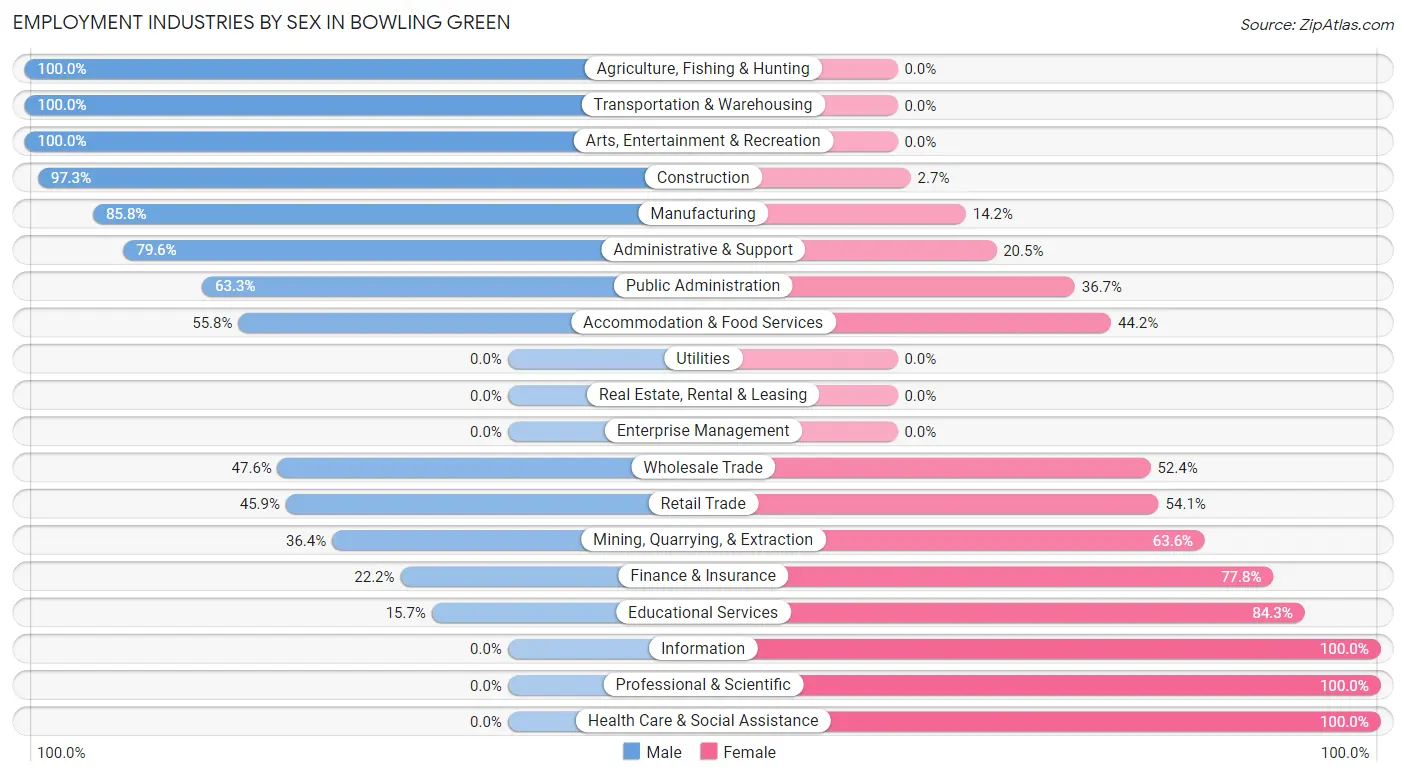
Employment Industries by Sex in Bowling Green
The Bowling Green industries that see more men than women are Agriculture, Fishing & Hunting (100.0%), Transportation & Warehousing (100.0%), and Arts, Entertainment & Recreation (100.0%), whereas the industries that tend to have a higher number of women are Information (100.0%), Professional & Scientific (100.0%), and Health Care & Social Assistance (100.0%).
| Industry | Male | Female |
| Agriculture, Fishing & Hunting | 12 (100.0%) | 0 (0.0%) |
| Mining, Quarrying, & Extraction | 12 (36.4%) | 21 (63.6%) |
| Construction | 142 (97.3%) | 4 (2.7%) |
| Manufacturing | 97 (85.8%) | 16 (14.2%) |
| Wholesale Trade | 10 (47.6%) | 11 (52.4%) |
| Retail Trade | 113 (45.9%) | 133 (54.1%) |
| Transportation & Warehousing | 57 (100.0%) | 0 (0.0%) |
| Utilities | 0 (0.0%) | 0 (0.0%) |
| Information | 0 (0.0%) | 11 (100.0%) |
| Finance & Insurance | 12 (22.2%) | 42 (77.8%) |
| Real Estate, Rental & Leasing | 0 (0.0%) | 0 (0.0%) |
| Professional & Scientific | 0 (0.0%) | 37 (100.0%) |
| Enterprise Management | 0 (0.0%) | 0 (0.0%) |
| Administrative & Support | 35 (79.5%) | 9 (20.4%) |
| Educational Services | 17 (15.7%) | 91 (84.3%) |
| Health Care & Social Assistance | 0 (0.0%) | 113 (100.0%) |
| Arts, Entertainment & Recreation | 1 (100.0%) | 0 (0.0%) |
| Accommodation & Food Services | 58 (55.8%) | 46 (44.2%) |
| Public Administration | 124 (63.3%) | 72 (36.7%) |
| Total | 702 (52.3%) | 641 (47.7%) |
Education in Bowling Green
School Enrollment in Bowling Green
The most common levels of schooling among the 722 students in Bowling Green are elementary school (206 | 28.5%), middle school (167 | 23.1%), and nursery / preschool (120 | 16.6%).
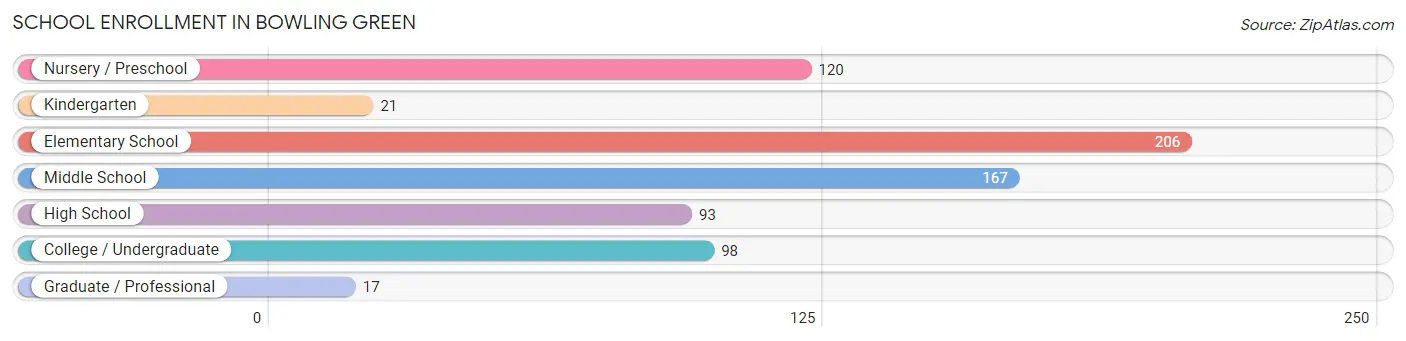
| School Level | # Students | % Students |
| Nursery / Preschool | 120 | 16.6% |
| Kindergarten | 21 | 2.9% |
| Elementary School | 206 | 28.5% |
| Middle School | 167 | 23.1% |
| High School | 93 | 12.9% |
| College / Undergraduate | 98 | 13.6% |
| Graduate / Professional | 17 | 2.4% |
| Total | 722 | 100.0% |
School Enrollment by Age by Funding Source in Bowling Green
Out of a total of 722 students who are enrolled in schools in Bowling Green, 27 (3.7%) attend a private institution, while the remaining 695 (96.3%) are enrolled in public schools. The age group of 10 to 14 year olds has the highest likelihood of being enrolled in private schools, with 16 (11.0% in the age bracket) enrolled. Conversely, the age group of 3 to 4 year olds has the lowest likelihood of being enrolled in a private school, with 18 (100.0% in the age bracket) attending a public institution.
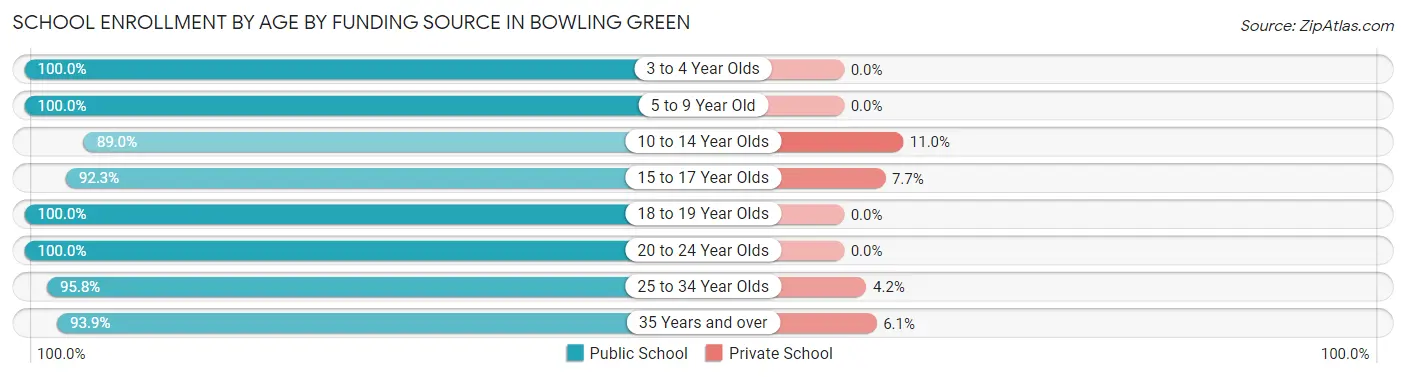
| Age Bracket | Public School | Private School |
| 3 to 4 Year Olds | 18 (100.0%) | 0 (0.0%) |
| 5 to 9 Year Old | 334 (100.0%) | 0 (0.0%) |
| 10 to 14 Year Olds | 129 (89.0%) | 16 (11.0%) |
| 15 to 17 Year Olds | 84 (92.3%) | 7 (7.7%) |
| 18 to 19 Year Olds | 22 (100.0%) | 0 (0.0%) |
| 20 to 24 Year Olds | 31 (100.0%) | 0 (0.0%) |
| 25 to 34 Year Olds | 46 (95.8%) | 2 (4.2%) |
| 35 Years and over | 31 (93.9%) | 2 (6.1%) |
| Total | 695 (96.3%) | 27 (3.7%) |
Educational Attainment by Field of Study in Bowling Green
Business (147 | 36.3%), education (77 | 19.0%), science & technology (34 | 8.4%), arts & humanities (28 | 6.9%), and literature & languages (24 | 5.9%) are the most common fields of study among 405 individuals in Bowling Green who have obtained a bachelor's degree or higher.
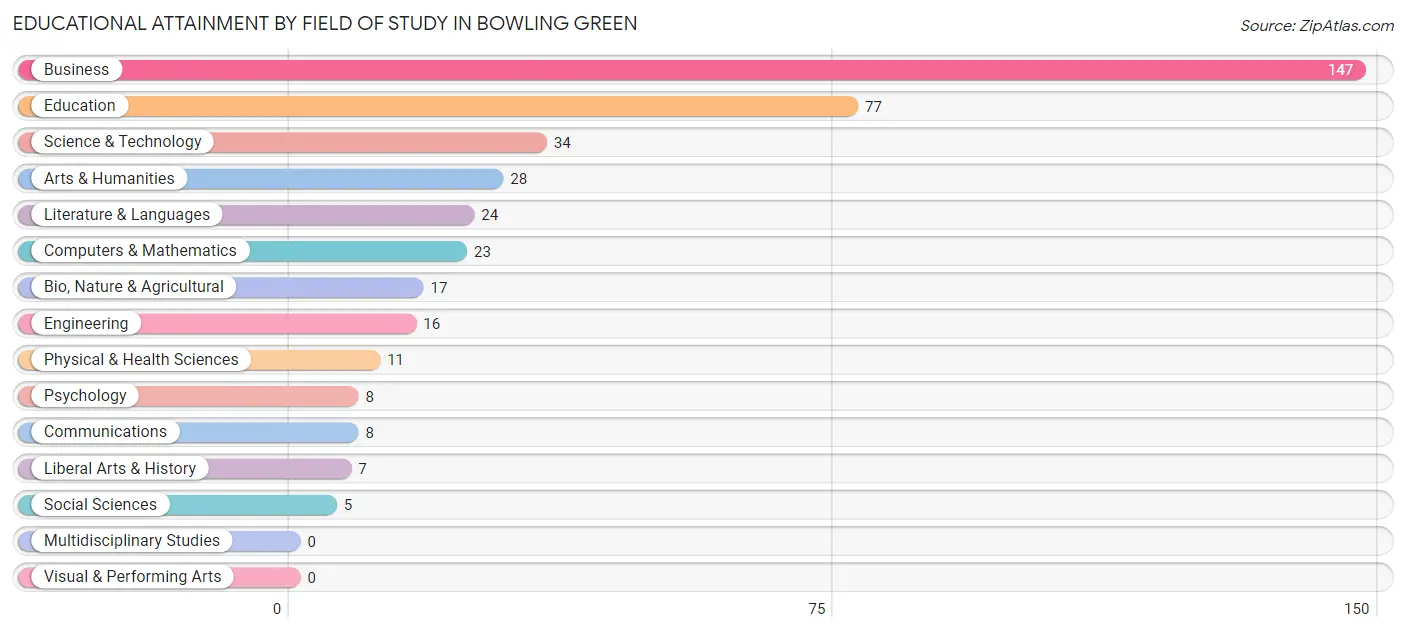
| Field of Study | # Graduates | % Graduates |
| Computers & Mathematics | 23 | 5.7% |
| Bio, Nature & Agricultural | 17 | 4.2% |
| Physical & Health Sciences | 11 | 2.7% |
| Psychology | 8 | 2.0% |
| Social Sciences | 5 | 1.2% |
| Engineering | 16 | 4.0% |
| Multidisciplinary Studies | 0 | 0.0% |
| Science & Technology | 34 | 8.4% |
| Business | 147 | 36.3% |
| Education | 77 | 19.0% |
| Literature & Languages | 24 | 5.9% |
| Liberal Arts & History | 7 | 1.7% |
| Visual & Performing Arts | 0 | 0.0% |
| Communications | 8 | 2.0% |
| Arts & Humanities | 28 | 6.9% |
| Total | 405 | 100.0% |
Transportation & Commute in Bowling Green
Vehicle Availability by Sex in Bowling Green
The most prevalent vehicle ownership categories in Bowling Green are males with 2 vehicles (265, accounting for 38.1%) and females with 2 vehicles (173, making up 42.2%).
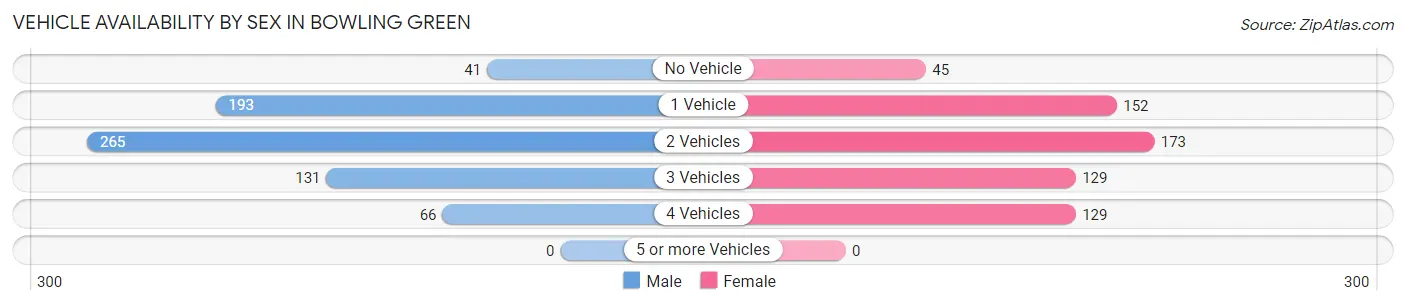
| Vehicles Available | Male | Female |
| No Vehicle | 41 (5.9%) | 45 (7.2%) |
| 1 Vehicle | 193 (27.7%) | 152 (24.2%) |
| 2 Vehicles | 265 (38.1%) | 173 (27.6%) |
| 3 Vehicles | 131 (18.8%) | 129 (20.5%) |
| 4 Vehicles | 66 (9.5%) | 129 (20.5%) |
| 5 or more Vehicles | 0 (0.0%) | 0 (0.0%) |
| Total | 696 (100.0%) | 628 (100.0%) |
Commute Time in Bowling Green
The most frequently occuring commute durations in Bowling Green are 5 to 9 minutes (307 commuters, 23.9%), 30 to 34 minutes (214 commuters, 16.7%), and 10 to 14 minutes (202 commuters, 15.7%).
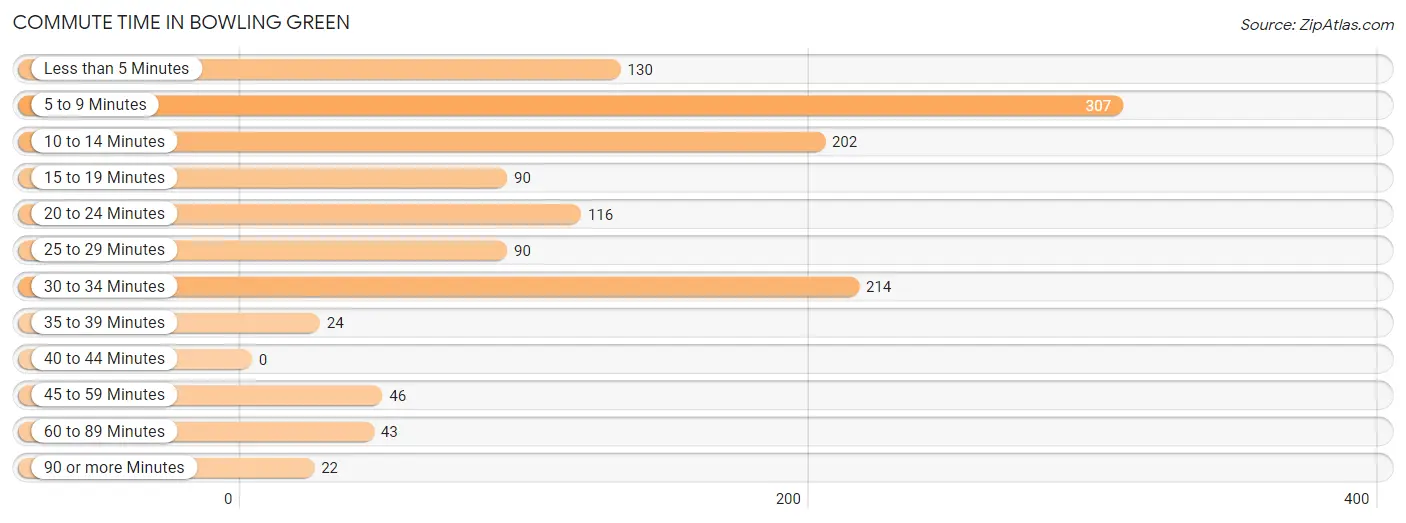
| Commute Time | # Commuters | % Commuters |
| Less than 5 Minutes | 130 | 10.1% |
| 5 to 9 Minutes | 307 | 23.9% |
| 10 to 14 Minutes | 202 | 15.7% |
| 15 to 19 Minutes | 90 | 7.0% |
| 20 to 24 Minutes | 116 | 9.0% |
| 25 to 29 Minutes | 90 | 7.0% |
| 30 to 34 Minutes | 214 | 16.7% |
| 35 to 39 Minutes | 24 | 1.9% |
| 40 to 44 Minutes | 0 | 0.0% |
| 45 to 59 Minutes | 46 | 3.6% |
| 60 to 89 Minutes | 43 | 3.4% |
| 90 or more Minutes | 22 | 1.7% |
Commute Time by Sex in Bowling Green
The most common commute times in Bowling Green are 10 to 14 minutes (160 commuters, 23.2%) for males and 5 to 9 minutes (198 commuters, 33.3%) for females.
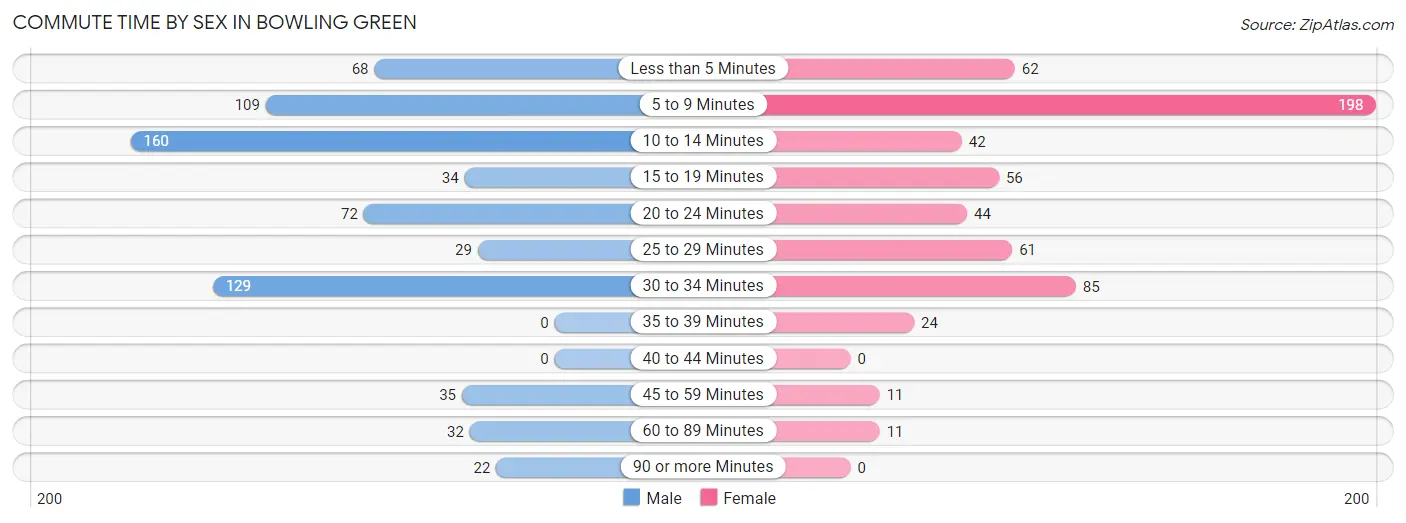
| Commute Time | Male | Female |
| Less than 5 Minutes | 68 (9.9%) | 62 (10.4%) |
| 5 to 9 Minutes | 109 (15.8%) | 198 (33.3%) |
| 10 to 14 Minutes | 160 (23.2%) | 42 (7.1%) |
| 15 to 19 Minutes | 34 (4.9%) | 56 (9.4%) |
| 20 to 24 Minutes | 72 (10.4%) | 44 (7.4%) |
| 25 to 29 Minutes | 29 (4.2%) | 61 (10.3%) |
| 30 to 34 Minutes | 129 (18.7%) | 85 (14.3%) |
| 35 to 39 Minutes | 0 (0.0%) | 24 (4.0%) |
| 40 to 44 Minutes | 0 (0.0%) | 0 (0.0%) |
| 45 to 59 Minutes | 35 (5.1%) | 11 (1.8%) |
| 60 to 89 Minutes | 32 (4.6%) | 11 (1.8%) |
| 90 or more Minutes | 22 (3.2%) | 0 (0.0%) |
Time of Departure to Work by Sex in Bowling Green
The most frequent times of departure to work in Bowling Green are 7:30 AM to 7:59 AM (267, 38.7%) for males and 7:30 AM to 7:59 AM (198, 33.3%) for females.
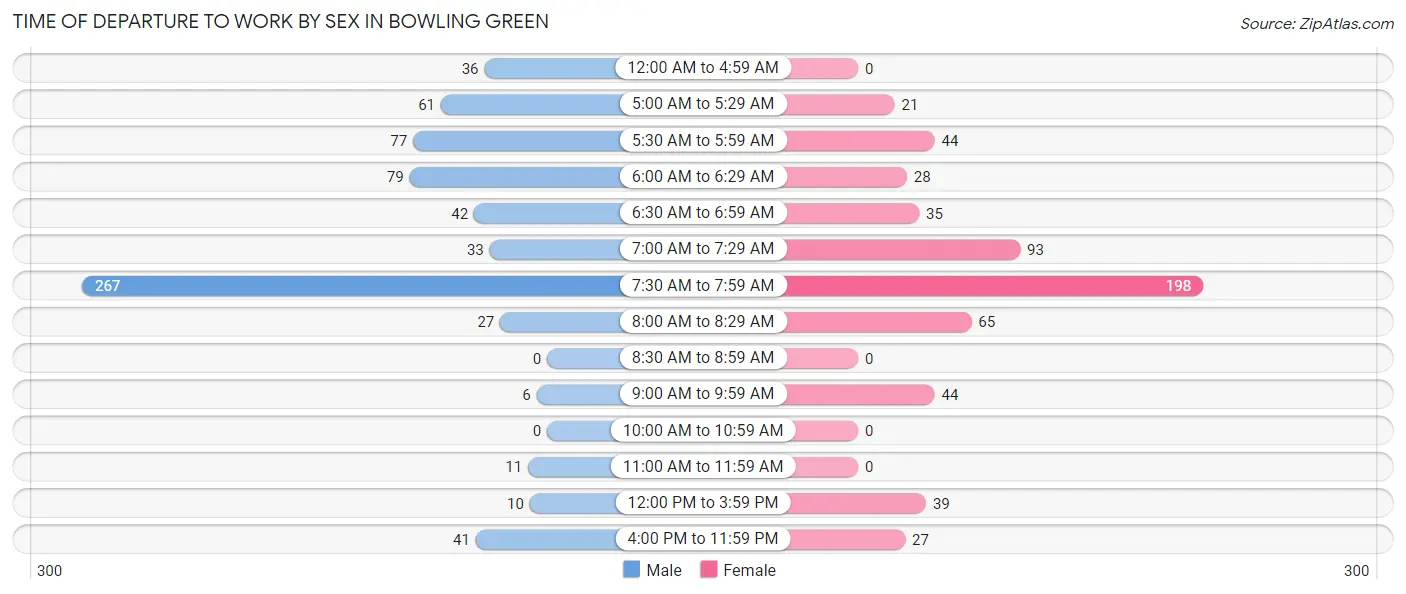
| Time of Departure | Male | Female |
| 12:00 AM to 4:59 AM | 36 (5.2%) | 0 (0.0%) |
| 5:00 AM to 5:29 AM | 61 (8.8%) | 21 (3.5%) |
| 5:30 AM to 5:59 AM | 77 (11.2%) | 44 (7.4%) |
| 6:00 AM to 6:29 AM | 79 (11.5%) | 28 (4.7%) |
| 6:30 AM to 6:59 AM | 42 (6.1%) | 35 (5.9%) |
| 7:00 AM to 7:29 AM | 33 (4.8%) | 93 (15.7%) |
| 7:30 AM to 7:59 AM | 267 (38.7%) | 198 (33.3%) |
| 8:00 AM to 8:29 AM | 27 (3.9%) | 65 (10.9%) |
| 8:30 AM to 8:59 AM | 0 (0.0%) | 0 (0.0%) |
| 9:00 AM to 9:59 AM | 6 (0.9%) | 44 (7.4%) |
| 10:00 AM to 10:59 AM | 0 (0.0%) | 0 (0.0%) |
| 11:00 AM to 11:59 AM | 11 (1.6%) | 0 (0.0%) |
| 12:00 PM to 3:59 PM | 10 (1.5%) | 39 (6.6%) |
| 4:00 PM to 11:59 PM | 41 (5.9%) | 27 (4.5%) |
| Total | 690 (100.0%) | 594 (100.0%) |
Housing Occupancy in Bowling Green
Occupancy by Ownership in Bowling Green
Of the total 1,399 dwellings in Bowling Green, owner-occupied units account for 788 (56.3%), while renter-occupied units make up 611 (43.7%).
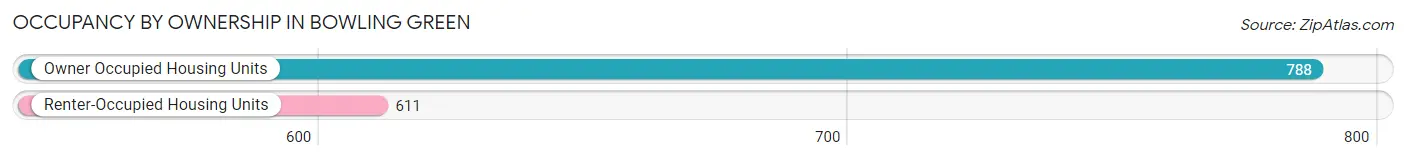
| Occupancy | # Housing Units | % Housing Units |
| Owner Occupied Housing Units | 788 | 56.3% |
| Renter-Occupied Housing Units | 611 | 43.7% |
| Total Occupied Housing Units | 1,399 | 100.0% |
Occupancy by Household Size in Bowling Green
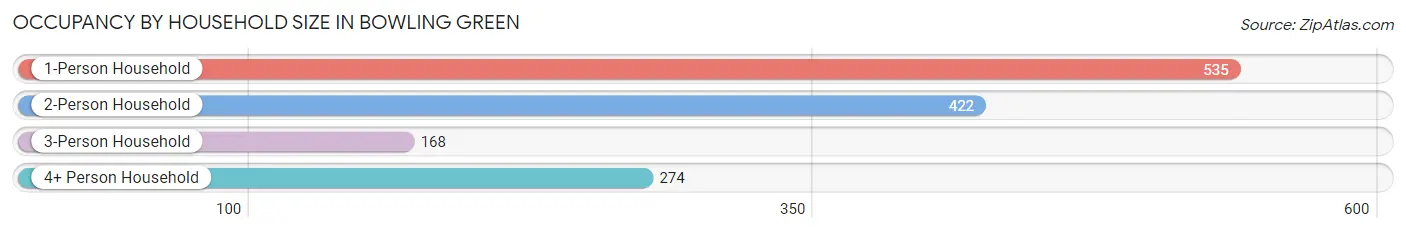
| Household Size | # Housing Units | % Housing Units |
| 1-Person Household | 535 | 38.2% |
| 2-Person Household | 422 | 30.2% |
| 3-Person Household | 168 | 12.0% |
| 4+ Person Household | 274 | 19.6% |
| Total Housing Units | 1,399 | 100.0% |
Occupancy by Ownership by Household Size in Bowling Green
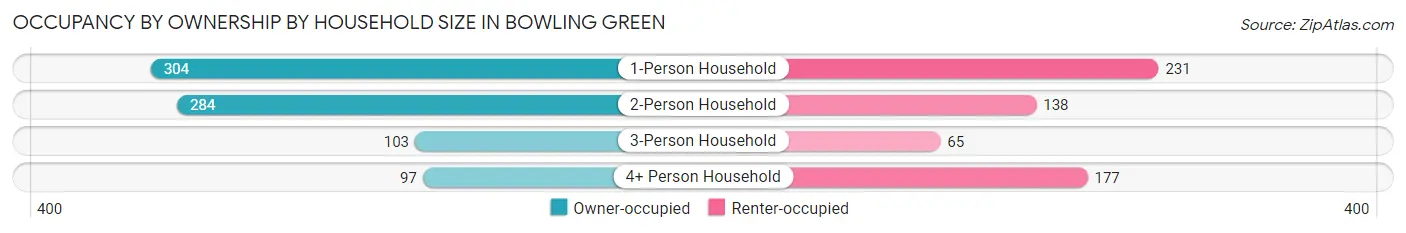
| Household Size | Owner-occupied | Renter-occupied |
| 1-Person Household | 304 (56.8%) | 231 (43.2%) |
| 2-Person Household | 284 (67.3%) | 138 (32.7%) |
| 3-Person Household | 103 (61.3%) | 65 (38.7%) |
| 4+ Person Household | 97 (35.4%) | 177 (64.6%) |
| Total Housing Units | 788 (56.3%) | 611 (43.7%) |
Occupancy by Educational Attainment in Bowling Green
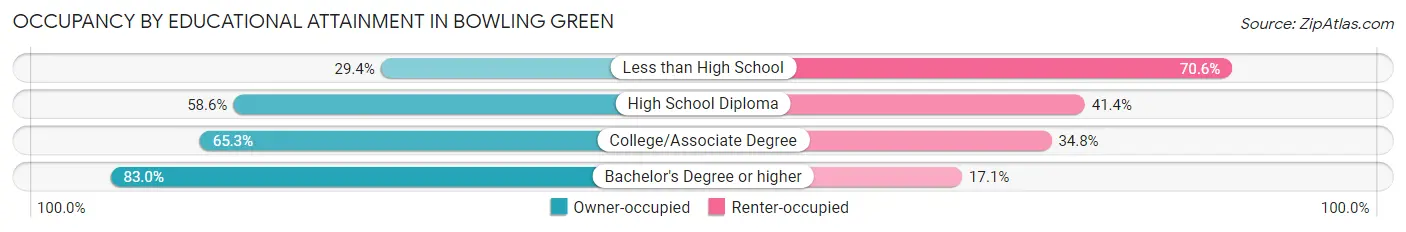
| Household Size | Owner-occupied | Renter-occupied |
| Less than High School | 83 (29.4%) | 199 (70.6%) |
| High School Diploma | 414 (58.6%) | 292 (41.4%) |
| College/Associate Degree | 184 (65.2%) | 98 (34.7%) |
| Bachelor's Degree or higher | 107 (83.0%) | 22 (17.1%) |
Occupancy by Age of Householder in Bowling Green
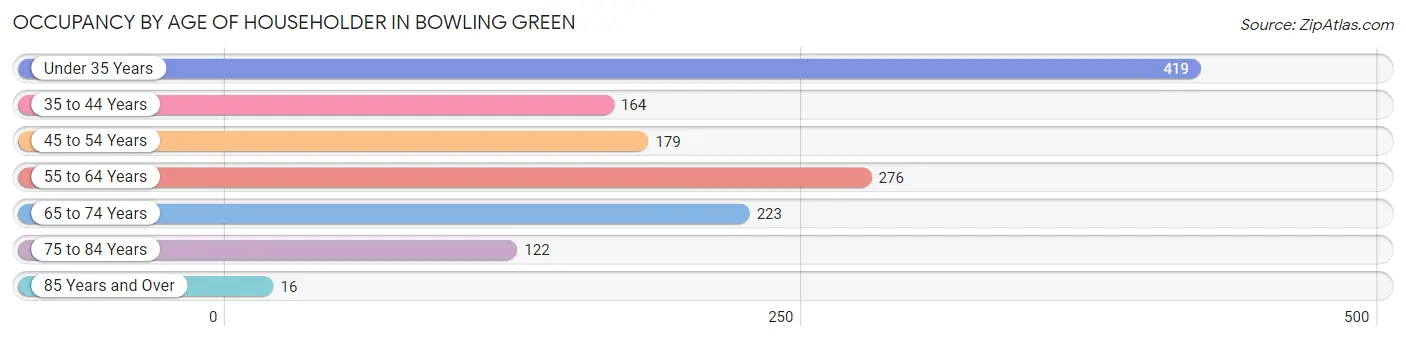
| Age Bracket | # Households | % Households |
| Under 35 Years | 419 | 29.9% |
| 35 to 44 Years | 164 | 11.7% |
| 45 to 54 Years | 179 | 12.8% |
| 55 to 64 Years | 276 | 19.7% |
| 65 to 74 Years | 223 | 15.9% |
| 75 to 84 Years | 122 | 8.7% |
| 85 Years and Over | 16 | 1.1% |
| Total | 1,399 | 100.0% |
Housing Finances in Bowling Green
Median Income by Occupancy in Bowling Green
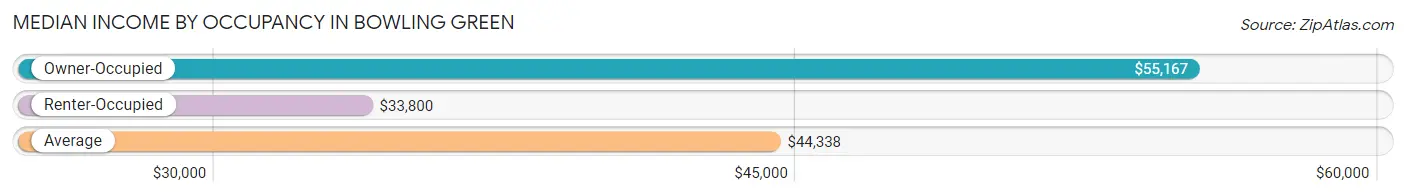
| Occupancy Type | # Households | Median Income |
| Owner-Occupied | 788 (56.3%) | $55,167 |
| Renter-Occupied | 611 (43.7%) | $33,800 |
| Average | 1,399 (100.0%) | $44,338 |
Occupancy by Householder Income Bracket in Bowling Green
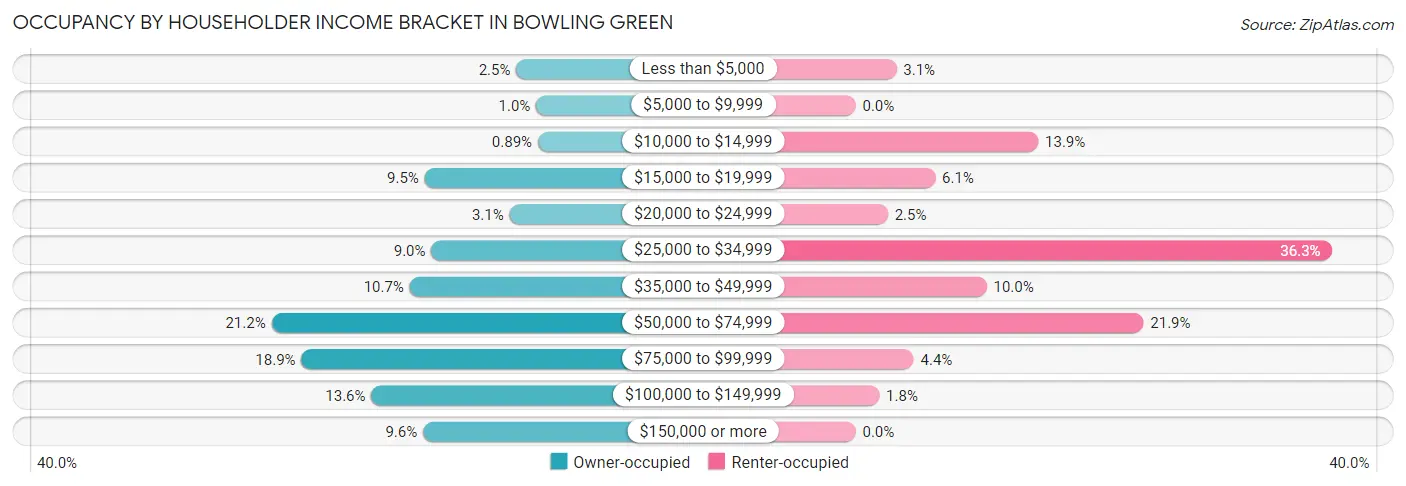
| Income Bracket | Owner-occupied | Renter-occupied |
| Less than $5,000 | 20 (2.5%) | 19 (3.1%) |
| $5,000 to $9,999 | 8 (1.0%) | 0 (0.0%) |
| $10,000 to $14,999 | 7 (0.9%) | 85 (13.9%) |
| $15,000 to $19,999 | 75 (9.5%) | 37 (6.1%) |
| $20,000 to $24,999 | 24 (3.0%) | 15 (2.5%) |
| $25,000 to $34,999 | 71 (9.0%) | 222 (36.3%) |
| $35,000 to $49,999 | 84 (10.7%) | 61 (10.0%) |
| $50,000 to $74,999 | 167 (21.2%) | 134 (21.9%) |
| $75,000 to $99,999 | 149 (18.9%) | 27 (4.4%) |
| $100,000 to $149,999 | 107 (13.6%) | 11 (1.8%) |
| $150,000 or more | 76 (9.6%) | 0 (0.0%) |
| Total | 788 (100.0%) | 611 (100.0%) |
Monthly Housing Cost Tiers in Bowling Green
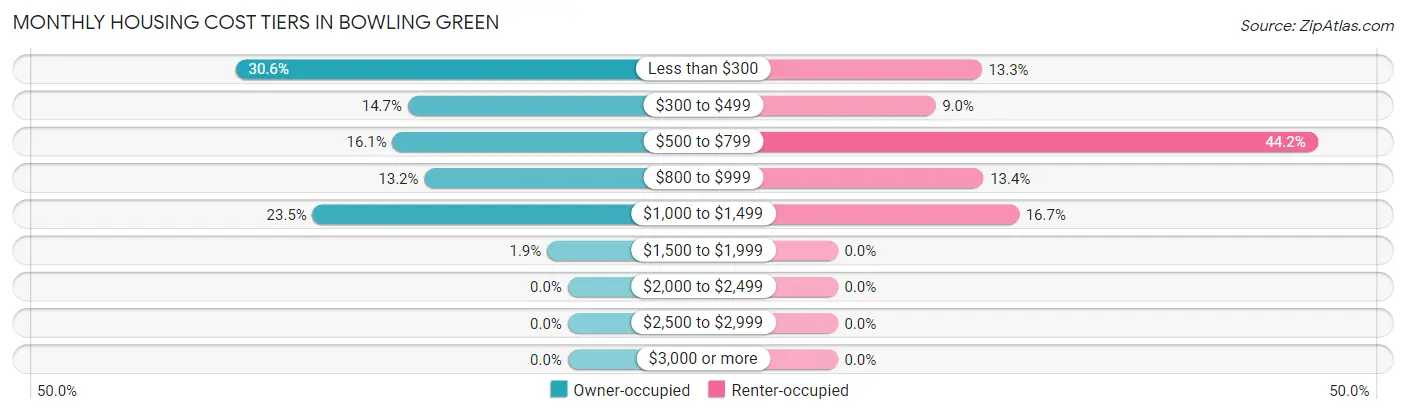
| Monthly Cost | Owner-occupied | Renter-occupied |
| Less than $300 | 241 (30.6%) | 81 (13.3%) |
| $300 to $499 | 116 (14.7%) | 55 (9.0%) |
| $500 to $799 | 127 (16.1%) | 270 (44.2%) |
| $800 to $999 | 104 (13.2%) | 82 (13.4%) |
| $1,000 to $1,499 | 185 (23.5%) | 102 (16.7%) |
| $1,500 to $1,999 | 15 (1.9%) | 0 (0.0%) |
| $2,000 to $2,499 | 0 (0.0%) | 0 (0.0%) |
| $2,500 to $2,999 | 0 (0.0%) | 0 (0.0%) |
| $3,000 or more | 0 (0.0%) | 0 (0.0%) |
| Total | 788 (100.0%) | 611 (100.0%) |
Physical Housing Characteristics in Bowling Green
Housing Structures in Bowling Green
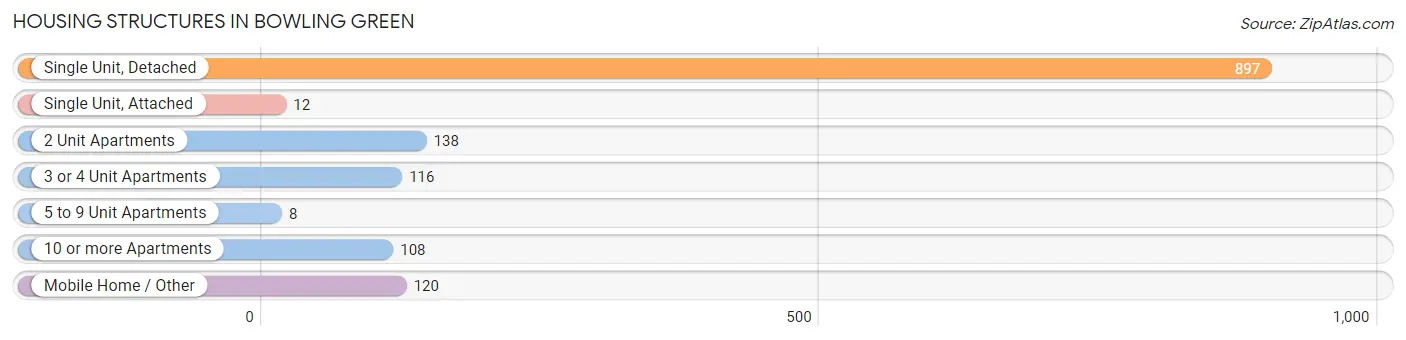
| Structure Type | # Housing Units | % Housing Units |
| Single Unit, Detached | 897 | 64.1% |
| Single Unit, Attached | 12 | 0.9% |
| 2 Unit Apartments | 138 | 9.9% |
| 3 or 4 Unit Apartments | 116 | 8.3% |
| 5 to 9 Unit Apartments | 8 | 0.6% |
| 10 or more Apartments | 108 | 7.7% |
| Mobile Home / Other | 120 | 8.6% |
| Total | 1,399 | 100.0% |
Housing Structures by Occupancy in Bowling Green
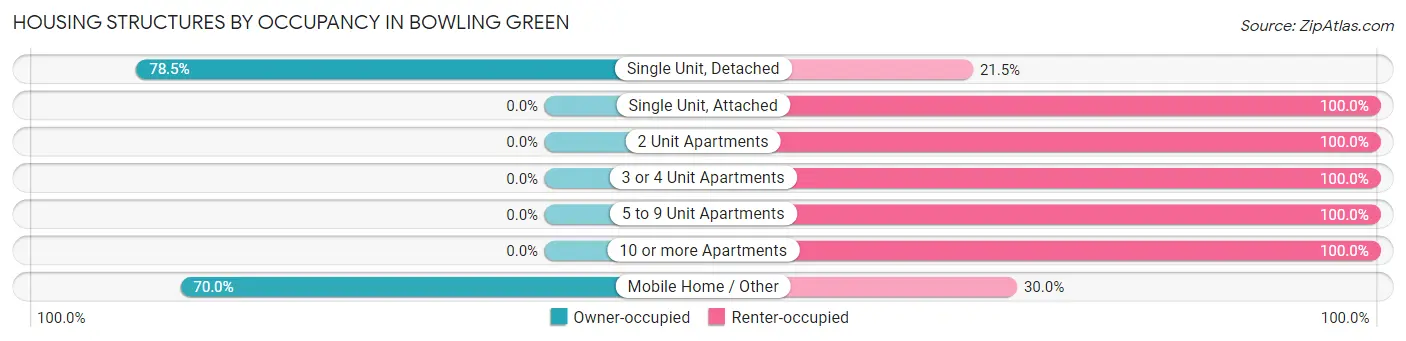
| Structure Type | Owner-occupied | Renter-occupied |
| Single Unit, Detached | 704 (78.5%) | 193 (21.5%) |
| Single Unit, Attached | 0 (0.0%) | 12 (100.0%) |
| 2 Unit Apartments | 0 (0.0%) | 138 (100.0%) |
| 3 or 4 Unit Apartments | 0 (0.0%) | 116 (100.0%) |
| 5 to 9 Unit Apartments | 0 (0.0%) | 8 (100.0%) |
| 10 or more Apartments | 0 (0.0%) | 108 (100.0%) |
| Mobile Home / Other | 84 (70.0%) | 36 (30.0%) |
| Total | 788 (56.3%) | 611 (43.7%) |
Housing Structures by Number of Rooms in Bowling Green
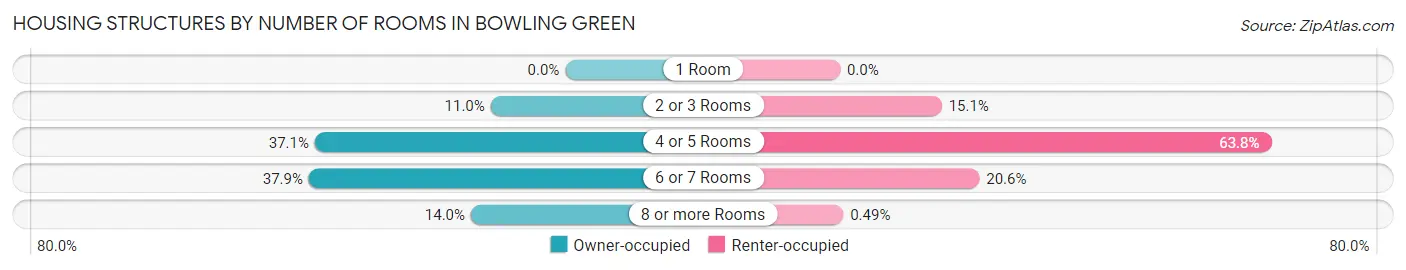
| Number of Rooms | Owner-occupied | Renter-occupied |
| 1 Room | 0 (0.0%) | 0 (0.0%) |
| 2 or 3 Rooms | 87 (11.0%) | 92 (15.1%) |
| 4 or 5 Rooms | 292 (37.1%) | 390 (63.8%) |
| 6 or 7 Rooms | 299 (37.9%) | 126 (20.6%) |
| 8 or more Rooms | 110 (14.0%) | 3 (0.5%) |
| Total | 788 (100.0%) | 611 (100.0%) |
Housing Structure by Heating Type in Bowling Green
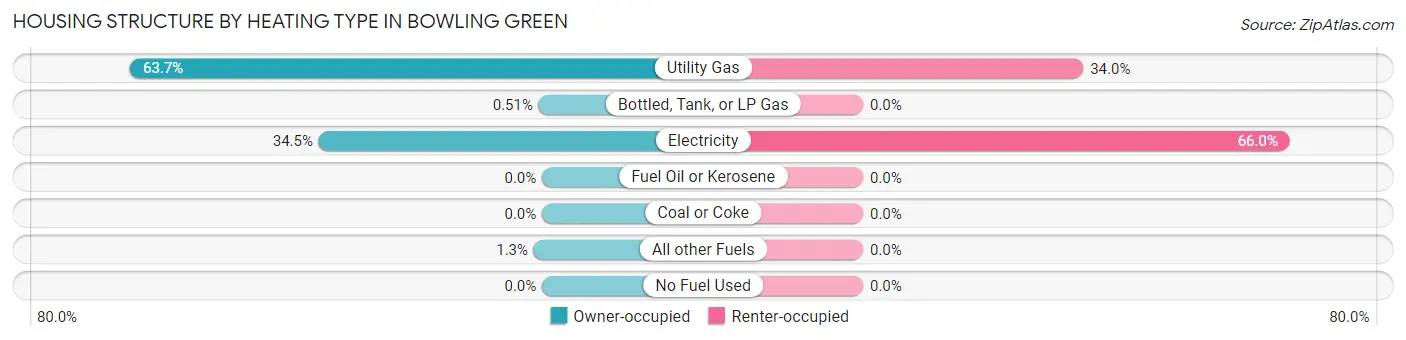
| Heating Type | Owner-occupied | Renter-occupied |
| Utility Gas | 502 (63.7%) | 208 (34.0%) |
| Bottled, Tank, or LP Gas | 4 (0.5%) | 0 (0.0%) |
| Electricity | 272 (34.5%) | 403 (66.0%) |
| Fuel Oil or Kerosene | 0 (0.0%) | 0 (0.0%) |
| Coal or Coke | 0 (0.0%) | 0 (0.0%) |
| All other Fuels | 10 (1.3%) | 0 (0.0%) |
| No Fuel Used | 0 (0.0%) | 0 (0.0%) |
| Total | 788 (100.0%) | 611 (100.0%) |
Household Vehicle Usage in Bowling Green
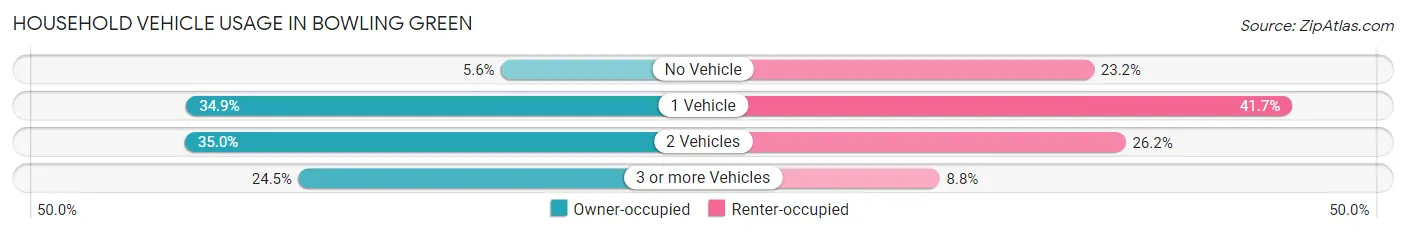
| Vehicles per Household | Owner-occupied | Renter-occupied |
| No Vehicle | 44 (5.6%) | 142 (23.2%) |
| 1 Vehicle | 275 (34.9%) | 255 (41.7%) |
| 2 Vehicles | 276 (35.0%) | 160 (26.2%) |
| 3 or more Vehicles | 193 (24.5%) | 54 (8.8%) |
| Total | 788 (100.0%) | 611 (100.0%) |
Real Estate & Mortgages in Bowling Green
Real Estate and Mortgage Overview in Bowling Green
| Characteristic | Without Mortgage | With Mortgage |
| Housing Units | 417 | 371 |
| Median Property Value | $74,500 | $143,200 |
| Median Household Income | $47,404 | $76 |
| Monthly Housing Costs | $297 | $0 |
| Real Estate Taxes | $531 | $0 |
Property Value by Mortgage Status in Bowling Green
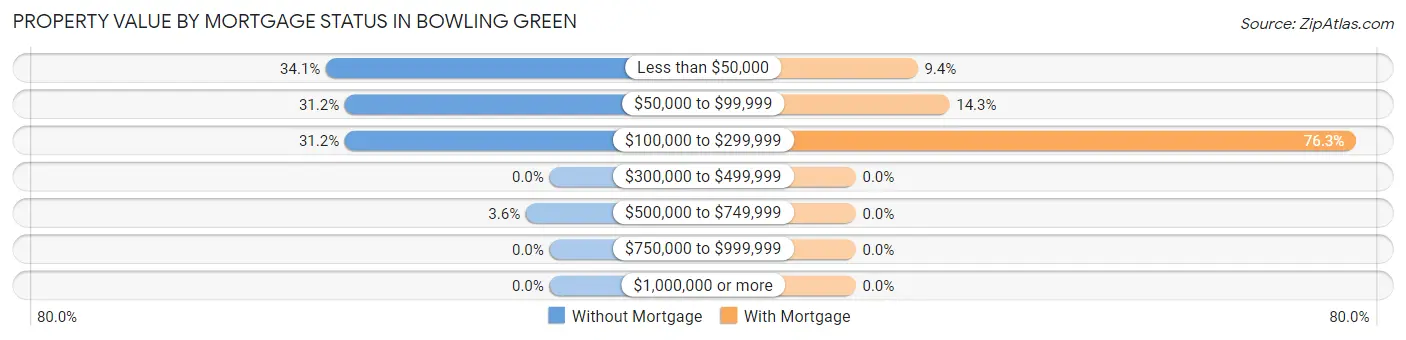
| Property Value | Without Mortgage | With Mortgage |
| Less than $50,000 | 142 (34.1%) | 35 (9.4%) |
| $50,000 to $99,999 | 130 (31.2%) | 53 (14.3%) |
| $100,000 to $299,999 | 130 (31.2%) | 283 (76.3%) |
| $300,000 to $499,999 | 0 (0.0%) | 0 (0.0%) |
| $500,000 to $749,999 | 15 (3.6%) | 0 (0.0%) |
| $750,000 to $999,999 | 0 (0.0%) | 0 (0.0%) |
| $1,000,000 or more | 0 (0.0%) | 0 (0.0%) |
| Total | 417 (100.0%) | 371 (100.0%) |
Household Income by Mortgage Status in Bowling Green
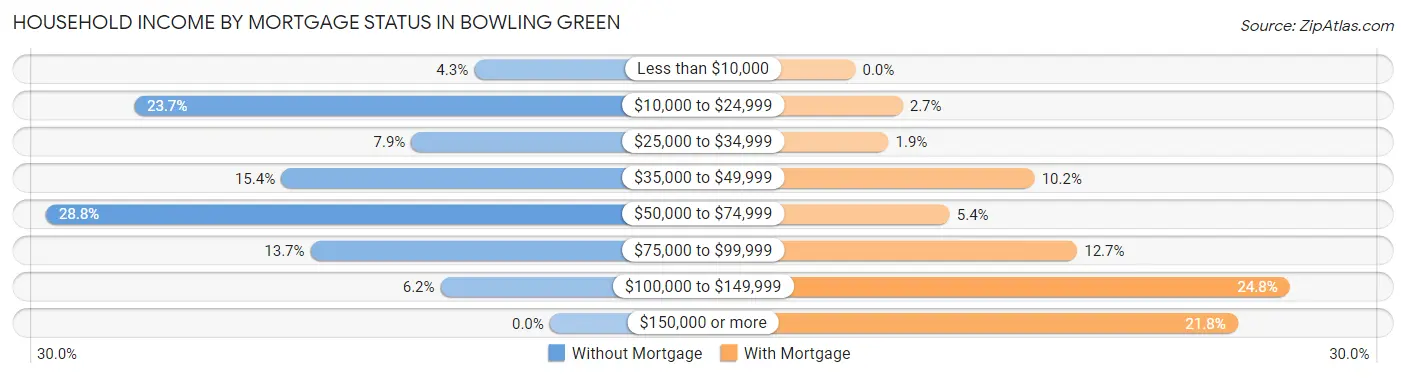
| Household Income | Without Mortgage | With Mortgage |
| Less than $10,000 | 18 (4.3%) | 0 (0.0%) |
| $10,000 to $24,999 | 99 (23.7%) | 10 (2.7%) |
| $25,000 to $34,999 | 33 (7.9%) | 7 (1.9%) |
| $35,000 to $49,999 | 64 (15.3%) | 38 (10.2%) |
| $50,000 to $74,999 | 120 (28.8%) | 20 (5.4%) |
| $75,000 to $99,999 | 57 (13.7%) | 47 (12.7%) |
| $100,000 to $149,999 | 26 (6.2%) | 92 (24.8%) |
| $150,000 or more | 0 (0.0%) | 81 (21.8%) |
| Total | 417 (100.0%) | 371 (100.0%) |
Property Value to Household Income Ratio in Bowling Green
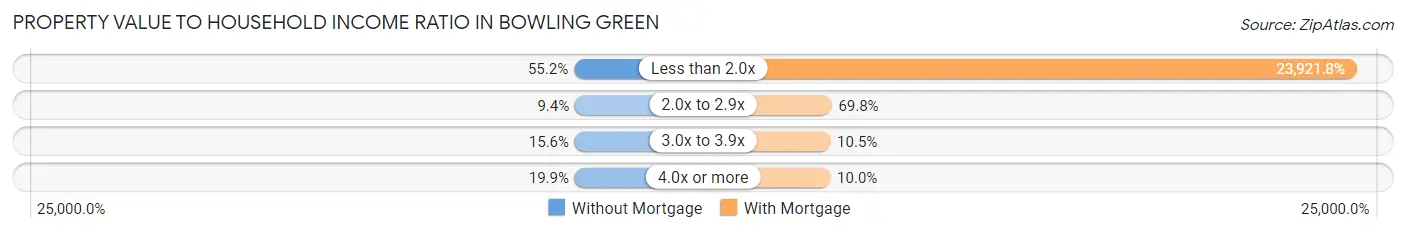
| Value-to-Income Ratio | Without Mortgage | With Mortgage |
| Less than 2.0x | 230 (55.2%) | 88,750 (23,921.8%) |
| 2.0x to 2.9x | 39 (9.3%) | 259 (69.8%) |
| 3.0x to 3.9x | 65 (15.6%) | 39 (10.5%) |
| 4.0x or more | 83 (19.9%) | 37 (10.0%) |
| Total | 417 (100.0%) | 371 (100.0%) |
Real Estate Taxes by Mortgage Status in Bowling Green
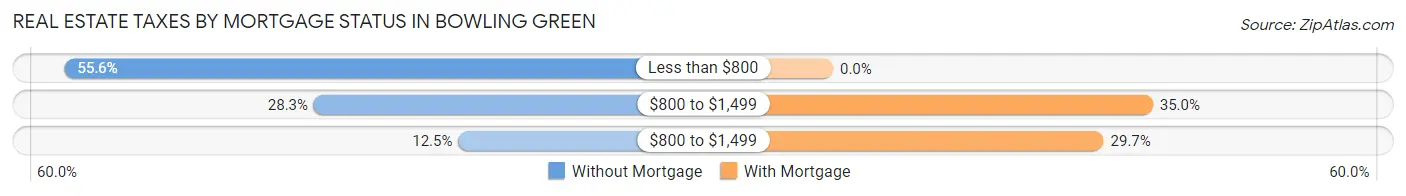
| Property Taxes | Without Mortgage | With Mortgage |
| Less than $800 | 232 (55.6%) | 0 (0.0%) |
| $800 to $1,499 | 118 (28.3%) | 130 (35.0%) |
| $800 to $1,499 | 52 (12.5%) | 110 (29.6%) |
| Total | 417 (100.0%) | 371 (100.0%) |
Health & Disability in Bowling Green
Health Insurance Coverage by Age in Bowling Green
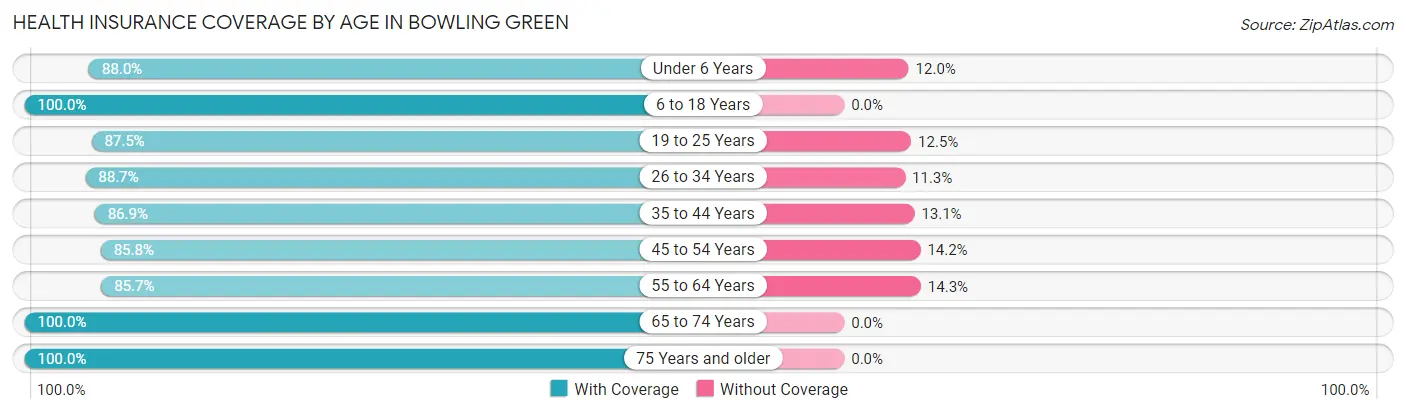
| Age Bracket | With Coverage | Without Coverage |
| Under 6 Years | 308 (88.0%) | 42 (12.0%) |
| 6 to 18 Years | 462 (100.0%) | 0 (0.0%) |
| 19 to 25 Years | 344 (87.5%) | 49 (12.5%) |
| 26 to 34 Years | 477 (88.7%) | 61 (11.3%) |
| 35 to 44 Years | 226 (86.9%) | 34 (13.1%) |
| 45 to 54 Years | 278 (85.8%) | 46 (14.2%) |
| 55 to 64 Years | 306 (85.7%) | 51 (14.3%) |
| 65 to 74 Years | 340 (100.0%) | 0 (0.0%) |
| 75 Years and older | 196 (100.0%) | 0 (0.0%) |
| Total | 2,937 (91.2%) | 283 (8.8%) |
Health Insurance Coverage by Citizenship Status in Bowling Green
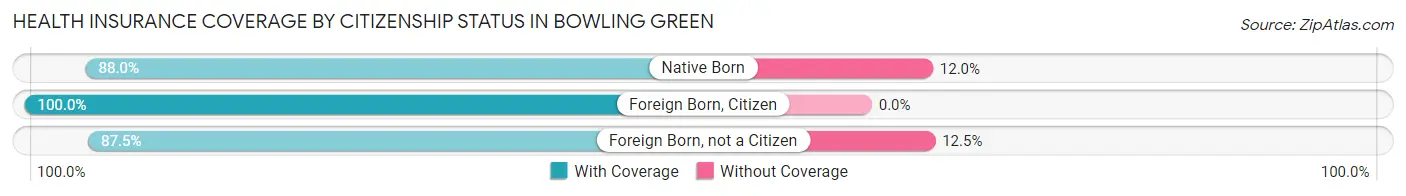
| Citizenship Status | With Coverage | Without Coverage |
| Native Born | 308 (88.0%) | 42 (12.0%) |
| Foreign Born, Citizen | 462 (100.0%) | 0 (0.0%) |
| Foreign Born, not a Citizen | 344 (87.5%) | 49 (12.5%) |
Health Insurance Coverage by Household Income in Bowling Green
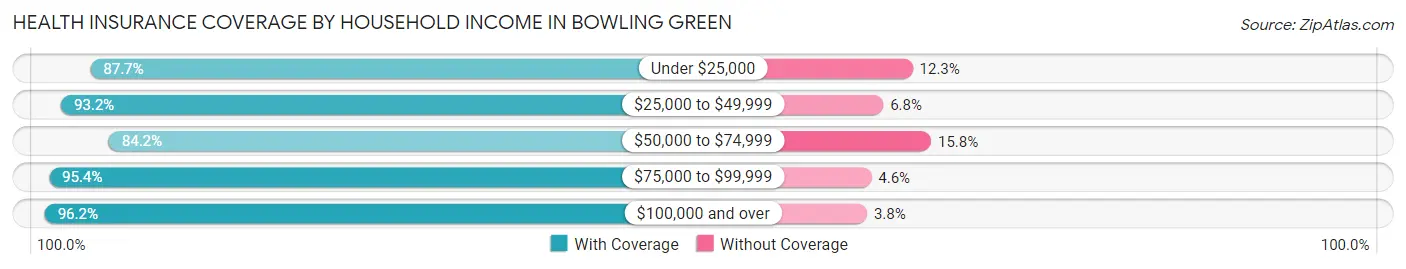
| Household Income | With Coverage | Without Coverage |
| Under $25,000 | 384 (87.7%) | 54 (12.3%) |
| $25,000 to $49,999 | 902 (93.2%) | 66 (6.8%) |
| $50,000 to $74,999 | 560 (84.2%) | 105 (15.8%) |
| $75,000 to $99,999 | 415 (95.4%) | 20 (4.6%) |
| $100,000 and over | 637 (96.2%) | 25 (3.8%) |
Public vs Private Health Insurance Coverage by Age in Bowling Green
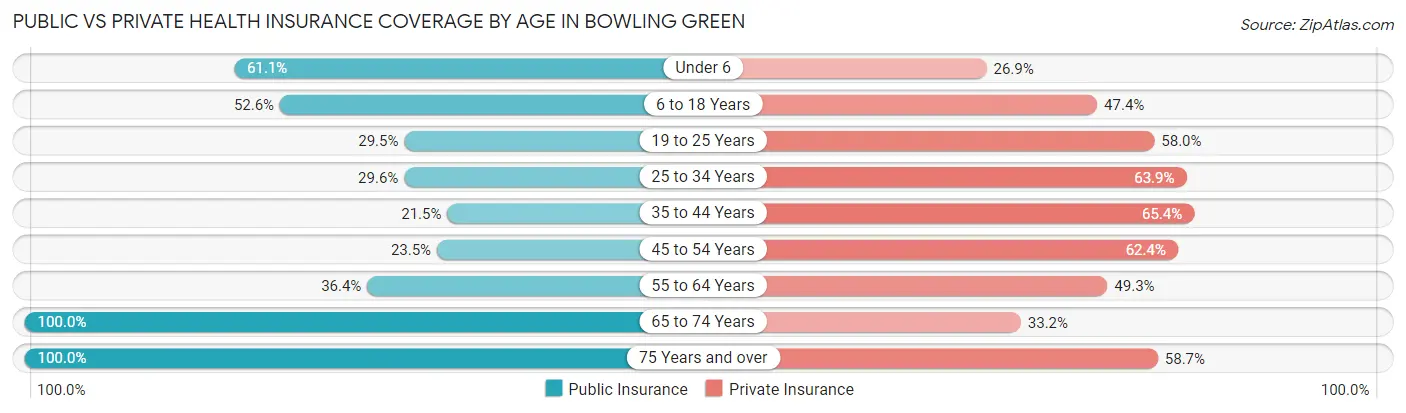
| Age Bracket | Public Insurance | Private Insurance |
| Under 6 | 214 (61.1%) | 94 (26.9%) |
| 6 to 18 Years | 243 (52.6%) | 219 (47.4%) |
| 19 to 25 Years | 116 (29.5%) | 228 (58.0%) |
| 25 to 34 Years | 159 (29.5%) | 344 (63.9%) |
| 35 to 44 Years | 56 (21.5%) | 170 (65.4%) |
| 45 to 54 Years | 76 (23.5%) | 202 (62.4%) |
| 55 to 64 Years | 130 (36.4%) | 176 (49.3%) |
| 65 to 74 Years | 340 (100.0%) | 113 (33.2%) |
| 75 Years and over | 196 (100.0%) | 115 (58.7%) |
| Total | 1,530 (47.5%) | 1,661 (51.6%) |
Disability Status by Sex by Age in Bowling Green
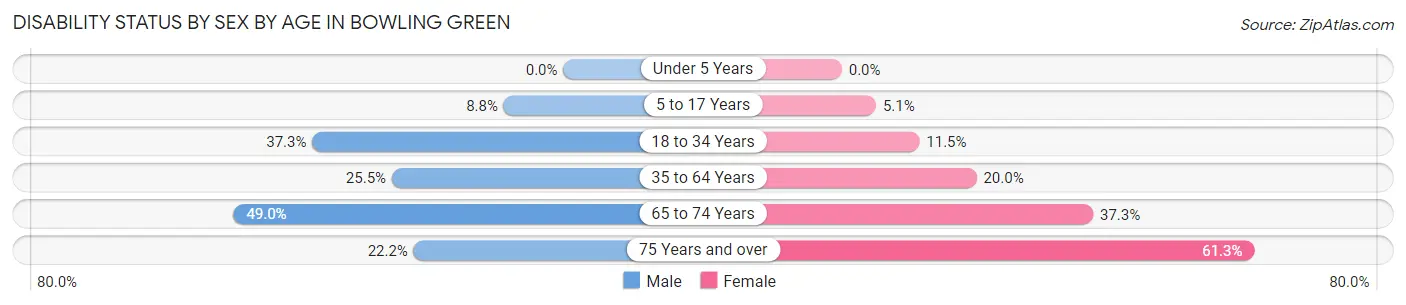
| Age Bracket | Male | Female |
| Under 5 Years | 0 (0.0%) | 0 (0.0%) |
| 5 to 17 Years | 22 (8.8%) | 17 (5.1%) |
| 18 to 34 Years | 195 (37.3%) | 47 (11.5%) |
| 35 to 64 Years | 125 (25.5%) | 90 (20.0%) |
| 65 to 74 Years | 72 (49.0%) | 72 (37.3%) |
| 75 Years and over | 8 (22.2%) | 98 (61.3%) |
Disability Class by Sex by Age in Bowling Green
Disability Class: Hearing Difficulty
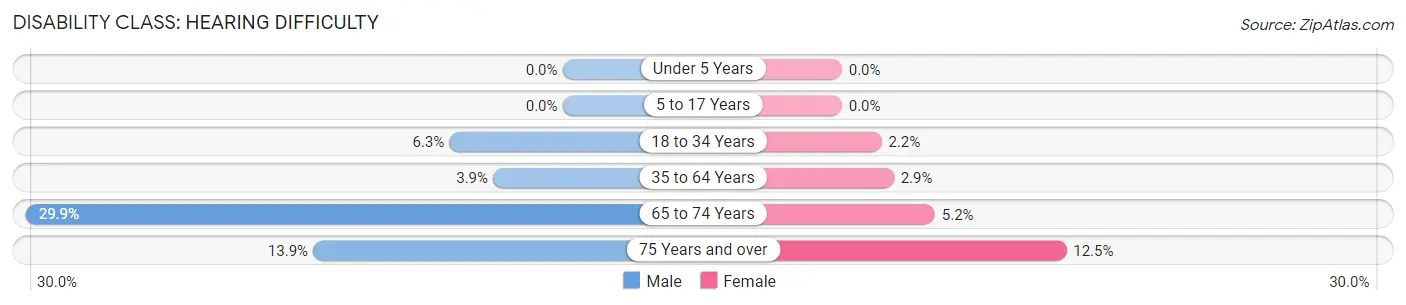
| Age Bracket | Male | Female |
| Under 5 Years | 0 (0.0%) | 0 (0.0%) |
| 5 to 17 Years | 0 (0.0%) | 0 (0.0%) |
| 18 to 34 Years | 33 (6.3%) | 9 (2.2%) |
| 35 to 64 Years | 19 (3.9%) | 13 (2.9%) |
| 65 to 74 Years | 44 (29.9%) | 10 (5.2%) |
| 75 Years and over | 5 (13.9%) | 20 (12.5%) |
Disability Class: Vision Difficulty
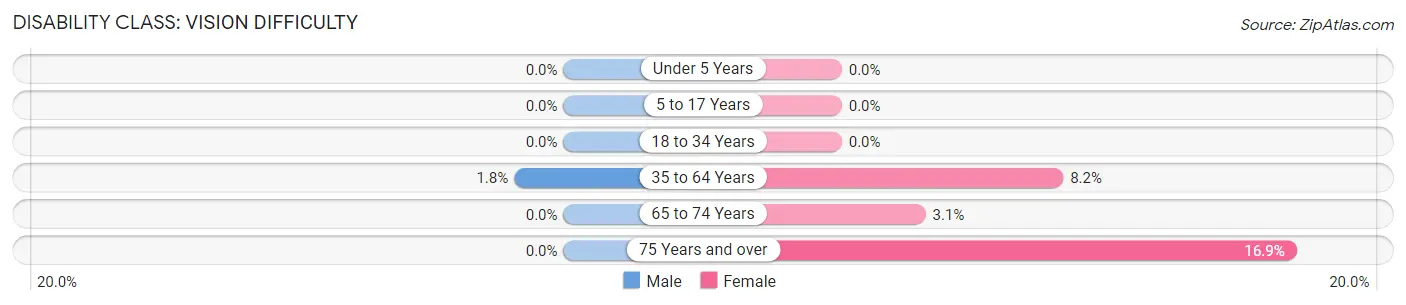
| Age Bracket | Male | Female |
| Under 5 Years | 0 (0.0%) | 0 (0.0%) |
| 5 to 17 Years | 0 (0.0%) | 0 (0.0%) |
| 18 to 34 Years | 0 (0.0%) | 0 (0.0%) |
| 35 to 64 Years | 9 (1.8%) | 37 (8.2%) |
| 65 to 74 Years | 0 (0.0%) | 6 (3.1%) |
| 75 Years and over | 0 (0.0%) | 27 (16.9%) |
Disability Class: Cognitive Difficulty
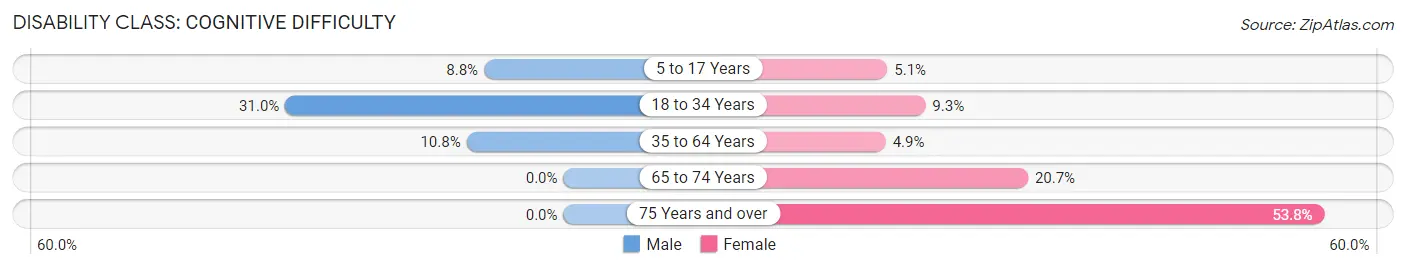
| Age Bracket | Male | Female |
| 5 to 17 Years | 22 (8.8%) | 17 (5.1%) |
| 18 to 34 Years | 162 (31.0%) | 38 (9.3%) |
| 35 to 64 Years | 53 (10.8%) | 22 (4.9%) |
| 65 to 74 Years | 0 (0.0%) | 40 (20.7%) |
| 75 Years and over | 0 (0.0%) | 86 (53.7%) |
Disability Class: Ambulatory Difficulty
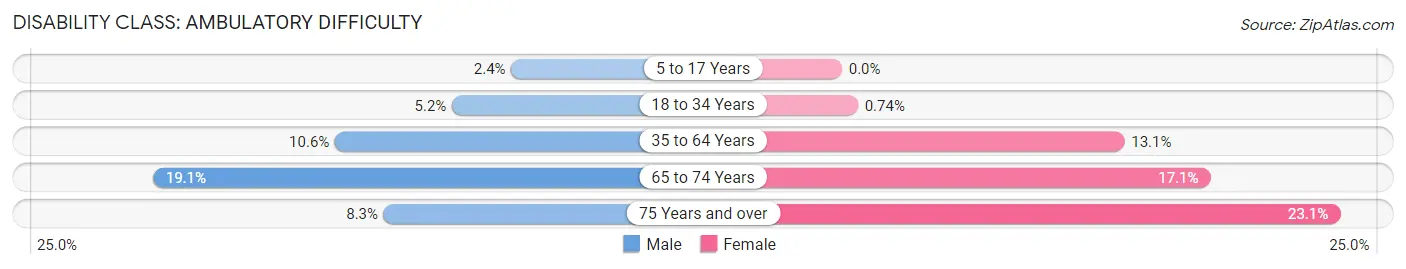
| Age Bracket | Male | Female |
| 5 to 17 Years | 6 (2.4%) | 0 (0.0%) |
| 18 to 34 Years | 27 (5.2%) | 3 (0.7%) |
| 35 to 64 Years | 52 (10.6%) | 59 (13.1%) |
| 65 to 74 Years | 28 (19.1%) | 33 (17.1%) |
| 75 Years and over | 3 (8.3%) | 37 (23.1%) |
Disability Class: Self-Care Difficulty
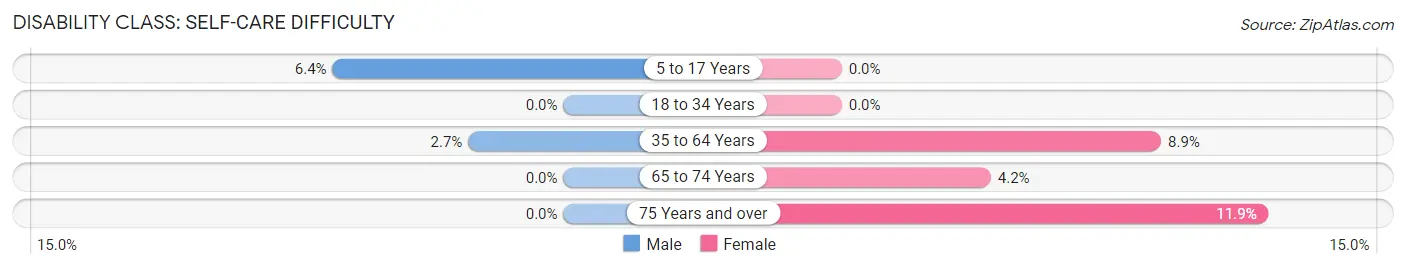
| Age Bracket | Male | Female |
| 5 to 17 Years | 16 (6.4%) | 0 (0.0%) |
| 18 to 34 Years | 0 (0.0%) | 0 (0.0%) |
| 35 to 64 Years | 13 (2.6%) | 40 (8.9%) |
| 65 to 74 Years | 0 (0.0%) | 8 (4.2%) |
| 75 Years and over | 0 (0.0%) | 19 (11.9%) |
Technology Access in Bowling Green
Computing Device Access in Bowling Green
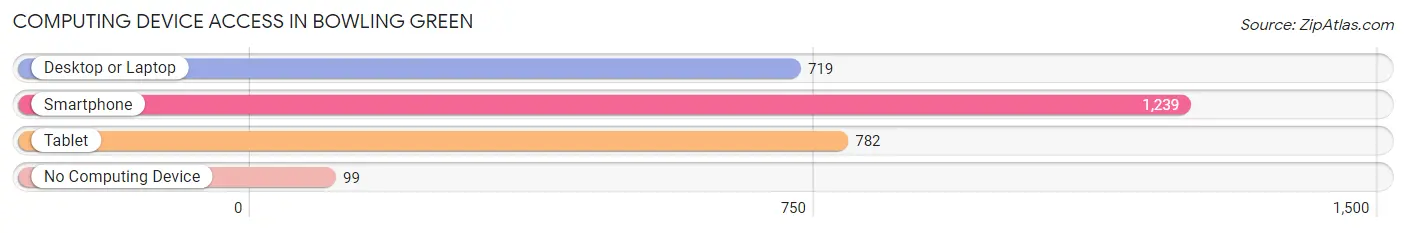
| Device Type | # Households | % Households |
| Desktop or Laptop | 719 | 51.4% |
| Smartphone | 1,239 | 88.6% |
| Tablet | 782 | 55.9% |
| No Computing Device | 99 | 7.1% |
| Total | 1,399 | 100.0% |
Internet Access in Bowling Green
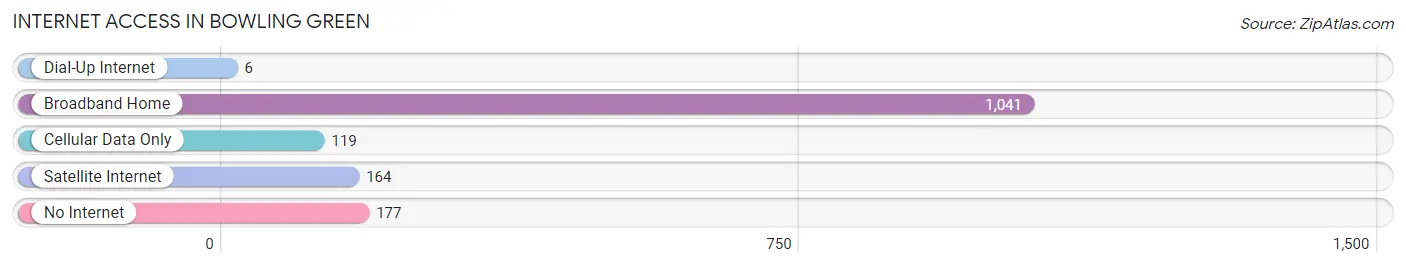
| Internet Type | # Households | % Households |
| Dial-Up Internet | 6 | 0.4% |
| Broadband Home | 1,041 | 74.4% |
| Cellular Data Only | 119 | 8.5% |
| Satellite Internet | 164 | 11.7% |
| No Internet | 177 | 12.7% |
| Total | 1,399 | 100.0% |
Bowling Green Summary
Bowling Green, Missouri is a small town located in Pike County, Missouri. It is situated on the banks of the Mississippi River, approximately 50 miles north of St. Louis. The town was founded in 1818 and has a population of approximately 3,000 people.
History
Bowling Green was founded in 1818 by a group of settlers from Kentucky. The town was named after the Kentucky city of Bowling Green. The settlers were attracted to the area due to its fertile soil and abundant natural resources. The town quickly grew and by 1820, it had a population of over 500 people.
In 1821, the town was incorporated and the first mayor was elected. The town continued to grow and by the mid-1800s, it had become a major trading center for the surrounding area. The town was also home to several businesses, including a flour mill, a sawmill, and a brickyard.
In the late 1800s, the town began to decline due to the decline of the river trade. The town was also affected by the Great Depression and World War II. After the war, the town began to slowly recover and by the 1970s, it had become a popular tourist destination.
Geography
Bowling Green is located in the northern part of Pike County, Missouri. It is situated on the banks of the Mississippi River, approximately 50 miles north of St. Louis. The town is surrounded by rolling hills and is located in a region known as the “Mississippi Bottomlands”. The town is located in a humid subtropical climate zone and has an average annual temperature of around 60 degrees Fahrenheit.
Economy
The economy of Bowling Green is largely based on agriculture and tourism. The town is home to several farms that produce corn, soybeans, and other crops. The town is also home to several wineries and vineyards, which attract tourists from all over the region.
In addition to agriculture and tourism, the town is also home to several small businesses, including restaurants, retail stores, and service providers. The town is also home to a small manufacturing sector, which produces a variety of products, including furniture, clothing, and electronics.
Demographics
As of the 2010 census, the population of Bowling Green was 3,039. The town has a population density of approximately 1,000 people per square mile. The median age of the population is 43.7 years, and the median household income is $41,944. The town is predominantly white, with approximately 95% of the population identifying as white. The town also has a small Hispanic population, with approximately 4% of the population identifying as Hispanic or Latino.
Common Questions
What is Per Capita Income in Bowling Green?
Per Capita income in Bowling Green is $21,033.
What is the Median Family Income in Bowling Green?
Median Family Income in Bowling Green is $60,431.
What is the Median Household income in Bowling Green?
Median Household Income in Bowling Green is $44,338.
What is Income or Wage Gap in Bowling Green?
Income or Wage Gap in Bowling Green is 21.1%.
Women in Bowling Green earn 78.9 cents for every dollar earned by a man.
What is Inequality or Gini Index in Bowling Green?
Inequality or Gini Index in Bowling Green is 0.42.
What is the Total Population of Bowling Green?
Total Population of Bowling Green is 4,149.
What is the Total Male Population of Bowling Green?
Total Male Population of Bowling Green is 2,439.
What is the Total Female Population of Bowling Green?
Total Female Population of Bowling Green is 1,710.
What is the Ratio of Males per 100 Females in Bowling Green?
There are 142.63 Males per 100 Females in Bowling Green.
What is the Ratio of Females per 100 Males in Bowling Green?
There are 70.11 Females per 100 Males in Bowling Green.
What is the Median Population Age in Bowling Green?
Median Population Age in Bowling Green is 36.1 Years.
What is the Average Family Size in Bowling Green
Average Family Size in Bowling Green is 3.0 People.
What is the Average Household Size in Bowling Green
Average Household Size in Bowling Green is 2.3 People.
How Large is the Labor Force in Bowling Green?
There are 1,464 People in the Labor Forcein in Bowling Green.
What is the Percentage of People in the Labor Force in Bowling Green?
43.2% of People are in the Labor Force in Bowling Green.
What is the Unemployment Rate in Bowling Green?
Unemployment Rate in Bowling Green is 8.1%.