Lake Bryan, TX Map & Demographics
Lake Bryan Map
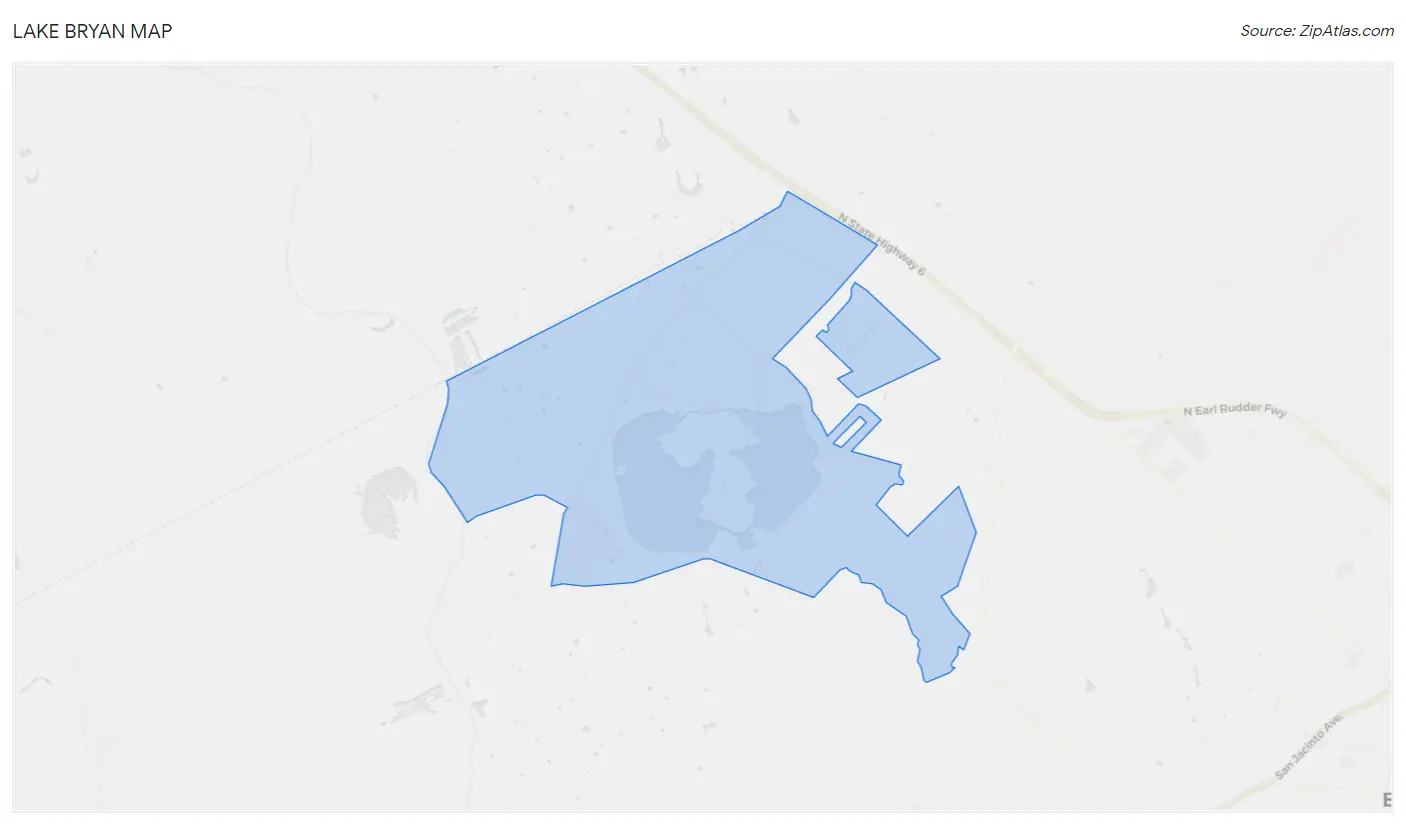
Lake Bryan Overview
$23,314
PER CAPITA INCOME
$72,453
AVG FAMILY INCOME
$71,840
AVG HOUSEHOLD INCOME
10.3%
WAGE / INCOME GAP [ % ]
89.7¢/ $1
WAGE / INCOME GAP [ $ ]
0.40
INEQUALITY / GINI INDEX
1,438
TOTAL POPULATION
653
MALE POPULATION
785
FEMALE POPULATION
83.18
MALES / 100 FEMALES
120.21
FEMALES / 100 MALES
30.5
MEDIAN AGE
3.8
AVG FAMILY SIZE
2.9
AVG HOUSEHOLD SIZE
660
LABOR FORCE [ PEOPLE ]
68.5%
PERCENT IN LABOR FORCE
7.7%
UNEMPLOYMENT RATE
Income in Lake Bryan
Income Overview in Lake Bryan
Per Capita Income in Lake Bryan is $23,314, while median incomes of families and households are $72,453 and $71,840 respectively.
| Characteristic | Number | Measure |
| Per Capita Income | 1,438 | $23,314 |
| Median Family Income | 288 | $72,453 |
| Mean Family Income | 288 | $88,313 |
| Median Household Income | 498 | $71,840 |
| Mean Household Income | 498 | $65,574 |
| Income Deficit | 288 | $0 |
| Wage / Income Gap (%) | 1,438 | 10.31% |
| Wage / Income Gap ($) | 1,438 | 89.69¢ per $1 |
| Gini / Inequality Index | 1,438 | 0.40 |
Earnings by Sex in Lake Bryan
Average Earnings in Lake Bryan are $40,031, $43,107 for men and $38,661 for women, a difference of 10.3%.
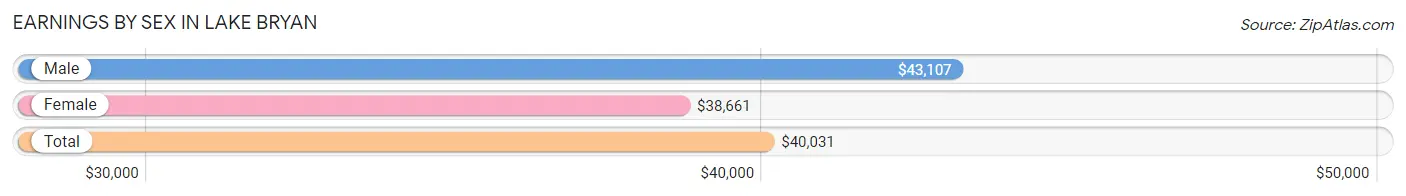
| Sex | Number | Average Earnings |
| Male | 365 (54.0%) | $43,107 |
| Female | 311 (46.0%) | $38,661 |
| Total | 676 (100.0%) | $40,031 |
Earnings by Sex by Income Bracket in Lake Bryan
The most common earnings brackets in Lake Bryan are $35,000 to $39,999 for men (84 | 23.0%) and $40,000 to $44,999 for women (80 | 25.7%).
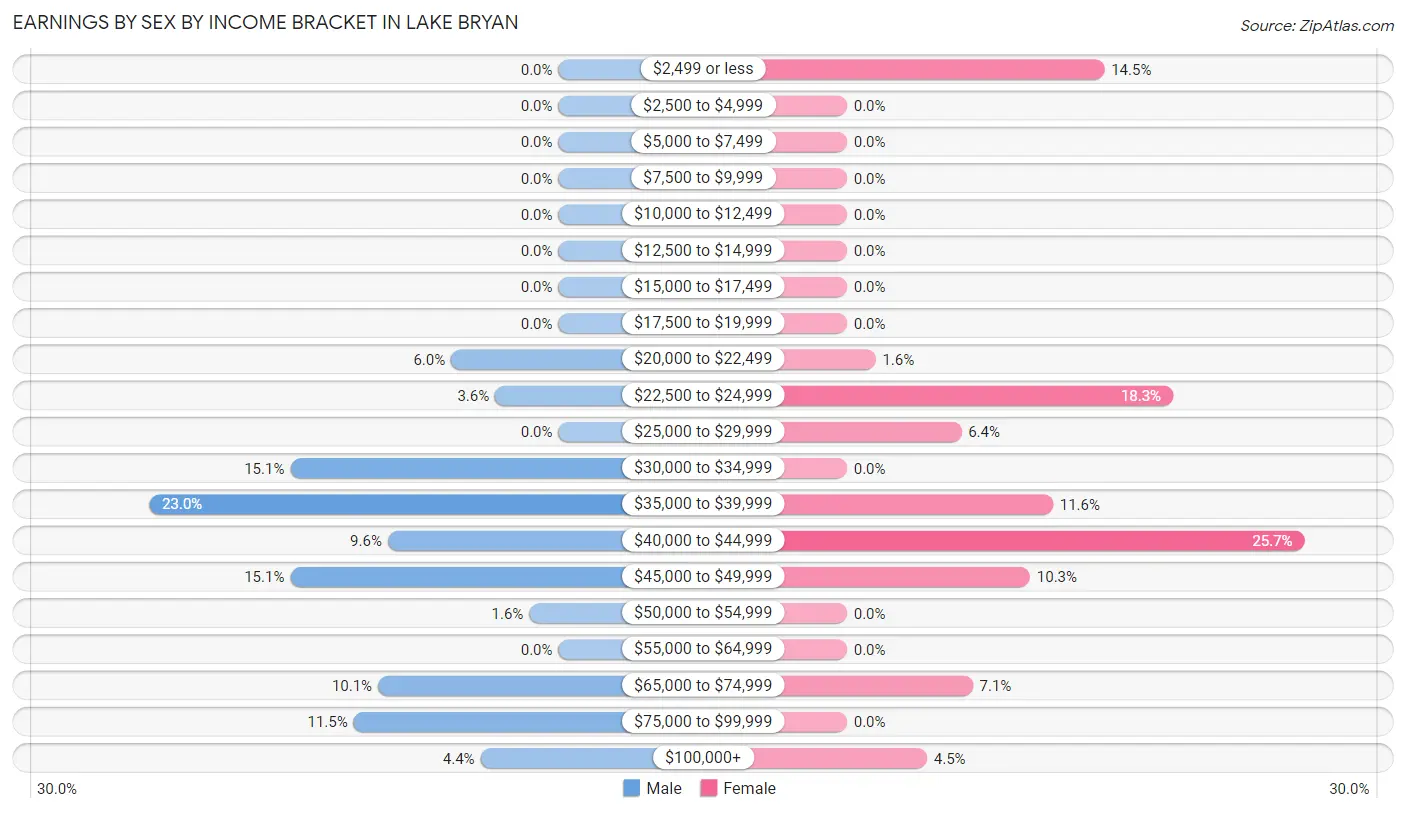
| Income | Male | Female |
| $2,499 or less | 0 (0.0%) | 45 (14.5%) |
| $2,500 to $4,999 | 0 (0.0%) | 0 (0.0%) |
| $5,000 to $7,499 | 0 (0.0%) | 0 (0.0%) |
| $7,500 to $9,999 | 0 (0.0%) | 0 (0.0%) |
| $10,000 to $12,499 | 0 (0.0%) | 0 (0.0%) |
| $12,500 to $14,999 | 0 (0.0%) | 0 (0.0%) |
| $15,000 to $17,499 | 0 (0.0%) | 0 (0.0%) |
| $17,500 to $19,999 | 0 (0.0%) | 0 (0.0%) |
| $20,000 to $22,499 | 22 (6.0%) | 5 (1.6%) |
| $22,500 to $24,999 | 13 (3.6%) | 57 (18.3%) |
| $25,000 to $29,999 | 0 (0.0%) | 20 (6.4%) |
| $30,000 to $34,999 | 55 (15.1%) | 0 (0.0%) |
| $35,000 to $39,999 | 84 (23.0%) | 36 (11.6%) |
| $40,000 to $44,999 | 35 (9.6%) | 80 (25.7%) |
| $45,000 to $49,999 | 55 (15.1%) | 32 (10.3%) |
| $50,000 to $54,999 | 6 (1.6%) | 0 (0.0%) |
| $55,000 to $64,999 | 0 (0.0%) | 0 (0.0%) |
| $65,000 to $74,999 | 37 (10.1%) | 22 (7.1%) |
| $75,000 to $99,999 | 42 (11.5%) | 0 (0.0%) |
| $100,000+ | 16 (4.4%) | 14 (4.5%) |
| Total | 365 (100.0%) | 311 (100.0%) |
Earnings by Sex by Educational Attainment in Lake Bryan
Average earnings in Lake Bryan are $43,286 for men and $40,984 for women, a difference of 5.3%. Men with an educational attainment of bachelor's degree enjoy the highest average annual earnings of $95,962, while those with less than high school education earn the least with $39,104. Women with an educational attainment of high school diploma earn the most with the average annual earnings of $42,150, while those with college or associate's degree education have the smallest earnings of $40,591.
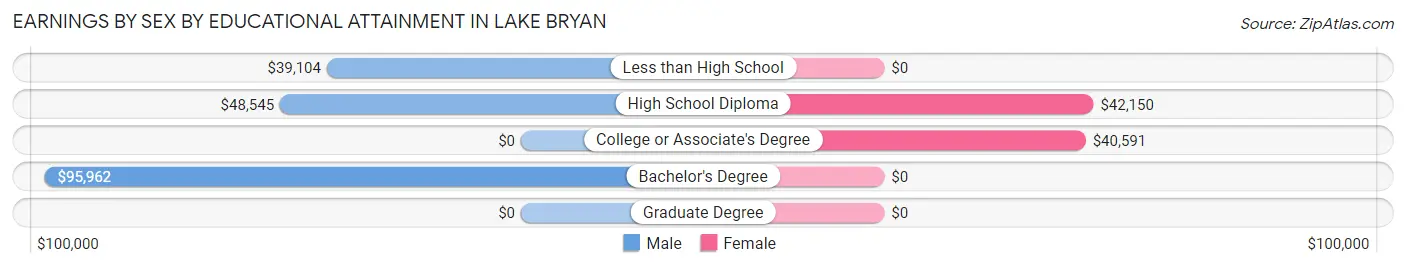
| Educational Attainment | Male Income | Female Income |
| Less than High School | $39,104 | $0 |
| High School Diploma | $48,545 | $42,150 |
| College or Associate's Degree | - | - |
| Bachelor's Degree | $95,962 | $0 |
| Graduate Degree | - | - |
| Total | $43,286 | $40,984 |
Family Income in Lake Bryan
Family Income Brackets in Lake Bryan
According to the Lake Bryan family income data, there are 121 families falling into the $50,000 to $74,999 income range, which is the most common income bracket and makes up 42.0% of all families.
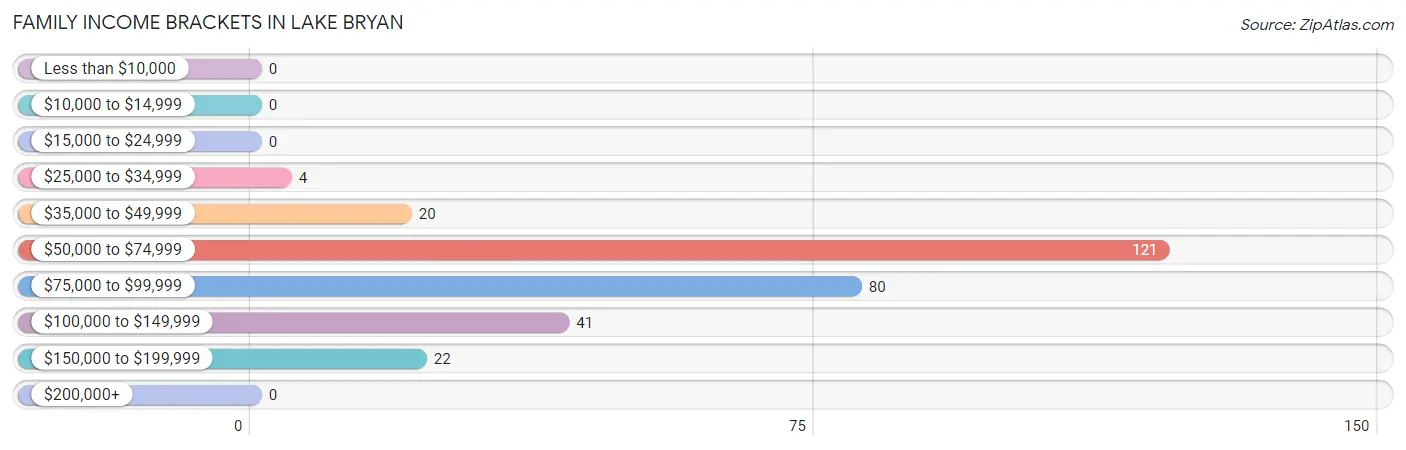
| Income Bracket | # Families | % Families |
| Less than $10,000 | 0 | 0.0% |
| $10,000 to $14,999 | 0 | 0.0% |
| $15,000 to $24,999 | 0 | 0.0% |
| $25,000 to $34,999 | 4 | 1.4% |
| $35,000 to $49,999 | 20 | 6.9% |
| $50,000 to $74,999 | 121 | 42.0% |
| $75,000 to $99,999 | 80 | 27.8% |
| $100,000 to $149,999 | 41 | 14.2% |
| $150,000 to $199,999 | 22 | 7.6% |
| $200,000+ | 0 | 0.0% |
Family Income by Famaliy Size in Lake Bryan
5-person families (93 | 32.3%) account for the highest median family income in Lake Bryan with $72,193 per family, while 5-person families (93 | 32.3%) have the highest median income of $14,439 per family member.
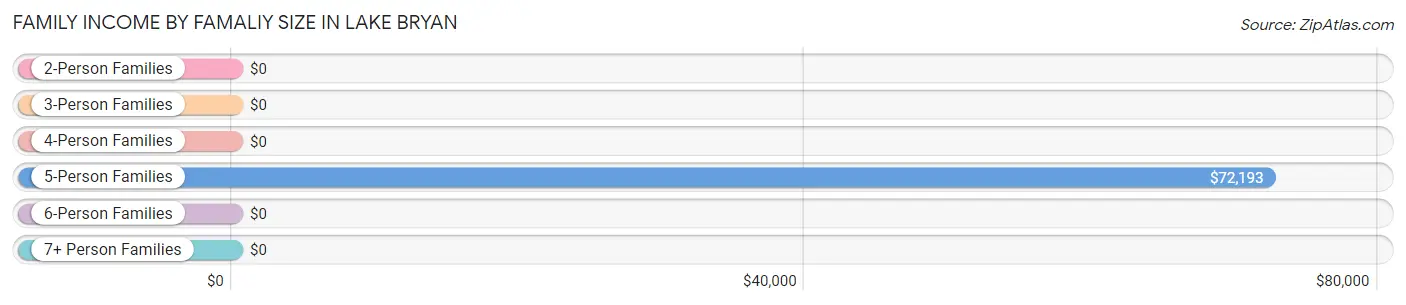
| Income Bracket | # Families | Median Income |
| 2-Person Families | 65 (22.6%) | $0 |
| 3-Person Families | 84 (29.2%) | $0 |
| 4-Person Families | 40 (13.9%) | $0 |
| 5-Person Families | 93 (32.3%) | $72,193 |
| 6-Person Families | 0 (0.0%) | $0 |
| 7+ Person Families | 6 (2.1%) | $0 |
| Total | 288 (100.0%) | $72,453 |
Family Income by Number of Earners in Lake Bryan

| Number of Earners | # Families | Median Income |
| No Earners | 9 (3.1%) | $0 |
| 1 Earner | 68 (23.6%) | $54,259 |
| 2 Earners | 180 (62.5%) | $72,311 |
| 3+ Earners | 31 (10.8%) | $0 |
| Total | 288 (100.0%) | $72,453 |
Household Income in Lake Bryan
Household Income Brackets in Lake Bryan
With 172 households falling in the category, the $75,000 to $99,999 income range is the most frequent in Lake Bryan, accounting for 34.5% of all households.
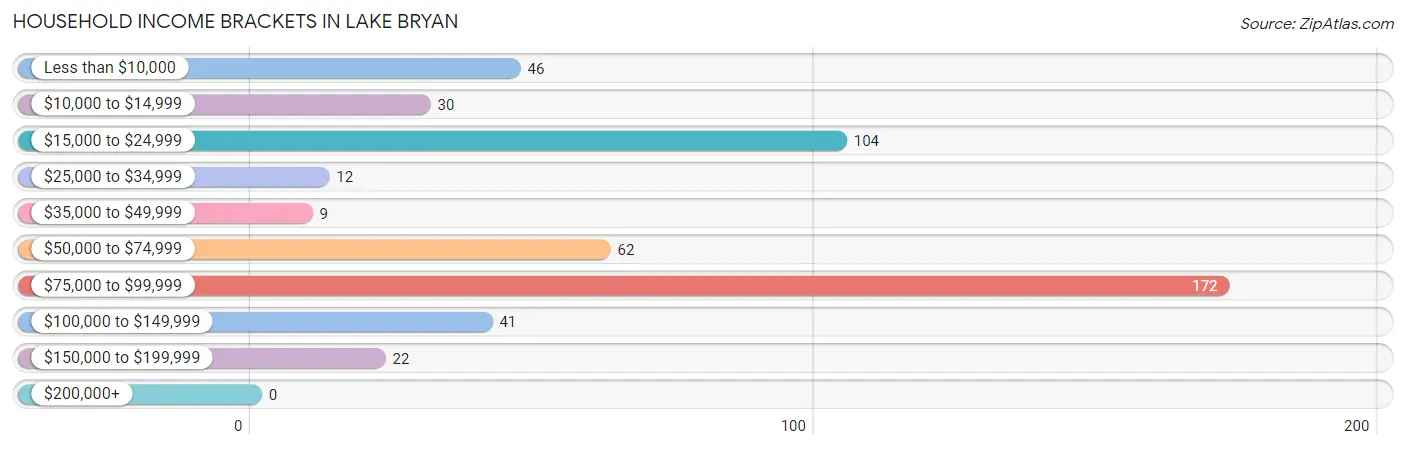
| Income Bracket | # Households | % Households |
| Less than $10,000 | 46 | 9.2% |
| $10,000 to $14,999 | 30 | 6.0% |
| $15,000 to $24,999 | 104 | 20.9% |
| $25,000 to $34,999 | 12 | 2.4% |
| $35,000 to $49,999 | 9 | 1.8% |
| $50,000 to $74,999 | 62 | 12.4% |
| $75,000 to $99,999 | 172 | 34.5% |
| $100,000 to $149,999 | 41 | 8.2% |
| $150,000 to $199,999 | 22 | 4.4% |
| $200,000+ | 0 | 0.0% |
Household Income by Householder Age in Lake Bryan
The median household income in Lake Bryan is $71,840, with the highest median household income of $87,781 found in the 25 to 44 years age bracket for the primary householder. A total of 187 households (37.6%) fall into this category.
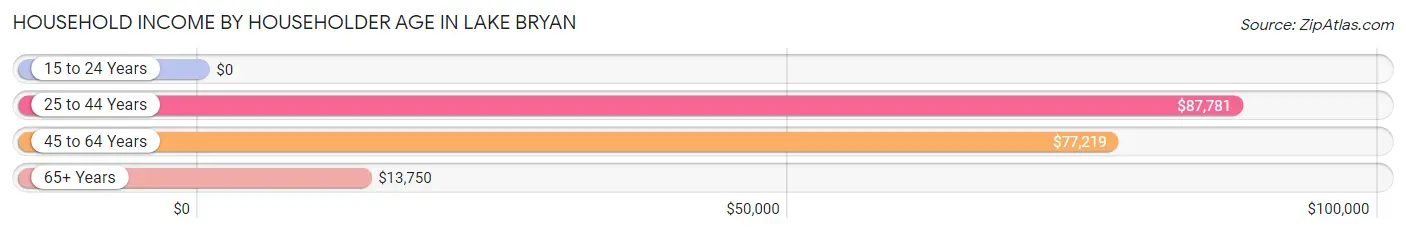
| Income Bracket | # Households | Median Income |
| 15 to 24 Years | 0 (0.0%) | $0 |
| 25 to 44 Years | 187 (37.6%) | $87,781 |
| 45 to 64 Years | 159 (31.9%) | $77,219 |
| 65+ Years | 152 (30.5%) | $13,750 |
| Total | 498 (100.0%) | $71,840 |
Poverty in Lake Bryan
Income Below Poverty by Sex and Age in Lake Bryan
With 14.5% poverty level for males and 2.2% for females among the residents of Lake Bryan, 65 to 74 year old males and 18 to 24 year old females are the most vulnerable to poverty, with 65 males (83.3%) and 17 females (16.4%) in their respective age groups living below the poverty level.
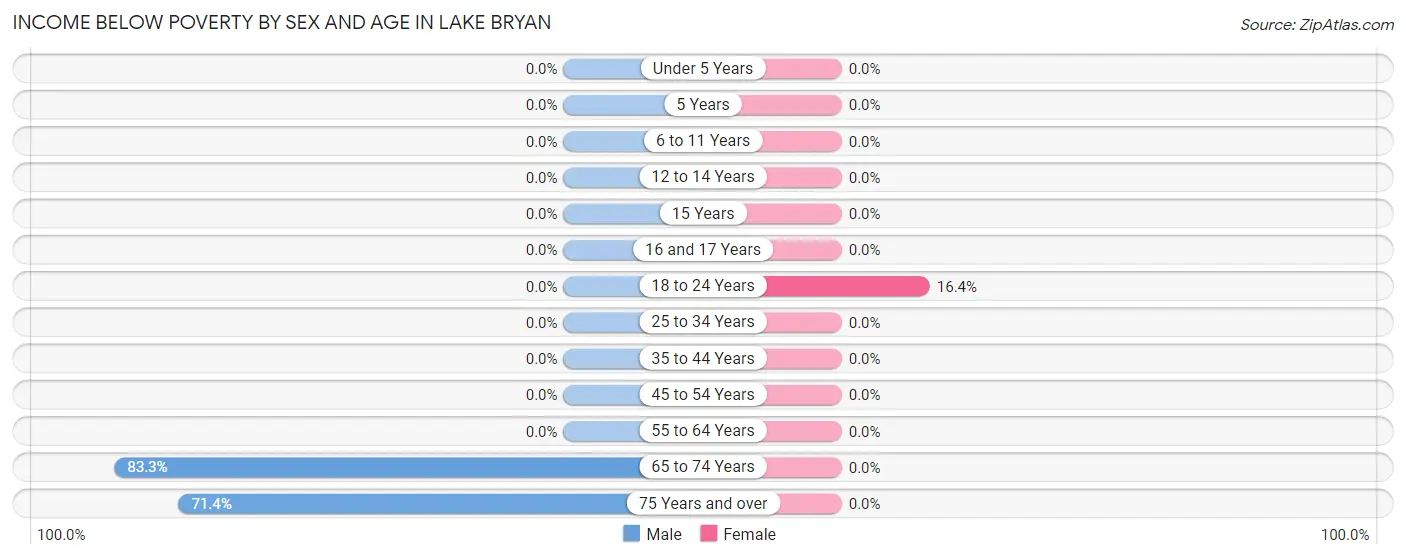
| Age Bracket | Male | Female |
| Under 5 Years | 0 (0.0%) | 0 (0.0%) |
| 5 Years | 0 (0.0%) | 0 (0.0%) |
| 6 to 11 Years | 0 (0.0%) | 0 (0.0%) |
| 12 to 14 Years | 0 (0.0%) | 0 (0.0%) |
| 15 Years | 0 (0.0%) | 0 (0.0%) |
| 16 and 17 Years | 0 (0.0%) | 0 (0.0%) |
| 18 to 24 Years | 0 (0.0%) | 17 (16.4%) |
| 25 to 34 Years | 0 (0.0%) | 0 (0.0%) |
| 35 to 44 Years | 0 (0.0%) | 0 (0.0%) |
| 45 to 54 Years | 0 (0.0%) | 0 (0.0%) |
| 55 to 64 Years | 0 (0.0%) | 0 (0.0%) |
| 65 to 74 Years | 65 (83.3%) | 0 (0.0%) |
| 75 Years and over | 30 (71.4%) | 0 (0.0%) |
| Total | 95 (14.5%) | 17 (2.2%) |
Income Above Poverty by Sex and Age in Lake Bryan
According to the poverty statistics in Lake Bryan, males aged 6 to 11 years and females aged under 5 years are the age groups that are most secure financially, with 100.0% of males and 100.0% of females in these age groups living above the poverty line.
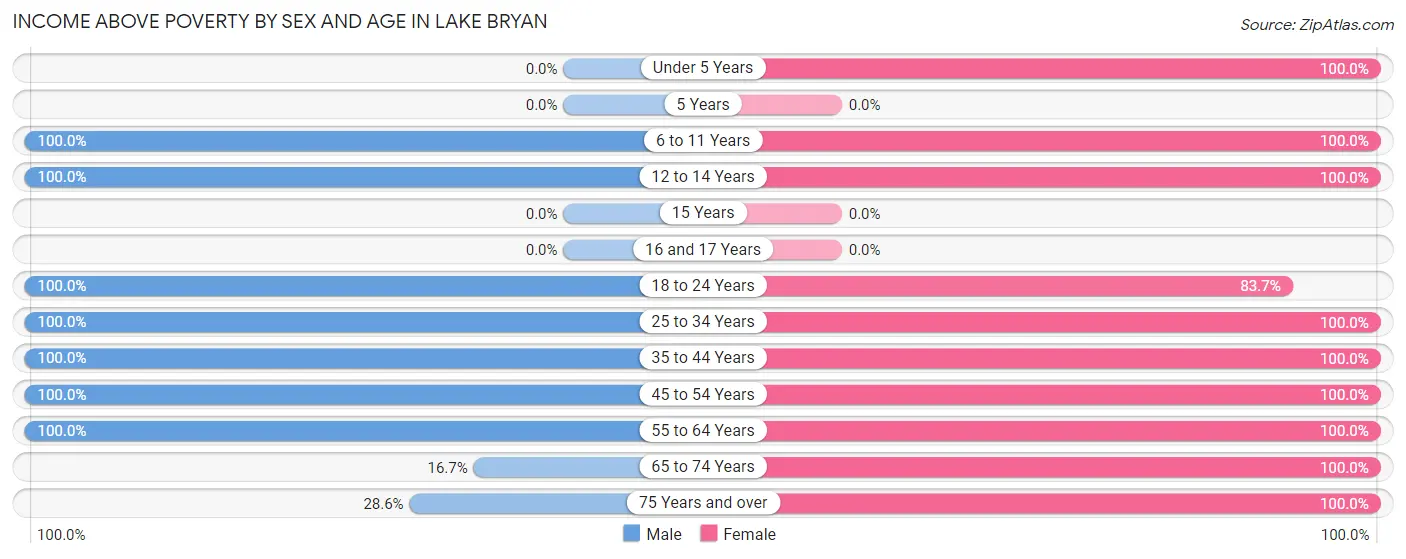
| Age Bracket | Male | Female |
| Under 5 Years | 0 (0.0%) | 155 (100.0%) |
| 5 Years | 0 (0.0%) | 0 (0.0%) |
| 6 to 11 Years | 116 (100.0%) | 154 (100.0%) |
| 12 to 14 Years | 22 (100.0%) | 27 (100.0%) |
| 15 Years | 0 (0.0%) | 0 (0.0%) |
| 16 and 17 Years | 0 (0.0%) | 0 (0.0%) |
| 18 to 24 Years | 24 (100.0%) | 87 (83.7%) |
| 25 to 34 Years | 128 (100.0%) | 54 (100.0%) |
| 35 to 44 Years | 89 (100.0%) | 82 (100.0%) |
| 45 to 54 Years | 72 (100.0%) | 85 (100.0%) |
| 55 to 64 Years | 82 (100.0%) | 60 (100.0%) |
| 65 to 74 Years | 13 (16.7%) | 40 (100.0%) |
| 75 Years and over | 12 (28.6%) | 24 (100.0%) |
| Total | 558 (85.5%) | 768 (97.8%) |
Income Below Poverty Among Married-Couple Families in Lake Bryan
| Children | Above Poverty | Below Poverty |
| No Children | 70 (100.0%) | 0 (0.0%) |
| 1 or 2 Children | 46 (100.0%) | 0 (0.0%) |
| 3 or 4 Children | 40 (100.0%) | 0 (0.0%) |
| 5 or more Children | 0 (0.0%) | 0 (0.0%) |
| Total | 156 (100.0%) | 0 (0.0%) |
Income Below Poverty Among Single-Parent Households in Lake Bryan
| Children | Single Father | Single Mother |
| No Children | 0 (0.0%) | 0 (0.0%) |
| 1 or 2 Children | 0 (0.0%) | 0 (0.0%) |
| 3 or 4 Children | 0 (0.0%) | 0 (0.0%) |
| 5 or more Children | 0 (0.0%) | 0 (0.0%) |
| Total | 0 (0.0%) | 0 (0.0%) |
Income Below Poverty Among Married-Couple vs Single-Parent Households in Lake Bryan
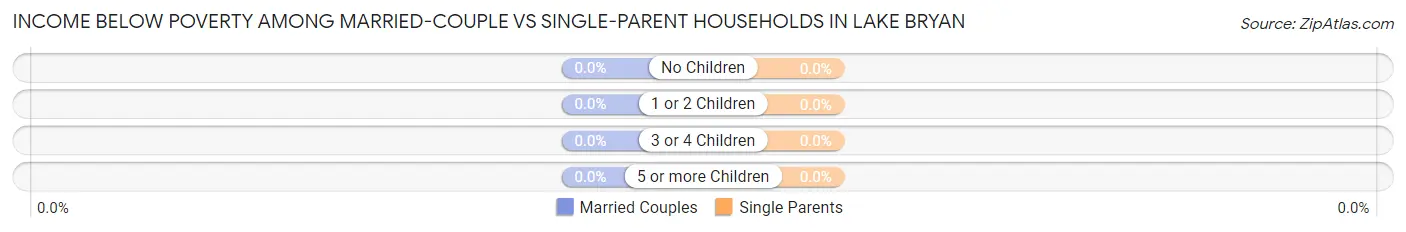
| Children | Married-Couple Families | Single-Parent Households |
| No Children | 0 (0.0%) | 0 (0.0%) |
| 1 or 2 Children | 0 (0.0%) | 0 (0.0%) |
| 3 or 4 Children | 0 (0.0%) | 0 (0.0%) |
| 5 or more Children | 0 (0.0%) | 0 (0.0%) |
| Total | 0 (0.0%) | 0 (0.0%) |
Race in Lake Bryan
The most populous races in Lake Bryan are Hispanic or Latino (778 | 54.1%), Two or more Races (561 | 39.0%), and White / Caucasian (525 | 36.5%).
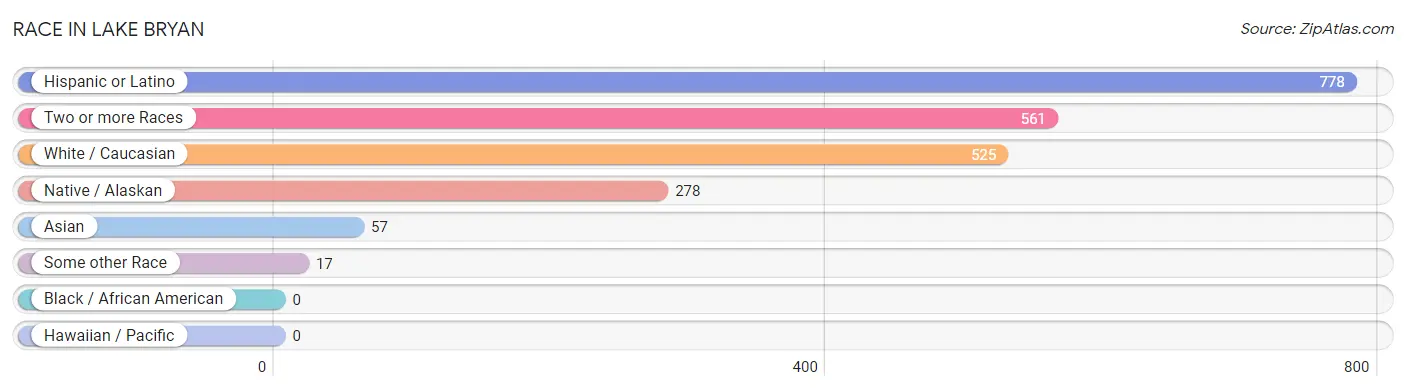
| Race | # Population | % Population |
| Asian | 57 | 4.0% |
| Black / African American | 0 | 0.0% |
| Hawaiian / Pacific | 0 | 0.0% |
| Hispanic or Latino | 778 | 54.1% |
| Native / Alaskan | 278 | 19.3% |
| White / Caucasian | 525 | 36.5% |
| Two or more Races | 561 | 39.0% |
| Some other Race | 17 | 1.2% |
| Total | 1,438 | 100.0% |
Ancestry in Lake Bryan
The most populous ancestries reported in Lake Bryan are Mexican (761 | 52.9%), Mexican American Indian (225 | 15.7%), Central American Indian (223 | 15.5%), Polish (141 | 9.8%), and European (94 | 6.5%), together accounting for 100.4% of all Lake Bryan residents.
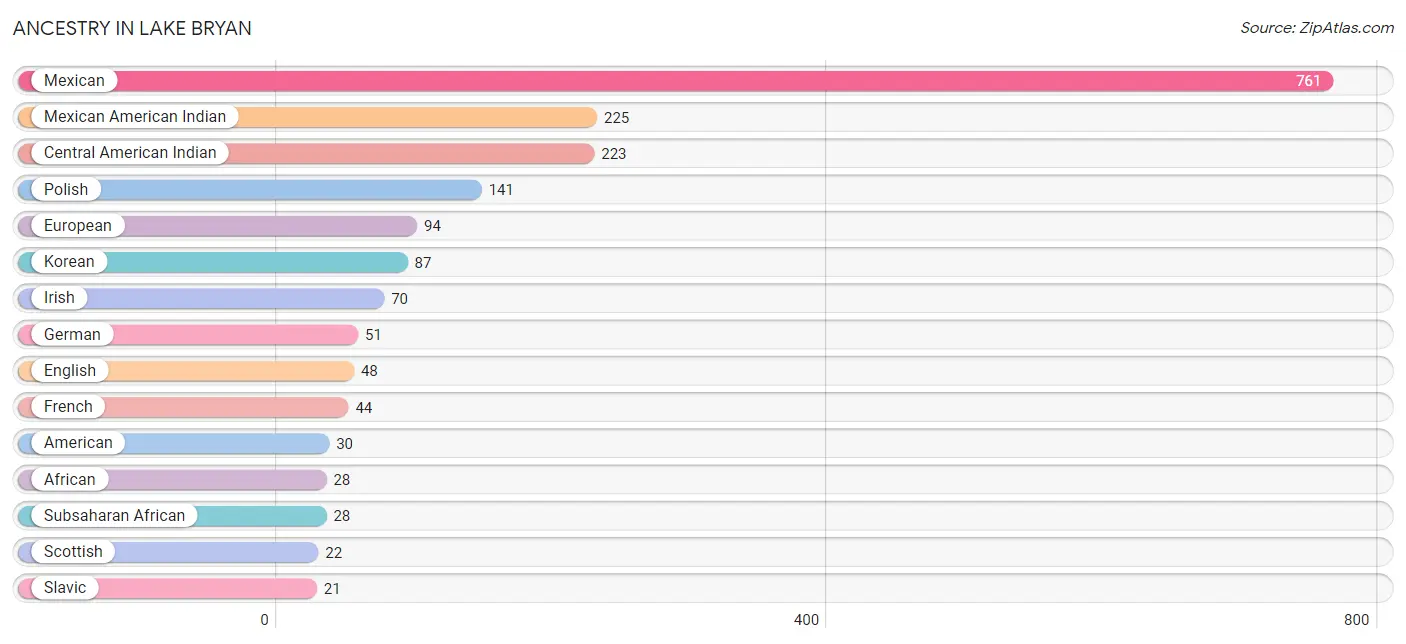
| Ancestry | # Population | % Population |
| African | 28 | 1.9% |
| Alaska Native | 11 | 0.8% |
| American | 30 | 2.1% |
| Austrian | 15 | 1.0% |
| British | 16 | 1.1% |
| Central American Indian | 223 | 15.5% |
| Cherokee | 5 | 0.4% |
| English | 48 | 3.3% |
| European | 94 | 6.5% |
| French | 44 | 3.1% |
| German | 51 | 3.5% |
| Irish | 70 | 4.9% |
| Korean | 87 | 6.0% |
| Mexican | 761 | 52.9% |
| Mexican American Indian | 225 | 15.7% |
| Polish | 141 | 9.8% |
| Pueblo | 9 | 0.6% |
| Scotch-Irish | 5 | 0.4% |
| Scottish | 22 | 1.5% |
| Slavic | 21 | 1.5% |
| Subsaharan African | 28 | 1.9% | View All 21 Rows |
Immigrants in Lake Bryan
The most numerous immigrant groups reported in Lake Bryan came from Central America (198 | 13.8%), Latin America (198 | 13.8%), Mexico (198 | 13.8%), Asia (57 | 4.0%), and Philippines (57 | 4.0%), together accounting for 49.2% of all Lake Bryan residents.
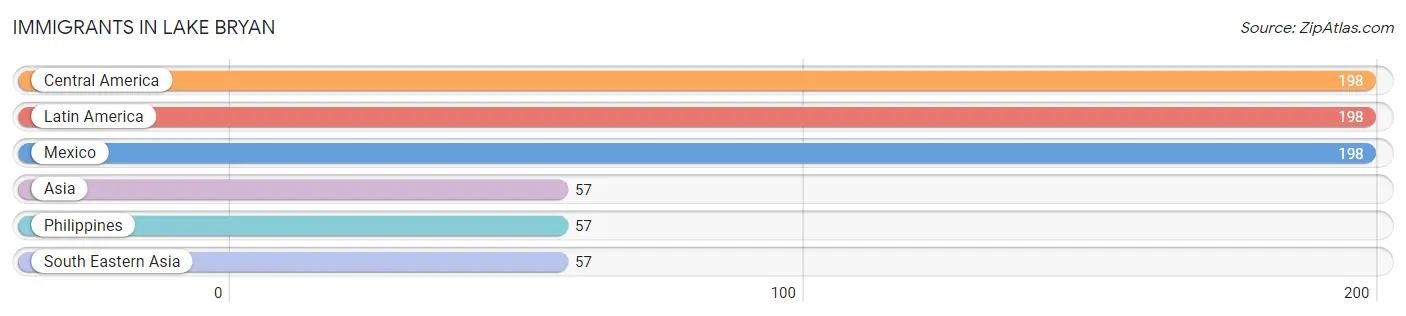
| Immigration Origin | # Population | % Population |
| Asia | 57 | 4.0% |
| Central America | 198 | 13.8% |
| Latin America | 198 | 13.8% |
| Mexico | 198 | 13.8% |
| Philippines | 57 | 4.0% |
| South Eastern Asia | 57 | 4.0% | View All 6 Rows |
Sex and Age in Lake Bryan
Sex and Age in Lake Bryan
The most populous age groups in Lake Bryan are 5 to 9 Years (116 | 17.8%) for men and 10 to 14 Years (159 | 20.3%) for women.
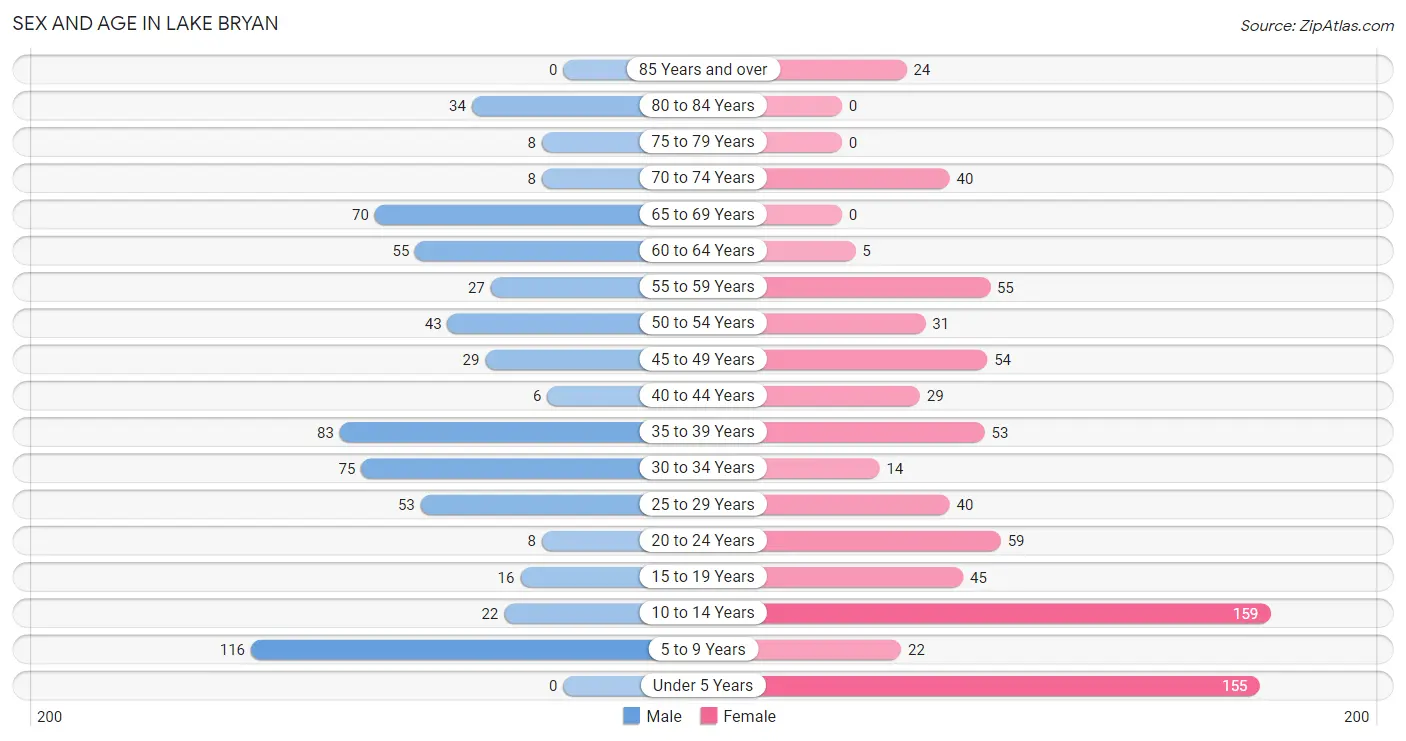
| Age Bracket | Male | Female |
| Under 5 Years | 0 (0.0%) | 155 (19.8%) |
| 5 to 9 Years | 116 (17.8%) | 22 (2.8%) |
| 10 to 14 Years | 22 (3.4%) | 159 (20.3%) |
| 15 to 19 Years | 16 (2.5%) | 45 (5.7%) |
| 20 to 24 Years | 8 (1.2%) | 59 (7.5%) |
| 25 to 29 Years | 53 (8.1%) | 40 (5.1%) |
| 30 to 34 Years | 75 (11.5%) | 14 (1.8%) |
| 35 to 39 Years | 83 (12.7%) | 53 (6.8%) |
| 40 to 44 Years | 6 (0.9%) | 29 (3.7%) |
| 45 to 49 Years | 29 (4.4%) | 54 (6.9%) |
| 50 to 54 Years | 43 (6.6%) | 31 (4.0%) |
| 55 to 59 Years | 27 (4.1%) | 55 (7.0%) |
| 60 to 64 Years | 55 (8.4%) | 5 (0.6%) |
| 65 to 69 Years | 70 (10.7%) | 0 (0.0%) |
| 70 to 74 Years | 8 (1.2%) | 40 (5.1%) |
| 75 to 79 Years | 8 (1.2%) | 0 (0.0%) |
| 80 to 84 Years | 34 (5.2%) | 0 (0.0%) |
| 85 Years and over | 0 (0.0%) | 24 (3.1%) |
| Total | 653 (100.0%) | 785 (100.0%) |
Families and Households in Lake Bryan
Median Family Size in Lake Bryan
The median family size in Lake Bryan is 3.84 persons per family, with single male/father families (91 | 31.6%) accounting for the largest median family size of 4.4 persons per family. On the other hand, single female/mother families (41 | 14.2%) represent the smallest median family size with 2.98 persons per family.
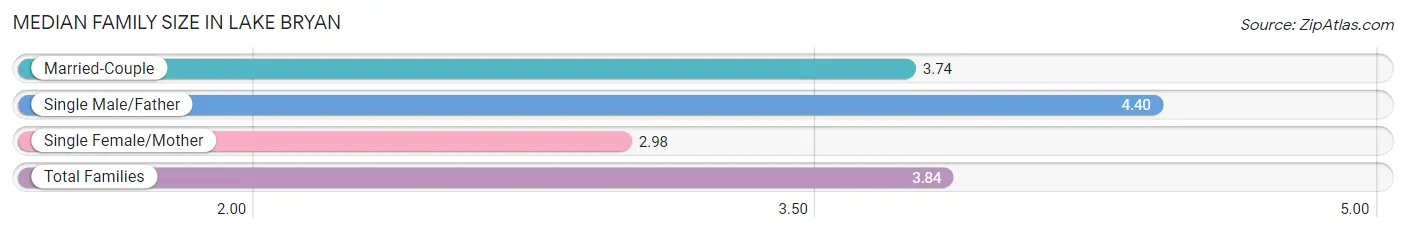
| Family Type | # Families | Family Size |
| Married-Couple | 156 (54.2%) | 3.74 |
| Single Male/Father | 91 (31.6%) | 4.40 |
| Single Female/Mother | 41 (14.2%) | 2.98 |
| Total Families | 288 (100.0%) | 3.84 |
Median Household Size in Lake Bryan
The median household size in Lake Bryan is 2.89 persons per household, with single male/father households (91 | 18.3%) accounting for the largest median household size of 4.96 persons per household. non-family households (210 | 42.2%) represent the smallest median household size with 1.17 persons per household.
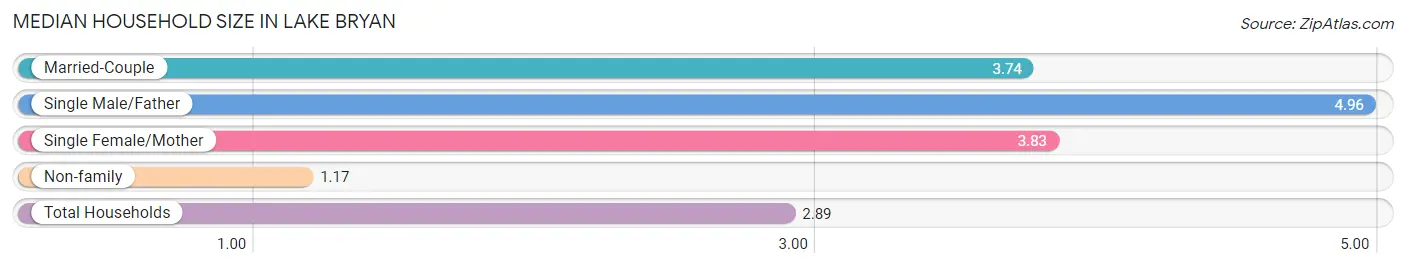
| Household Type | # Households | Household Size |
| Married-Couple | 156 (31.3%) | 3.74 |
| Single Male/Father | 91 (18.3%) | 4.96 |
| Single Female/Mother | 41 (8.2%) | 3.83 |
| Non-family | 210 (42.2%) | 1.17 |
| Total Households | 498 (100.0%) | 2.89 |
Household Size by Marriage Status in Lake Bryan
Out of a total of 498 households in Lake Bryan, 288 (57.8%) are family households, while 210 (42.2%) are nonfamily households. The most numerous type of family households are 4-person households, comprising 99, and the most common type of nonfamily households are 1-person households, comprising 170.
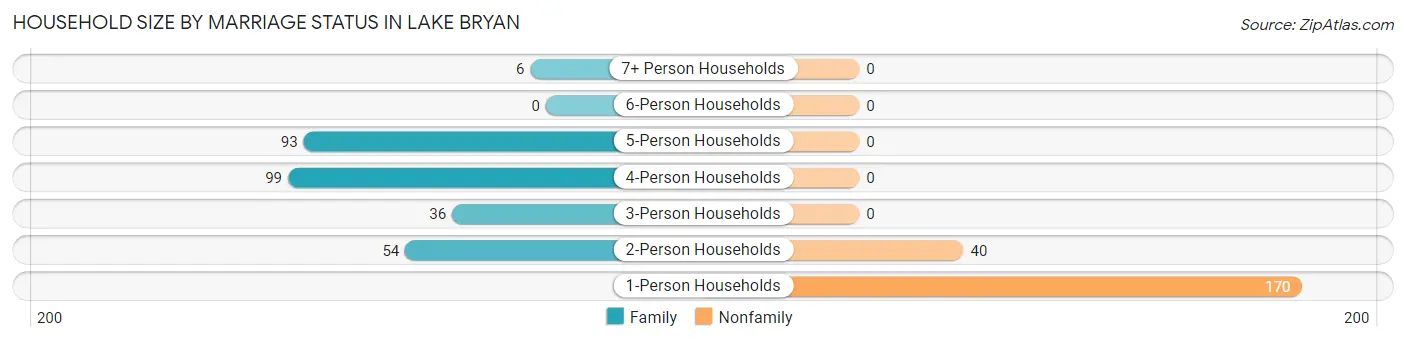
| Household Size | Family Households | Nonfamily Households |
| 1-Person Households | - | 170 (34.1%) |
| 2-Person Households | 54 (10.8%) | 40 (8.0%) |
| 3-Person Households | 36 (7.2%) | 0 (0.0%) |
| 4-Person Households | 99 (19.9%) | 0 (0.0%) |
| 5-Person Households | 93 (18.7%) | 0 (0.0%) |
| 6-Person Households | 0 (0.0%) | 0 (0.0%) |
| 7+ Person Households | 6 (1.2%) | 0 (0.0%) |
| Total | 288 (57.8%) | 210 (42.2%) |
Female Fertility in Lake Bryan
Fertility by Age in Lake Bryan
| Age Bracket | Women with Births | Births / 1,000 Women |
| 15 to 19 years | 0 (0.0%) | 0.0 |
| 20 to 34 years | 0 (0.0%) | 0.0 |
| 35 to 50 years | 0 (0.0%) | 0.0 |
| Total | 0 (0.0%) | 0.0 |
Fertility by Age by Marriage Status in Lake Bryan
| Age Bracket | Married | Unmarried |
| 15 to 19 years | 0 (0.0%) | 0 (0.0%) |
| 20 to 34 years | 0 (0.0%) | 0 (0.0%) |
| 35 to 50 years | 0 (0.0%) | 0 (0.0%) |
| Total | 0 (0.0%) | 0 (0.0%) |
Fertility by Education in Lake Bryan
| Educational Attainment | Women with Births | Births / 1,000 Women |
| Less than High School | 0 (0.0%) | 0.0 |
| High School Diploma | 0 (0.0%) | 0.0 |
| College or Associate's Degree | 0 (0.0%) | 0.0 |
| Bachelor's Degree | 0 (0.0%) | 0.0 |
| Graduate Degree | 0 (0.0%) | 0.0 |
| Total | 0 (0.0%) | 0.0 |
Fertility by Education by Marriage Status in Lake Bryan
| Educational Attainment | Married | Unmarried |
| Less than High School | 0 (0.0%) | 0 (0.0%) |
| High School Diploma | 0 (0.0%) | 0 (0.0%) |
| College or Associate's Degree | 0 (0.0%) | 0 (0.0%) |
| Bachelor's Degree | 0 (0.0%) | 0 (0.0%) |
| Graduate Degree | 0 (0.0%) | 0 (0.0%) |
| Total | 0 (0.0%) | 0 (0.0%) |
Employment Characteristics in Lake Bryan
Employment by Class of Employer in Lake Bryan
Among the 609 employed individuals in Lake Bryan, private company employees (453 | 74.4%), self-employed (not incorporated) (76 | 12.5%), and local government employees (36 | 5.9%) make up the most common classes of employment.
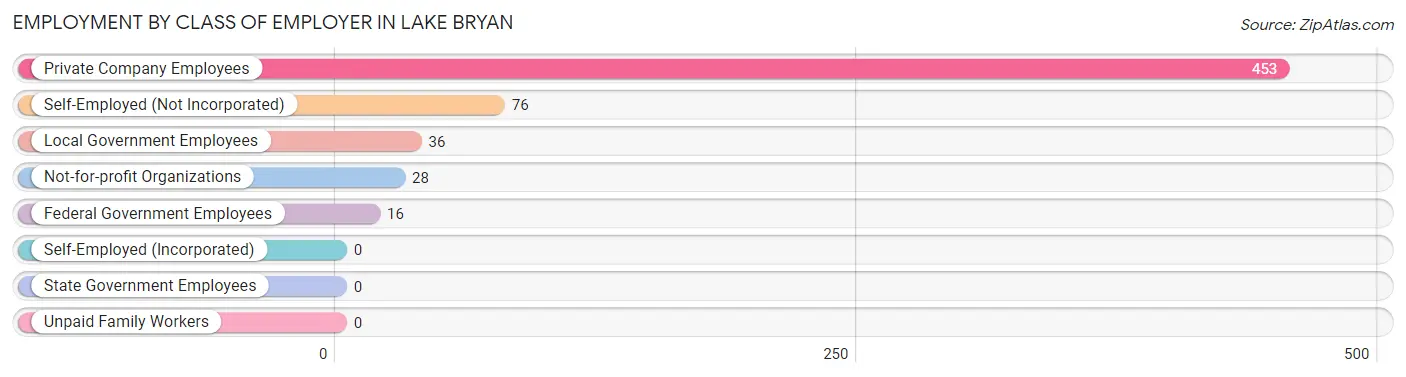
| Employer Class | # Employees | % Employees |
| Private Company Employees | 453 | 74.4% |
| Self-Employed (Incorporated) | 0 | 0.0% |
| Self-Employed (Not Incorporated) | 76 | 12.5% |
| Not-for-profit Organizations | 28 | 4.6% |
| Local Government Employees | 36 | 5.9% |
| State Government Employees | 0 | 0.0% |
| Federal Government Employees | 16 | 2.6% |
| Unpaid Family Workers | 0 | 0.0% |
| Total | 609 | 100.0% |
Employment Status by Age in Lake Bryan
According to the labor force statistics for Lake Bryan, out of the total population over 16 years of age (964), 68.5% or 660 individuals are in the labor force, with 7.7% or 51 of them unemployed. The age group with the highest labor force participation rate is 20 to 24 years, with 100.0% or 67 individuals in the labor force. Within the labor force, the 20 to 24 years age range has the highest percentage of unemployed individuals, with 38.8% or 26 of them being unemployed.
| Age Bracket | In Labor Force | Unemployed |
| 16 to 19 Years | 16 (26.2%) | 3 (18.8%) |
| 20 to 24 Years | 67 (100.0%) | 26 (38.8%) |
| 25 to 29 Years | 93 (100.0%) | 0 (0.0%) |
| 30 to 34 Years | 89 (100.0%) | 0 (0.0%) |
| 35 to 44 Years | 150 (87.7%) | 22 (14.7%) |
| 45 to 54 Years | 148 (94.3%) | 0 (0.0%) |
| 55 to 59 Years | 37 (45.1%) | 0 (0.0%) |
| 60 to 64 Years | 60 (100.0%) | 0 (0.0%) |
| 65 to 74 Years | 0 (0.0%) | 0 (0.0%) |
| 75 Years and over | 0 (0.0%) | 0 (0.0%) |
| Total | 660 (68.5%) | 51 (7.7%) |
Employment Status by Educational Attainment in Lake Bryan
According to labor force statistics for Lake Bryan, 88.5% of individuals (577) out of the total population between 25 and 64 years of age (652) are in the labor force, with 3.8% or 22 of them being unemployed. The group with the highest labor force participation rate are those with the educational attainment of less than high school, with 100.0% or 184 individuals in the labor force. Within the labor force, individuals with bachelor's degree or higher education have the highest percentage of unemployment, with 23.9% or 22 of them being unemployed.
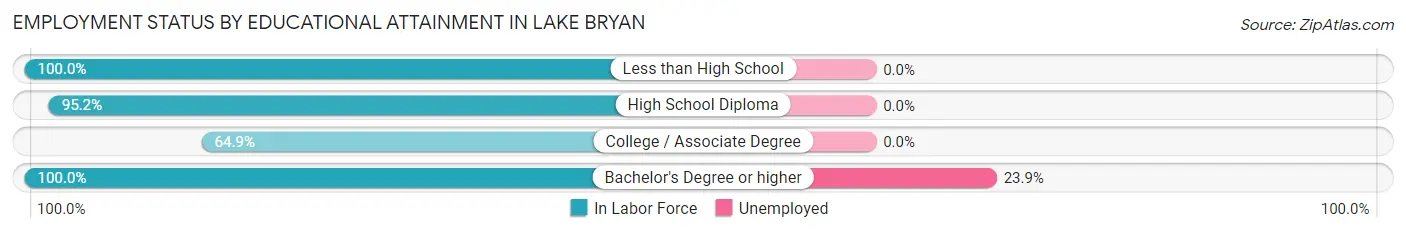
| Educational Attainment | In Labor Force | Unemployed |
| Less than High School | 184 (100.0%) | 0 (0.0%) |
| High School Diploma | 179 (95.2%) | 0 (0.0%) |
| College / Associate Degree | 122 (64.9%) | 0 (0.0%) |
| Bachelor's Degree or higher | 92 (100.0%) | 22 (23.9%) |
| Total | 577 (88.5%) | 25 (3.8%) |
Employment Occupations by Sex in Lake Bryan
Management, Business, Science and Arts Occupations
The most common Management, Business, Science and Arts occupations in Lake Bryan are Health Diagnosing & Treating (71 | 11.7%), Computers, Engineering & Science (54 | 8.9%), Business & Financial (40 | 6.6%), Life, Physical & Social Science (32 | 5.2%), and Architecture & Engineering (22 | 3.6%).
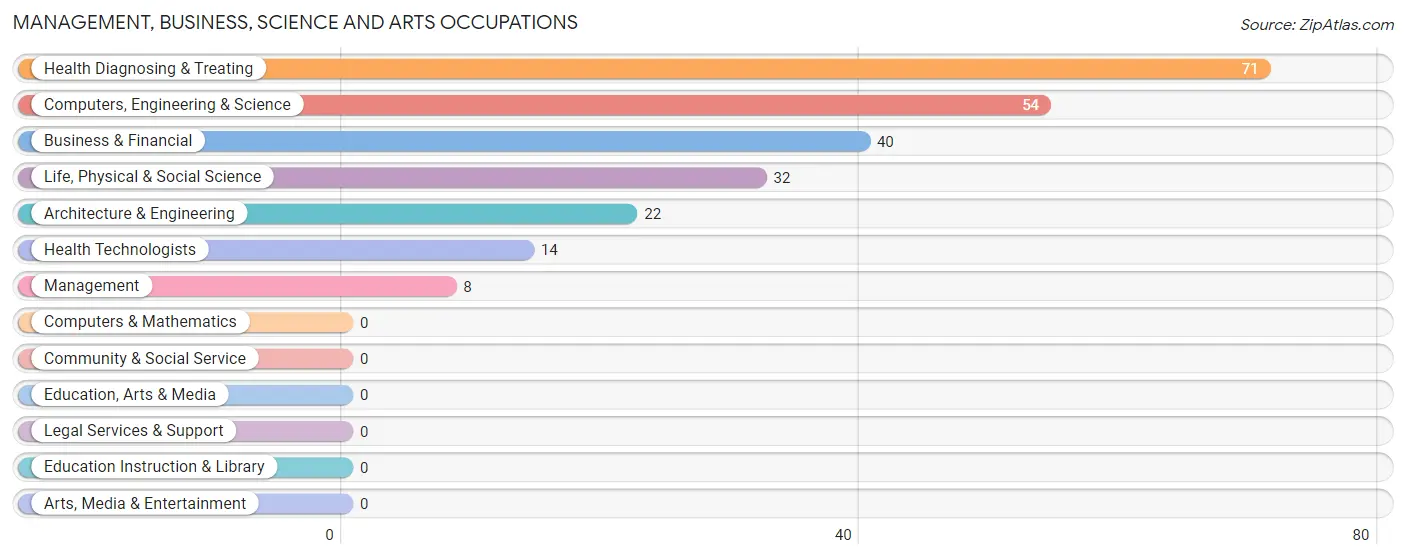
Management, Business, Science and Arts Occupations by Sex
Within the Management, Business, Science and Arts occupations in Lake Bryan, the most male-oriented occupations are Management (100.0%), Architecture & Engineering (100.0%), and Business & Financial (65.0%), while the most female-oriented occupations are Life, Physical & Social Science (100.0%), Health Diagnosing & Treating (100.0%), and Health Technologists (100.0%).
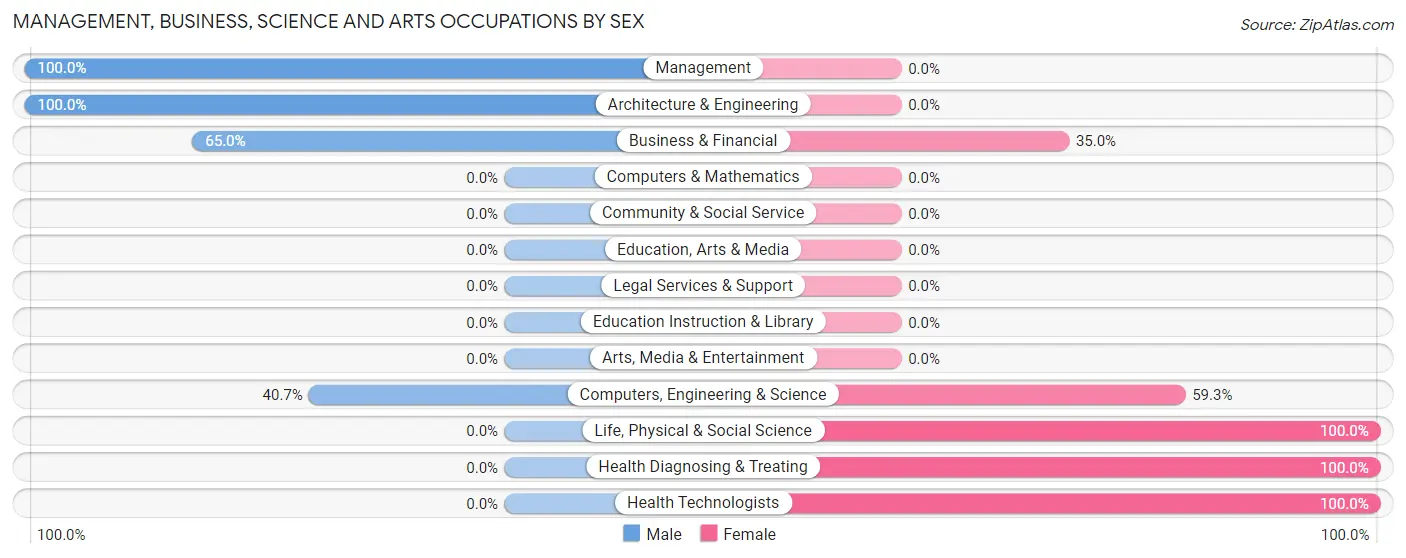
| Occupation | Male | Female |
| Management | 8 (100.0%) | 0 (0.0%) |
| Business & Financial | 26 (65.0%) | 14 (35.0%) |
| Computers, Engineering & Science | 22 (40.7%) | 32 (59.3%) |
| Computers & Mathematics | 0 (0.0%) | 0 (0.0%) |
| Architecture & Engineering | 22 (100.0%) | 0 (0.0%) |
| Life, Physical & Social Science | 0 (0.0%) | 32 (100.0%) |
| Community & Social Service | 0 (0.0%) | 0 (0.0%) |
| Education, Arts & Media | 0 (0.0%) | 0 (0.0%) |
| Legal Services & Support | 0 (0.0%) | 0 (0.0%) |
| Education Instruction & Library | 0 (0.0%) | 0 (0.0%) |
| Arts, Media & Entertainment | 0 (0.0%) | 0 (0.0%) |
| Health Diagnosing & Treating | 0 (0.0%) | 71 (100.0%) |
| Health Technologists | 0 (0.0%) | 14 (100.0%) |
| Total (Category) | 56 (32.4%) | 117 (67.6%) |
| Total (Overall) | 343 (56.3%) | 266 (43.7%) |
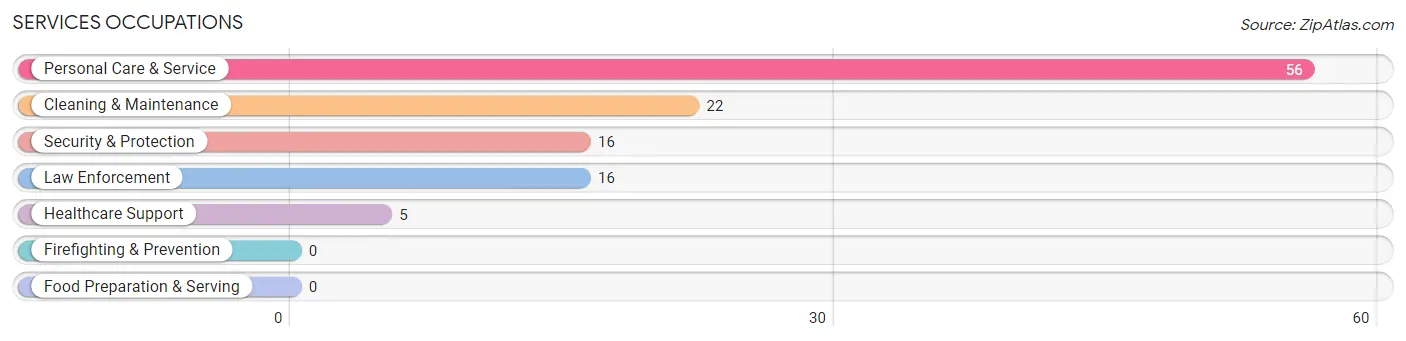
Services Occupations
The most common Services occupations in Lake Bryan are Personal Care & Service (56 | 9.2%), Cleaning & Maintenance (22 | 3.6%), Security & Protection (16 | 2.6%), Law Enforcement (16 | 2.6%), and Healthcare Support (5 | 0.8%).
Services Occupations by Sex
Within the Services occupations in Lake Bryan, the most male-oriented occupations are Security & Protection (100.0%), and Law Enforcement (100.0%), while the most female-oriented occupations are Healthcare Support (100.0%), Cleaning & Maintenance (100.0%), and Personal Care & Service (100.0%).
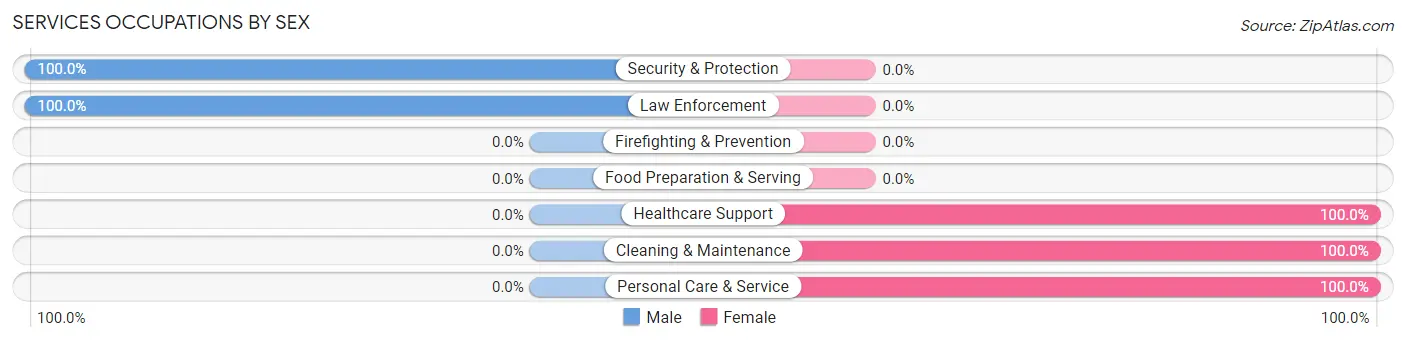
| Occupation | Male | Female |
| Healthcare Support | 0 (0.0%) | 5 (100.0%) |
| Security & Protection | 16 (100.0%) | 0 (0.0%) |
| Firefighting & Prevention | 0 (0.0%) | 0 (0.0%) |
| Law Enforcement | 16 (100.0%) | 0 (0.0%) |
| Food Preparation & Serving | 0 (0.0%) | 0 (0.0%) |
| Cleaning & Maintenance | 0 (0.0%) | 22 (100.0%) |
| Personal Care & Service | 0 (0.0%) | 56 (100.0%) |
| Total (Category) | 16 (16.2%) | 83 (83.8%) |
| Total (Overall) | 343 (56.3%) | 266 (43.7%) |
Sales and Office Occupations
The most common Sales and Office occupations in Lake Bryan are Office & Administration (55 | 9.0%), and Sales & Related (11 | 1.8%).
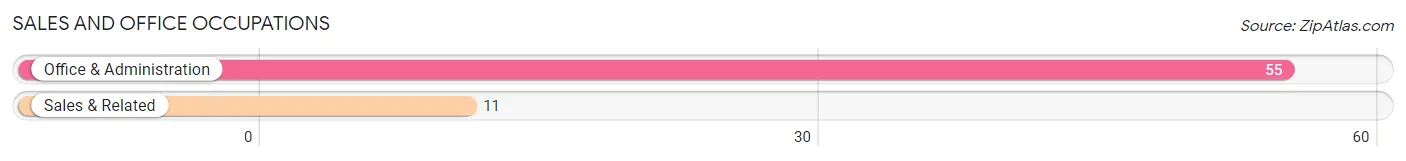
Sales and Office Occupations by Sex
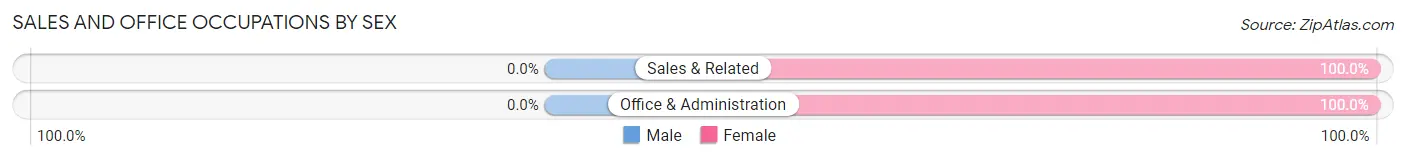
| Occupation | Male | Female |
| Sales & Related | 0 (0.0%) | 11 (100.0%) |
| Office & Administration | 0 (0.0%) | 55 (100.0%) |
| Total (Category) | 0 (0.0%) | 66 (100.0%) |
| Total (Overall) | 343 (56.3%) | 266 (43.7%) |
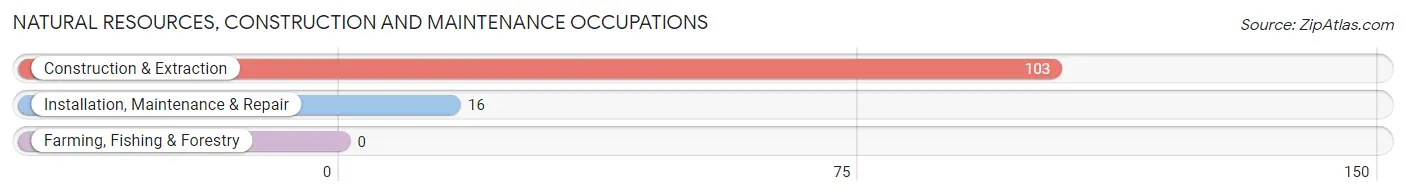
Natural Resources, Construction and Maintenance Occupations
The most common Natural Resources, Construction and Maintenance occupations in Lake Bryan are Construction & Extraction (103 | 16.9%), and Installation, Maintenance & Repair (16 | 2.6%).
Natural Resources, Construction and Maintenance Occupations by Sex
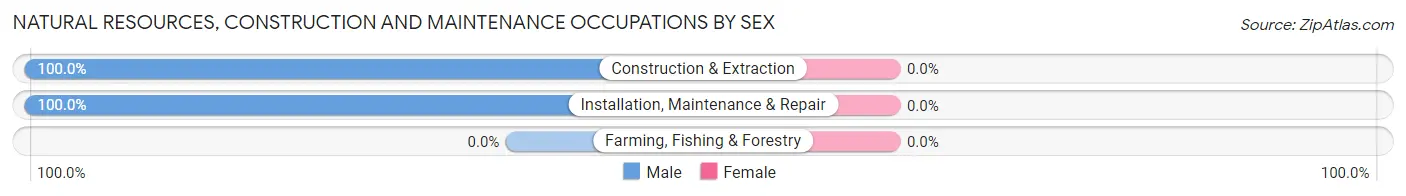
| Occupation | Male | Female |
| Farming, Fishing & Forestry | 0 (0.0%) | 0 (0.0%) |
| Construction & Extraction | 103 (100.0%) | 0 (0.0%) |
| Installation, Maintenance & Repair | 16 (100.0%) | 0 (0.0%) |
| Total (Category) | 119 (100.0%) | 0 (0.0%) |
| Total (Overall) | 343 (56.3%) | 266 (43.7%) |
Production, Transportation and Moving Occupations
The most common Production, Transportation and Moving occupations in Lake Bryan are Material Moving (55 | 9.0%), Production (53 | 8.7%), and Transportation (44 | 7.2%).
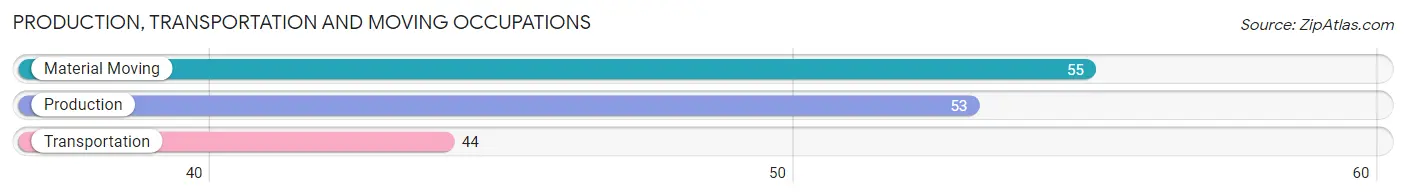
Production, Transportation and Moving Occupations by Sex
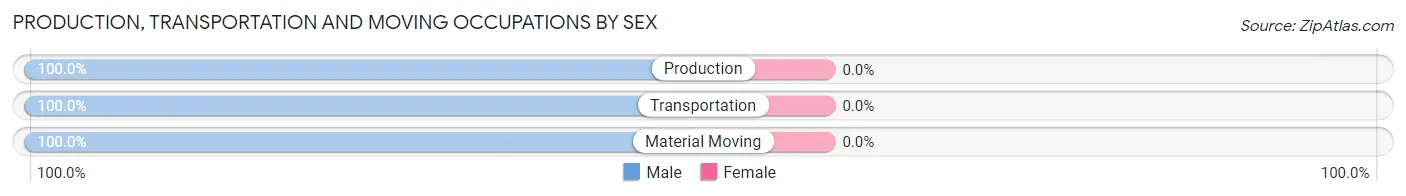
| Occupation | Male | Female |
| Production | 53 (100.0%) | 0 (0.0%) |
| Transportation | 44 (100.0%) | 0 (0.0%) |
| Material Moving | 55 (100.0%) | 0 (0.0%) |
| Total (Category) | 152 (100.0%) | 0 (0.0%) |
| Total (Overall) | 343 (56.3%) | 266 (43.7%) |
Employment Industries by Sex in Lake Bryan
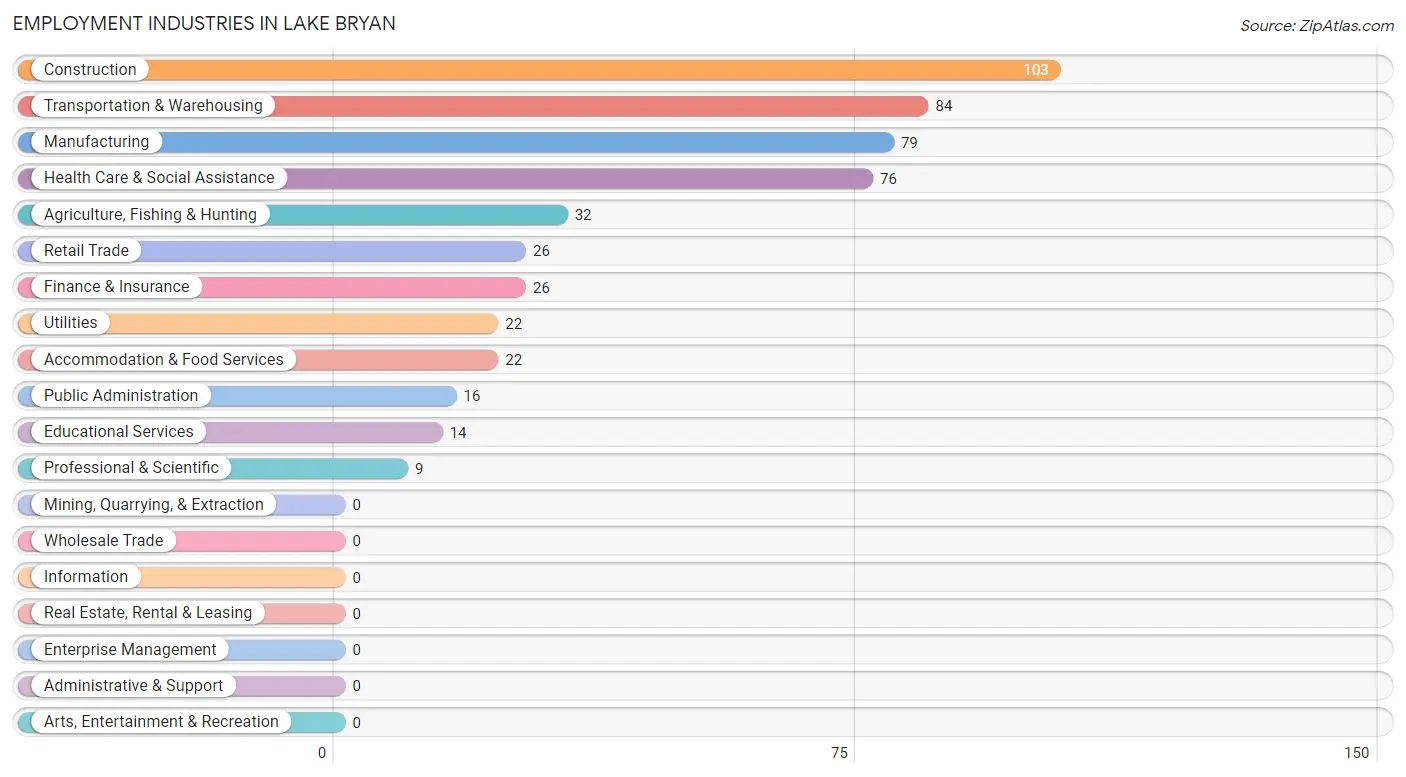
Employment Industries in Lake Bryan
The major employment industries in Lake Bryan include Construction (103 | 16.9%), Transportation & Warehousing (84 | 13.8%), Manufacturing (79 | 13.0%), Health Care & Social Assistance (76 | 12.5%), and Agriculture, Fishing & Hunting (32 | 5.2%).
Employment Industries by Sex in Lake Bryan
The Lake Bryan industries that see more men than women are Construction (100.0%), Manufacturing (100.0%), and Utilities (100.0%), whereas the industries that tend to have a higher number of women are Agriculture, Fishing & Hunting (100.0%), Retail Trade (100.0%), and Professional & Scientific (100.0%).
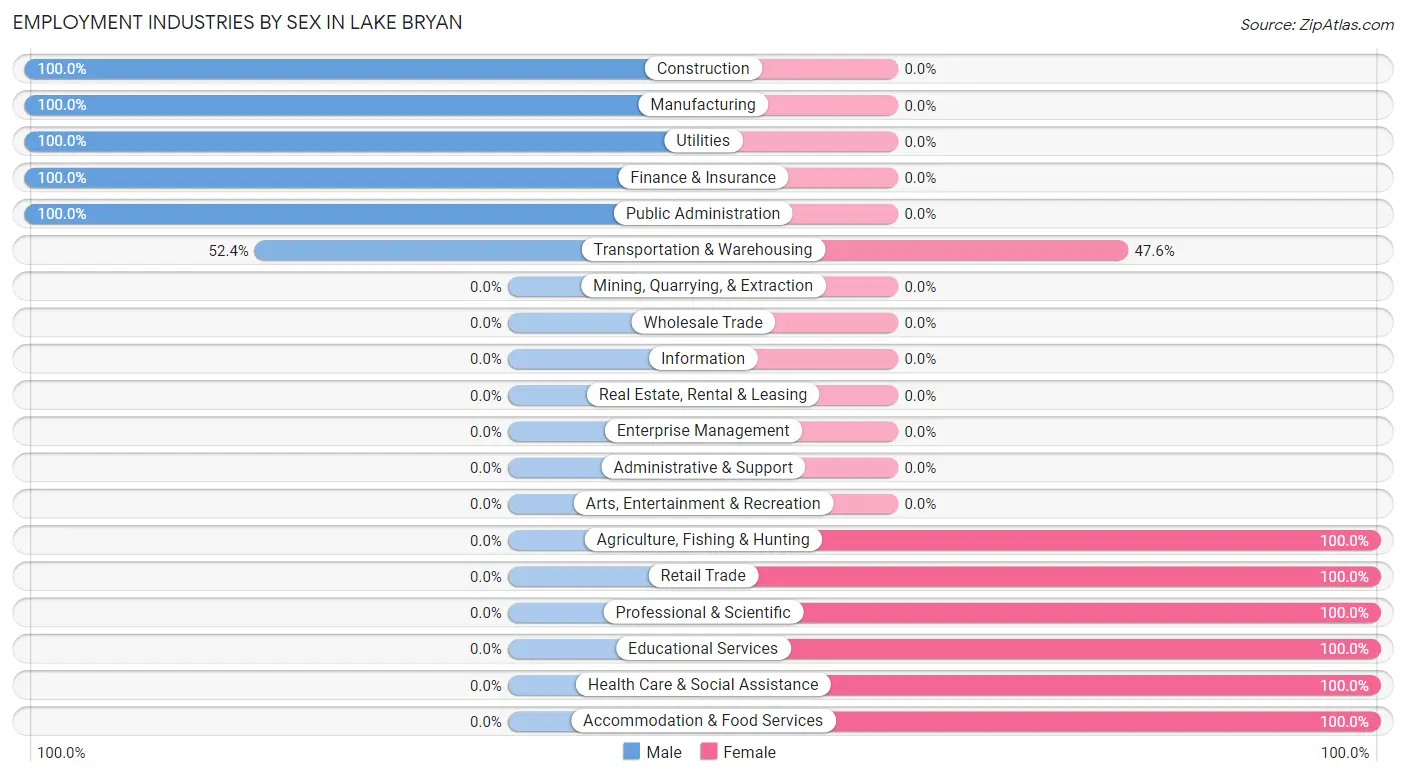
| Industry | Male | Female |
| Agriculture, Fishing & Hunting | 0 (0.0%) | 32 (100.0%) |
| Mining, Quarrying, & Extraction | 0 (0.0%) | 0 (0.0%) |
| Construction | 103 (100.0%) | 0 (0.0%) |
| Manufacturing | 79 (100.0%) | 0 (0.0%) |
| Wholesale Trade | 0 (0.0%) | 0 (0.0%) |
| Retail Trade | 0 (0.0%) | 26 (100.0%) |
| Transportation & Warehousing | 44 (52.4%) | 40 (47.6%) |
| Utilities | 22 (100.0%) | 0 (0.0%) |
| Information | 0 (0.0%) | 0 (0.0%) |
| Finance & Insurance | 26 (100.0%) | 0 (0.0%) |
| Real Estate, Rental & Leasing | 0 (0.0%) | 0 (0.0%) |
| Professional & Scientific | 0 (0.0%) | 9 (100.0%) |
| Enterprise Management | 0 (0.0%) | 0 (0.0%) |
| Administrative & Support | 0 (0.0%) | 0 (0.0%) |
| Educational Services | 0 (0.0%) | 14 (100.0%) |
| Health Care & Social Assistance | 0 (0.0%) | 76 (100.0%) |
| Arts, Entertainment & Recreation | 0 (0.0%) | 0 (0.0%) |
| Accommodation & Food Services | 0 (0.0%) | 22 (100.0%) |
| Public Administration | 16 (100.0%) | 0 (0.0%) |
| Total | 343 (56.3%) | 266 (43.7%) |
Education in Lake Bryan
School Enrollment in Lake Bryan
The most common levels of schooling among the 391 students in Lake Bryan are elementary school (216 | 55.2%), college / undergraduate (86 | 22.0%), and middle school (74 | 18.9%).
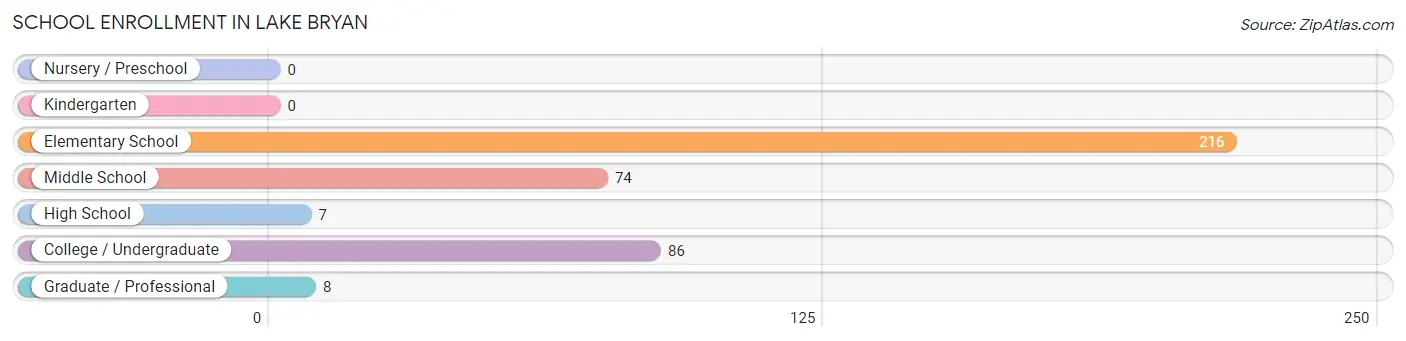
| School Level | # Students | % Students |
| Nursery / Preschool | 0 | 0.0% |
| Kindergarten | 0 | 0.0% |
| Elementary School | 216 | 55.2% |
| Middle School | 74 | 18.9% |
| High School | 7 | 1.8% |
| College / Undergraduate | 86 | 22.0% |
| Graduate / Professional | 8 | 2.1% |
| Total | 391 | 100.0% |
School Enrollment by Age by Funding Source in Lake Bryan
Out of a total of 391 students who are enrolled in schools in Lake Bryan, 156 (39.9%) attend a private institution, while the remaining 235 (60.1%) are enrolled in public schools. The age group of 35 years and over has the highest likelihood of being enrolled in private schools, with 22 (100.0% in the age bracket) enrolled. Conversely, the age group of 20 to 24 year olds has the lowest likelihood of being enrolled in a private school, with 41 (100.0% in the age bracket) attending a public institution.
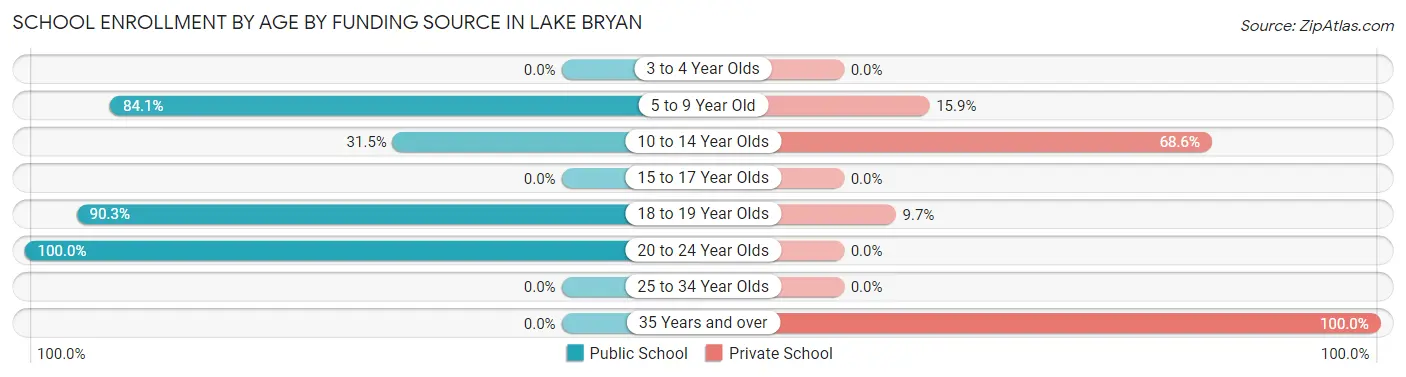
| Age Bracket | Public School | Private School |
| 3 to 4 Year Olds | 0 (0.0%) | 0 (0.0%) |
| 5 to 9 Year Old | 116 (84.1%) | 22 (15.9%) |
| 10 to 14 Year Olds | 50 (31.5%) | 109 (68.5%) |
| 15 to 17 Year Olds | 0 (0.0%) | 0 (0.0%) |
| 18 to 19 Year Olds | 28 (90.3%) | 3 (9.7%) |
| 20 to 24 Year Olds | 41 (100.0%) | 0 (0.0%) |
| 25 to 34 Year Olds | 0 (0.0%) | 0 (0.0%) |
| 35 Years and over | 0 (0.0%) | 22 (100.0%) |
| Total | 235 (60.1%) | 156 (39.9%) |
Educational Attainment by Field of Study in Lake Bryan
Business (40 | 35.1%), social sciences (36 | 31.6%), literature & languages (22 | 19.3%), and arts & humanities (16 | 14.0%) are the most common fields of study among 114 individuals in Lake Bryan who have obtained a bachelor's degree or higher.
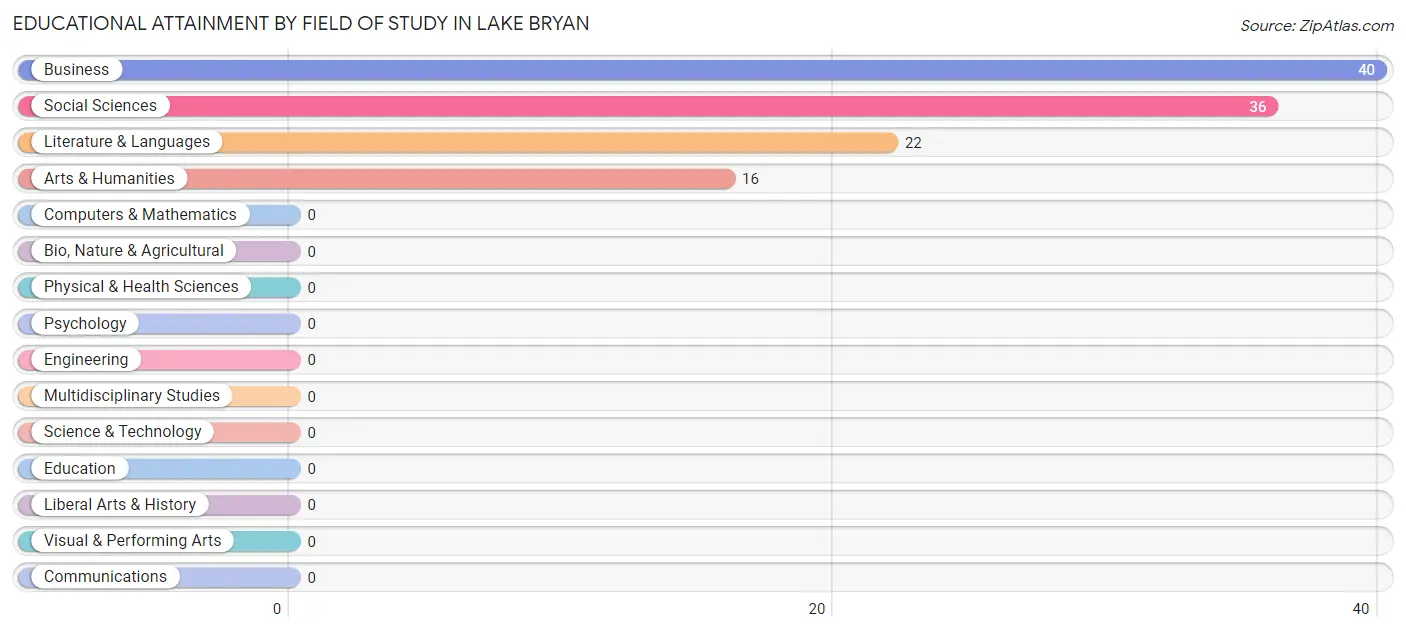
| Field of Study | # Graduates | % Graduates |
| Computers & Mathematics | 0 | 0.0% |
| Bio, Nature & Agricultural | 0 | 0.0% |
| Physical & Health Sciences | 0 | 0.0% |
| Psychology | 0 | 0.0% |
| Social Sciences | 36 | 31.6% |
| Engineering | 0 | 0.0% |
| Multidisciplinary Studies | 0 | 0.0% |
| Science & Technology | 0 | 0.0% |
| Business | 40 | 35.1% |
| Education | 0 | 0.0% |
| Literature & Languages | 22 | 19.3% |
| Liberal Arts & History | 0 | 0.0% |
| Visual & Performing Arts | 0 | 0.0% |
| Communications | 0 | 0.0% |
| Arts & Humanities | 16 | 14.0% |
| Total | 114 | 100.0% |
Transportation & Commute in Lake Bryan
Vehicle Availability by Sex in Lake Bryan
The most prevalent vehicle ownership categories in Lake Bryan are males with 2 vehicles (226, accounting for 65.9%) and females with 2 vehicles (141, making up 85.0%).
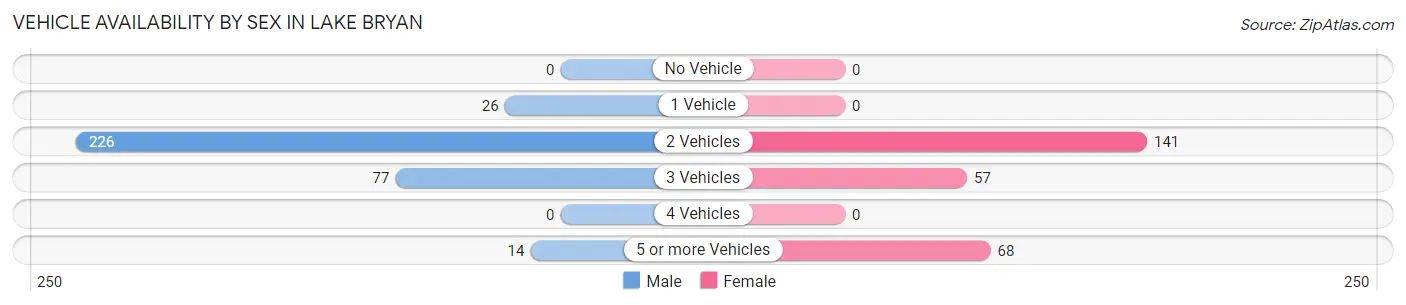
| Vehicles Available | Male | Female |
| No Vehicle | 0 (0.0%) | 0 (0.0%) |
| 1 Vehicle | 26 (7.6%) | 0 (0.0%) |
| 2 Vehicles | 226 (65.9%) | 141 (53.0%) |
| 3 Vehicles | 77 (22.5%) | 57 (21.4%) |
| 4 Vehicles | 0 (0.0%) | 0 (0.0%) |
| 5 or more Vehicles | 14 (4.1%) | 68 (25.6%) |
| Total | 343 (100.0%) | 266 (100.0%) |
Commute Time in Lake Bryan
The most frequently occuring commute durations in Lake Bryan are 15 to 19 minutes (273 commuters, 46.8%), 10 to 14 minutes (104 commuters, 17.8%), and 20 to 24 minutes (68 commuters, 11.7%).
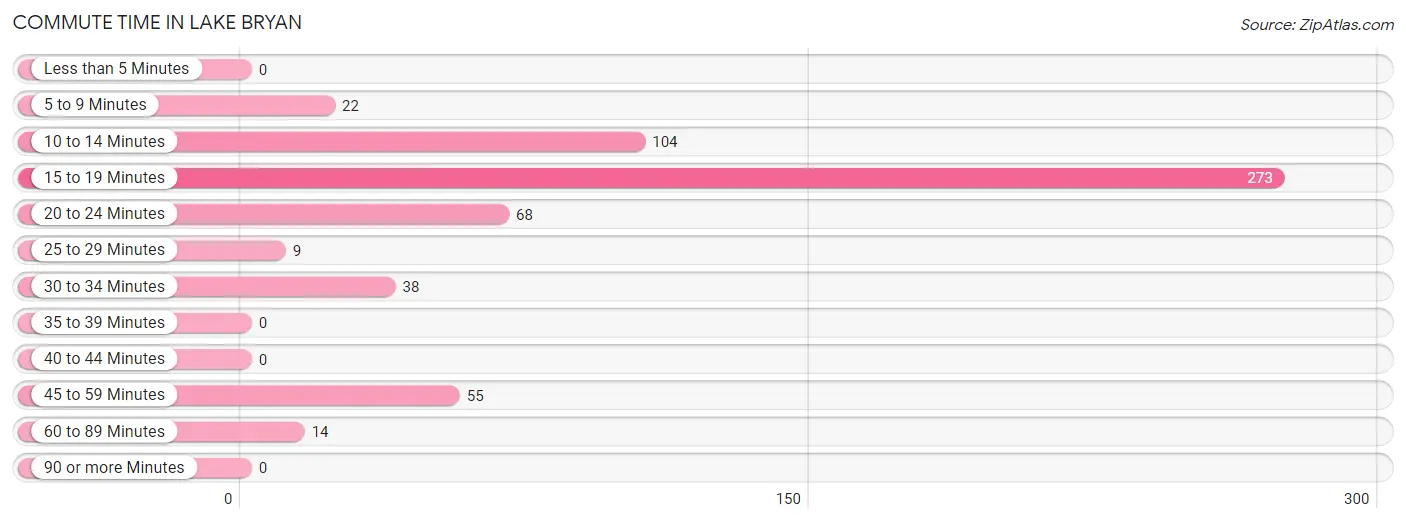
| Commute Time | # Commuters | % Commuters |
| Less than 5 Minutes | 0 | 0.0% |
| 5 to 9 Minutes | 22 | 3.8% |
| 10 to 14 Minutes | 104 | 17.8% |
| 15 to 19 Minutes | 273 | 46.8% |
| 20 to 24 Minutes | 68 | 11.7% |
| 25 to 29 Minutes | 9 | 1.5% |
| 30 to 34 Minutes | 38 | 6.5% |
| 35 to 39 Minutes | 0 | 0.0% |
| 40 to 44 Minutes | 0 | 0.0% |
| 45 to 59 Minutes | 55 | 9.4% |
| 60 to 89 Minutes | 14 | 2.4% |
| 90 or more Minutes | 0 | 0.0% |
Commute Time by Sex in Lake Bryan
The most common commute times in Lake Bryan are 15 to 19 minutes (190 commuters, 59.9%) for males and 10 to 14 minutes (104 commuters, 39.1%) for females.
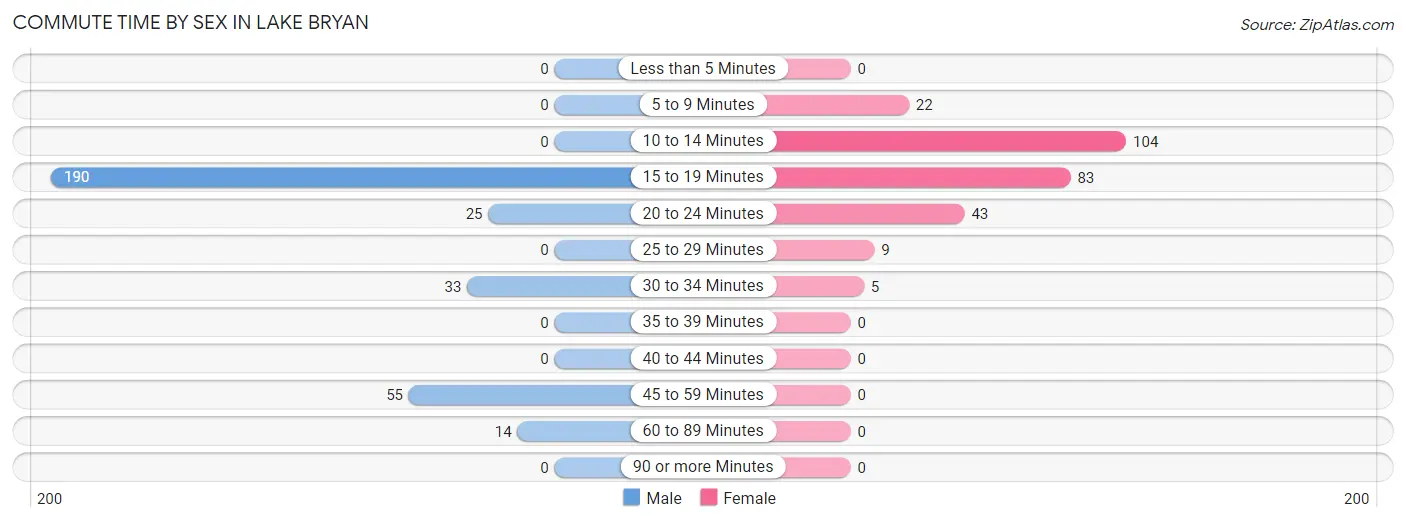
| Commute Time | Male | Female |
| Less than 5 Minutes | 0 (0.0%) | 0 (0.0%) |
| 5 to 9 Minutes | 0 (0.0%) | 22 (8.3%) |
| 10 to 14 Minutes | 0 (0.0%) | 104 (39.1%) |
| 15 to 19 Minutes | 190 (59.9%) | 83 (31.2%) |
| 20 to 24 Minutes | 25 (7.9%) | 43 (16.2%) |
| 25 to 29 Minutes | 0 (0.0%) | 9 (3.4%) |
| 30 to 34 Minutes | 33 (10.4%) | 5 (1.9%) |
| 35 to 39 Minutes | 0 (0.0%) | 0 (0.0%) |
| 40 to 44 Minutes | 0 (0.0%) | 0 (0.0%) |
| 45 to 59 Minutes | 55 (17.3%) | 0 (0.0%) |
| 60 to 89 Minutes | 14 (4.4%) | 0 (0.0%) |
| 90 or more Minutes | 0 (0.0%) | 0 (0.0%) |
Time of Departure to Work by Sex in Lake Bryan
The most frequent times of departure to work in Lake Bryan are 6:30 AM to 6:59 AM (79, 24.9%) for males and 7:30 AM to 7:59 AM (63, 23.7%) for females.
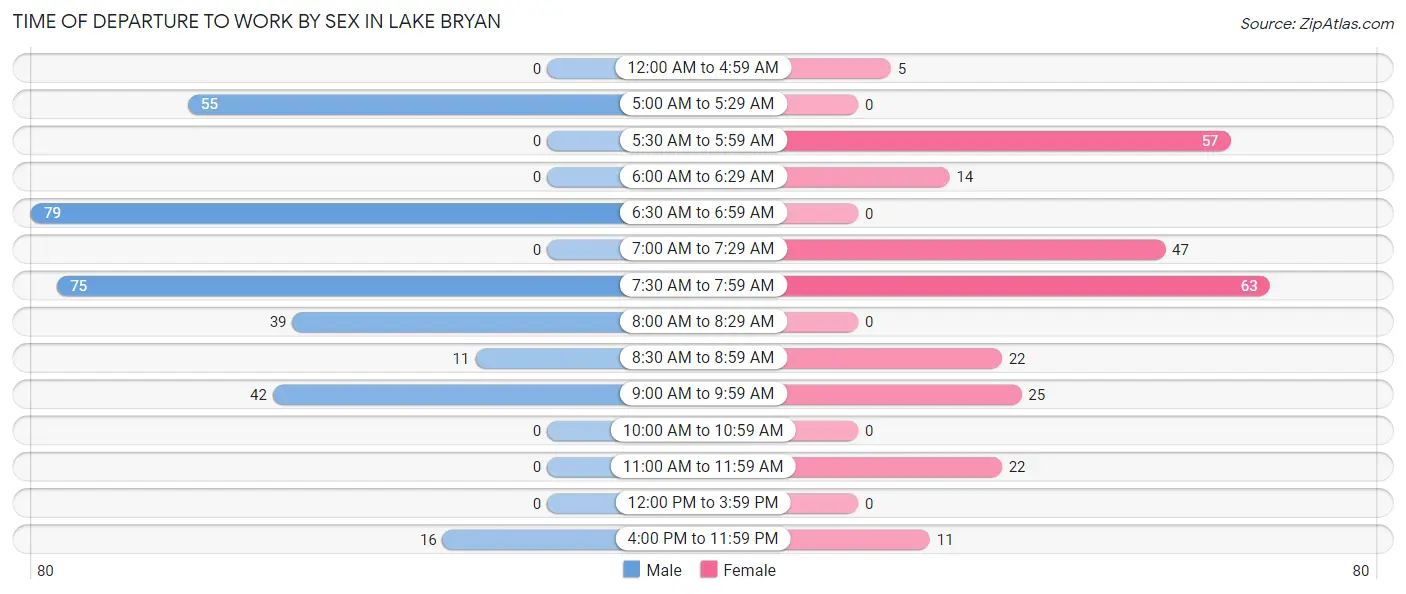
| Time of Departure | Male | Female |
| 12:00 AM to 4:59 AM | 0 (0.0%) | 5 (1.9%) |
| 5:00 AM to 5:29 AM | 55 (17.3%) | 0 (0.0%) |
| 5:30 AM to 5:59 AM | 0 (0.0%) | 57 (21.4%) |
| 6:00 AM to 6:29 AM | 0 (0.0%) | 14 (5.3%) |
| 6:30 AM to 6:59 AM | 79 (24.9%) | 0 (0.0%) |
| 7:00 AM to 7:29 AM | 0 (0.0%) | 47 (17.7%) |
| 7:30 AM to 7:59 AM | 75 (23.7%) | 63 (23.7%) |
| 8:00 AM to 8:29 AM | 39 (12.3%) | 0 (0.0%) |
| 8:30 AM to 8:59 AM | 11 (3.5%) | 22 (8.3%) |
| 9:00 AM to 9:59 AM | 42 (13.3%) | 25 (9.4%) |
| 10:00 AM to 10:59 AM | 0 (0.0%) | 0 (0.0%) |
| 11:00 AM to 11:59 AM | 0 (0.0%) | 22 (8.3%) |
| 12:00 PM to 3:59 PM | 0 (0.0%) | 0 (0.0%) |
| 4:00 PM to 11:59 PM | 16 (5.1%) | 11 (4.1%) |
| Total | 317 (100.0%) | 266 (100.0%) |
Housing Occupancy in Lake Bryan
Occupancy by Ownership in Lake Bryan
Of the total 498 dwellings in Lake Bryan, owner-occupied units account for 446 (89.6%), while renter-occupied units make up 52 (10.4%).

| Occupancy | # Housing Units | % Housing Units |
| Owner Occupied Housing Units | 446 | 89.6% |
| Renter-Occupied Housing Units | 52 | 10.4% |
| Total Occupied Housing Units | 498 | 100.0% |
Occupancy by Household Size in Lake Bryan
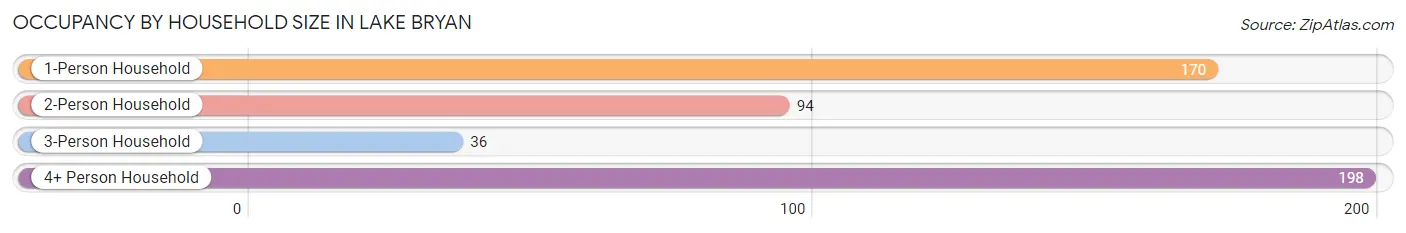
| Household Size | # Housing Units | % Housing Units |
| 1-Person Household | 170 | 34.1% |
| 2-Person Household | 94 | 18.9% |
| 3-Person Household | 36 | 7.2% |
| 4+ Person Household | 198 | 39.8% |
| Total Housing Units | 498 | 100.0% |
Occupancy by Ownership by Household Size in Lake Bryan
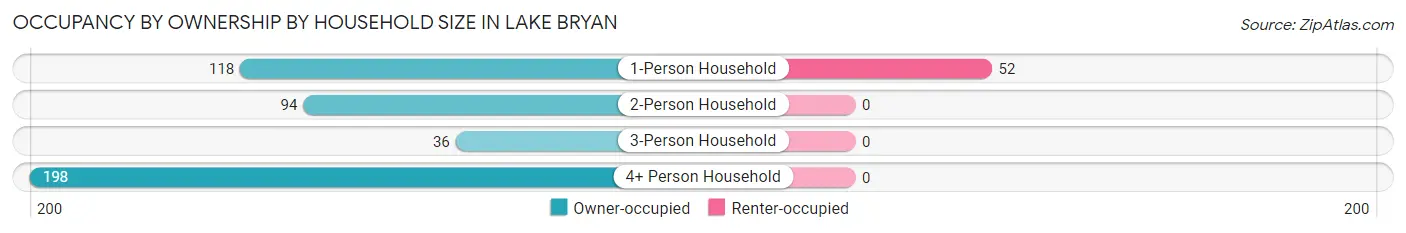
| Household Size | Owner-occupied | Renter-occupied |
| 1-Person Household | 118 (69.4%) | 52 (30.6%) |
| 2-Person Household | 94 (100.0%) | 0 (0.0%) |
| 3-Person Household | 36 (100.0%) | 0 (0.0%) |
| 4+ Person Household | 198 (100.0%) | 0 (0.0%) |
| Total Housing Units | 446 (89.6%) | 52 (10.4%) |
Occupancy by Educational Attainment in Lake Bryan
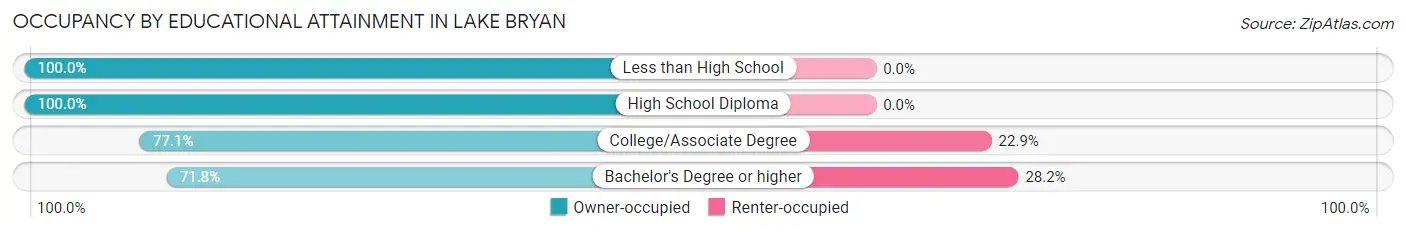
| Household Size | Owner-occupied | Renter-occupied |
| Less than High School | 129 (100.0%) | 0 (0.0%) |
| High School Diploma | 160 (100.0%) | 0 (0.0%) |
| College/Associate Degree | 101 (77.1%) | 30 (22.9%) |
| Bachelor's Degree or higher | 56 (71.8%) | 22 (28.2%) |
Occupancy by Age of Householder in Lake Bryan
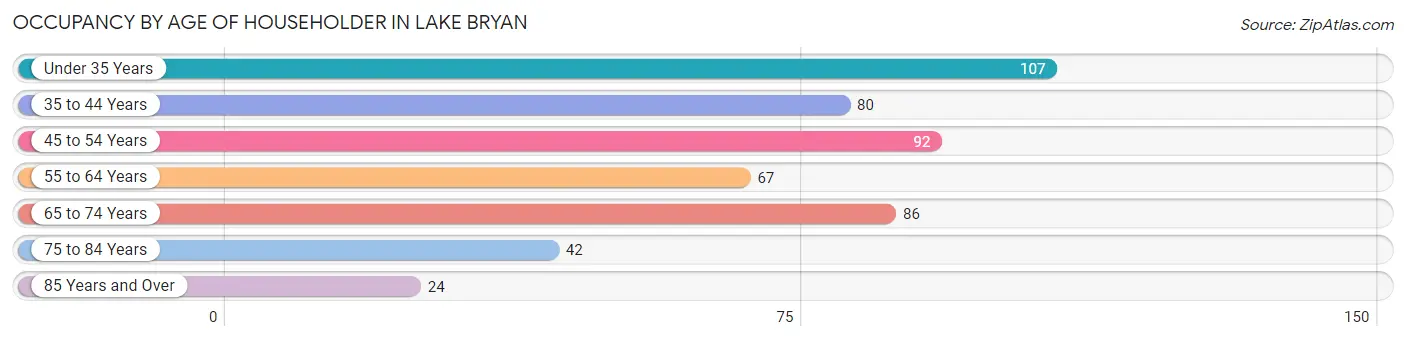
| Age Bracket | # Households | % Households |
| Under 35 Years | 107 | 21.5% |
| 35 to 44 Years | 80 | 16.1% |
| 45 to 54 Years | 92 | 18.5% |
| 55 to 64 Years | 67 | 13.5% |
| 65 to 74 Years | 86 | 17.3% |
| 75 to 84 Years | 42 | 8.4% |
| 85 Years and Over | 24 | 4.8% |
| Total | 498 | 100.0% |
Housing Finances in Lake Bryan
Median Income by Occupancy in Lake Bryan
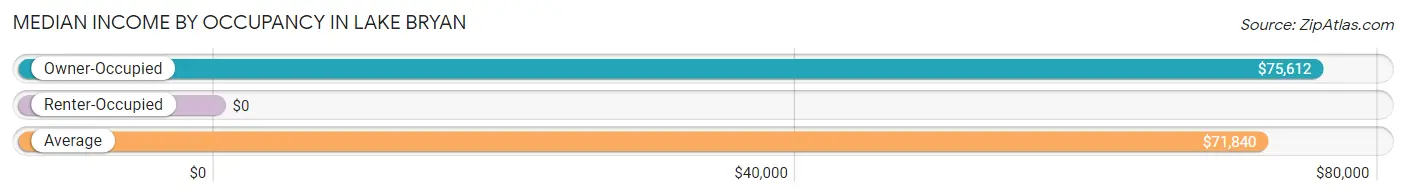
| Occupancy Type | # Households | Median Income |
| Owner-Occupied | 446 (89.6%) | $75,612 |
| Renter-Occupied | 52 (10.4%) | $0 |
| Average | 498 (100.0%) | $71,840 |
Occupancy by Householder Income Bracket in Lake Bryan
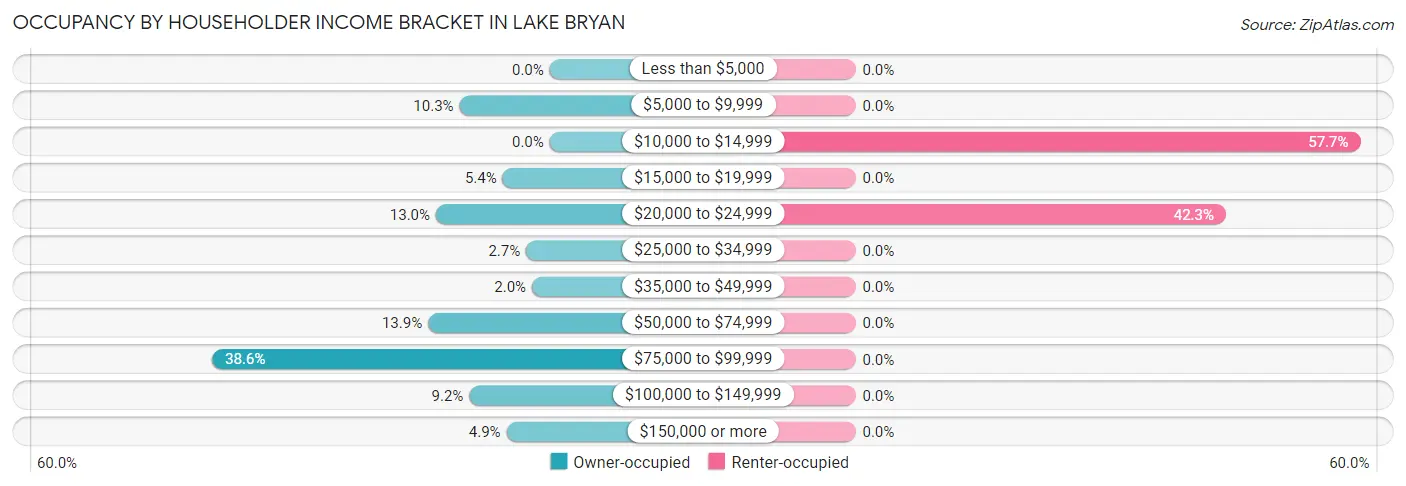
| Income Bracket | Owner-occupied | Renter-occupied |
| Less than $5,000 | 0 (0.0%) | 0 (0.0%) |
| $5,000 to $9,999 | 46 (10.3%) | 0 (0.0%) |
| $10,000 to $14,999 | 0 (0.0%) | 30 (57.7%) |
| $15,000 to $19,999 | 24 (5.4%) | 0 (0.0%) |
| $20,000 to $24,999 | 58 (13.0%) | 22 (42.3%) |
| $25,000 to $34,999 | 12 (2.7%) | 0 (0.0%) |
| $35,000 to $49,999 | 9 (2.0%) | 0 (0.0%) |
| $50,000 to $74,999 | 62 (13.9%) | 0 (0.0%) |
| $75,000 to $99,999 | 172 (38.6%) | 0 (0.0%) |
| $100,000 to $149,999 | 41 (9.2%) | 0 (0.0%) |
| $150,000 or more | 22 (4.9%) | 0 (0.0%) |
| Total | 446 (100.0%) | 52 (100.0%) |
Monthly Housing Cost Tiers in Lake Bryan
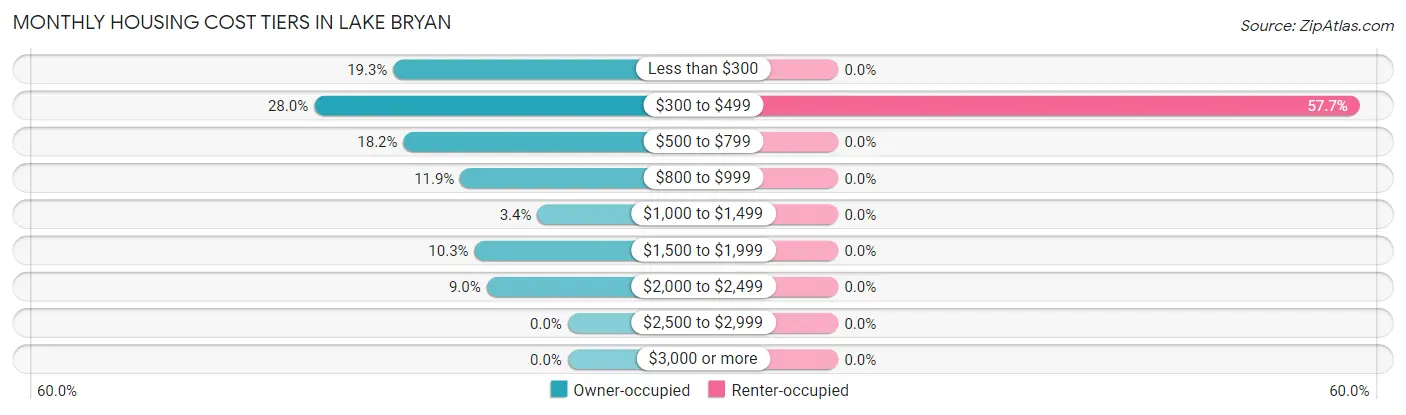
| Monthly Cost | Owner-occupied | Renter-occupied |
| Less than $300 | 86 (19.3%) | 0 (0.0%) |
| $300 to $499 | 125 (28.0%) | 30 (57.7%) |
| $500 to $799 | 81 (18.2%) | 0 (0.0%) |
| $800 to $999 | 53 (11.9%) | 0 (0.0%) |
| $1,000 to $1,499 | 15 (3.4%) | 0 (0.0%) |
| $1,500 to $1,999 | 46 (10.3%) | 0 (0.0%) |
| $2,000 to $2,499 | 40 (9.0%) | 0 (0.0%) |
| $2,500 to $2,999 | 0 (0.0%) | 0 (0.0%) |
| $3,000 or more | 0 (0.0%) | 0 (0.0%) |
| Total | 446 (100.0%) | 52 (100.0%) |
Physical Housing Characteristics in Lake Bryan
Housing Structures in Lake Bryan
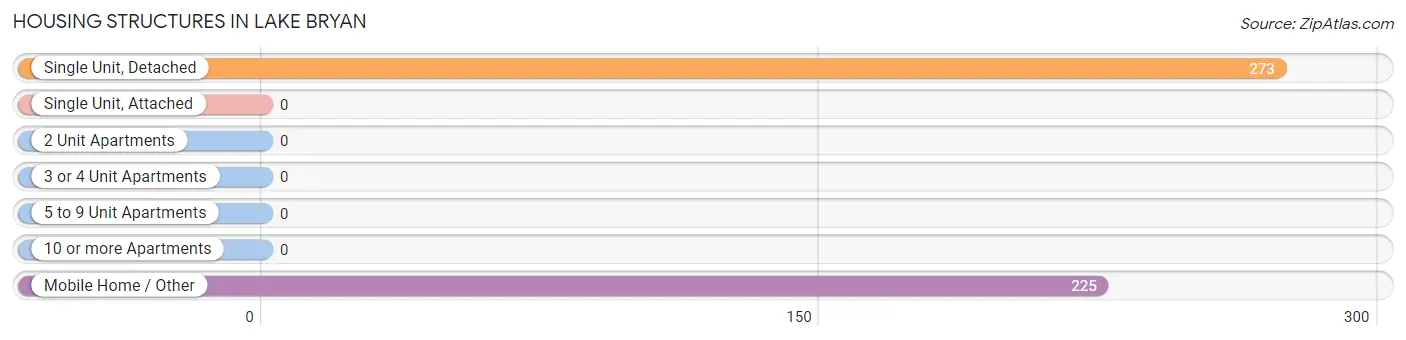
| Structure Type | # Housing Units | % Housing Units |
| Single Unit, Detached | 273 | 54.8% |
| Single Unit, Attached | 0 | 0.0% |
| 2 Unit Apartments | 0 | 0.0% |
| 3 or 4 Unit Apartments | 0 | 0.0% |
| 5 to 9 Unit Apartments | 0 | 0.0% |
| 10 or more Apartments | 0 | 0.0% |
| Mobile Home / Other | 225 | 45.2% |
| Total | 498 | 100.0% |
Housing Structures by Occupancy in Lake Bryan
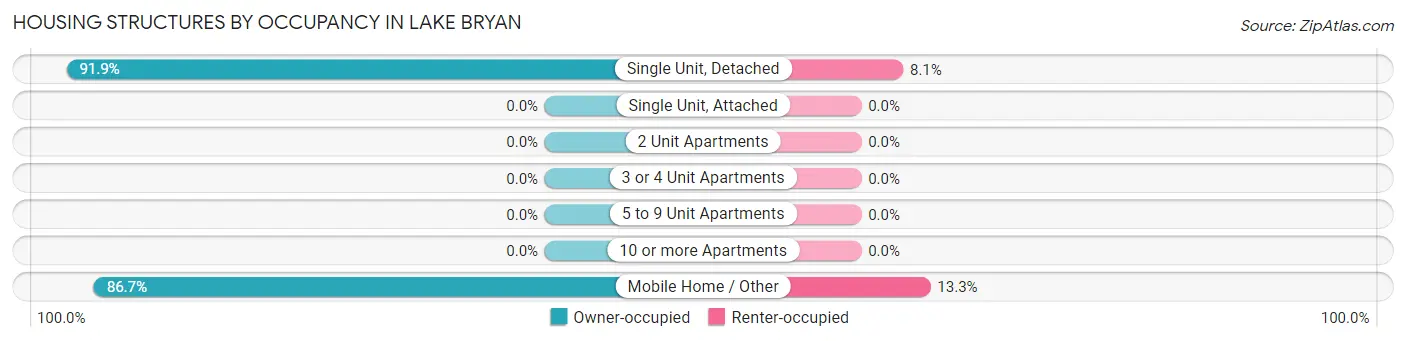
| Structure Type | Owner-occupied | Renter-occupied |
| Single Unit, Detached | 251 (91.9%) | 22 (8.1%) |
| Single Unit, Attached | 0 (0.0%) | 0 (0.0%) |
| 2 Unit Apartments | 0 (0.0%) | 0 (0.0%) |
| 3 or 4 Unit Apartments | 0 (0.0%) | 0 (0.0%) |
| 5 to 9 Unit Apartments | 0 (0.0%) | 0 (0.0%) |
| 10 or more Apartments | 0 (0.0%) | 0 (0.0%) |
| Mobile Home / Other | 195 (86.7%) | 30 (13.3%) |
| Total | 446 (89.6%) | 52 (10.4%) |
Housing Structures by Number of Rooms in Lake Bryan
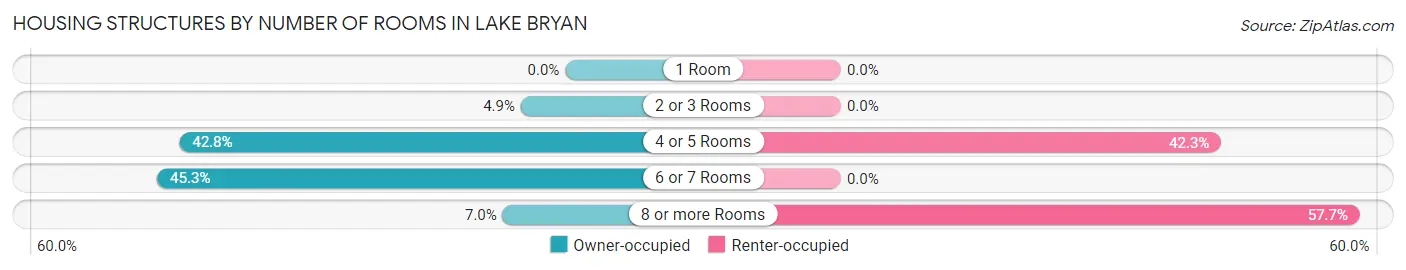
| Number of Rooms | Owner-occupied | Renter-occupied |
| 1 Room | 0 (0.0%) | 0 (0.0%) |
| 2 or 3 Rooms | 22 (4.9%) | 0 (0.0%) |
| 4 or 5 Rooms | 191 (42.8%) | 22 (42.3%) |
| 6 or 7 Rooms | 202 (45.3%) | 0 (0.0%) |
| 8 or more Rooms | 31 (7.0%) | 30 (57.7%) |
| Total | 446 (100.0%) | 52 (100.0%) |
Housing Structure by Heating Type in Lake Bryan
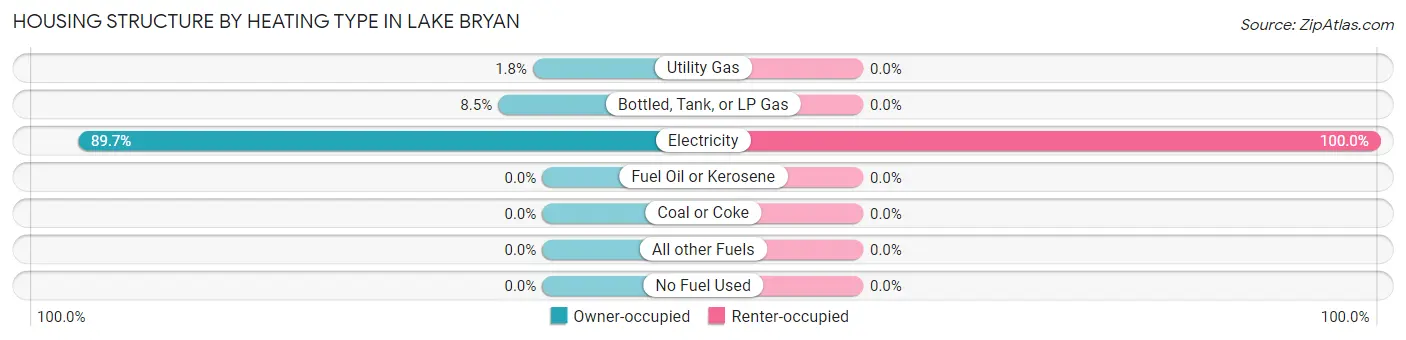
| Heating Type | Owner-occupied | Renter-occupied |
| Utility Gas | 8 (1.8%) | 0 (0.0%) |
| Bottled, Tank, or LP Gas | 38 (8.5%) | 0 (0.0%) |
| Electricity | 400 (89.7%) | 52 (100.0%) |
| Fuel Oil or Kerosene | 0 (0.0%) | 0 (0.0%) |
| Coal or Coke | 0 (0.0%) | 0 (0.0%) |
| All other Fuels | 0 (0.0%) | 0 (0.0%) |
| No Fuel Used | 0 (0.0%) | 0 (0.0%) |
| Total | 446 (100.0%) | 52 (100.0%) |
Household Vehicle Usage in Lake Bryan
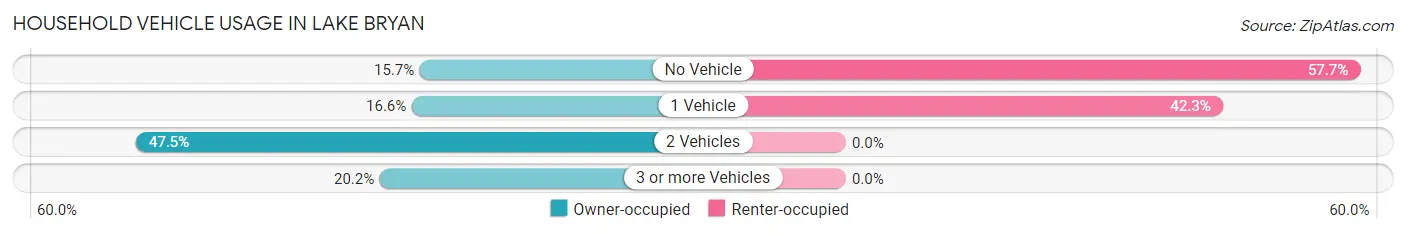
| Vehicles per Household | Owner-occupied | Renter-occupied |
| No Vehicle | 70 (15.7%) | 30 (57.7%) |
| 1 Vehicle | 74 (16.6%) | 22 (42.3%) |
| 2 Vehicles | 212 (47.5%) | 0 (0.0%) |
| 3 or more Vehicles | 90 (20.2%) | 0 (0.0%) |
| Total | 446 (100.0%) | 52 (100.0%) |
Real Estate & Mortgages in Lake Bryan
Real Estate and Mortgage Overview in Lake Bryan
| Characteristic | Without Mortgage | With Mortgage |
| Housing Units | 309 | 137 |
| Median Property Value | $69,900 | $0 |
| Median Household Income | - | - |
| Monthly Housing Costs | $365 | $0 |
| Real Estate Taxes | $921 | $0 |
Property Value by Mortgage Status in Lake Bryan
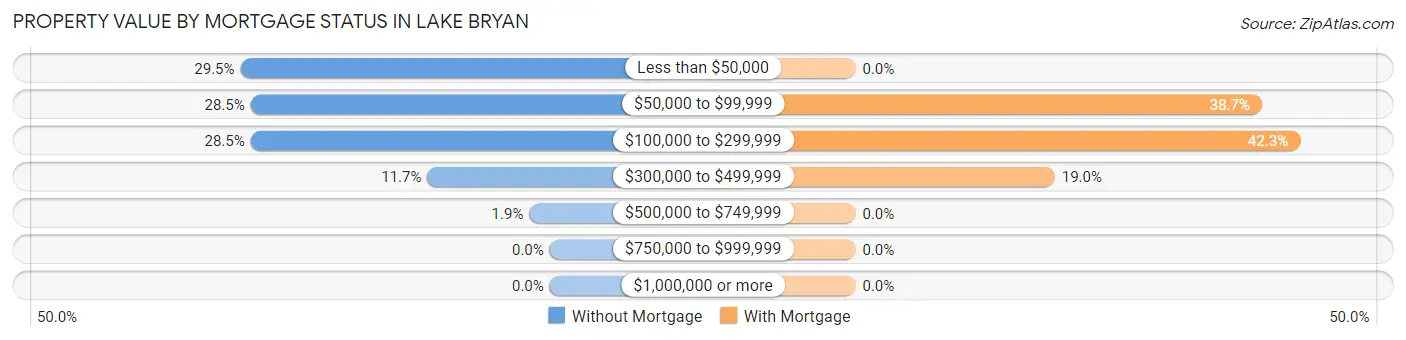
| Property Value | Without Mortgage | With Mortgage |
| Less than $50,000 | 91 (29.4%) | 0 (0.0%) |
| $50,000 to $99,999 | 88 (28.5%) | 53 (38.7%) |
| $100,000 to $299,999 | 88 (28.5%) | 58 (42.3%) |
| $300,000 to $499,999 | 36 (11.7%) | 26 (19.0%) |
| $500,000 to $749,999 | 6 (1.9%) | 0 (0.0%) |
| $750,000 to $999,999 | 0 (0.0%) | 0 (0.0%) |
| $1,000,000 or more | 0 (0.0%) | 0 (0.0%) |
| Total | 309 (100.0%) | 137 (100.0%) |
Household Income by Mortgage Status in Lake Bryan
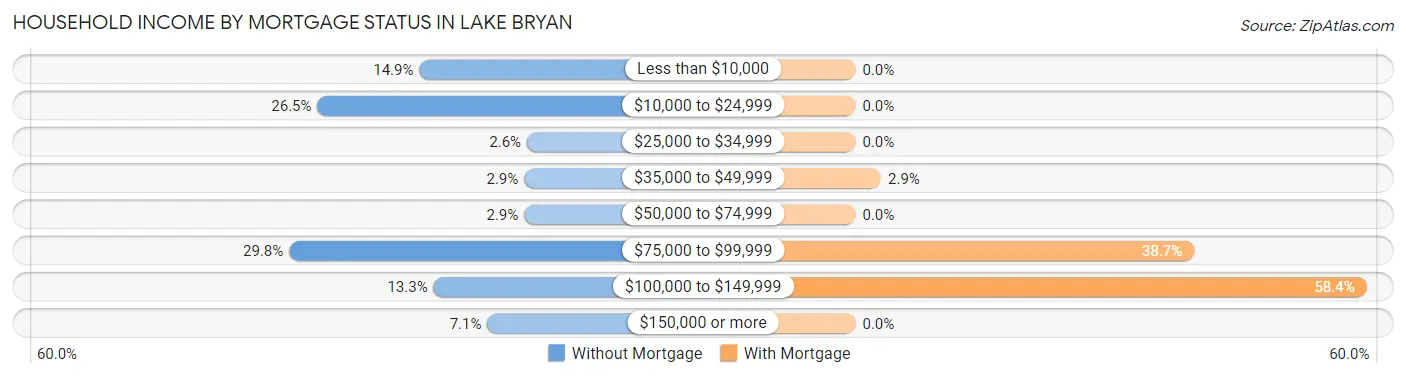
| Household Income | Without Mortgage | With Mortgage |
| Less than $10,000 | 46 (14.9%) | 0 (0.0%) |
| $10,000 to $24,999 | 82 (26.5%) | 0 (0.0%) |
| $25,000 to $34,999 | 8 (2.6%) | 0 (0.0%) |
| $35,000 to $49,999 | 9 (2.9%) | 4 (2.9%) |
| $50,000 to $74,999 | 9 (2.9%) | 0 (0.0%) |
| $75,000 to $99,999 | 92 (29.8%) | 53 (38.7%) |
| $100,000 to $149,999 | 41 (13.3%) | 80 (58.4%) |
| $150,000 or more | 22 (7.1%) | 0 (0.0%) |
| Total | 309 (100.0%) | 137 (100.0%) |
Property Value to Household Income Ratio in Lake Bryan
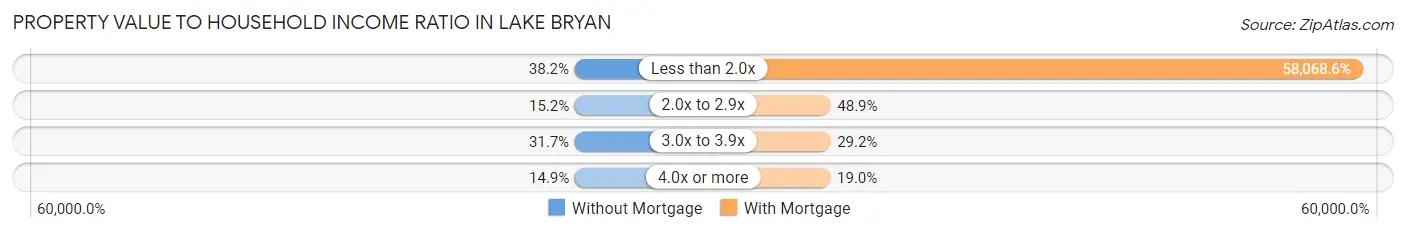
| Value-to-Income Ratio | Without Mortgage | With Mortgage |
| Less than 2.0x | 118 (38.2%) | 79,554 (58,068.6%) |
| 2.0x to 2.9x | 47 (15.2%) | 67 (48.9%) |
| 3.0x to 3.9x | 98 (31.7%) | 40 (29.2%) |
| 4.0x or more | 46 (14.9%) | 26 (19.0%) |
| Total | 309 (100.0%) | 137 (100.0%) |
Real Estate Taxes by Mortgage Status in Lake Bryan
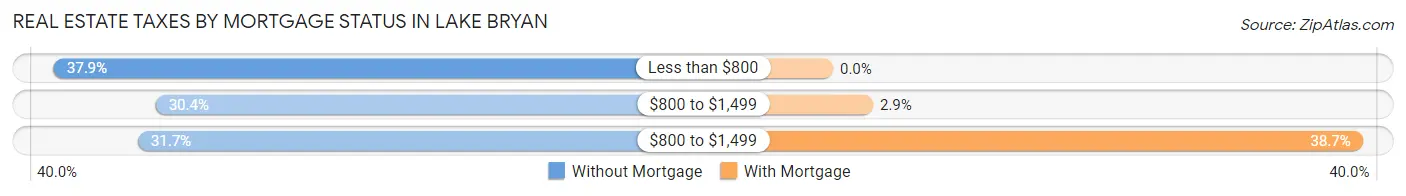
| Property Taxes | Without Mortgage | With Mortgage |
| Less than $800 | 117 (37.9%) | 0 (0.0%) |
| $800 to $1,499 | 94 (30.4%) | 4 (2.9%) |
| $800 to $1,499 | 98 (31.7%) | 53 (38.7%) |
| Total | 309 (100.0%) | 137 (100.0%) |
Health & Disability in Lake Bryan
Health Insurance Coverage by Age in Lake Bryan
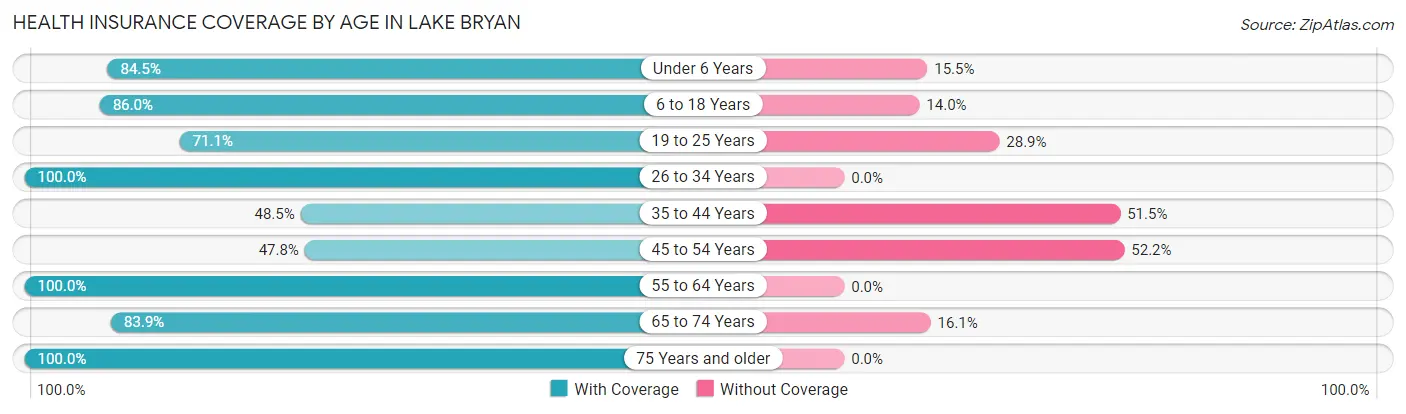
| Age Bracket | With Coverage | Without Coverage |
| Under 6 Years | 131 (84.5%) | 24 (15.5%) |
| 6 to 18 Years | 313 (86.0%) | 51 (14.0%) |
| 19 to 25 Years | 59 (71.1%) | 24 (28.9%) |
| 26 to 34 Years | 182 (100.0%) | 0 (0.0%) |
| 35 to 44 Years | 83 (48.5%) | 88 (51.5%) |
| 45 to 54 Years | 75 (47.8%) | 82 (52.2%) |
| 55 to 64 Years | 142 (100.0%) | 0 (0.0%) |
| 65 to 74 Years | 99 (83.9%) | 19 (16.1%) |
| 75 Years and older | 66 (100.0%) | 0 (0.0%) |
| Total | 1,150 (80.0%) | 288 (20.0%) |
Health Insurance Coverage by Citizenship Status in Lake Bryan
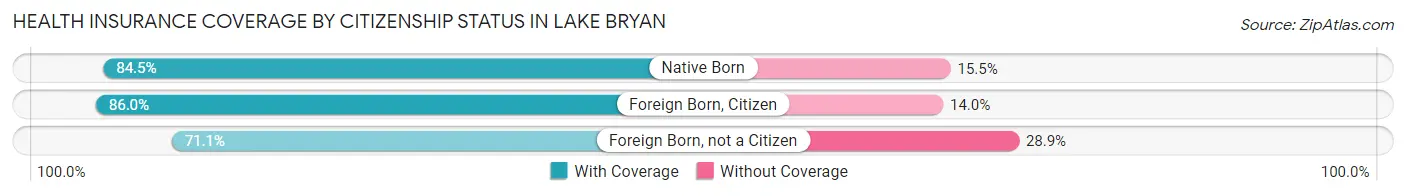
| Citizenship Status | With Coverage | Without Coverage |
| Native Born | 131 (84.5%) | 24 (15.5%) |
| Foreign Born, Citizen | 313 (86.0%) | 51 (14.0%) |
| Foreign Born, not a Citizen | 59 (71.1%) | 24 (28.9%) |
Health Insurance Coverage by Household Income in Lake Bryan
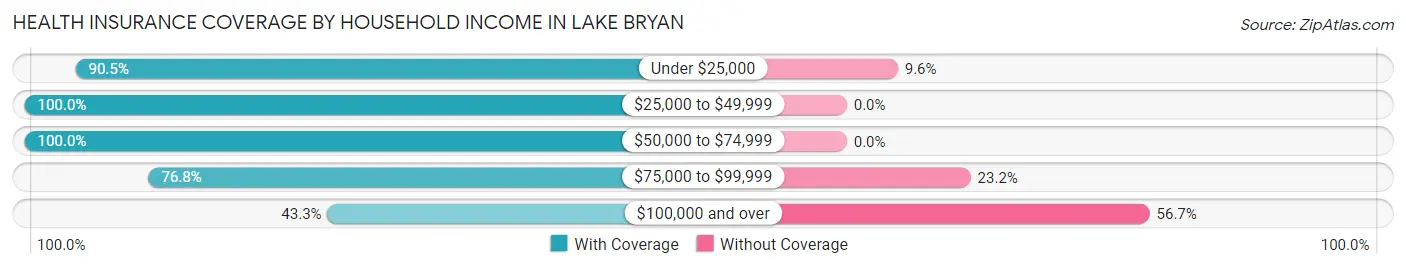
| Household Income | With Coverage | Without Coverage |
| Under $25,000 | 180 (90.4%) | 19 (9.6%) |
| $25,000 to $49,999 | 31 (100.0%) | 0 (0.0%) |
| $50,000 to $74,999 | 296 (100.0%) | 0 (0.0%) |
| $75,000 to $99,999 | 569 (76.8%) | 172 (23.2%) |
| $100,000 and over | 74 (43.3%) | 97 (56.7%) |
Public vs Private Health Insurance Coverage by Age in Lake Bryan
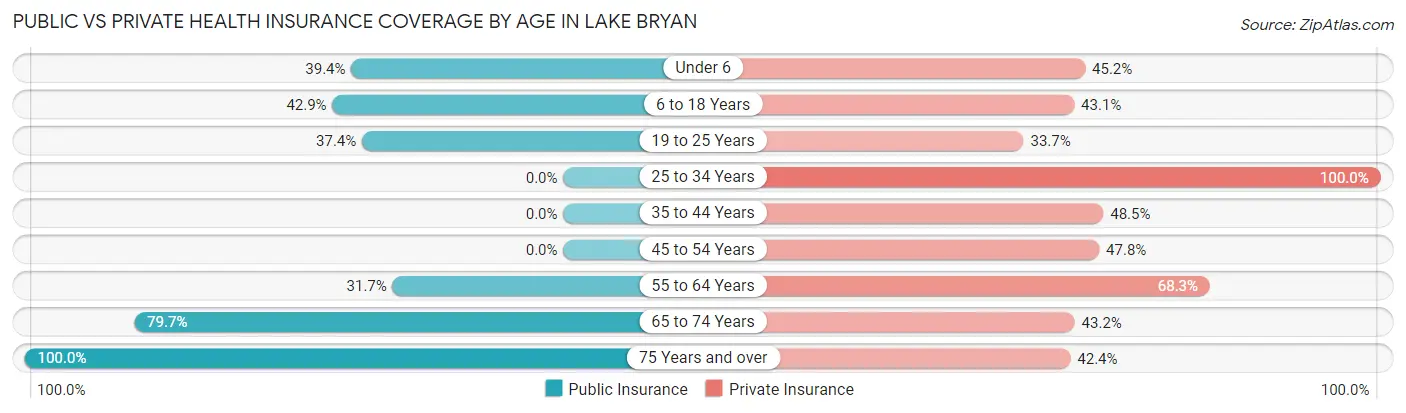
| Age Bracket | Public Insurance | Private Insurance |
| Under 6 | 61 (39.4%) | 70 (45.2%) |
| 6 to 18 Years | 156 (42.9%) | 157 (43.1%) |
| 19 to 25 Years | 31 (37.3%) | 28 (33.7%) |
| 25 to 34 Years | 0 (0.0%) | 182 (100.0%) |
| 35 to 44 Years | 0 (0.0%) | 83 (48.5%) |
| 45 to 54 Years | 0 (0.0%) | 75 (47.8%) |
| 55 to 64 Years | 45 (31.7%) | 97 (68.3%) |
| 65 to 74 Years | 94 (79.7%) | 51 (43.2%) |
| 75 Years and over | 66 (100.0%) | 28 (42.4%) |
| Total | 453 (31.5%) | 771 (53.6%) |
Disability Status by Sex by Age in Lake Bryan
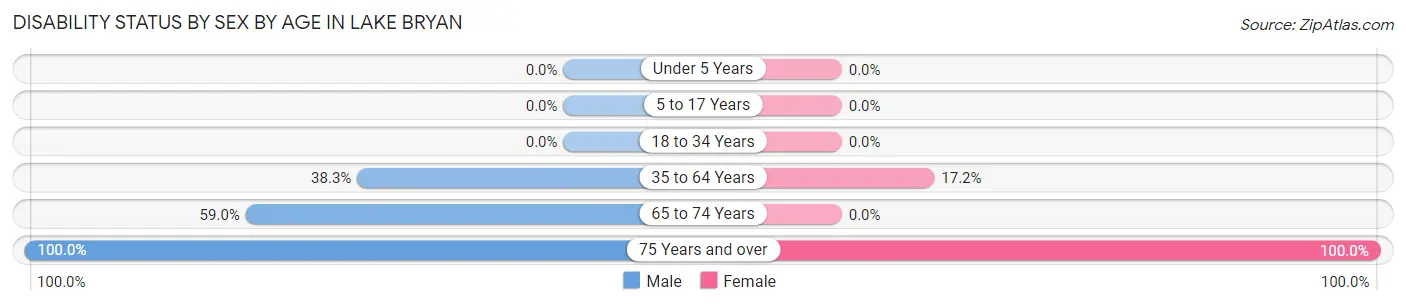
| Age Bracket | Male | Female |
| Under 5 Years | 0 (0.0%) | 0 (0.0%) |
| 5 to 17 Years | 0 (0.0%) | 0 (0.0%) |
| 18 to 34 Years | 0 (0.0%) | 0 (0.0%) |
| 35 to 64 Years | 93 (38.3%) | 39 (17.2%) |
| 65 to 74 Years | 46 (59.0%) | 0 (0.0%) |
| 75 Years and over | 42 (100.0%) | 24 (100.0%) |
Disability Class by Sex by Age in Lake Bryan
Disability Class: Hearing Difficulty
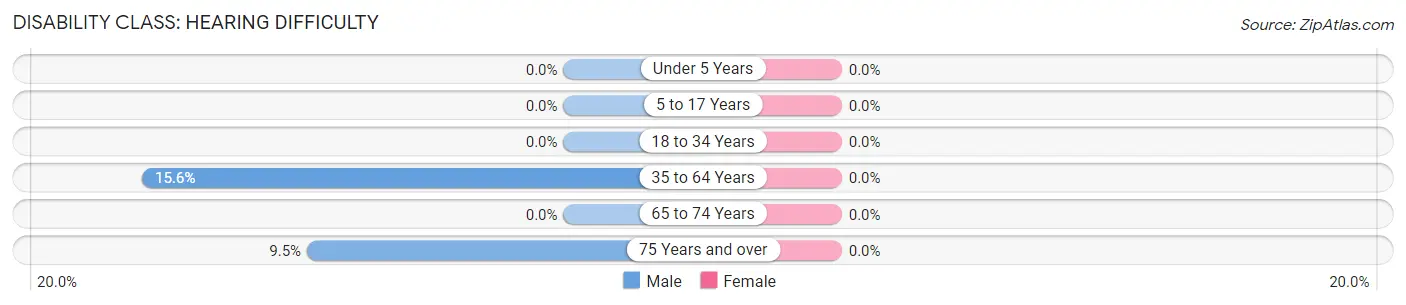
| Age Bracket | Male | Female |
| Under 5 Years | 0 (0.0%) | 0 (0.0%) |
| 5 to 17 Years | 0 (0.0%) | 0 (0.0%) |
| 18 to 34 Years | 0 (0.0%) | 0 (0.0%) |
| 35 to 64 Years | 38 (15.6%) | 0 (0.0%) |
| 65 to 74 Years | 0 (0.0%) | 0 (0.0%) |
| 75 Years and over | 4 (9.5%) | 0 (0.0%) |
Disability Class: Vision Difficulty
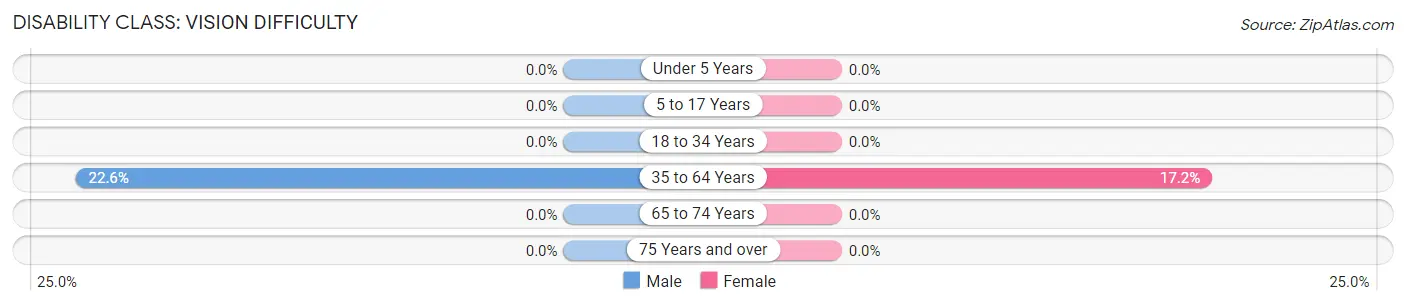
| Age Bracket | Male | Female |
| Under 5 Years | 0 (0.0%) | 0 (0.0%) |
| 5 to 17 Years | 0 (0.0%) | 0 (0.0%) |
| 18 to 34 Years | 0 (0.0%) | 0 (0.0%) |
| 35 to 64 Years | 55 (22.6%) | 39 (17.2%) |
| 65 to 74 Years | 0 (0.0%) | 0 (0.0%) |
| 75 Years and over | 0 (0.0%) | 0 (0.0%) |
Disability Class: Cognitive Difficulty
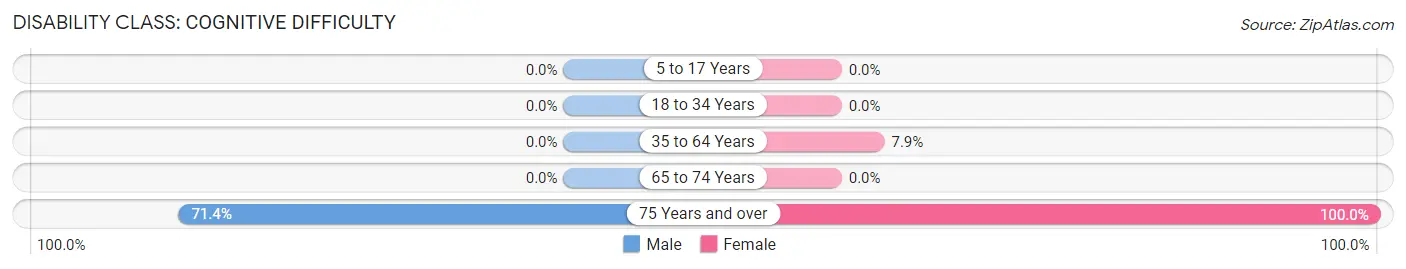
| Age Bracket | Male | Female |
| 5 to 17 Years | 0 (0.0%) | 0 (0.0%) |
| 18 to 34 Years | 0 (0.0%) | 0 (0.0%) |
| 35 to 64 Years | 0 (0.0%) | 18 (7.9%) |
| 65 to 74 Years | 0 (0.0%) | 0 (0.0%) |
| 75 Years and over | 30 (71.4%) | 24 (100.0%) |
Disability Class: Ambulatory Difficulty
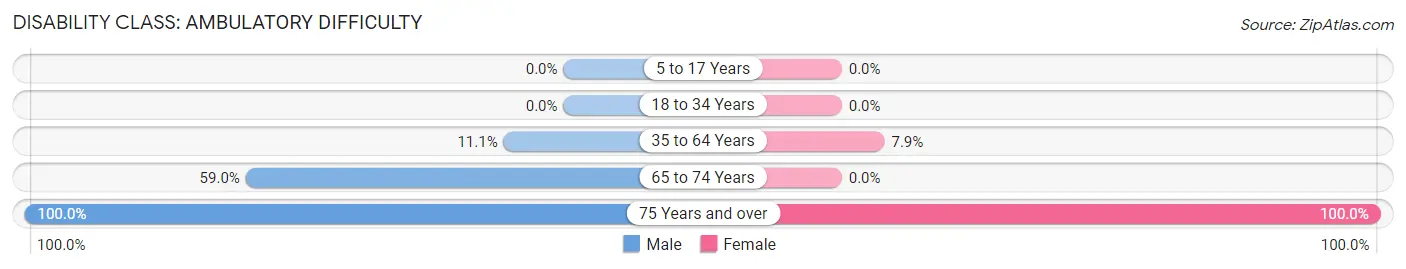
| Age Bracket | Male | Female |
| 5 to 17 Years | 0 (0.0%) | 0 (0.0%) |
| 18 to 34 Years | 0 (0.0%) | 0 (0.0%) |
| 35 to 64 Years | 27 (11.1%) | 18 (7.9%) |
| 65 to 74 Years | 46 (59.0%) | 0 (0.0%) |
| 75 Years and over | 42 (100.0%) | 24 (100.0%) |
Disability Class: Self-Care Difficulty
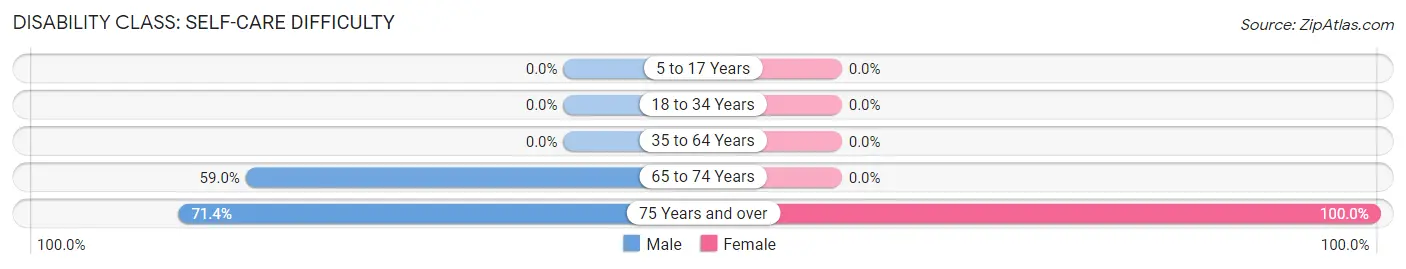
| Age Bracket | Male | Female |
| 5 to 17 Years | 0 (0.0%) | 0 (0.0%) |
| 18 to 34 Years | 0 (0.0%) | 0 (0.0%) |
| 35 to 64 Years | 0 (0.0%) | 0 (0.0%) |
| 65 to 74 Years | 46 (59.0%) | 0 (0.0%) |
| 75 Years and over | 30 (71.4%) | 24 (100.0%) |
Technology Access in Lake Bryan
Computing Device Access in Lake Bryan
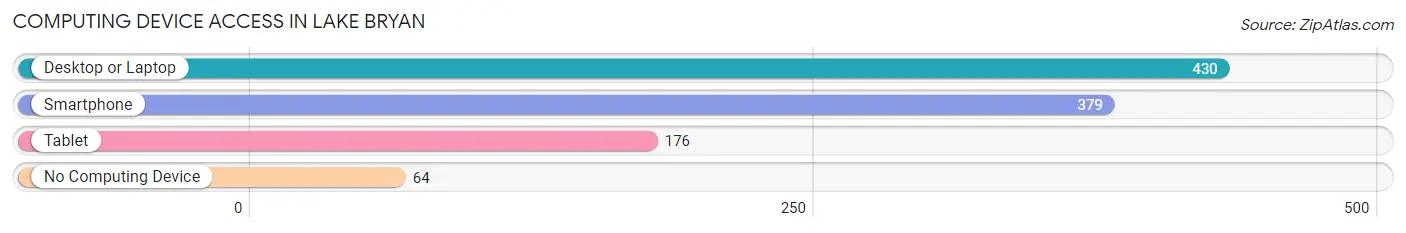
| Device Type | # Households | % Households |
| Desktop or Laptop | 430 | 86.4% |
| Smartphone | 379 | 76.1% |
| Tablet | 176 | 35.3% |
| No Computing Device | 64 | 12.9% |
| Total | 498 | 100.0% |
Internet Access in Lake Bryan
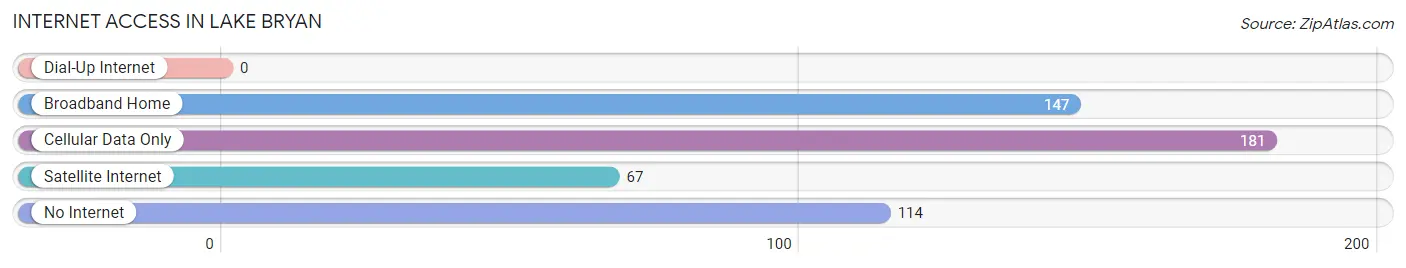
| Internet Type | # Households | % Households |
| Dial-Up Internet | 0 | 0.0% |
| Broadband Home | 147 | 29.5% |
| Cellular Data Only | 181 | 36.3% |
| Satellite Internet | 67 | 13.5% |
| No Internet | 114 | 22.9% |
| Total | 498 | 100.0% |
Lake Bryan Summary
Bryan is a city located in Brazos County, Texas, United States. It is the county seat of Brazos County and is located in the heart of the Brazos Valley. The population was 76,201 at the 2010 census. It is the 16th largest city in Texas and the 85th largest city in the United States.
History
Bryan was founded in 1821 by William Joel Bryan, a settler from Tennessee. The city was named after him and was incorporated in 1871. The city was originally a trading post and a stagecoach stop. In 1866, the Houston and Texas Central Railway arrived in Bryan, which helped to spur the city's growth.
Geography
Bryan is located in the Brazos Valley, which is located in Central Texas. The city is situated on the Brazos River, which is the longest river in Texas. The city is located about 100 miles northwest of Houston and about 90 miles northeast of Austin. The city has a total area of 33.2 square miles, of which 33.1 square miles is land and 0.1 square miles is water.
Economy
Bryan is a major economic center in the Brazos Valley. The city is home to several large employers, including Texas A&M University, Blinn College, Sanderson Farms, and the Bryan-College Station Medical Center. The city is also home to several manufacturing companies, including the Bryan-College Station Manufacturing Company, which produces a variety of products, including furniture, clothing, and electronics.
Demographics
As of the 2010 census, there were 76,201 people, 28,845 households, and 17,845 families residing in the city. The population density was 2,301.2 people per square mile. The racial makeup of the city was 73.2% White, 11.2% African American, 0.6% Native American, 5.2% Asian, 0.1% Pacific Islander, 7.2% from other races, and 2.7% from two or more races. Hispanic or Latino of any race were 19.2% of the population.
The median income for a household in the city was $41,945, and the median income for a family was $54,845. Males had a median income of $41,945 versus $30,845 for females. The per capita income for the city was $21,845. About 11.2% of families and 15.2% of the population were below the poverty line, including 20.2% of those under age 18 and 8.2% of those age 65 or over.
Conclusion
Bryan is a city located in Brazos County, Texas, United States. It is the county seat of Brazos County and is located in the heart of the Brazos Valley. The city has a rich history, and is a major economic center in the Brazos Valley. The population of Bryan was 76,201 at the 2010 census, and the city has a total area of 33.2 square miles. The city is home to several large employers, including Texas A&M University, Blinn College, Sanderson Farms, and the Bryan-College Station Medical Center. The racial makeup of the city was 73.2% White, 11.2% African American, 0.6% Native American, 5.2% Asian, 0.1% Pacific Islander, 7.2% from other races, and 2.7% from two or more races. The median income for a household in the city was $41,945, and the median income for a family was $54,845. Bryan is a vibrant city with a rich history and a bright future.
Common Questions
What is Per Capita Income in Lake Bryan?
Per Capita income in Lake Bryan is $23,314.
What is the Median Family Income in Lake Bryan?
Median Family Income in Lake Bryan is $72,453.
What is the Median Household income in Lake Bryan?
Median Household Income in Lake Bryan is $71,840.
What is Income or Wage Gap in Lake Bryan?
Income or Wage Gap in Lake Bryan is 10.3%.
Women in Lake Bryan earn 89.7 cents for every dollar earned by a man.
What is Inequality or Gini Index in Lake Bryan?
Inequality or Gini Index in Lake Bryan is 0.40.
What is the Total Population of Lake Bryan?
Total Population of Lake Bryan is 1,438.
What is the Total Male Population of Lake Bryan?
Total Male Population of Lake Bryan is 653.
What is the Total Female Population of Lake Bryan?
Total Female Population of Lake Bryan is 785.
What is the Ratio of Males per 100 Females in Lake Bryan?
There are 83.18 Males per 100 Females in Lake Bryan.
What is the Ratio of Females per 100 Males in Lake Bryan?
There are 120.21 Females per 100 Males in Lake Bryan.
What is the Median Population Age in Lake Bryan?
Median Population Age in Lake Bryan is 30.5 Years.
What is the Average Family Size in Lake Bryan
Average Family Size in Lake Bryan is 3.8 People.
What is the Average Household Size in Lake Bryan
Average Household Size in Lake Bryan is 2.9 People.
How Large is the Labor Force in Lake Bryan?
There are 660 People in the Labor Forcein in Lake Bryan.
What is the Percentage of People in the Labor Force in Lake Bryan?
68.5% of People are in the Labor Force in Lake Bryan.
What is the Unemployment Rate in Lake Bryan?
Unemployment Rate in Lake Bryan is 7.7%.